Report on Eyjafjallajokull (Iceland) — April 2011
Bulletin of the Global Volcanism Network, vol. 36, no. 4 (April 2011)
Managing Editor: Richard Wunderman.
Eyjafjallajokull (Iceland) Eruption ended in late June 2010; sample of growing literature on the eruption
Please cite this report as:
Global Volcanism Program, 2011. Report on Eyjafjallajokull (Iceland) (Wunderman, R., ed.). Bulletin of the Global Volcanism Network, 36:4. Smithsonian Institution. https://doi.org/10.5479/si.GVP.BGVN201104-372020
Eyjafjallajokull
Iceland
63.633°N, 19.633°W; summit elev. 1651 m
All times are local (unless otherwise noted)
Gudmundsson and others (2010a) noted that the last day of sustained activity at Eyjafjallajökull took place on 22 May 2010. By 23 June 2010, the Iceland Meteorological Office (IMO) and the University of Iceland Institute of Earth Sciences (IES) ceased issuing regular status reports. In addition to discussing the eruption and its final stages, this report also cites a small sample of abstracts and papers from the numerous conferences, sessions, and publications that have thus far emerged on the eruption.
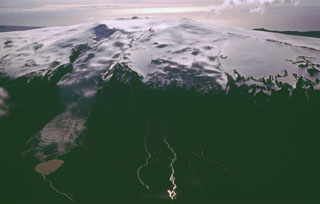
The eruption's initial phase, 20 March-12 April 2010, occurred at Fimmvörðuháls, a spot on the E flanks of Eyjafjallajökull (figure 16, and "F" and "E" on figure 17). Venting at Fimmvörðuháls took place on an exposed ridge cropping out in a region with extensive glaciers to the E and W. Eruptions began in the initially ice-capped summit crater of Eyjafjallajökull on 14 April 2010 (BGVN 35:03 and 35:04). After melting overlying portions of the icecap, the summit crater then emitted clouds of fine-grained ash that remained suspended in the atmosphere for long distances. The ash blew both over the Atlantic and for considerable intervals passed directly over Europe, halting flights of most commercial aircraft for nearly a week in a controversial shutdown with economic impacts in the billions.
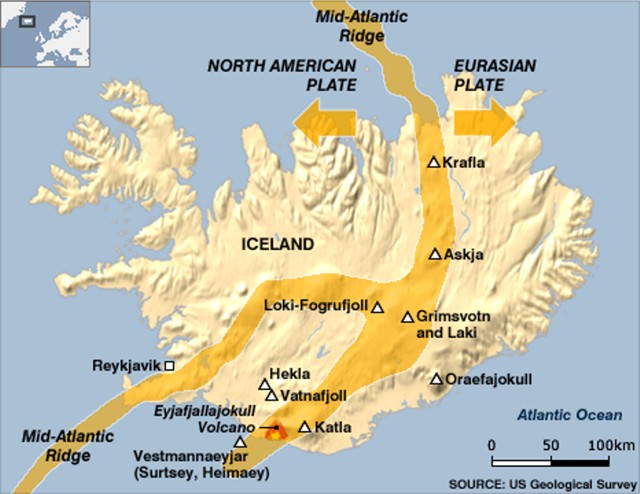 |
Figure 16. Index map showing Iceland, some major plate-tectonic features and generalized spreading directions, and the location of Eyjafjallajökull volcano. Note proximity of Eyjafjallajökull to Katla and to the volcanoes of the Vestmann island area (Vestmannaeyjar), Surtsey and Heimaey. Courtesy of USGS. |
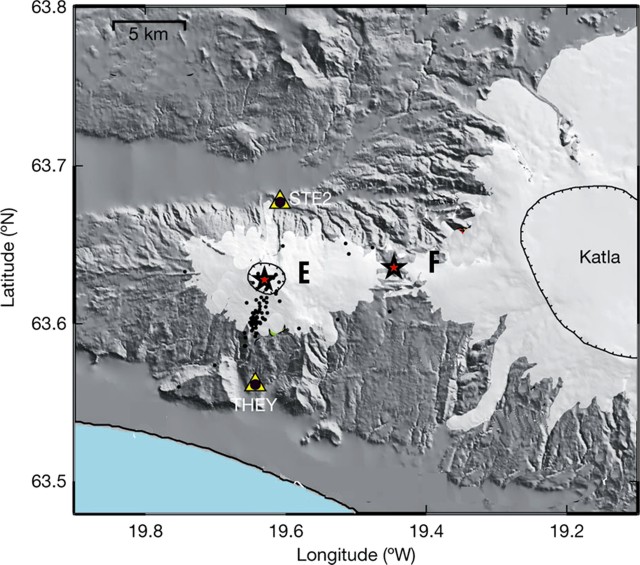 |
Figure 17. A shaded-relief map showing Eyjafjallajökull (E), and 9 km to its E, the flank vent Fimmvörðuháls (F). Stars indicate 2010 eruptive sites (map scale at top left). Glaciers cover extensive portions of both Eyjafjallajökull and Katla volcanoes (light pattern). During 14-29 April 2010 many earthquakes struck with epicenters along the N-S axis of Eyjafjallajökull (black dots). The map includes a small slice of the Atlantic ocean along the lower left-hand margin. Two of four geodetic (GPS) stations are shown (STE2 and THEY). Revised from a map by Sigmundsson and others (2010). |
In terms of satellite thermal data on the overall eruption, the MODVOLC system measured extensive (multi-pixel) daily alerts during 21 March-21 May 2010, but the alerts became absent thereafter.
Venting at Fimmvörðuháls. At a 15-19 September 2010 conference on the eruption, Höskuldsson and others (2010a) characterized the course of events during the 20 March to 12 April basaltic Fimmvörðuháls flank eruption at Eyjafjallajökull as follows: "At the beginning the eruption featured as many as 15 lava fountains with maximum height of 150 m. On March 24 only four vents were active with fountains reaching to heights of 100 m. On March 31 and April 1 the activity was characterized by relatively weak fountaining through a forcefully stirring pool of lava. The vents were surrounded by 60-80 m high ramparts and the level of lava stood at approximately 40 m. This high stand led to opening of a new fissure trending northwest from the central segment of the original fissure. As activity on the new fissure intensified, the discharge from the original fissure declined and stopped on April 7.
"The intensity of the lava fountains varied significantly on the time scale of hours and was strongly influenced the level of the lava pond in the vents, producing narrow, gas-charged, piston-like fountains during periods of low lava levels, but spray-like fountains when the lava level was high . . ..
"The eruption produced a fountain-fed lava flow field with an area of about 1.3 km2. Initially (20-25 March), the lava advanced towards northeast, but on March 26 the lava began advancing to the west and northwest, especially after April 1 when the activity became concentrated on the new fissure. The flow field morphology is dominantly 'a'a, but domains of pahoehoe and slabby pahoehoe are present, particularly in the western sector of the flow field. The advance of the lava from the vents was episodic; when the lava stood high the lava surged out of the vents, but at low stand there was a lull in the advance. The lava discharged from the vents through open channels as well as internal pathways. The open channels were the most visible part of the transport system, feeding lava to active 'a'a flow fronts and producing spectacular lava falls when cascading into deep gullies just north of the vents. The role of internal pathways was much less noticeable, yet an important contribution to the overall growth of the flow field as it fed significant surface breakouts emerging on the surface of what otherwise looked like stagnant lava. When activity stopped on April 12 the fissure had issued about 0.025 km3 of magma, giving a mean discharge of 13 m3/s."
Summit eruption. The second eruption occurred within the initially ice-covered caldera of Eyjafjallajökull. Opening of the ice cover and explosivity into the atmosphere was amplified by magma-ice interaction that produced a fine ash capable of suspension in the atmosphere for prolonged periods.
Höskuldsson and others (2010b) described the eruption at Eyjafjallajökull's summit (beginning 14 April 2010) as consisting of three phases (table 2). They also stated that at the summit the "Total amount of tephra produced in the eruption is about 0.11 km3 and that of lava 0.025 km3 DRE [dense-rock equivalent]. Average discharge rate in the eruption was about 40 m3/s DRE or about 4 times that of Fimmvörðuháls eruption."
Table 2. Three phases of the eruption at Eyjafjallajökull volcano's summit beginning 14 April 2010 as summarized and condensed by Höskuldsson and others (2010b).
| Dates | Phase | Description of Activity |
| 14 Apr-17 Apr 2010 | I | Plumes often under 6 km but up to ~9 km altitude. |
| 18 Apr-04 May 2010 | II | High tremor with lava flows; generally weak and ash-poor plumes. Pulsating activity with small discrete explosions every few seconds. Tephra grains had fluidal shapes suggesting magmatic fragmentation and decreased viscosity of erupting magma. Plumes on 28th to 7 km altitude. |
| 05 May-22 May 2010 | III | Plumes up to 5 km altitude. |
The summit area was still steaming and geothermally active, and the eruption channel was still very hot in October 2010 (figure 18). Investigators expected that cooling to ambient temperatures would take a few years . As noted below, during June 2010, hot lava could still be seen in cracks in the cooled rock on Fimmvörðuháls, and inside craters, but that was not the case at the ice-engulfed summit caldera.
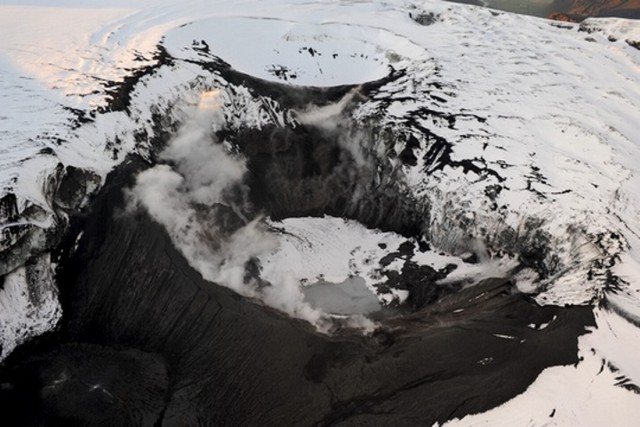 |
Figure 18. The summit crater complex of Eyjafjallajökull taken after the first winter snow, as seen from the air at 0810 on 9 October 2010. The scene helps explain the high degree of water and ice interaction with the erupting lavas. Snow had melted from numerous ash and lava-covered surfaces (black areas). Although portions of the crater emitted steam, evidence of substantial ongoing lava emissions were absent at this point in time. Photo courtesy of Ólafur Sigurjónsson, IMO. |
According to Gudmundsson and others (2010b) the summit eruption produced 0.1-0.2 km3 (dense rock equivalent) of tephra. IES reported that by 11 June 2010 a lake about 300 m in diameter had formed in the large summit crater, and by 23 June water was slowly accumulating in the crater because ice was no longer in contact with hot material.
Intrusion triggering. Sigmundsson and others (2010) noted that the 2010 eruptions came after 18 years of intermittent volcanic unrest. The deformation associated with the eruptions was unusual because it did not relate to pressure changes within a single source. Deformation was rapid before the flank eruption (0.5 mm per day after 4 March 2010), but negligible during it.
During the summit eruption (beginning 14 April 2010) gradual contraction of a source, distinct from the pre-eruptive inflation sources, was evident from geodetic data. Thus, clear signals of volcanic unrest may occur over years to weeks, indicating reawakening of such volcanoes, whereas immediate short-term eruption precursors may be subtle and difficult to detect.
Figure 19 shows a cross-sectional model of the shallow crust by Sigmundsson and others (2010) based deformation and seismic analyses of the 2010 event. A previous issue of the Bulletin (BGVN 35:03) contained an alternate model by Paul Einarsson.
 |
Figure 19. Schematic E-W cross-section across the Eyjafjallajökull summit area, with deformation sources plotted at their best-fit depth (vertical exaggeration of 2). Gray shaded background indicates source-depth uncertainties (95% confidence interval), which overlap. Courtesy of Sigmundsson and others (2010). |
Processed satellite image. Vincent J. Realmuto created two composite figures generated from the MODIS-Terra satellite data acquired 15 April 2010 at 1135 UTC (figure 20). Outlined in black in each image are Iceland on the upper left side (W), Faroe Islands in the center, Scotland and N Ireland in the lower center, and part of the Scandinavian peninsula on the right side (E). An ash plume can be seen in each image extending from Iceland SW toward Europe. The left-hand image is the true-color RGB (red-green-blue) composite and the right-hand image is a false-color composite; in the right-hand rendition the ash plume appears red and the ice-rich clouds appear blue. The right-hand image puts obvious emphasis on the ash plume and shows it streaming and more or less intact for several hundreds of kilometers E of Iceland.
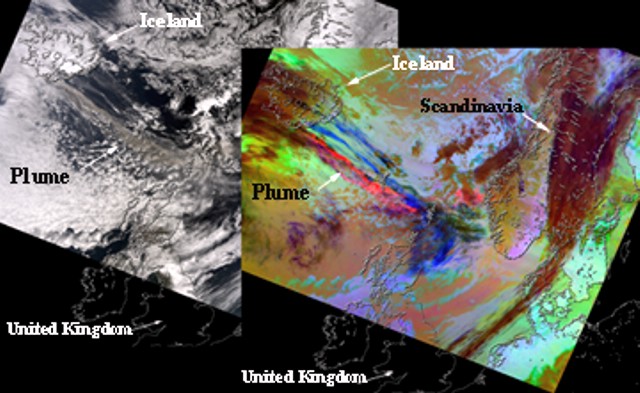 |
Figure 20. Graphics generated from the MODIS-Terra satellite data acquired 15 April 2010 at 1135 UTC. The left-hand graphic is a true-color RGB (red-green-blue) composite, and the right-hand image is a false-color composite of Bands 32, 31, and 29 (12, 11, and 8.5 um, respectively) displayed in red, green, and blue, respectively. These data were processed with the decorrelation stretch (D-stretch), a technique for enhancing spectral contrast based on principal components analysis. In this rendition the ash plume appears red and the ice-rich clouds appear blue. The D-stretch was based on scene statistics and was intended to be a quick method for discriminating material that may be volcanic in origin. Courtesy of Vincent J. Realmuto, Jet Propulsion Laboratory, California Institute of Technology. |
Conference field trip. Following The Atlantic Conference on Eyjafjallajökull and Aviation in Iceland, 15-16 September 2010 (discussed below), a field trip brought scientists to accessible areas on the volcano, including the flank vent on Fimmvörðuháls ridge where the eruption began. John and Liudmila Eichelberger provided some photographs from this trip (figure 21). The same base map appeared in BGVN 35:03, with the key and other data. The horseshoe shape of the lava distribution in this figure is the feature imaged by an ASTER satellite thermal signature as active lava flows on 19 April 2010 in BGVN 35:03.
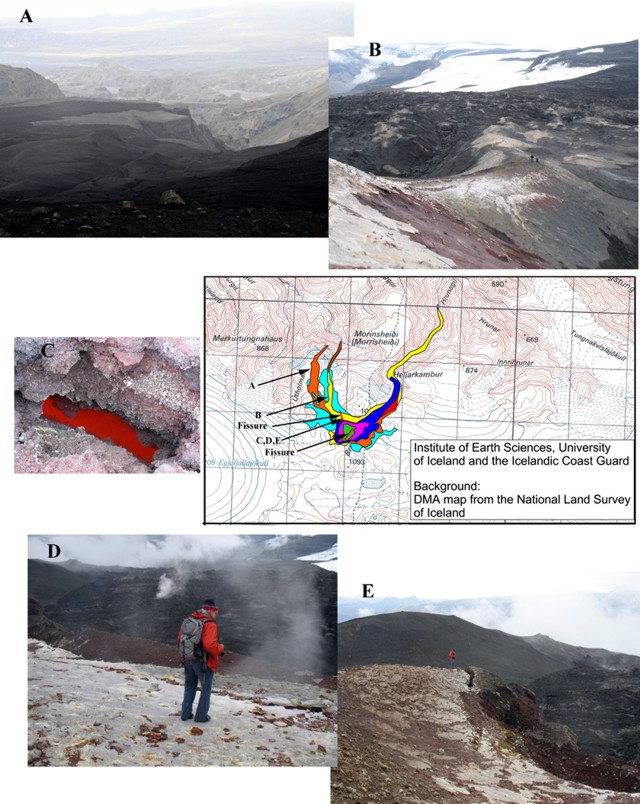 |
Figure 21. (Central panel) Map showing fissures at Fimmvörðuháls (thin red lines) and the distribution of new scoria and lava deposited at various points in time (shaded areas) during 21 March-7 April 2010. Marked arrows on the map give locations of labeled photos (A-E) taken 18 September 2010. (A) Fresh lava (darker) seen looking N. In the distance appear fresh black lava flows, some portions of which formed the lava falls down the valley walls. (B) View showing the elongate ridge as seen from the upslope perspective (people in the distance for scale). (C, looking down) Glowing lava (~1.5 m long and ~0.3 m wide) at the bottom of a fissure. This photo was taken with a flash, otherwise the fissure walls would have been very dark. (D) The fracture indicated on the map as it appeared near the rim of the ridge of newly erupted lava. (E) The same fracture seen in D from another perspective. Courtesy of John and Ludmilla Eichelberger. |
More on conferences and publications. Recently, several conferences have been held and many publications have been issued relevant to the eruption. What follows is a mere sample of the available resources, many of which emphasized plume research. At the American Geophysical Union (AGU) 2010 Fall Meeting, several sessions focused on the 2010 eruption (eg., Carn and others, 2010; see References for the link to abstracts volume).
The Workshop on Ash Dispersal Forecast and Civil Aviation held in Geneva, 18-20 October 2010, addressed the characteristics and range of application of different volcanic ash transport and dispersal models (VATDM), identifying the needs of the modeling community, investigating new data acquisition strategies, and discussing how to improve communication between the volcanology community and operational agencies (eg., Bonadonna and others, 2011).
The Cities on Volcanoes conference (COV-6; Tenerife, Canary Islands, Spain, 31 May-4 June 2010) included both papers (eg. Fischer and others, 2010) and a forum on the "Assessment of volcanic ash threat: learning and considerations from the Eyjafjallajökull eruption."
In addition, several other papers relevant to the eruption were presented during this meeting, as well as at the Annual Meeting of the American Meteorological Society (AMS) in Seattle, WA, in January 2011, and at the European Geosciences Union (EGU) 2011 General Assembly in Vienna, Austria.
The journal Atmospheric Chemisrty and Physics published multiple issues with a section entitled "Atmospheric implications of the volcanic eruptions of Eyjafjallajökull, Iceland 2010." These and other papers discussed various means of plume detection, and in some cases, sampling, including on the ground, in ultralight aircraft, and on satellites; models of plume dispersion were evaluated (Flentje and others, 2010; Emeis and others, 2011; Vogel and others, 2011; Fischer and others, 2010).
According to Loughlin (2010), scientists from the British Geological Survey found large ash particles from the eruption in the United Kingdom. Most of the very small ash particles in volcanic plumes fell as clusters of particles known as aggregates. The aggregation could have resulted from a number of mechanisms, including electrostatic attraction, particle collisions, condensation of liquid films and secondary mineralization. The process of aggregation effectively removed very small particles from the plume and was therefore one variable on how long ash particles stay in the atmosphere. Ripley (2010) and Chivers (2010) published articles on the U.K. Met Office's tracking and prediction of movements of volcanic ash based on observations from the Eyjafjallajökull eruption.
Gislason and others (2011) reported on analyses of two sets of fresh, comparatively dry ash samples that fell in Iceland and were collected rapidly on 15 and 27 April, during more and less explosive phases, respectively. Both sets of samples were kept dry and analyzed swiftly to minimize issues with hydration and alteration, particularly to salts on the ash surfaces. The ash was dominantly glass of andesitic composition (57-58% SiO2). They found the ash particles especially sharp and abrasive over their entire size range, from submillimeter to tens of nanometers.
References. Bonadonna, C., Folch, A., and Loughlin, S., 2011, Future Developments in Modeling and Monitoring of Volcanic Ash Clouds, Eos, Transactions of the American Geophysical Union (AGU), v. 92, no. 10; pp. 85-86, DOI: 10.1029/2011EO100008 (URL: http://www.agu.org/pub/eos/).
Carn, S.A., Karlsdottir, S., and Prata, F., 2010, The 2010 Eruption of Eyjafjallajokull: A Landmark Event for Volcanic Cloud Hazards I, II, and III, Abstracts V41E, V53F, and V54C presented at 2010 Fall Meeting, American Geophysical Union, San Francisco, CA, 13-17 December 2010 (URL: http://www.agu.org/meetings/fm10/program/index.php).
Chivers, H., 2010, Dark Cloud: VAAC and predicting the movement of volcanic ash, Meterological Technology International, June 2010, pp. 62-65.
Emeis, S., Forkel, R., Junkermann, W., Schäfer, K., Flentje, H., Gilge, S., Fricke, W., Wiegner, M., Freudenthaler, V., Groß, S., Ries, L., Meinhardt, F., Birmili, W., Münkel, C., Obleitner, F., and Suppan, P., 2011, Measurement and simulation of the 16/17 April 2010 Eyjafjallajökull volcanic ash layer dispersion in the northern Alpine region, Atmospheric Chemistry and Physics, v. 11, pp. 2689-2701.
Fischer, C., van Haren, G., Pohl, T., Vogel, A., and Weber, K., 2010, Airborne in-situ measurements of the volcanic ash dust plume over a part of Germany caused by the volcano eruption of the Eyjafjallajökull (Iceland) by means of an optical particle counter and a light
sport aircraft, Abstract, Session 1.3, p. 229, Cities on Volcanoes 6 Conference (URL: http://www.citiesonvolcanoes6.com/ver.php).
Flentje, H., Claude, H., Elste, T., Gilge, S., Köhler, U., Plass-Dülmer, C., Steinbrecht, W., Thomas, W., Werner, A., and Fricke W., 2010, The Eyjafjallajökull eruption in April 2010 - detection of volcanic plume using in-situ measurements, ozone sondes and lidar-ceilometer profiles, Atmospheric Chemistry and Physics, v. 10, pp. 10085-10092, DOI: 10.5194.
Gasteiger, J., Groß, S., Freudenthaler, V., and Wiegner, M., 2011, Volcanic ash from Iceland over Munich: mass concentration retrieved from ground-based remote sensing measurements, Atmospheric Chemistry and Physics, v. 11, pp. 2209-2223.
Gislason, S.R., Hassenkam, T., Nedel, S., Bovet, N., Eiriksdottir, E.S., Alfredsson, H.A., Hem, C.P., Balogh, Z.I., Dideriksen, K., Oskarsson, N., Sigfusson, B., Larsen, G., and Stipp, S.L.S., 2011, Characterization of Eyjafjallajökull volcanic ash particles and a protocol for rapid risk assessment, Proceedings of the National Academy of Sciences, v. 108, no. 18, p. 7303-7312.
Gudmundsson, M. T., Pedersen, R., Vogfjörd, K., Thorbjarnardóttir, B., Jakobsdóttir, S., and Roberts, M.J., 2010a, Eruptions of Eyjafjallajökull Volcano, Iceland, Eos, Transactions of the American Geophysical Union (AGU), v. 91, no. 21, p. 190, DOI: 10.1029/2010EO210002.
Gudmundsson, M.T., Thordarson, T., Hoskuldsson, A., Larsen, G., Jónsdóttir, I., Oddsson, B., Magnusson, E., Hognadottir, T., Sverrisdottir, G., Oskarsson, N., Thorsteinsson, T., Vogfjord, K., Bjornsson, H., Pedersen, G.N., Jakobsdottir, S., Hjaltadottir, S., Roberts, M.J., Gudmundsson, G.B., Zophoniasson, S., and Hoskuldsson, F., 2010b, The Eyjafjallajökull eruption in April-May 2010; course of events, ash generation and ash dispersal, EOS, Transactions of the American Geophysical Union (AGU), V. 91, no. 21, Abstract V53F-01, 2010 Fall Meeting, AGU, San Francisco, Calif., 13-17 December (URL: http://www.agu.org/cgi-bin).
Heue, K.-P., Brenninkmeijer,C.A.M., Baker, A. K., Rauthe-Schöch, A., Walter, D., Wagner, T., Hörmann, C., Sihler, H., Dix, B., Frieß, U., Platt, U., Martinsson, B. G., van Velthoven, P.F.J., Zahn, A., and Ebinghaus, R., 2011, SO2 and BrO observation in the plume of the Eyjafjallajökull volcano 2010: CARIBIC and GOME-2 retrievals, Atmospheric Chemistry and Physics, v. 11, pp. 2973-2989.
Höskuldsson, A., Magnusson, E., Guðmundsson, M.T., Sigmundsson, F., and Sigmarsson, O., 2010a, The 20 March to 12 April basaltic Fimmvörðuháls flank eruption at Eyjafjallajökull volcano, Iceland: Course of events, abstract of presentation in Program of the Eyjafjallajökull and Aviation Conference (15-16 September 2010) and associated Eyjafjallajökull Eruption Workshop (Hotel Hvolsvellir, 17-19 September 2010); (URL: http://en.keilir.net/keilir/conferences/eyjafjallajokull/volcanological-workshop).
Höskuldsson, Á., Larsen, G., Gudmundsson, M.T., Oddsson, B., Magnússon, E., Sigmarsson, O., Óskarsson, N., Jónsdóttir, I., Sigmundsson, F., Einarsson, P., Hreinsdóttir, S., Pedersen, R., Högnadóttir, Þ., Thordarson, T., Hayward, C., Hartley, M., Meara, R., Arason, Þ., Karlsdóttir, S., and Petersen, G.N., 2010b, The Eyjafjallajökull eruption April to May 2010: Magma fragmentation, plume and tephra transport, and course of events, abstract of presentation in Program of the Eyjafjallajökull and Aviation Conference (15-16 September 2010) and associated Eyjafjallajökull Eruption Workshop (17-19 September 2010); (URL: http://en.keilir.net/keilir/conferences/eyjafjallajokull/volcanological-workshop).
Laursen, L., 2010, Iceland eruptions fuel interest in volcanic gas monitoring, Science, v. 328, no. 5977, p. 410-411.
Loughlin, S., 2010, Modelling of Iceland volcanic ash particles, news item from British Geological Survey (URL: http://www.bgs.ac.uk/research/highlights/IcelandAshParticles.html?src=sfb).
Ripley, T., 2010, Cloud Busting: How the UK is tracking the volcanic ash cloud, Meterological Technology International, June 2010, pp. 6-10.
Schumann, U., Weinzierl, B., Reitebuch, O., Schlager, H., Minikin, A., Forster, C., Baumann, R., Sailer, T., Graf, K., Mannstein, H., Voigt, C., Rahm, S., Simmet, R., Scheibe, M., Lichtenstern, M., Stock, P., Rüba, H., Schäuble, D., Tafferner, A., Rautenhaus, M., Gerz, T., Ziereis, H., Krautstrunk, M., Mallaun, C., Gayet, J.-F., Lieke, K., Kandler, K., Ebert, M., Weinbruch, S., Stohl, A., Gasteiger, J., Groß, S., Freudenthaler, V., Wiegner, M., Ansmann, A., Tesche, M., Olafsson, H., and Sturm, K., 2011, Airborne observations of the Eyjafjalla volcano ash cloud over Europe during air space closure in April and May 2010, Atmospheric Chemistry and Physics, v. 11, pp. 2245-2279.
Sigmundsson, F., Hreinsdóttir, S., Hooper, A., Árnadóttir, T., Pedersen, R., Roberts, M.J., Óskarsson, N., Auriac, A., Decriem, J., Einarsson, P., Geirsson, H., Hensch, M., Ófeigsson, B.G., Sturkell, E., Sveinbjörnsson, H., and Feigl, K.L., 2010, Letter: Intrusion triggering of the 2010 Eyjafjallajökull explosive eruption, Nature, v. 468, pp. 426-430.
Stohl, A., Prata, A.J., Eckhardt, S., Clarisse, L., Durant, A., Henne, S., Kristiansen, N.I., Minikin, A., Schumann, U., Seibert, P., Stebel, K., Thomas, H.E., Thorsteinsson, T., Tørseth, K., and Weinzierl, B., 2011, Determination of time- and height-resolved volcanic ash emissions and their use for quantitative ash dispersion modeling: the 2010 Eyjafjallajökull eruption, Atmospheric Chemistry and Physics, v. 11, pp. 4333-4351.
Vogel, A., Weber, K., Fischer, C., van Haren, G., Pohl, T., Grobety, B., and Meier, M., 2011, Airborne in-situ measurements of the Eyjafjallojökull ash plume with a small aircraft and optical particle spectrometers over north-western Germany - comparison between the aircraft measurements and the VAAC-model calculations, European Geophysical Union General Assembly, Geophysical Research Abstracts, v. 13, p. EGU2011-13253.
Geological Summary. Eyjafjallajökull (also known as Eyjafjöll) is located west of Katla volcano. It consists of an elongated ice-covered stratovolcano with a 2.5-km-wide summit caldera. Fissure-fed lava flows occur on both the E and W flanks, but are more prominent on the western side. Although the volcano has erupted during historical time, it has been less active than other volcanoes of Iceland's eastern volcanic zone, and relatively few Holocene lava flows are known. An intrusion beneath the S flank from July-December 1999 was accompanied by increased seismic activity. The last historical activity prior to an eruption in 2010 produced intermediate-to-silicic tephra from the central caldera during December 1821 to January 1823.
Information Contacts: Institute of Earth Sciences (IES), University of Iceland, Sturlugata 7, Askja , 101 Reykjavík (URL: http://www.earthice.hi.is/); Icelandic Meteorological Office (IMO) (URL: http://en.vedur.is/earthquakes-and-volcanism/articles/nr/1884); U.K. Meteorological Office (URL: http://www.metoffice.gov.uk); ármann Höskuldsson, Institute of Earth Sciences (IES), University of Iceland, Sturlugata 7, Askja , 101 Reykjavík (URL: http://www.earthice.hi.is); Hawai'i Institute of Geophysics and Planetology (HIGP) MODVOLC Thermal Alerts System, School of Ocean and Earth Science and Technology (SOEST), Univ. of Hawai'i, 2525 Correa Road, Honolulu, HI 96822, USA (URL: http://modis.higp.hawaii.edu/); Sue C. Loughlin, The British Geological Survey, Murchison House, West Mains Road, Edinburgh EH9 3LA, Scotland, UK (URL: http://www.bgs.ac.uk/); Vincent J. Realmuto, Jet Propulsion Laboratory, California Institute of Technology, M/S 183-501, 4800 Oak Grove Drive, Pasadena, CA 91109 USA; John Eichelberger, U.S. Geological Survey, Volcano Hazards Program, Reston, VA (URL: http://volcanoes.usgs.gov/); Ludmilla Eichelberger, Global Volcanism Program, National Museum of Natural History, 10th and Constitution Ave., NW, Washington, DC 20560 USA; Iceland Review (URL: http://icelandreview.com/icelandreview/daily_news/).