Report on Axial Seamount (Undersea Features) — July 2011
Bulletin of the Global Volcanism Network, vol. 36, no. 7 (July 2011)
Managing Editor: Richard Wunderman.
Axial Seamount (Undersea Features) April 2011 eruption follows deformation-based forecast issued in 2006
Please cite this report as:
Global Volcanism Program, 2011. Report on Axial Seamount (Undersea Features) (Wunderman, R., ed.). Bulletin of the Global Volcanism Network, 36:7. Smithsonian Institution. https://doi.org/10.5479/si.GVP.BGVN201107-331021
Axial Seamount
Undersea Features
45.95°N, 130°W; summit elev. -1410 m
All times are local (unless otherwise noted)
According to a press release from Oregon State University on 9 August 2011, a team of scientists recently discovered a recent eruption of Axial Seamount, an undersea volcano located about 400 km off the Oregon coast (figure 7). Both fresh lava that disturbed and covered in-situ instruments and a small earthquake swarm detected by ocean-bottom hydrophones and land-based seismometers helped fix the eruption date at around 6 April 2011. The scientists had forecast this eruption about 5 years ago-touted as the first successful forecast of an undersea volcano erupting.
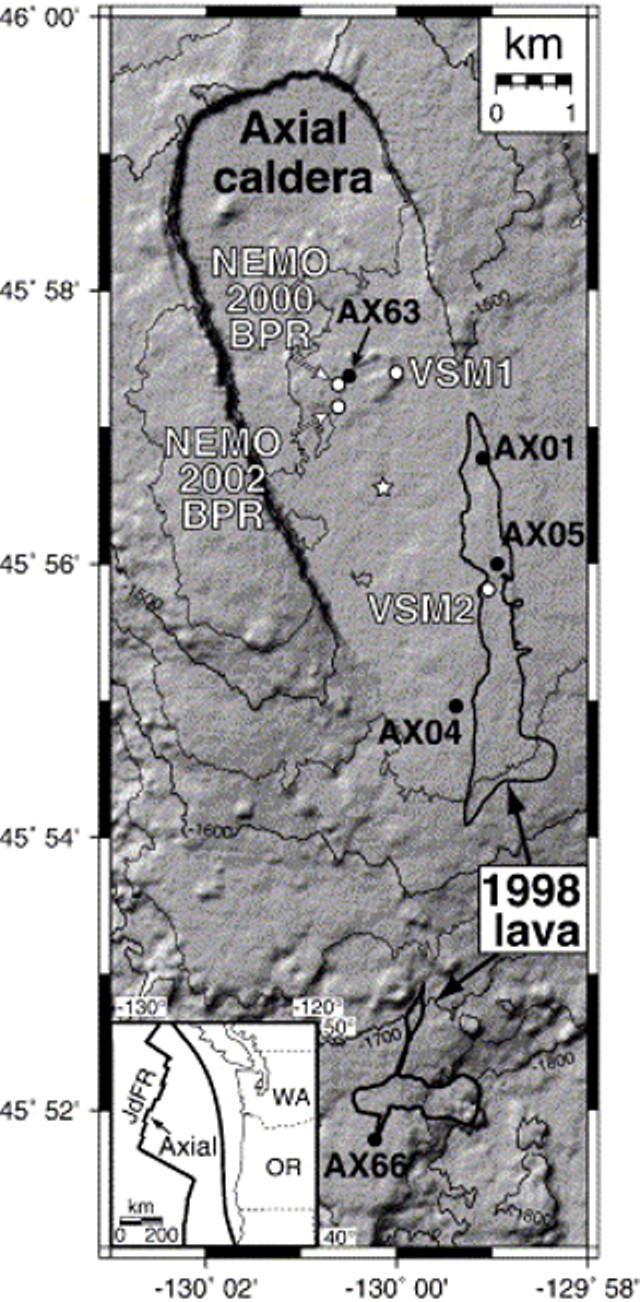 |
Figure 7. Map of Axial submarine caldera showing the 1998 lava flows (black outline), which omits the exact area of the April 2011 lava (which is not yet released publically). Dots indicate locations of bottom pressure recorders (BPR; white dots) and seafloor benchmarks for mobile pressure recorders (MPR; black dots), which were collected via a remotely operated vehicle. Inset shows location of Axial Seamount in relation to the Juan de Fuca Ridge off the Washington-Oregon coast. As discussed briefly in text, the white star indicates the location of the best fit (Mogi, 1958) inflation source for MPR measurements between 2000 and 2004 (Chadwick and others, 1999). From Chadwick and others, 2006. |
The Mogi (1958) model predicts deformation due to a small spherical zone of expansion at depth, thus modeling magma intrusion. For ease of computation, the zone is assumed to be embedded in a homogeneous, isotropic, elastic half-space. The modeling technique is widely used to reconcile surface deformation at active volcanoes with plausible intrusions at depth. In this case it modeled the deformation of the ocean floor (figure 7, see caption).
Bill Chadwick (National Oceanic and Atmospheric Administration (NOAA) and Oregon State University (OSU)), and Scott Nooner (Lamont-Doherty Earth Observatory (LDEO)) have been monitoring Axial Seamount for more than a decade. In Chadwick and others (2006) they forecast that Axial would erupt before the year 2014. Their forecast was based on a series of seafloor pressure measurements that indicated the volcano was inflating.
Axial last erupted in 1998 (BGVN 23:01 and 23:02) and Chadwick, Nooner, and colleagues have monitored it ever since. They used precise bottom pressure sensors to measure vertical movements of the floor of the caldera. They discovered that the volcano was gradually inflating at the rate of 15 cm/yr, indicating that magma was rising and accumulating under the volcano summit.When Axial erupted in 1998, the floor of the caldera suddenly subsided or deflated 3.2 m as magma was removed from underground to erupt at the surface. The scientists estimated that the volcano would be ready to erupt again when re-inflation pushed the caldera floor back up to its 1998 level.
As noted in Chadwick and others (2006), "If inflation continues at the current rate of 19 cm/yr at the caldera center, it will take another 9 years (16 years total) for the caldera to fully re-inflate to its January 1998 level (or in about 2014). If one assumes that Axial (seamount) would then be poised to erupt again, such a recurrence interval (~ 16 years), although admittedly speculative, would not be unreasonable since it is also the time necessary to accumulate ~ 1 m of extensional strain (the mean thickness of dikes seen in ophiolites (Kidd, 1977) and tectonic windows (Karson, 2002)) at the Juan de Fuca Ridge's spreading rate of 6 cm/yr (Riddihough, 1984)."
Nooner was reported to state that "We now have evidence, however, that Axial Seamount behaves in a more predictable way than many other volcanoes-likely due to its robust magma supply coupled with its thin crust, and its location on a mid-ocean ridge spreading center. It is now the only volcano on the seafloor whose surface deformation has been continuously monitored throughout an entire eruption cycle."
The discovery of the new eruption came on 28 July 2011 when Chadwick and Nooner, along with University of Washington colleagues Dave Butterfield and Marvin Lilley, led an expedition to Axial aboard the RV Atlantis (operated by the Woods Hole Oceanographic Institution). Using Jason, a remotely operated robotic vehicle (ROV), they discovered a new lava flow on the seafloor that was not present a year ago (figure 8).
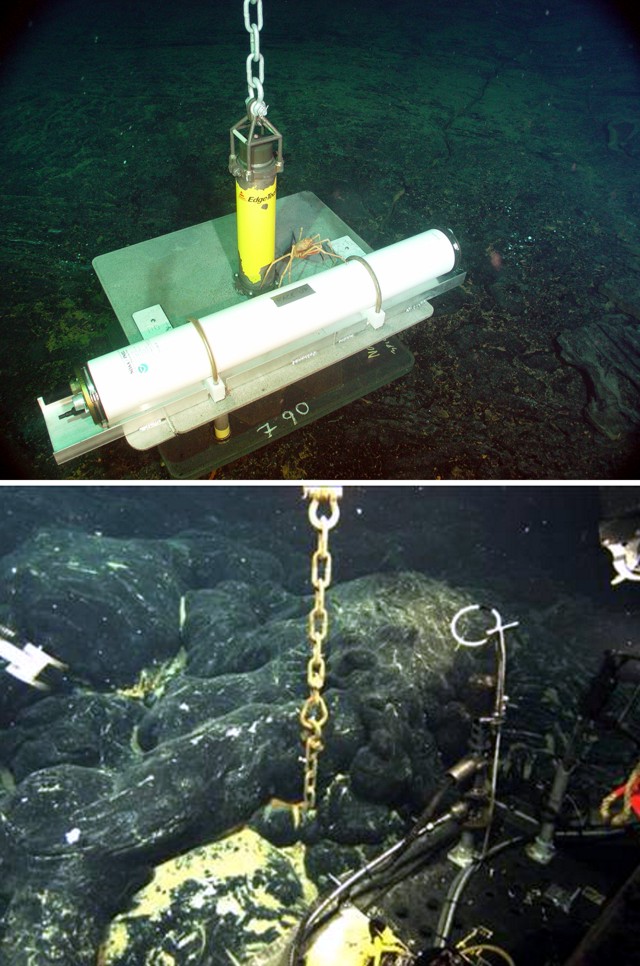 |
Figure 8. (top) A spider crab inspects an ocean-bottom hydrophone mooring at Axial seamount before its 2011 eruption. The hydrophone, in the white pressure case, is designed to detect undersea earthquakes. The chain extending above the pedestal for the hydrophone appears in the photo below. Photo taken 31 August 2003, courtesy of Bill Chadwick and Bob Dziak, Oregon State University (9 August 2011). (bottom) On 28 July 2011, the chain is all that is visible of this ocean-bottom hydrophone buried in about 1.8 m of new lava from an April 2011 eruption of Axial Seamount. Photo courtesy of Bill Chadwick and Bob Dziak, Oregon State University (9 August 2011). |
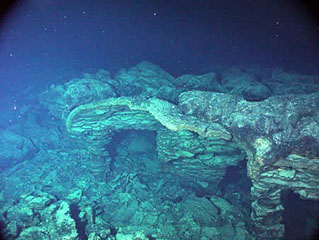
Chadwick commented that "When we first arrived on the seafloor, we thought we were in the wrong place because it looked so completely different. We couldn't find our markers or monitoring instruments or other distinctive features on the bottom. When eruptions like this occur, a huge amount of heat comes out of the seafloor, the chemistry of seafloor hot springs is changed, and pre-existing vent biological communities are destroyed and new ones form. Some species are only found right after eruptions, so it is a unique opportunity to study them."
The first Jason ROV dive of the July 2011 expedition targeted a field of black smokers (dark, mineral laden hot springs) on the caldera's W side, an area beyond the reach of the new lava flows. Butterfield had been tracking the chemistry and microbiology of hot springs around the caldera since the 1998 eruption.
He noted that "The hot springs on the W side did not appear to be significantly disturbed, but the seawater within the caldera was much murkier than usual, and that meant something unusual was happening. When we saw the 'Snowblower' vents blasting out huge volumes of white floc and cloudy water on the next ROV dive, it was clear that the after-effects of the eruption were still going strong. This increased output seems to be associated with cooling of the lava flows and may last for a few months or up to a year."
The crew recovered seafloor instruments, including two bottom-pressure recorders and two ocean-bottom hydrophones, which showed that the eruption took place on 6 April 2011.
A third hydrophone was found buried in the new lava flows. According to Chadwick, "So far, it is hard to tell the full scope of the eruption because we discovered it near the end of the expedition. But it looks like it might be at least three times bigger than the 1998 eruption." The lava flow from the 6 April 2011 eruption was at least 2 km wide, the scientists noted.
The bottom-anchored instruments documented hundreds of tiny earthquakes during the volcanic eruption, but land-based seismic monitors and the Sound Surveillance System (SOSUS) hydrophone array operated by the U.S. Navy only detected a handful of them on the day of the eruption because many components of the hydrophone system were offline.
"Because the earthquakes detected back in April at a distance from the volcano were so few and relatively small, we did not believe there was an eruption," said Bob Dziak, an OSU marine geologist who monitors the SOSUS array. "That is why discovering the eruption at sea last week was such a surprise."
This latest Axial eruption caused the caldera floor to subside by more than 2 m. The scientists will be measuring the rate of magma inflation over the next few years to see if they can successfully forecast the next event.
References. Chadwick, W.W., Jr., Embley, R.W., Milburn, H.B., Meinig, C., and Stapp, M., 1999, Evidence for deformation associated with the 1998 eruption of Axial Volcano, Juan de Fuca Ridge, from acoustic extensometer measurements, Geophysical Research Letters, v. 26, no. 23, pp. 3441-3444 (doi:10.1029/1999GL900498).
Chadwick, W.W., Jr., Nooner, S.L., Zumberge, M.A., Embley, R.W., and Fox, C.G., 2006, Vertical deformation monitoring at Axial Seamount since its 1998 eruption using deep-sea pressure sensors, Journal of Volcanology and Geothermal Research, v. 150, issue 1-3, p. 313-327 (doi:10.1016/j.jvolgeores.2005.07.006).
Karson, J.A., 2002, Geologic structure of the uppermost oceanic crust created at fast- to intermediate-rate spreading centers, Annual Review of Earth and Planetary Science, v. 30, p. 347-384.
Kidd, R.G.W., 1977, A model for the process of formation of the upper oceanic crust, Geophysical Journal of the Royal Astronomical Society, v. 50, issue 1, p. 149-183.
Mogi, K., 1958, Relations between the eruptions of various volcanoes and the deformation of the ground surfaces around them. Bulletin of the Earthquake Research Institute, University of Tokyo, v. 36, p. 99-134.
Riddihough, R., 1984, Recent movements of the Juan de Fuca plate system, Journal of Geophysical Research, v. 89, p. 6980-6994.
Geological Summary. Axial Seamount rises 700 m above the mean level of the central Juan de Fuca Ridge crest about 480 km W of Cannon Beach, Oregon, to within about 1,400 m of the ocean surface. It is the most magmatically and seismically active site on the Juan de Fuca Ridge between the Blanco Fracture Zone and the Cobb offset. The summit is marked by an unusual rectangular-shaped caldera (3 x 8 km) that lies between two rift zones and is estimated to have formed about 31,000 years ago. The caldera is breached to the SE and is defined on three sides by boundary faults of up to 150 m relief. Hydrothermal vents with biological communities are located near the caldera fault and along the rift zones. Hydrothermal venting was discovered north of the caldera in 1983. Detailed mapping and sampling efforts have identified more than 50 lava flows emplaced since about 410 CE (Clague et al., 2013). Eruptions producing fissure-fed lava flows that buried previously installed seafloor instrumentation were detected seismically and geodetically in 1998 and 2011, and confirmed shortly after each eruption during submersible dives.
Information Contacts: Oregon State University, News and Research Communications, Corvalis, OR (URL: http://oregonstate.edu/ua/ncs/); Bill Chadwick and Bob Dziak, National Oceanic and Atmospheric Administration (NOAA) and Oregon State University (OSU); Scott Nooner.