Report on Aira (Japan) — October 2011
Bulletin of the Global Volcanism Network, vol. 36, no. 10 (October 2011)
Managing Editor: Richard Wunderman.
Edited by Julie A. Herrick.
Aira (Japan) During 2011, pyroclastic flows, frequent ash plumes, and lava emission
Please cite this report as:
Global Volcanism Program, 2011. Report on Aira (Japan) (Herrick, J.A., and Wunderman, R., eds.). Bulletin of the Global Volcanism Network, 36:10. Smithsonian Institution. https://doi.org/10.5479/si.GVP.BGVN201110-282080
Aira
Japan
31.5772°N, 130.6589°E; summit elev. 1117 m
All times are local (unless otherwise noted)
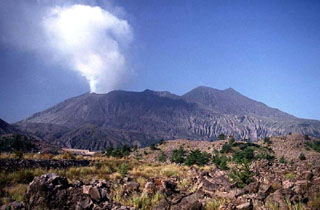
Our last report covered the explosive eruptions of 2-3 October 2009 from two of Sakura-jima's active vents: Minami-dake and Showa (BGVN 34:08) (figure 33). Minami-dake was last active on 22 February 2009. This report covers Sakura-jima's activity from October 2009 through October 2011; datasets may have various termination dates due to availability.
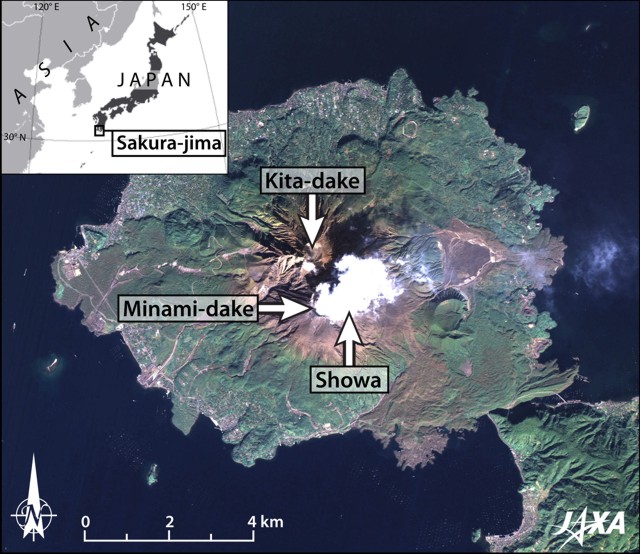 |
Figure 33. Location of Sakura-jima; surrounded by Kagoshima Bay and connected to the mainland of Kyushu, Japan by lava flows from 1914 AD (SW side of the island). Satellite image courtesy of Japan Aerospace Exploration Agency (JAXA) and index map from MapsOf.net. |
The ash plumes of October 2009 to October 2011 reported by the Tokyo Volcanic Ash Advisory Center (VAAC) were disclosed in pilot's reports and satellite observations. Plume heights had a maximum altitude range of 1.2 to 4.9 km. VAAC released regular advisories during this time period, often more than once each week.
For the next 11 months following the explosive 2-3 October 2009 events, the Japan Meteorological Agency (JMA) maintained Alert Level 3 status due to intense eruptions from Showa crater (figure 34). The five-tier alert system used by JMA assigns red alert to Level 5; a Level 3 status forbids anyone to approach the volcano. Activity was occasionally Strombolian and Vulcanian during this time period. Lava fountaining on 8 February 2010 reached 1,000 m above the crater; this activity was visible at night and lightning was observed within the ash plume.
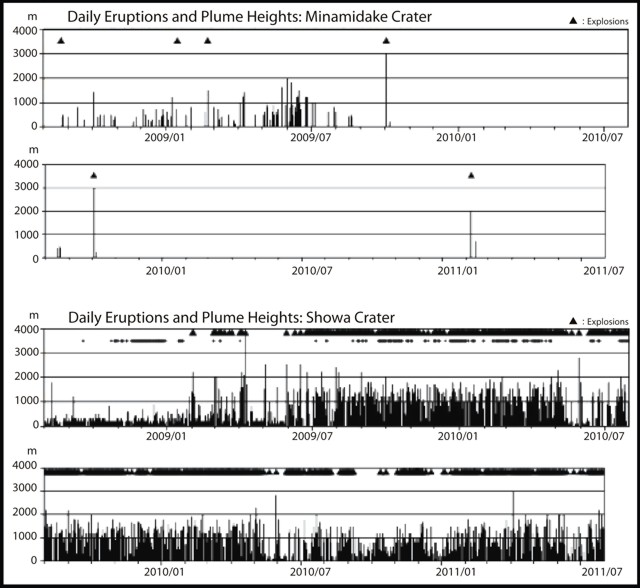 |
Figure 34. Plume heights and documented explosions for Sakura-jima's primary eruptive vents: Minami-dake (top) and Showa (bottom). Data is plotted for January 2009 through July 2011. Courtesy of JMA. |
On 30 May 2010 an ash plume rose 2.8 km from Showa crater. A small pyroclastic flow was documented on the E flank (figure 35). A camera located at the Ohsumi National Office of Rivers and Highways recorded the vertical plume and pyroclastic flow with both visible and thermal images. The pyroclastic flow traveled ~ 700 m and had temperatures up to 500°C above the background levels.
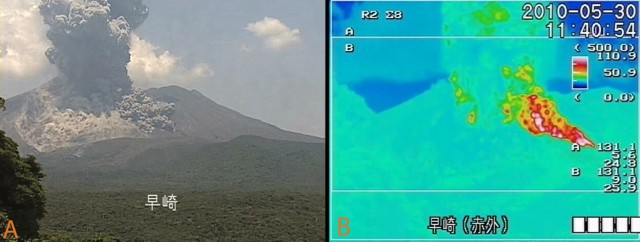 |
Figure 35. An ash plume rose up to an altitude of 2.8 km from Sakura-jima's Showa crater and a pyroclastic flow traveled down the E flank. The eruption occurred at 1140 on 30 May 2010 and was captured by visual photography and a thermal camera. Courtesy of JMA. |
Explosions were numerous in 2010 and according to JMA, by 20 June a new record had been reached; 550 explosions had already occurred at Sakura-jima. The Japan Times reported that the previous record high in a single year was 548 in 2009. By September 2010, this activity was less vigorous; the plumes from Showa crater were frequently less than 1 km high and no additional activity was reported from Minami-dake. On 30 September, JMA reduced the Alert Level but maintained warnings that no one should approach the summit craters. Earthquakes and tremor had become rare and constant deflation was recorded by tiltmeter and GPS. By June 2010, the long trend of inflation recorded by the water-tube tiltmeter at Arimura station peaked and in early July, abruptly began measuring deflation (figure 36).
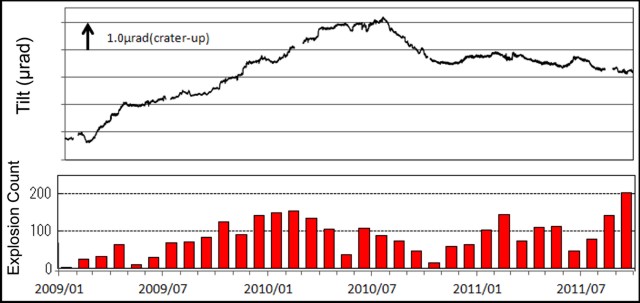 |
Figure 36. Tilt change at Sakura-jima observed by the water-tube tiltmeter at Arimura station from January 2009 to September 2011. Tidal response was corrected and inflation at the summit corresponds to positive tilt. In the bottom panel, the red bars denote monthly frequencies of explosions from Showa crater. Courtesy of JMA. |
From 7 to 20 October 2010, explosive eruptions became more frequent and exceeded background levels from the previous month. A large explosion on 13 October produced ejecta that reached ~ 1.3 km from Showa crater. Earthquake activity was consistently low, but elevated levels of tremor were recorded prompting JMA to raise the Alert Level to 3. During the subsequent months, explosive, ash-rich plumes became more frequent, increasing from 59 in November, and 62 in December, to 102 in January.
Activity was concentrated within the Showa crater until February 2011 when renewed activity began simultaneously at Minami-dake. Last active on 3 October 2009, the summit crater of Minami-dake released two ash-rich plumes on 7 February 2011. Volcanic bombs from Showa crater landed 0.8-1.3 km from the crater. At 1908 on 19 February, a pyroclastic flow extended ~ 500 m down the SE flank. JMA recorded 144 explosions that month, 110 of these events produced ash.
Incandescence and pyroclastic flows from Showa crater. Explosive eruptions continued at a lower rate during the following months; observers however, noted incandescence from Sakura-jima's summit from March through September 2011. An explosive eruption at 2242 on 30 April was recorded from Showa crater and was accompanied by a pyroclastic flow that extended 600 m from the crater on the E flank. Smaller pyroclastic flows 200-400 m in length occurred on 5 June, 12 July, and 1 and 12 September. These events traveled E and SE from the Showa crater and were recorded by thermal cameras and observers.
Aerial surveillance. Aerial observations of Showa crater were made on 31 May 2011 by JMA in cooperation with the Japan Maritime Self Defense Force (JMSDF). Fresh lava was discovered covering part of the crater floor with a diameter of 50-60 m (figure 37). Thermal results determined that the hottest area was in the center of the lava with temperatures up to 500°C above the measured background.
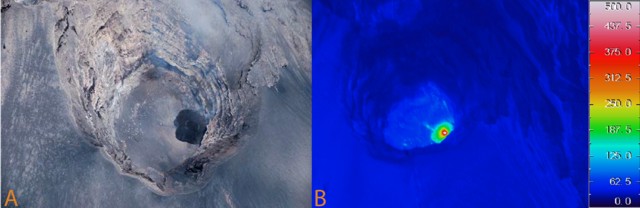 |
Figure 37. Sakura-jima's Showa crater on 31 May 2011. Aerial observations (A) and thermal imaging (B) determined the presence of new lava (appears black in plain light but has a high thermal output). Courtesy of JMA-JMSDF. |
During the 31 May overflight, two ponds of water were identified within the Minami-dake vent. Both craters, A and B, contained water (figure 38) that persisted through 11 July, and by August the volume of water appeared to have increased in crater A. Observations from an aerial survey on 30 August found the ponds differed in color: Crater A appeared light blue, and Crater B was red-brown. There was no apparent change in the amount of degassing from these craters.
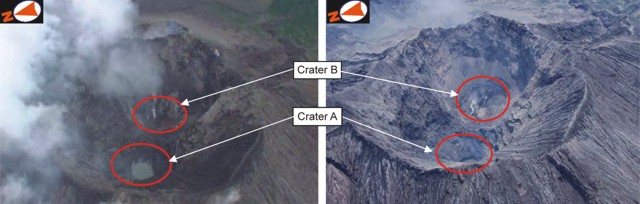 |
Figure 38. Sakura-jima's Minami-dake vent on 31 May and 11 July 2011. Aerial observations determined that water was collecting in craters A and B. Activity had not been recorded from this site since 7 February 2011. Courtesy of JMA-JMSDF. |
Geological Summary. The Aira caldera in the northern half of Kagoshima Bay contains the post-caldera Sakurajima volcano, one of Japan's most active. Eruption of the voluminous Ito pyroclastic flow accompanied formation of the 17 x 23 km caldera about 22,000 years ago. The smaller Wakamiko caldera was formed during the early Holocene in the NE corner of the caldera, along with several post-caldera cones. The construction of Sakurajima began about 13,000 years ago on the southern rim and built an island that was joined to the Osumi Peninsula during the major explosive and effusive eruption of 1914. Activity at the Kitadake summit cone ended about 4,850 years ago, after which eruptions took place at Minamidake. Frequent eruptions since the 8th century have deposited ash on the city of Kagoshima, located across Kagoshima Bay only 8 km from the summit. The largest recorded eruption took place during 1471-76.
Information Contacts: Tokyo Volcanic Ash Advisory Center (VAAC), Tokyo, Japan (URL: http://ds.data.jma.go.jp/svd/vaac/data/); Japan Meteorological Agency (JMA), Otemachi, 1-3-4, Chiyoda-ku Tokyo 100-8122, Japan (URL: http://www.jma.go.jp/); JAXA (URL: http://www.eorc.jaxa.jp/en/earthview/2011/tp110223.html); MapsOf.Net (URL: http://mapsof.net/).