Report on Cerro Negro (Nicaragua) — January 2012
Bulletin of the Global Volcanism Network, vol. 37, no. 1 (January 2012)
Managing Editor: Richard Wunderman.
Edited by Julie A. Herrick.
Cerro Negro (Nicaragua) Non-eruptive activity; fumarole and seismic monitoring; new crater morphology
Please cite this report as:
Global Volcanism Program, 2012. Report on Cerro Negro (Nicaragua) (Herrick, J.A., and Wunderman, R., eds.). Bulletin of the Global Volcanism Network, 37:1. Smithsonian Institution. https://doi.org/10.5479/si.GVP.BGVN201201-344070
Cerro Negro
Nicaragua
12.506°N, 86.702°W; summit elev. 728 m
All times are local (unless otherwise noted)
Cerro Negro remained non-eruptive from 2003 to 2011; explosive activity was last recorded in December 1999 (BGVN 24:11). Our last report reviewed Cerro Negro's fumarolic field observations, including descriptions of passive degassing and measurements of temperatures from June 2002 through May 2003, provided courtesy of Instituto Nicaragüense de Estudios Territoriales (INETER) and international collaborators (BGVN 28:07). No volcanic ash advisory reports for the area of Cerro Negro were released by the Washington VAAC office during 2003-2011. The following report reviews seismicity from 2003 to 2011, field observations, and emission measurements provided by INETER. The primary physical features of Cerro Negro highlighted in this report include the 1992 and 1995 central craters as well as the three 1999 craters, which continued to steam in 2007 (figure 15).
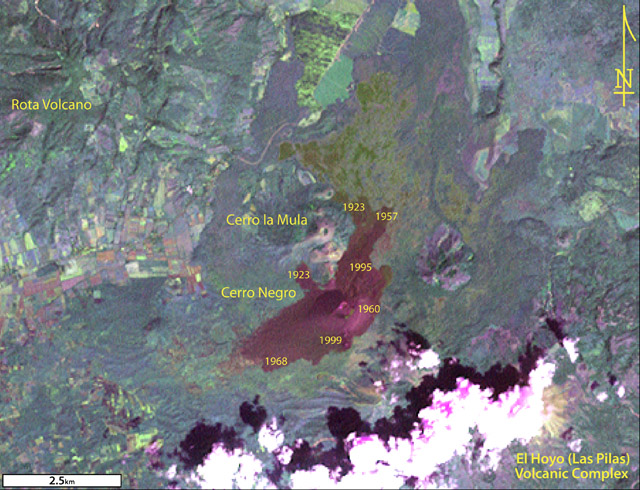 |
Figure 15. A composite Landsat 7 ETM+ image of Cerro Negro processed by GVP with geospatial software (NASA Landsat Program, 2003). The image had an original resolution of 30 m and was collected on 15 November 1999. Lava flow ages shown (1923 to 1999) are based on GVP online photo captions ("Photo Gallery") and published literature by McKnight and Williams (1997) and Hill and others (1998). |
Figure 15 consists of a false-color image made from visible, near- and mid-infrared bands (3,7,2) to enhance geological features. Cerro Negro appears dark-red in the center of the image. The central cone, which was the source of many lava flows, lies immediately to the left of "1960" (the label dating the eruption associated with one of the lava flows). The tiny, arcuate pink and green zones at the central cone represent the rim of the nested craters there. Those craters are the scene of the highest fumarolic activity.
On the cone's S flanks, the three small cones created during the 1999 eruption appear as bright pink points. In figure 15 these appear immediately right of "1999".
Several volcanoes of the NW trending Marrabios range of Western Nicaragua are labeled on figure 15. Along the range to the SE is the historically active El Hoyo (Las Pilas) volcanic complex, which in figure 15 is partly cloud-covered. The complex includes Las Pilas, Cerro Grande, and Cerro Ojo de Agua eruptive centers. To the N and NW of Cerro Negro lie the volcanic centers Cerro la Mula and Rota.
Post-eruptive seismicity from 1999 to 2003. The INETER December 2003 report discussed seismicity after the small-scale, cone-forming events in 1999. INETER described Cerro Negro as relatively quiet since the 1999 episode; minor ash and gas explosions occurred as late as 25 December 1999. Earthquake counts from August 1999 to December 2003 ranged from 40 to 100 earthquakes per month, typically volcanic-tectonic (VT) events. Low amplitude tremor (frequency ranges of 8-19 Hz) was detected throughout 2003.
Figure 16 depicts multi-year seismicity and illustrates comparitive highs during 2003, particularly in January, September, and December when the the number of monthly earthquakes rose to over 100. These swarms led to counts roughly 10-fold higher than the 18-month interval of quiet from middle to late 2001. The later seismic swarm, occurring from 30 to 31 December, comprised 37 events too small to locate.
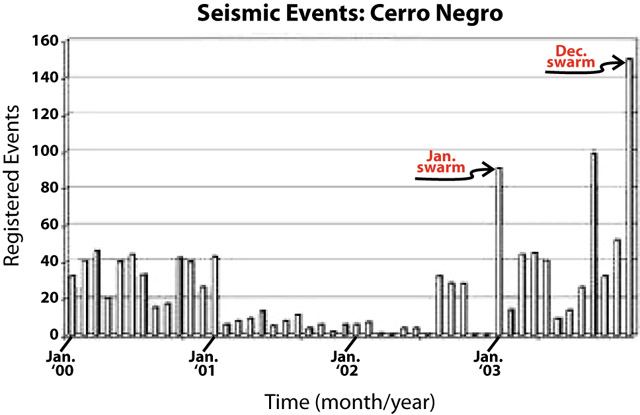 |
Figure 16. Histogram presenting the number of earthquakes recorded at Cerro Negro from January 2000 through December 2003. Two swarms occurred during 2003 (labeled). Courtesy of INETER. |
During 2003, INETER visited the volcano and found the scene without visible sign of change, without felt earthquakes, and lacking anomalous gas emissions. Fumarole temperatures from eight sites were in the range ~100-400°C. The only anomalous temperature increase in 2003 appeared at two fumaroles measuring ~550°C on 27 August. That was an increase of more than 200°C since July 2003.
2004 banded tremor and elevated seismicity. Although not ploted on figure 16, elevated seismicity continued through January, February, and March 2004. Banded tremor was recorded until 20 January, when it began to diminish. In January, RSAM was not greater than 50 units, but several cautionary public announcements were made regarding persistent tremor and its typical association with explosive activity.
Although INETER reported decreased tremor toward the end of January 2004, a seismic swarm occurred from 23 to 27 January. On 26 January the highest number of earthquakes registered (203 earthquakes, ~50 more than high of December 2003).
Of the ~1,200 earthquakes registered during January 2004, only three were located. During 3-29 February, ~400 events were registered and 33 were located. In March, 23 earthquakes were located and during the following months, significant events became rare averaging ~3 events located per month for the rest of the year. In March, tremor reached only 5 RSAM units.
Field visits by INETER determined that fumarole temperatures in March, May, June, and July 2004, ~50-350°C, spanned a wider range than those from the previous year. INETER had been measuring temperatures from several fumaroles (three to eight sites) within the crater since 1999 (figure 12 in BGVN 24:06 shows two primary fumarole locations in a map developed after major crater changes in 1995).
Press accounts regarding the seismic swarms. Officials interviewed by the newspaper La Prensa on 17 January 2004 included the mayor of León, who stated that the municipality's Emergency Committee was activated and on standby. The director of INETER's Volcanology program, Martha Navarro, also explained that caution was merited due to experience from Cerro Negro's 1999 escalation. Similar seismic tremor was recorded recently from the volcano, but conditions had clearly changed since 1999 and no explosions had occurred. The director also noted that on 11 January 2004 visiting scientists had looked for substantial sulfur-dioxide emissions but found them absent.
On 22 January 2004, a Civil Defense representative told La Prensa that recent reports of plumes from the crater were false and that no physical changes had occurred at Cerro Negro during the December-January seismic unrest. Passive degassing had been occurring at the summit and from fumaroles since the 1999 events but may have appeared anomalous to local observers. Regular monitoring by INETER had shown elevated temperatures from the fumaroles and steam frequently escaped from the three 1999 cinder cones (figure 15). According to La Prensa, the Civil Defense representative also shared details regarding new installations of seismic stations and gas-monitoring sites. A collaborative effort between Civil Defense and INETER made this possible.
2005-2011 rockfalls and altered crater morphology. Routine monitoring by INETER from 2005 through 2011 has been recorded in monthly reports available online in Spanish with English abstracts, works that chiefly documented passive degassing through this time period. Fumarole temperatures ranged from 13°C to ~400°C. In May 2003, seven fumaroles had elevated temperatures (BGVN 28:07), but in April 2008, six of these sites had ceased discharging measurable emissions. By July 2008, four fumarole sites were emitting gas and elevated temperatures ranging from 96 to 285°C that month and appeared stable through 2011.
INETER began reporting significant rockfalls along Cerro Negro's S and SW interior crater walls in 2009. These rockfalls continued through 2011 and released meter-sized blocks of coherent rock as well as highly altered material that collected within the crater (figure 17). INETER suggested that some of the large rockfalls may have been caused by large rainfalls, particularly those events during July 2009 and May-July 2010.
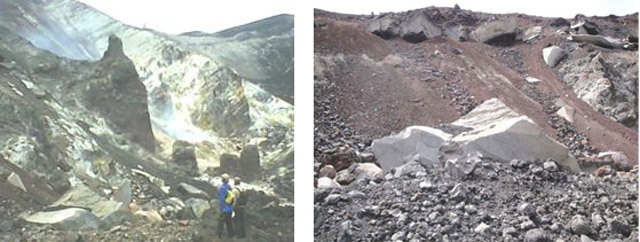 |
Figure 17. Photos of the S and SW interior crater walls of Cerro Negro. (Left) A photo (with people for scale) taken in August 2009 shows meter-sized blocks had collected on the crater floor and (in the middle ground) a diffuse plume from fumarolic degassing. (Right) A photo taken in September 2009 depicts massive blocks cropping out along the upper portion of the near-vertical wall and extensive areas of loose scree and blocks that have already fallen free. Courtesy of INETER. |
A significant geomorphic change at Cerro Negro was noted by INETER investigators on 11 January 2011. A N-trending fault had appeared since the last field visit (10 November 2010) on the SE interior crater wall (figure 18). Offset along the fault measured ~30 cm. Based on field relations INETER suggested this feature appeared gradually. The fault intersected fumarole ##1, a reliable site for thermal measurements. A major system of normal faults had already been documented to the NW of Cerro Negro, and the new fault on the cone appeared to trend parallel to it.
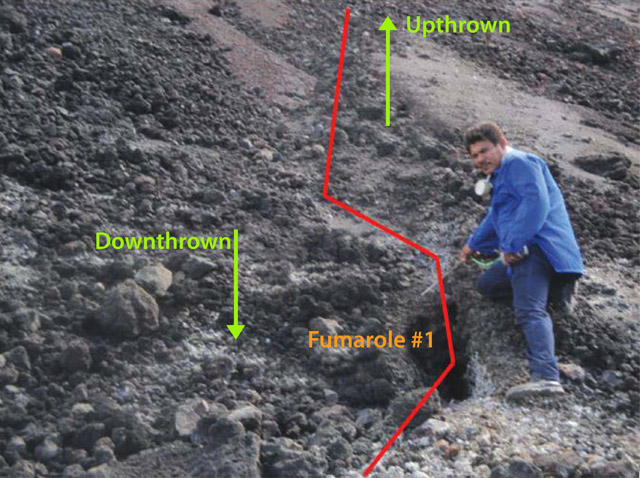 |
Figure 18. Observations made on 11 January 2011 by INETER detail the surface expression of a new fault intersecting fumarole ##1 on the SE segment of the interior crater wall (viewed looking S). The terms 'Upthrown' and 'Downthrown' refer to relative motion on the fault. The fault trends N-S and underwent ~30 cm of lateral displacement. Courtesy of INETER. |
Seismicity at Cerro Negro remained generally low from 2005 through 2011 although tremor was detected regularly. At times, tremor was as low as 5 RSAM units (July 2009) and as high as 30 (December 2010 and September 2011). Numerous VT events were recorded in 2006 (~347) and in 2011 (~240) and accordingly, the number of significant located events was higher for those years as well, 25 and 32, respectively (table 4).
Table 4. Significant earthquakes located near Cerro Negro from 2003 through 2011. For each year, the table lists the number of located earthquakes, range of local magnitudes (ML), range of focal depths, and most frequently-occurring focal depth. Courtesy of INETER.
| Year | # EQs | ML | Depth1 (km) | Depth2 (km) |
| 2003 | 13 | 1.5-3.3 | 0-8 | 2 |
| 2004 | 86 | 0.6-2.7 | 0-13 | 0 |
| 2005 | 23 | 1.0-2.6 | 1-61 | 2 |
| 2006 | 25 | 0.8-3.3 | 1-157 | 2 |
| 2007 | 6 | 1.9-2.8 | 2-6 | 6 |
| 2008 | 5 | 0.5-3.1 | 1-194 | 2 |
| 2009 | 1 | 3.1 | 4 | 4 |
| 2010 | 6 | 1.5-2.8 | 2-88 | 3 |
| 2011 | 32 | 0.5-3.5 | 0-140 | 3 |
The range of focal depths was relatively large in 2006 and 2011. The deepest earthquake during 2003-2011 struck on 23 December 2008 with local magnitude (ML) 3.1 and located ~190 km below sea level. The most frequently occurring focal depth during 2005-2011 was very shallow, 2 km below sea level, under ML 3.5.
During field campaigns on 21-27 February 2011, a collaborative effort between Spain's Instituto Tecnológico y de Energías Renovables (ITER) and INETER mapped the spatial CO2-flux pattern. The team was able to map CO2 fluxes from multiple diffuse sources over the cone and within Cerro Negro's 1992 and 1995 craters (figure 19). An overall total CO2 flux of 43 tons per day was determined; a similar measurement was obtained in 2010 (44 tons per day). Collaborative efforts between ITER and INETER have applied this mapping technique since 1999 in order to locate anomalous areas of emissions from the cone and to calculate total flux (Dionis, S. and others 2010). These investigators noted that the years following the 1999 explosion were marked by decreasing levels of CO2 however, an increasing trend appeared from December 2008 to March 2009; values ranged from 12 tons per day to 38 tons per day.
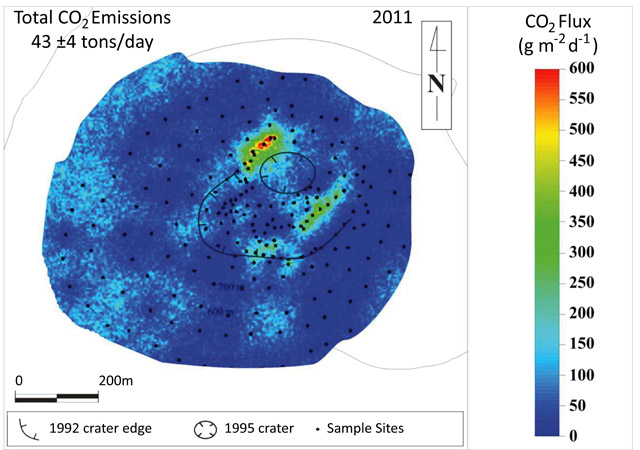 |
Figure 19. Results of a CO2 measuring campaign from 21 to 27 February 2011. Courtesy of ITER and INETER. |
References. Dionis, S., Melián, G., Barrancos, J., Padilla, G., Calvo, D., Rodríguez, F., Padrón, E., Nolasco, D., Hernández, Pedro A., Pérez, N. M., Ibarra, M., and Muñoz, A., 2010. Dynamics of diffuse CO2 emission and eruptive cycle at Cerro Negro volcano, Nicaragua, Cities on Volcanoes 6, Puerto de la Cruz, Tenerife, 31 May-4 June, 2010, Abs, p 103.
Hill, B. E., Connor, C.B, Jarzemba, M.S., La Femina, P.C., Navarro, M., and Strauch, W., 1998, 1995 eruptions of Cerro Negro volcano, Nicaragua, and risk assessment for future eruptions, Geological Society of America Bulletin, 110, no. 10;1231-1241.
NASA Landsat Program, 2003, Landsat ETM+ scene 7dt19991115, SLC-Off, USGS, Sioux Falls, Nov. 15, 1999.
McKnight, S.B. and Williams, S.N., 1997, Old cinder cone or young composite volcano?: The nature of Cerro Negro, Nicaragua, Geology, 25, 339-342.
Geological Summary. Nicaragua's youngest volcano, Cerro Negro, was created following an eruption that began in April 1850 about 2 km NW of the summit of Las Pilas volcano. It is the largest, southernmost, and most recent of a group of four youthful cinder cones constructed along a NNW-SSE-trending line in the central Marrabios Range. Strombolian-to-subplinian eruptions at intervals of a few years to several decades have constructed a roughly 250-m-high basaltic cone and an associated lava field constrained by topography to extend primarily NE and SW. Cone and crater morphology have varied significantly during its short eruptive history. Although it lies in a relatively unpopulated area, occasional heavy ashfalls have damaged crops and buildings.
Information Contacts: Instituto Nicaragüense de Estudios Territoriales (INETER), Apartado Postal 2110, Managua, Nicaragua (URL: http://www.ineter.gob.ni/); Global Land Cover Facility ( URL: http:// http://www.glcf.umiacs.umd.edu/); Instituto Tecnológico y de Energías Renovables (ITER), 38611 Granadilla, Tenerife, Canary Islands, Spain (URL: http://www.iter.es/); Washington Volcanic Ash Advisory Center (VAAC), Satellite Analysis Branch (SAB), NOAA/NESDIS E/SP23, NOAA Science Center Room 401, 5200 Auth Rd, Camp Springs, MD 20746, USA (URL: http://www.ospo.noaa.gov/Products/atmosphere/vaac/); La Prensa de Nicaragua, Managua, Nicaragua (URL: http://www.laprensa.com.ni/).