Report on Long Valley (United States) — March 2012
Bulletin of the Global Volcanism Network, vol. 37, no. 3 (March 2012)
Managing Editor: Richard Wunderman.
Edited by Robert Dennen.
Long Valley (United States) 2009 summary, deep seismic swarm at Mammoth Mountain
Please cite this report as:
Global Volcanism Program, 2012. Report on Long Valley (United States) (Dennen, R., and Wunderman, R., eds.). Bulletin of the Global Volcanism Network, 37:3. Smithsonian Institution. https://doi.org/10.5479/si.GVP.BGVN201203-323822
Long Valley
United States
37.7°N, 118.87°W; summit elev. 3390 m
All times are local (unless otherwise noted)
This report on Long Valley caldera, California, summarizes USGS reports for 2009. The volcano remained non-eruptive. Long Valley Observatory (LVO) is now part of the California Volcano Observatory (CalVO). A tectonic earthquake sequence during 2011 in nearby Hawthorne, Nevada, is also discussed.
Long Valley caldera entered relative quiescence in the spring of 1999 (BGVN 26:07) following unrest that began in 1980 (SEAN 07:05); this relative quiescence continued through 2009.
Seismicity during 2009 was characterized by a low level of seismicity within the caldera, and a typical higher level of seismicity in the surrounding Sierra Nevada range (figure 41). Three recorded earthquakes were larger than M 3.0, yet none of them occurred within the region of Long Valley caldera as delimited by LVO. The largest earthquakes within Long Valley caldera were an M 2.7 on 9 January in the S moat, and a pair of M 2.3 earthquakes on 10 December that were located beneath the resurgent dome.
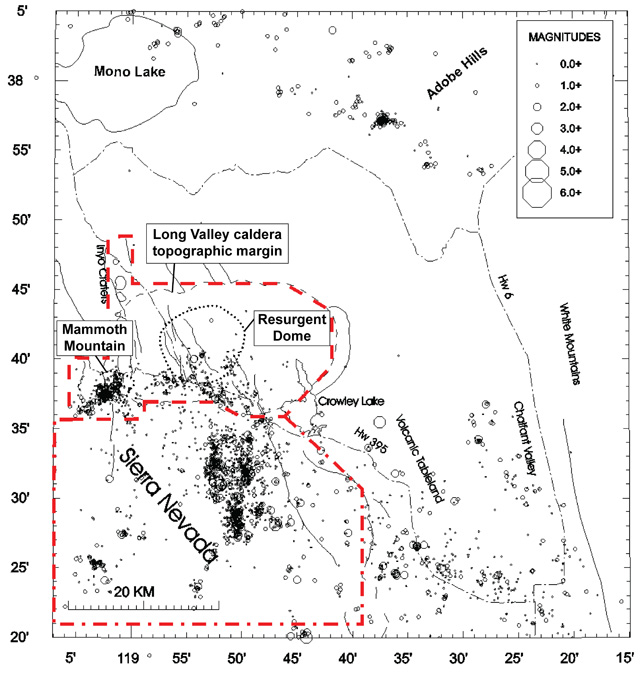 |
Figure 41. Seismicity in the region of Long Valley caldera and the surrounding Seirra Nevada range. The upper red dashed outline indicates volcanic areas associated with Long Valley caldera (including Mammoth Mountain and Inyo Craters), and the red dashed and dotted outline indicates the adjacent Sierra Nevada range. Earthquake epicenters are shown with symbols proportional to earthquake magnitudes, according to the scale at top-right. Modified from USGS-LVO. |
Deep seismic swarm at Mammoth Mountain.At Mammoth Mountain, increased seismicity began in late May, and a deep seismic swarm occurred on 29 September. The 29 September seismic swarm included over 50 M ≥0.5 high-frequency earthquakes that occurred at depths of 20-25 km, depths inferred to be in the mafic lower crust (figure 42). The high frequencies of these earthquakes indicated brittle-rock failure similar to shallow earthquakes that typically occur at <10 km depth, and were distinctly different than the long-period earthquakes that occur within the silicic upper crust, at depths of 10-25 km. The increased seismicity at Mammoth Mountain during 2009 produced more earthquakes there than occurred within Long Valley caldera (figures 41, 42, and 43).
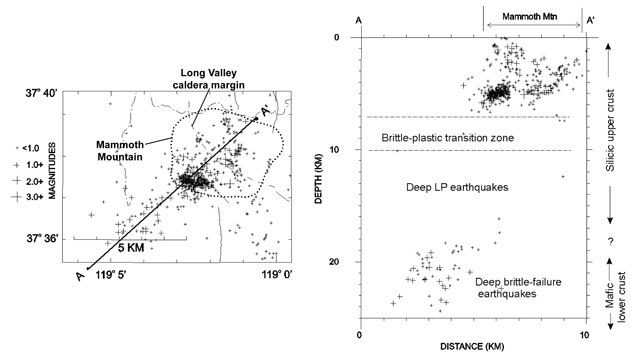 |
Figure 42. Map (left) and cross-section (right) views focusing on Mammoth Mountain seismicity during 2009. Note the two main clusters of earthquakes at ~0-7 km and ~20-25 km depth. Earthquakes are shown by symbols proportional to earthquake magnitude, shown by the scale at left. The line A-A' on the map indicates the plane of projection of the cross-section. The inferred mafic lower crust and silicic upper crust regions are indicated to the right of the cross-section. The cross-section also indicates interpreted brittle and plastic zones and the typical source area for deep, long-period (LP) earthquakes. Modified from USGS-LVO. |
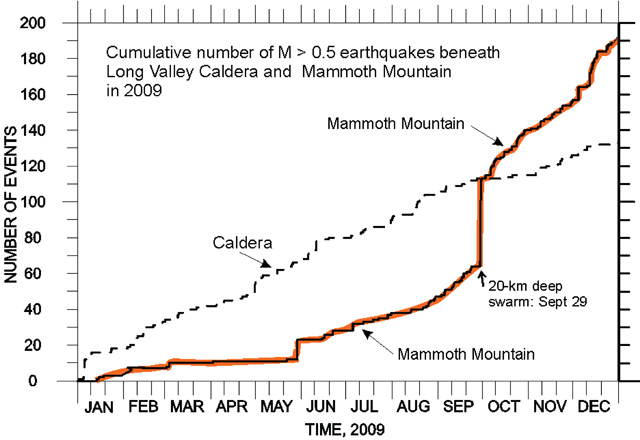 |
Figure 43. Plot of the cumulative number of earthquakes within Long Valley caldera (dashed line) and beneath Mammoth Mountain (solid line, highlighted in orange) during 2009. The 29 September deep earthquake swarm took place within a longer episode of enhanced seismicity at Mammoth Mountain that lasted from mid-2009 through at least the end of the year. Mammoth Mountain's cumulative 2009 seismicity surpassed that at the rest of the Long Valley caldera area. Courtesy of USGS-LVO. |
Slow inflation of the caldera's resurgent dome. Deformation trends during 2007-2009 highlighted slow inflation of the resurgent dome. At the end of 2009, the height of the resurgent dome remained ~75 cm higher than prior to the onset of unrest in 1980. Measurements since 2007 indicated horizontal displacement rates of ~5 mm/year, mostly in a pattern radiating away from the resurgent dome (figure 44).
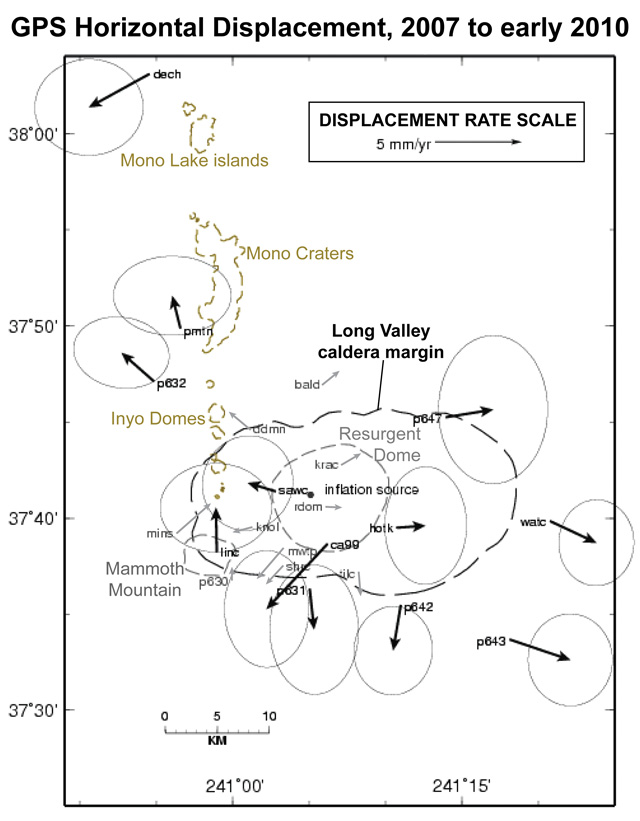 |
Figure 44. Horizontal displacement rates determined by GPS at different measurement sites in and around Long Valley caldera during the start of 2007 to early 2010, which highlight a trend of expansion away from the resurgent dome. Displacement rate vectors are relative to two reference sites located off the map in the Sierra Nevada range. Ellipses around arrows represent standard 2σ errors on the measurements. Light gray arrows represent insignificant displacement rates. The black dashed outline indicates the extent of Long Valley caldera, the gray dashed outline labeled "inflation source" indicates the resurgent dome, and the gray dashed outline at the SW edge of Long Valley caldera indicates Mammoth Mountain. From S to N, the brown dashed outlines indicate the Inyo Domes, Mono Craters, and Mono Lake islands. Modified from USGS-LVO. |
During 2009, soil CO2 emission measurements revealed variations typical of most previous years. The increase in seismicity at Mammoth Mountain on 29 September did not produce a corresponding increase in CO2 emissions.
2011 Hawthorne, Nevada, earthquake sequence. In March 2011, an earthquake sequence (mentioned in LVO weekly activity updates) began in Hawthorne, Nevada (~100 km NNE of the center of Long Valley caldera) that, according to Smith and others (2011), initially sparked brief concerns of unrest at Mud Springs volcano (figure 45). Mud Springs volcano is a probable Pleistocene volcano of the Aurora-Bodie volcanic field, Nevada (Wood and Kienle, 1992). The Hawthorne earthquakes did not show volcanic signatures in near-source seismograms (Smith and others, 2011), and the sequence was quickly identified as tectonic in origin.
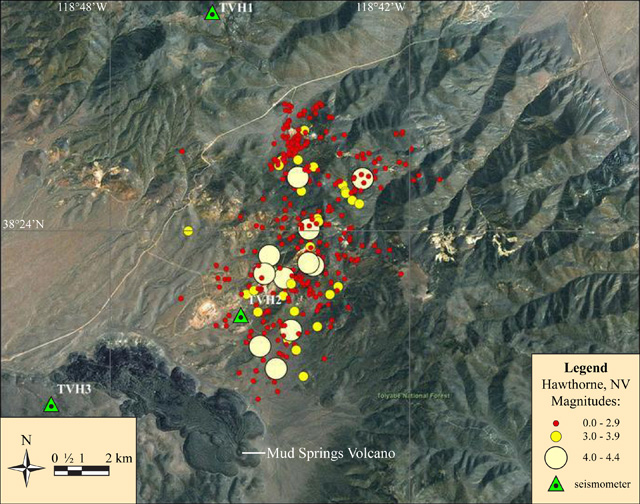 |
Figure 45. Mapped epicenters and magnitudes (legend, bottom right) of the 2011 Hawthorne, Nevada, earthquake sequence through 19 May 2011. Hawthorne is ~10 km to the NE of the top right margin of the image. Green triangles mark the locations of three temporary seismometers (TVH1-3) installed during 17-19 April 2011. Mud Springs volcano and its associated lava flows are labeled at the bottom of the image. Modified from the Nevada Seismological Laboratory, University of Nevada, Reno. |
According to Smith and others (2011), "An additional concern, as the sequence . . . proceeded, was a clear progression eastward toward the Wassuk Range front fault. The east dipping range bounding fault is capable of M 7+ events, and poses a significant hazard to the community of Hawthorne and local military facilities. The Hawthorne Army Depot is an ordinance storage facility and the nation's storage site for surplus mercury."
Earthquakes of the March 2011 sequence were as strong as M 4.6 (figure 46); the largest earthquakes may have been felt in Bridgeport, CA (~60 km SW of Hawthorne, and ~70 km NNW from the center of Long Valley caldera), according to LVO. The earthquakes occurred along at least two shallow faults, originating at 2-6 km depth (Smith and others, 2011). The earthquake sequence "slowly decreased in intensity through mid-2011" (Smith and others, 2011).
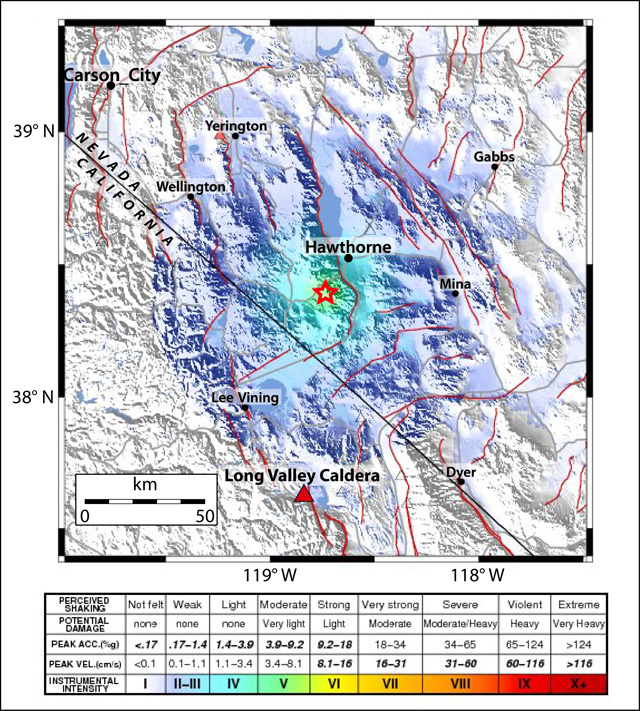 |
Figure 46. Mapped areas of felt responses to the M 4.6 earthquake that occurred on 16 April 2011 (see scale at bottom). The hypocenter is indicated by the red star (center). This was the strongest earthquake of the 2011 Hawthorne, Nevada earthquake sequence. The red triangle near the bottom of the map shows the location of Long Valley caldera. Modified from the Nevada Seismological Laboratory, University of Nevada, Reno. |
References. Smith, K.D., Johnson, C., Davies, J.A., Agbaje, T., Antonijevic, S.K., and Kent, G., 2011. The 2011 Hawthorne, Nevada, Earthquake Sequence; Shallow Normal Faulting. American Geophysical Union, Fall Meeting 2011, Abstract ##S53B-2284.
Wood, C.A. and Kienle, J., 1992. Volcanoes of North America: United States and Canada, Cambridge University Press, 354 p., pgs. 256-262.
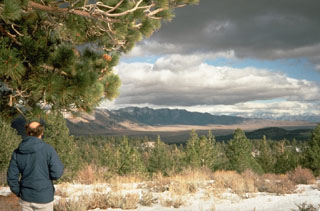
Geological Summary. The large 17 x 32 km Long Valley caldera east of the central Sierra Nevada Range formed as a result of the voluminous Bishop Tuff eruption about 760,000 years ago. Resurgent doming in the central part of the caldera occurred shortly afterwards, followed by rhyolitic eruptions from the caldera moat and the eruption of rhyodacite from outer ring fracture vents, ending about 50,000 years ago. During early resurgent doming the caldera was filled with a large lake that left strandlines on the caldera walls and the resurgent dome island; the lake eventually drained through the Owens River Gorge. The caldera remains thermally active, with many hot springs and fumaroles, and has had significant deformation, seismicity, and other unrest in recent years. The late-Pleistocene to Holocene Inyo Craters cut the NW topographic rim of the caldera, and along with Mammoth Mountain on the SW topographic rim, are west of the structural caldera and are chemically and tectonically distinct from the Long Valley magmatic system.
Information Contacts: Dave Hill, California Volcano Observatory (CalVO), formerly theLong Valley Observatory (LVO), U.S. Geological Survey, Menlo Park, CA (URL: http://volcanoes.usgs.gov/observatories/calvo/); Nevada Seismological Laboratory, Laxalt Mineral Engineering Building, Room 322, University of Nevada-Reno, Reno, NV 89557 (URL: http://www.seismo.unr.edu/).