Report on Monowai (New Zealand) — June 2012
Bulletin of the Global Volcanism Network, vol. 37, no. 6 (June 2012)
Managing Editor: Richard Wunderman.
Monowai (New Zealand) Eruption causes summit depth change of 18.8 m over 14 days
Please cite this report as:
Global Volcanism Program, 2012. Report on Monowai (New Zealand) (Wunderman, R., ed.). Bulletin of the Global Volcanism Network, 37:6. Smithsonian Institution. https://doi.org/10.5479/si.GVP.BGVN201206-242050
Monowai
New Zealand
25.887°S, 177.188°W; summit elev. -132 m
All times are local (unless otherwise noted)
Monowai volcano, located 1,000 km NE of New Zealand's North Island, is one of the most active submarine volcanoes identified in the Tonga-Kermadec arc, a 2,500-km-long chain of submarine volcanoes stretching from New Zealand to just N of Tonga (figure 22). Bradley Scott, a volcanologist at New Zealand's GNS Science, reported that seismic activity recorded by GeoNet on the seismograph at Rarotonga, Cook Islands, had shown there were several days of eruptive activity at Monowai starting on 3 August 2012. A large pumice raft, first spotted on 19 July 2012, was suspected to have a source in Monowai; however, that was later discounted (see a report on Havre seamount in a subsequent issue). The most recent previous eruptions of Monowai began on 8 February 2008 and 14 May 2011.
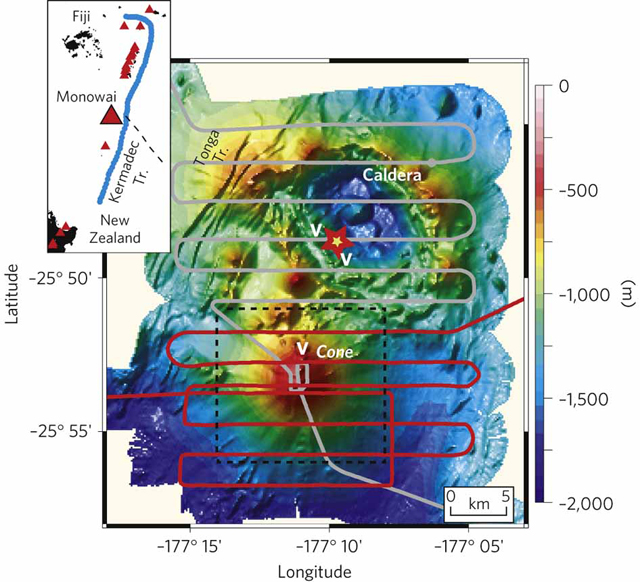 |
Figure 22. Regional bathymetric map of the Monowai Volcanic Centre (MVC), comprising the Monowai cone to the SW and the 10-km-wide Monowai caldera to the NE. Grey and red lines show the tracks of R/V Sonne on 14 May and during 1-2 June 2011, respectively. The yellow star with the red border shows the SW caldera hydrothermal site (from Leybourne and others, 2010). The letter 'V' indicates regions of active venting. The dashed black square around the cone shows the location of the maps in figure 23. The inset shows the location of the MVC in relation to historically active volcanoes in the Kermadec Trench area (red triangles; from Smithsonian Global Volcanism Program web site), Tonga and Kermadec Trench (blue lines), and the Louisville Ridge seamount chain (dashed black line). The depth scale along the right-hand side of the figure keys the colors in the figure to the appropriate depths, in meters. Courtesy of Watts and others (2012). |
All previous Bulletin reports on Monowai, including most of the latest one in 2008 (BGVN 33:03), describe eruptive activity as measured remotely by the Polynesian Seismic Network (Réseau Sismique Polynésien, or RSP). In contrast, this report will emphasize recent oceanographic surveys conducted over the volcanic complex that help define the features of the area.
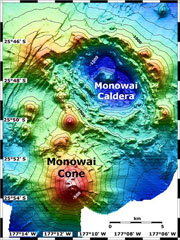
Background. According to a recent publication by Leybourne and others (2010), the MVC comprises a large, elongate caldera (7.9 x 5.7 km; 35 km2; floor depth = 1,590 m) to the NE, formed within an older caldera (84 km2). Associated is a large active stratovolcano to the SW, which rises to within ~100 m of the sea surface. Mafic rocks dominate MVC, with only rare andesites. Plume mapping shows at least four hydrothermal systems with venting from the summit of Monowai cone and its N flank. Monowai caldera has a major hydrothermal vent system associated with the SW wall of the caldera (figure 22).
Wright and others (2008) wrote that "The first recorded eruptions at Monowai date from between 1877 and 1928 (Mastin and Witter, 2000), and subsequently reported as a shoal in 1944 (Royal Australian Navy, written communication, 1944). More recent eruptions were first observed by maritime aircraft patrols in October 1977 (Davey, 1980). A bathymetric survey undertaken in July, 1978, and towed-sonar array surveys, undertaken in March and July 1978 and March, April, and June 1979, recorded periods of volcanic activity that included discolored water and vigorous gas emissions at the sea surface (Davey, 1980). A single-beam bathymetric survey recorded a conical edifice with a summit shoal of 117 m (velocity uncorrected) in September 1978 (Davey, 1980). A reconnaissance multibeam survey in 1986 by R/V Thomas Washington identified a shoal at a depth of 115 ± 5 m (Scripps Institute of Oceanography, unpublished data, 1986)."
Bathymetry. Multibeam surveys by RV Sonne in 1998 (SO-135 voyage) and RV Tangaroa in 2004 showed the Monowai stratovolcano cone (10-12 km in diameter, rising 965 m from the 1,100-m isobath) to be the largest of a number of postcollapse cones sited around the rim of the newly discovered Monowai caldera (part of the larger volcanic complex; Graham and others, 2008). The elongate caldera was 11 x 8.5 km in size and showed evidence of at least two phases of caldera formation. Monowai cone forms a relatively simple edifice on the S caldera rim, with near constant 13-18° slopes that were interpreted by the investigators of these cruises as angles of repose of volcaniclastic deposits generated at the summit. Prominent radial dikes and small aligned vents protruded up to 50 m above the edifice slopes, especially on the N and W flanks. The S flank showed evidence of repeated sector collapse. A single video-grab transect during the 1998 RV Sonne survey across the then-shallowest vent showed that it comprised coarse scoriaceous blocks with a lapilli sand matrix. Sampled rocks from Monowai cone comprise highly vesicular, plagioclase-clinopyroxene basalts (Brothers and others, 1980; Haase and othres, 2002).
Table 2 shows the various depths of the summit of the Monowai cone as measured by multiple bathymetyric surveys conducted since 1978. Figures 23 and 24 show regions of bathymetric changes.
Table 2. Summit depth measurements of Monowai cone since 1978. Courtesy of Watts and others (2012) and references listed.
| Date | Summit depth, m | Reference |
| Sep 1978 | 117 | Davey (1980) |
| Jun 1979 | less than 120 | Brothers and others (1980) |
| 1986 | ~120 | Wright and others (2008) |
| 1990 | ~100 | BGVN 15:08 |
| 1998 | 42 ± 3 | Wright and others (2008) |
| 2004 | 132 ± 2 | Wright and others (2008) |
| 2007 | less than 69 | Chadwick and others (2008) |
| May/Jun 2011 | 60.1 | Watts and others (2012) |
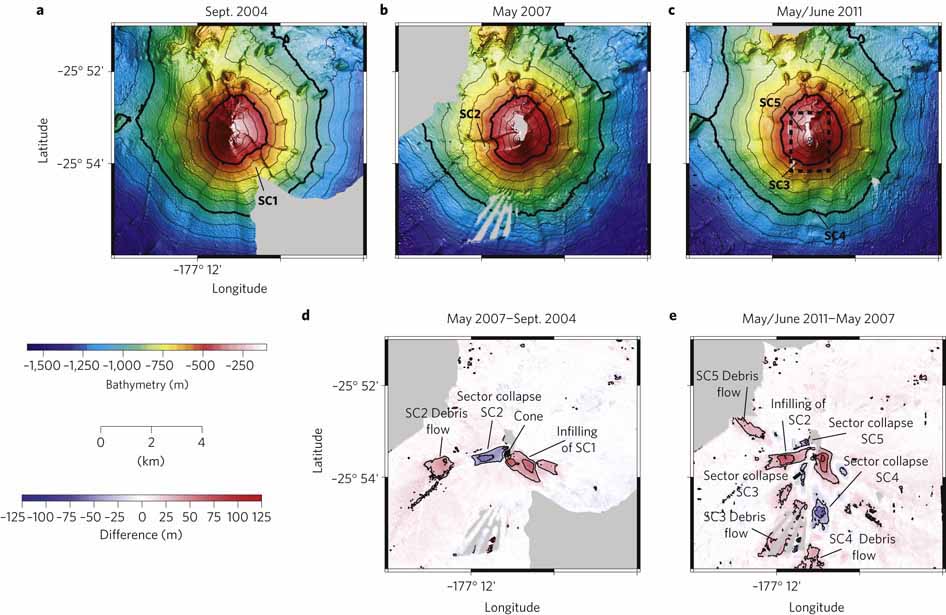 |
Figure 23. Detailed bathymetric maps of Monowai cone as it appeared in September 2004, May 2007 and May-June 2011. The map area is outlined in figure 22 (dashed black square). 'SC' denotes sector collapses. (a) Swath bathymetry acquired by R/V Tangaroa in September 2004, contoured at 100 m intervals, with thick contours at 500 m intervals. (b) Swath bathymetry, R/V Sonne, May 2007. (c) Swath bathymetry, R/V Sonne, 14 May and 1-2 June 2011 merged into a single grid. The dashed black rectangle shows the view area in figure 24. (d) Difference in bathymetry between the 2007 and 2004 surveys colored to indicate depth changes from -125 to +125 m. Shades of blue indicate depth increase (collapse), and shades of red, depth decrease (growth). (e) Difference in bathymetry between the 2011 and 2007 surveys. Colors as in (d). Colored scales indicate depths as in (a)-(c) and differences in bathymetry (as in (e) and (f)) between two dated surveys. Courtesy of Watts and others (2012). |
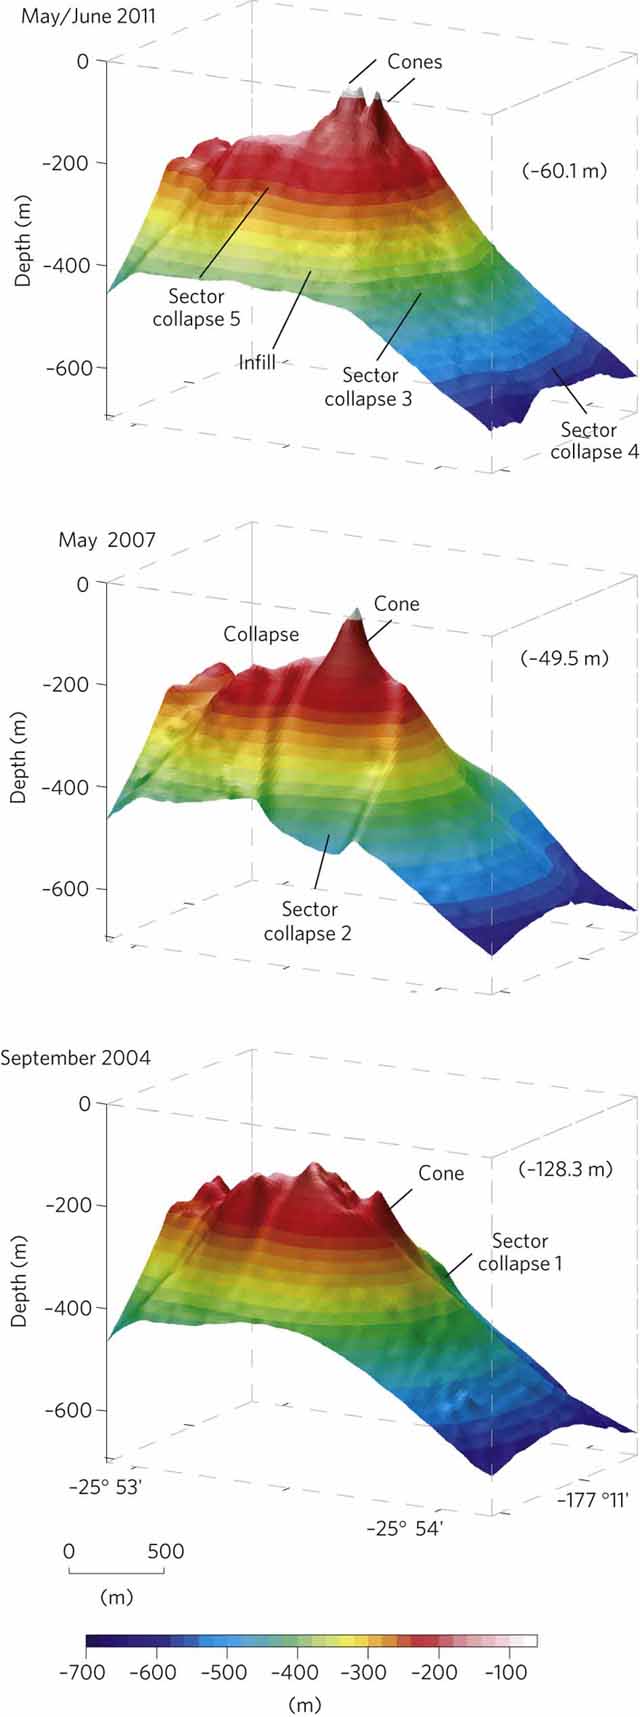 |
Figure 24. Perspective view from the SW (azimuth 240°, view angle 14° above horizontal) showing the bathymetry of the summit of Monowai cone in September 2004, May 2007, and May-June 2011. The view area is outlined by the dashed black rectangle in figure 23c. The bathymetry data have been artificially shaded by a sun located in the NW to enhance topography. The negative numbers in brackets to the right of each profile indicate the depth below sea level of the shallowest point on the summit. Colored scale shows key for bathymetry. Courtesy of Watts and others (2012). |
Mid-May to early June 2011. Watts and others (2012) reported the results of two recent bathymetric surveys of MVC conducted within a period of 14 days (14 May and 1-2 June 2011). They found marked differences in bathymetry between the surveys. New growth structures, probably due to new lava cones and debris flows, caused decreases in depth of up to 71.9 m, while collapse of the volcano summit region caused increases in depth of up to 18.8 m.
Hydro-acoustic T-wave data revealed a 5-day-long swarm of seismic events with unusually high amplitude between the two 2011 surveys, which link the depth changes to explosive activity (figures MON4, MON5, and MON6). [Note: According to NOAA (Chadwick, 2001), "A 'T-phase' or 'T-wave' is an acoustic phase from an earthquake that travels through the ocean. The 'T' stands for 'tertiary', as in: P-waves are 'primary', S-waves are 'secondary', and T-waves are 'tertiary', because they travel the slowest and so arrive third. Basically, when an earthquake occurs in the earth's crust under the ocean, the usual crustal phases are generated (P and S waves), but in addition part of the energy goes into the ocean as acoustic energy, and that is the T-wave. Not all earthquakes generate T-waves (since they need to be near water)...T-waves are typically recorded by hydrophones, but on some islands seismometers sometimes record T-wave signals that have been converted to crustal phases when they hit the island."]
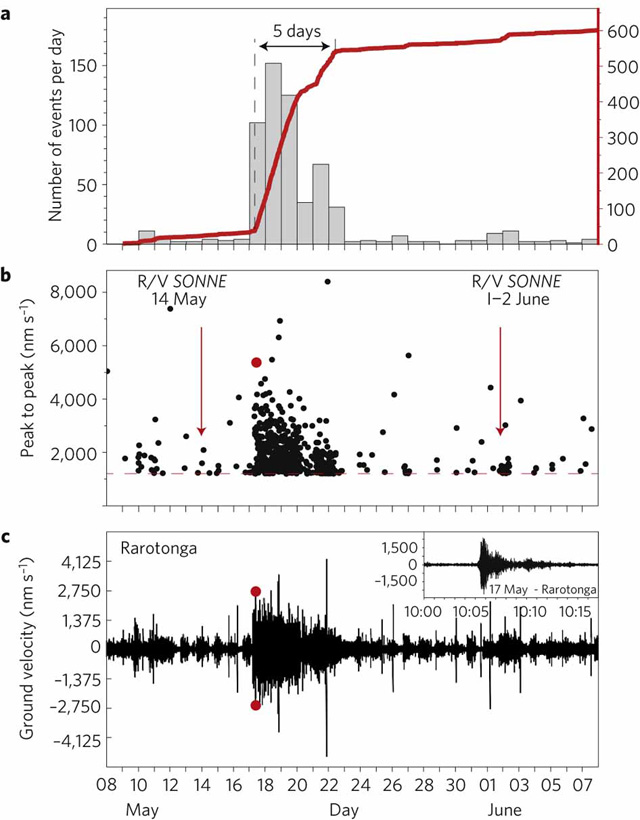 |
Figure 25. Time-series plots of hydro-acoustic T-wave data recorded at Rarotonga (IRIS station RAR, IU network) spanning the R/V Sonne repeat swath bathymetric surveys of 14 May and 1-2 June 2011. (a) Number of T-wave events per day (gray bars, left axis) and cumulative number of events (red line, right axis) versus time. An event is defined as one with a peak-to-peak amplitude in ground velocity >1,200 nm/s that is separated from another event by at least 1 min of quiescence. Note the abrupt increase in the number of events observed during the 5-day-long period between 17 to 22 May. (b) Peak-to-peak amplitude of individual events versus time. Red arrows mark the time of the 14 May and 1-2 June swath surveys. The full waveform of the event highlighted by the red circle is shown in the inset in (c). (c) Plot of ground velocity versus time. Courtesy of Watts and others (2012). |
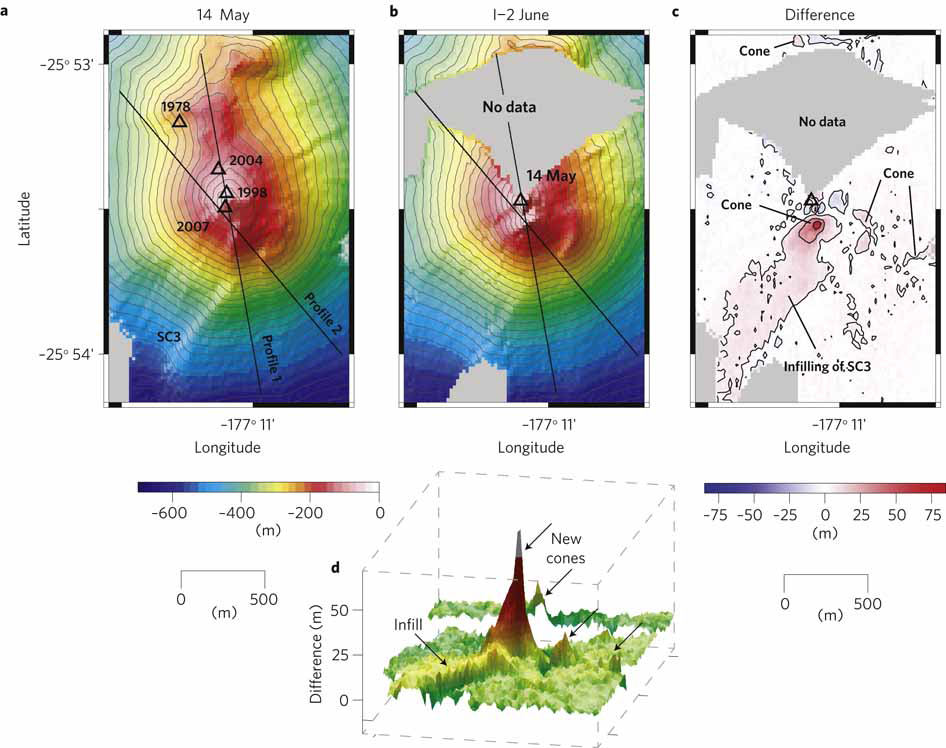 |
Figure 26. Swath bathymetry of the summit of Monowai cone as it appeared on 14 May and 1-2 June 2011. (a and b) Swath bathymetry acquired on R/V Sonne on 14 May (a) and 1-2 June (b) 2011. Open triangles with dates show the sequential position of the summit at selected times since 1978. 'SC3' indicates sector collapse 3 (see figures 23 and 24). Solid black lines show the profiles plotted in figure 27. The contour interval is 20 m. (c) Difference in the swath bathymetry between 14 May and 1-2 June colored to show depth decreases (blue) and increases (red). (d) Perspective view from the SSE (azimuth 168°, view angle 16° above horizontal) of the difference in swath bathymetry between 14 May and 1-2 June. Colored scales indicate depth (a, b, and d) and depth differences (c) in bathymetry between two dated surveys. Courtesy of Watts and others (2012). |
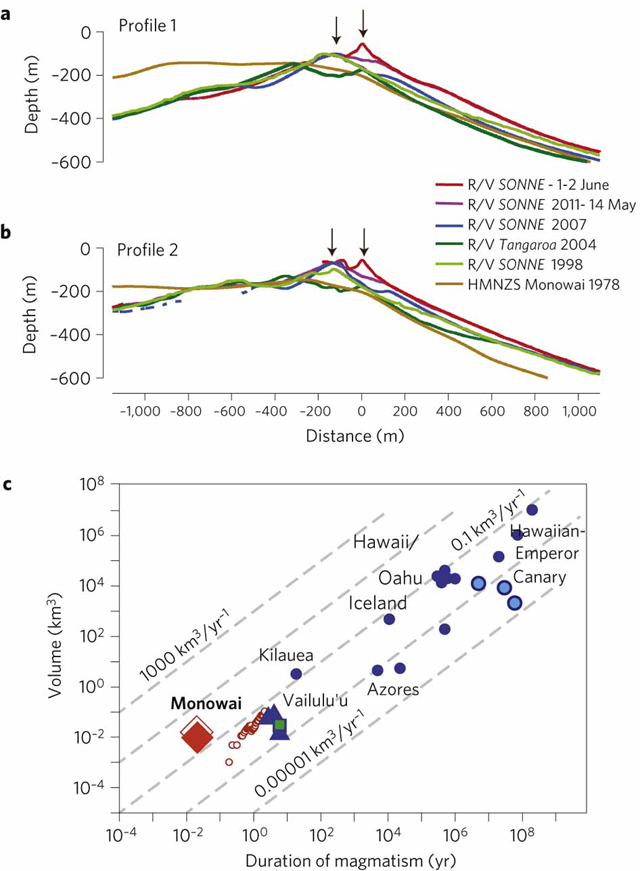 |
Figure 27. Progressive southward growth of the S flank of Monowai cone and the rate of volcanism. (a and b) Bathymetry profiles 1 (a) and 2 (b) from figure 26 of the summit of Monowai cone, shown with no vertical exaggeration. Black arrows highlight the 14 May and 1-2 June summits. The S flank shows progressive southward growth since 1977, contrasting with the more stable N flank. (c) Plot of eruptive volume versus duration of magmatism at Monowai, compared to other selected oceanic volcanoes. Symbols: red/orange diamond, 2011 survey (filled, cone only; unfilled, all data); blue triangles, previous repeat surveys in 1998, 2004 and 2007; small blue filled circles, selected seamounts and ocean islands from Chrisp (1984); green square, Vailulu'u (Staudigel and others, 2006); large light blue circles, data from >9,000 seamounts (Watts and others, 2006) that formed during 0-30 Myr, 95-125 Myr, and 105-110 Myr; small open brown circles, Montserrat (Sparks and others, 1998). Courtesy of Watts and others (2012). |
References. Brothers, R.N., Heming, R.F., Hawke, M.M., and Davey, F.J., 1980, Tholeiitic basalt from the Monowai seamount, Tonga-Kermadec ridge, New Zealand Journal of Geology and Geophysics, v. 23, no. 4, p. 537-539.
Chadwick, W.W., Jr., 2001, What is a T-phase?, URL: http://www.pmel.noaa.gov/vents/geology/tphase.html; posted 9 November 2001, accessed 14 August 2012.
Chadwick, W.W., Jr., Wright, I.C., Schwarz-Schampera, U., Hyvernaud O., Reymond, D., and de Ronde, C.E.J., 2008, Cyclic eruptions and sector collapses at Monowai submarine volcano, Kermadec arc: 1998-2007, GeochemistryGeophysicsGeosystemsG3, v. 9, p. 1-17 (DOI: 10.1029/2008GC002113).
Chrisp, J.A., 1984, Rates of magma emplacement and volcanic output, Journal of Volcanology and Geothermal Research, v. 20, pp. 177-211.
Davey, F.J., 1980, The Monowai seamount: An active submarine volcanic centre on the Tonga-Kermadec ridge (note), New Zealand Journal of Geology and Geophysics, v. 23, no. 4, p. 533-536.
Haase, K.M., Worthington, T.J., Stoffers, P., G-Schonberg, D., and Wright, I., 2002, Mantle dynamics, element recycling, and magma genesis beneath the Kermadec Arc-Havre Trough, GeochemistryGeophysicsGeosystemsG3, v. 3, no. 11. p. 1071 (DOI: 10.1029/2002GC000335).
Leybourne, M.I., de Ronde, C.E.J., Baker, E.T., Faure, K., Walker, S.L., Resing, J., and Massoth, G.J., 2010, Submarine magmatic-hydrothermal systems at the Monowai Volcanic Centre, Kermadec Arc, Goldschmidt Conference Abstracts 2010, Abstract A587.
Sparks, R.S.J., Young, S.R., Barclay, J., Calder, E.S., Cole, P., Darroux, B., Davies, M.A., Druitt, T.H., Harford, C., Herd, R., James, M., Lejeune, A.M., Loughlin, S., Norton, G., Skerrit, G., Stasiuk, M.V., Stevens, N.S., Toothill, J., Wadge, G., and Watts, R., 1998, Magma production and growth of the lava dome of the Soufriére Hills volcano, Montserrat, West Indies: November 1995 to December 1997, Geophysical Research Letters, v. 25, no. 18, pp. 3421-3424 (DOI: 10.1029/98GL00639).
Staudigel, H., Hart, S.R., Pile, A., Bailey, B.E., Baker, E.T., Brooke, S., Connelly, D.P., Haucke, L., German, C.R., Hudson, I., Jones, D., Koppers, A.A.P., Konter, J., Lee, R., Pietsch, T.W., Tebo, B.M., Templeton, A.S., Zierenberg, R., and Young, C.M., 2006, Vailulu'u Seamount, Samoa: Life and death of an active submarine volcano, Procedures of the National Academy of Science, USA, v. 103, pp. 6448-6453 (DOI: 10.1073/pnas.0600830103).
Watts, A.B., Sandwell, D.T., Smith, W.H.F., and Wessel, P., 2006, Global gravity, bathymetry, and the distribution of submarine volcanism through space and time, Journal of Geophysical Research, v. 111 (DOI: 10.1029/2005JB004083).
Watts, A.B., Peirce, C., Grevemeyer, I., Paulatto, M., Stratford, W., Bassett, D., Hunter, J.A., Kalnins, L.M., and de Ronde, C.E.J., 2012 (13 May), Rapid rates of growth and collapse of Monowai submarine volcano in the Kermadec Arc, Nature Geoscience, v. 5, p. 510-515 (DOI: 10.1038/ngeo1473).
Wright I.C., Chadwick, W.W., Jr, de Ronde, C.E.J., Reymond, D., Hyvernaud, O., Gennerich, H., Stoffers, P., Mackay, K., Dunkin, M.A., and Bannister, S.C., 2008, Collapse and reconstruction of Monowai submarine volcano, Kermadec arc, 1998-2004, Journal of Geophysical Research, v. 113, p. 1-13 (DOI: 10.1029/2007JB005138).
Geological Summary. Monowai, also known as Orion seamount, is a basaltic stratovolcano that rises from a depth of about 1,500 to within 100 m of the ocean surface about halfway between the Kermadec and Tonga island groups, at the southern end of the Tonga Ridge. Small cones occur on the N and W flanks, and an 8.5 x 11 km submarine caldera with a depth of more than 1,500 m lies to the NNE. Numerous eruptions have been identified using submarine acoustic signals since it was first recognized as a volcano in 1977. A shoal that had been reported in 1944 may have been a pumice raft or water disturbance due to degassing. Surface observations have included water discoloration, vigorous gas bubbling, and areas of upwelling water, sometimes accompanied by rumbling noises. It was named for one of the New Zealand Navy bathymetric survey ships that documented its morphology.
Information Contacts: Bradley J. Scott, GNS Science, Wainakel Research Centre, Taupo, New Zealand (URL: http://www.gns.cn.nz); GeoNet, New Zealand (URL: http://www.geonet.org.nz)