Report on Machin (Colombia) — November 2012
Bulletin of the Global Volcanism Network, vol. 37, no. 11 (November 2012)
Managing Editor: Richard Wunderman.
Edited by Julie A. Herrick.
Machin (Colombia) Monitoring efforts and intermittent shaking from local earthquakes during 2011-2012
Please cite this report as:
Global Volcanism Program, 2012. Report on Machin (Colombia) (Herrick, J.A., and Wunderman, R., eds.). Bulletin of the Global Volcanism Network, 37:11. Smithsonian Institution. https://doi.org/10.5479/si.GVP.BGVN201211-351040
Machin
Colombia
4.487°N, 75.389°W; summit elev. 2749 m
All times are local (unless otherwise noted)
Elevated seismicity during January 2011 was discussed in our last report on Cerro Machín volcano (BGVN 36:04). Between September 2010 and January 2011, more than 800 volcano-tectonic (VT) earthquakes were detected per month and local residents reported shaking from these events, particularly during November 2010-February 2011. Here we describe trends in seismicity at Machín from January 2011 to November 2012 and the frequency of seismic swarms. We also include descriptions of monitoring efforts by the Volcanic and Seismological Observatory of Manizales at the Colombia Institute of Geology and Mining (INGEOMINAS) including two field campaigns focused on CO2 emissions from the crater.
Geophysical monitoring. Since January 2011, INGEOMINAS had been monitoring Cerro Machín with a network that included broadband and short-period seismometers, magnetometers, self potential, and an acoustic monitoring system (acoustic flow detection for early flood warning). The deformation network included electronic and dry tilt (longterm monitoring since 2005), and starting in November 2012, three GPS stations were also operating (figure 4). Electronic-distance measurements (EDM) were conducted in 2012 at seven stations (EDM data was available since 2008). Data from these monitoring efforts were available in the INGEOMINAS online technical reports.
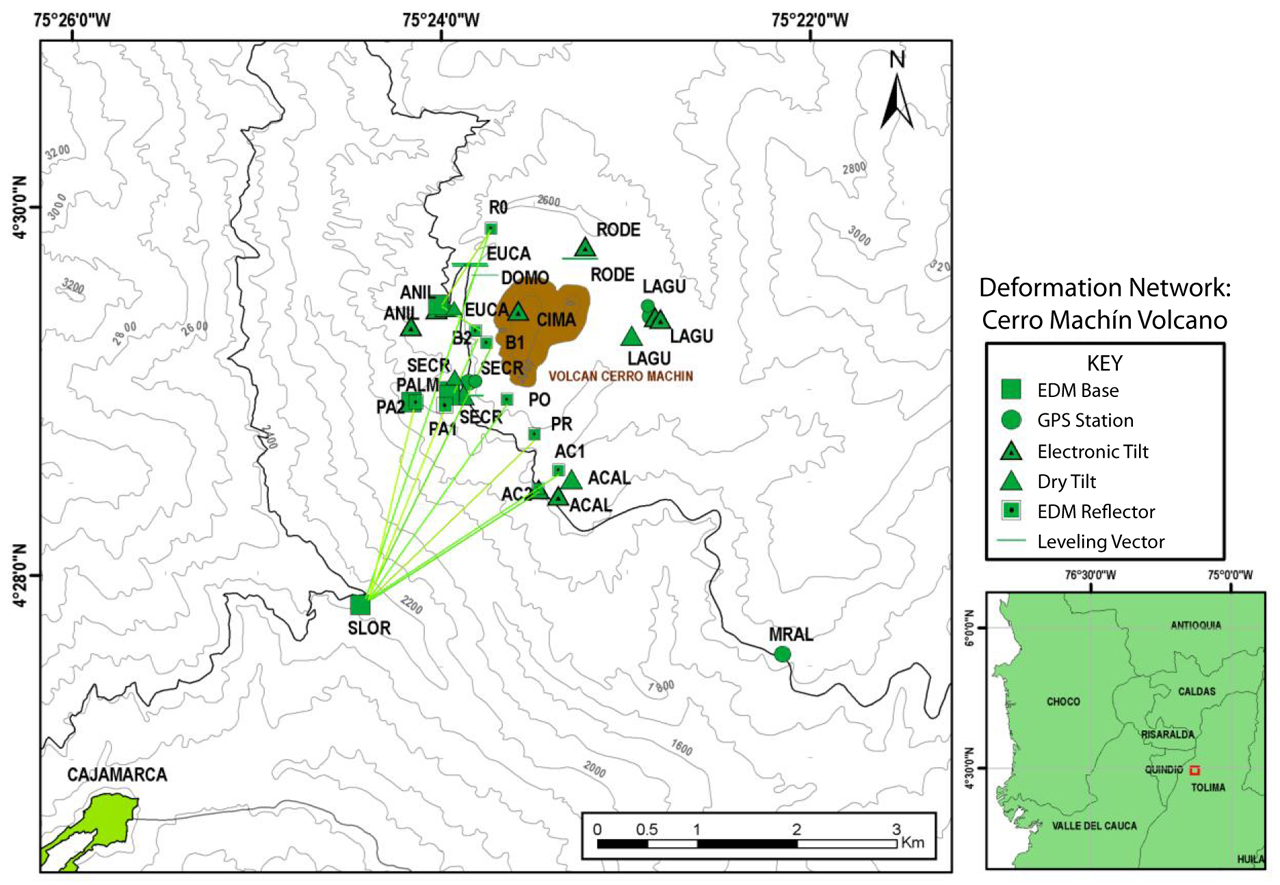 |
Figure 4. The deformation monitoring network at Cerro Machín in 2012 included three GPS stations and five electronic tilt stations. EDM measurements in September 2011 used three base stations (San Lorenzo, "SLOR;" La Palma, "PALM;" and Anillo, "ANIL") while measurements in October 2012 relied on one base station (San Lorenzo, "SLOR"). Courtesy of INGEOMINAS. |
Geochemical monitoring. Geochemical monitoring at Cerro Machín has been conducted within the circular crater and the central dome complex (figures 5 and 6). During 2011-2012, geochemical monitoring included diffuse CO2 detection, alkaline traps, and radon monitoring from soil emissions (13 stations were online in November 2012) as well as regular testing at fumarolic and hot spring locations.
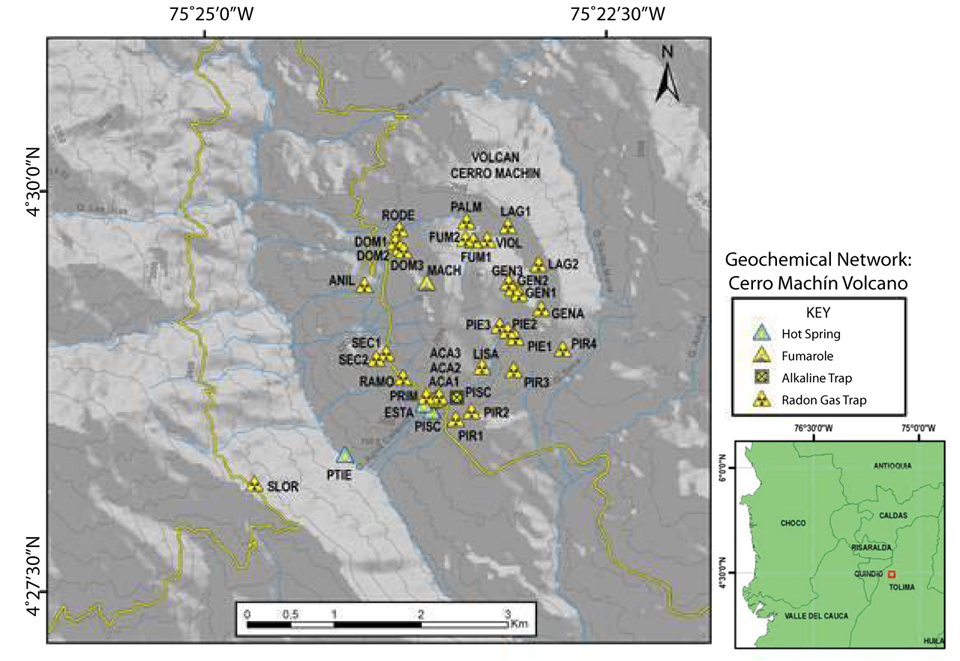 |
Figure 5. Geochemical monitoring during 2011-2012 at Cerro Machín included several dozen sampling sites mainly spread across the ~2-km diameter crater. INGEOMINAS released long-term datasets from radon-gas traps, an alkaline trap, and a fumarole in their monthly technical bulletins. Courtesy of INGEOMINAS. |
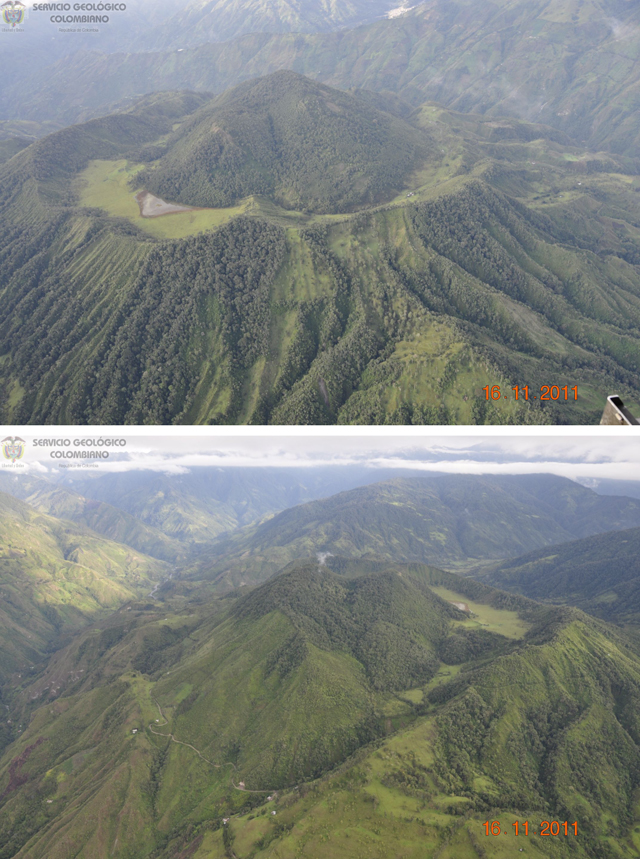 |
Figure 6. Two aerial views of Cerro Machín were captured during an overflight on 16 November 2011. (Top) In this view of the NE flank of Machín, the crater lake is visible near the left-hand side of the image within a moat-like region surrounding the dome. (Bottom) This view shows an access road along the breached, SW edge of the dome complex (lower center). This view also reveals a glimpse of the crater lake (appears gray) in the distant portion of the moat (right, from center). Courtesy of INGEOMINAS. |
In May and September 2012, INGEOMINAS conducted field surveys to measure diffuse carbon dioxide emissions (figure 7). With a mobile LICOR 820 monitoring device, INGEOMINAS technicians traversed the interior crater rim detecting CO2, air temperature, and pressure. The survey on 28 May determined baseline levels of CO2 flux at 28 points within the crater. The survey conducted during 19 and 20 September 2012 detected relatively high CO2 emissions from seven locations along a traverse within the crater. The highest CO2 fluxes ranged between 739 and 8,077 mol·m-2·day-1, and in their technical report, INGEOMINAS noted that future gas monitoring should focus on those sites with peak values.
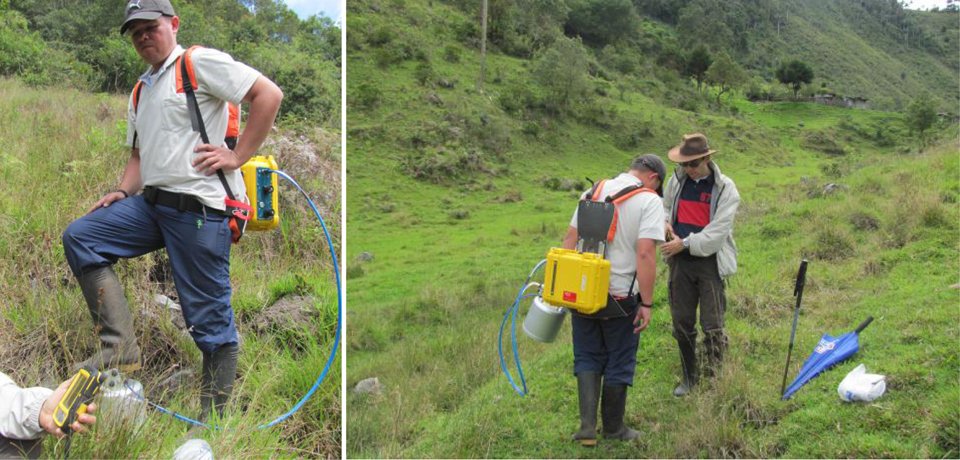 |
Figure 7. On 28 May 2012, INGEOMINAS conducted a CO2 campaign within the crater of Cerro Machín. Courtesy of INGEOMINAS. |
Seismicity in 2011. Elevated seismicity in late 2010 continued through early 2011 (BGVN 36:04) and local communities reported shaking in January and February 2011 (figure 8). For many months after May 2011, earthquakes per month had declined to below 400 per month. The clear exception to that trend took place during September 2011, a month with over 1,200 earthquakes.
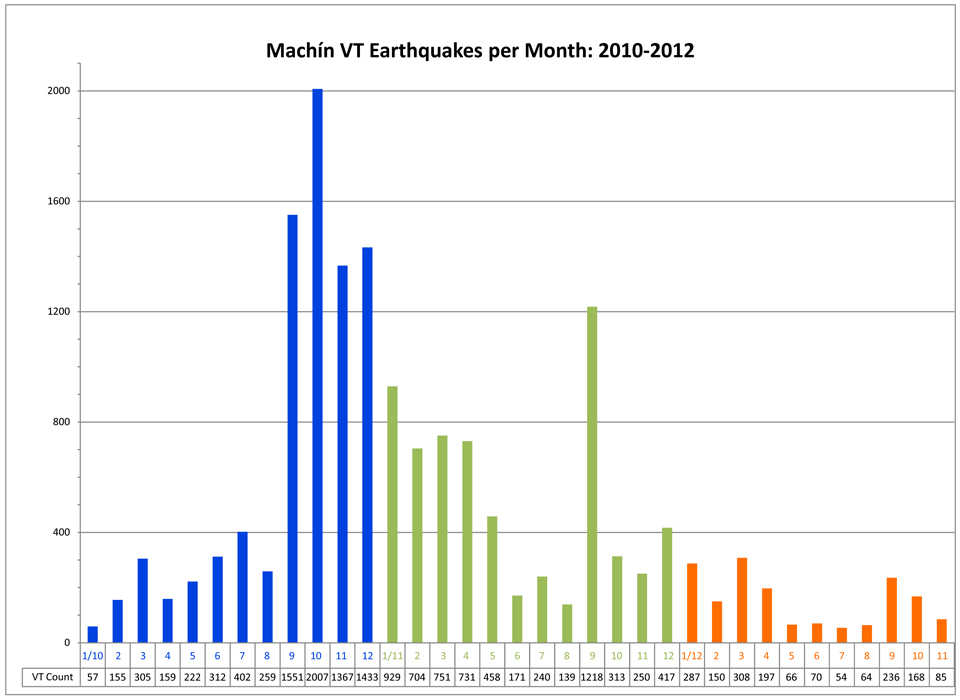 |
Figure 8. Volcano-tectonic (VT) seismicity at Cerro Machín abruptly increased in September 2010. This histogram shows time on the x-axis and number of earthquakes on the y-axis. Earthquake count per month decreased in January and February 2011 and reached low levels in August. Except for peaks in September and December 2011, the number of earthquakes remained below 400 events per month until November 2012. Courtesy of INGEOMINAS. |
Compared with 2010 activity, fewer seismic swarms were detected in 2011 and in the available record for 2012 (table 2). In 2011, swarms tended to cluster beneath the dome complex and in areas ~2 km S and SE. INGEOMINAS frequently noted earthquake epicenters in an area known as Moralito, a location SE of the volcano near the MRAL GPS station (see figure 4). Deeper earthquakes (frequently at depths between 7 and 18 km) were detected in that region and were attributed to displacements along a fault zone.
Table 2. Seismic swarms detected at Machín during 2010-2012. Days were counted and tallied based on whether one or more swarms occurred. For example, during January-February 2010 there were six swarms recorded. Courtesy of INGEOMINAS.
| Time Period | Days with swarms |
| Jan-Feb 2010 | 6 |
| Mar 2010 | 1 |
| Apr-Jun 2010 | 8 |
| Jul-Dec 2010 | 27 |
| Jan-May 2011 | 14 |
| Aug 2011 | 1 |
| Jan-Apr 2012 | 4 |
| Sep-Oct 2012 | 6 |
Local residents felt shaking from earthquakes in September 2011 when six occurred with magnitudes greater than 2.5. INGEOMINAS reported that this month had the largest combined free-energy release that year. The largest magnitude event of that group was an M 3.6 volcano-tectonic (VT) earthquake detected at 2013 on 12 September. The average depth of the earthquakes was 4.5 km with some events as deep as 13 km. Epicenters were primarily clustered in the area of Moralito (near the MORA seismic station, see figure 9).
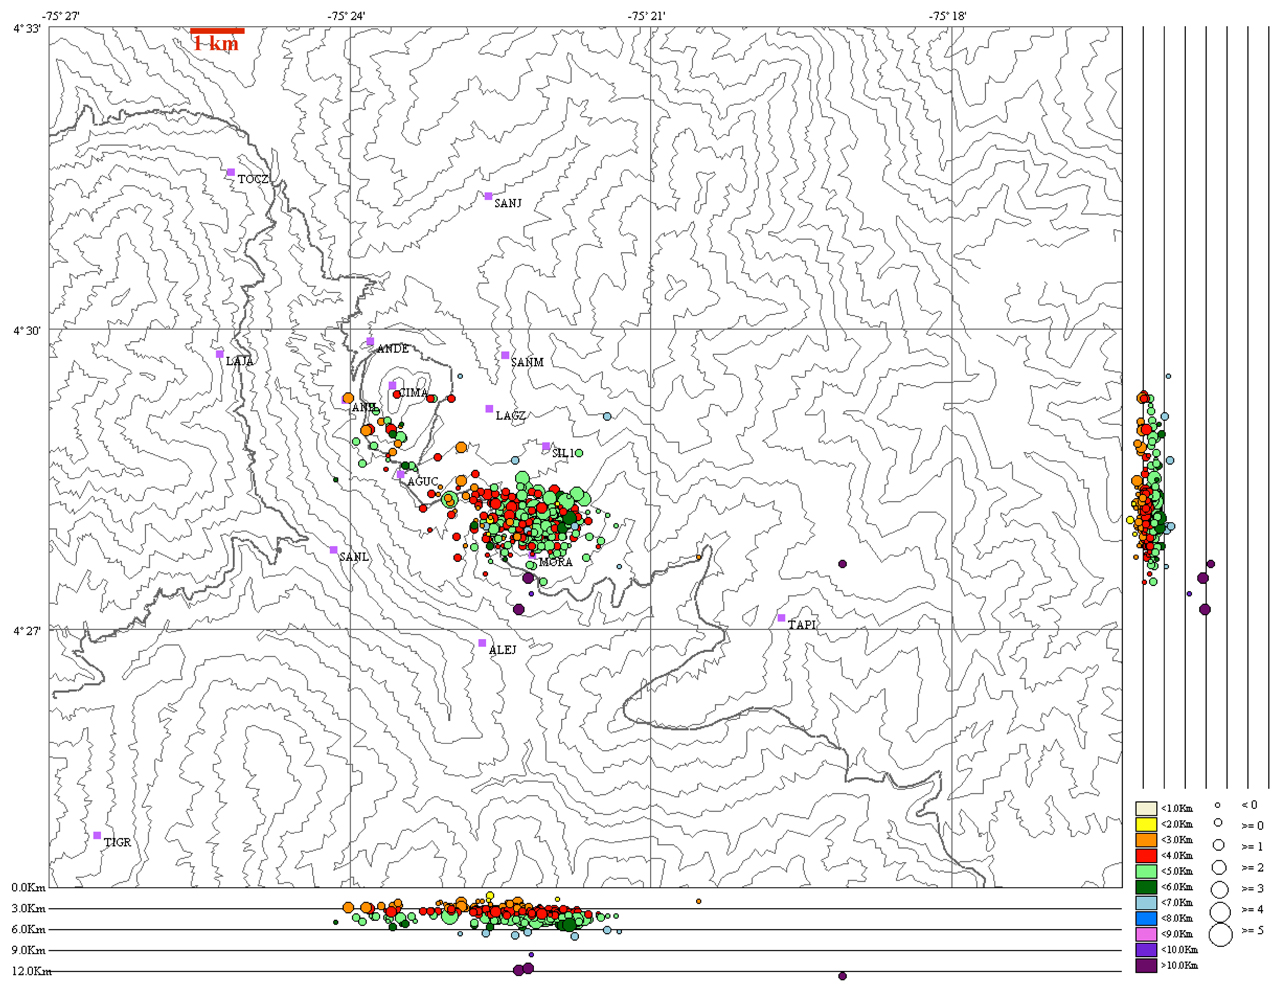 |
Figure 9. During September 2011, several moderate-sized earthquakes were located in an area SE of Cerro Machín. Seismic stations are labeled and located at purple squares. Note that the summit of Machín sits ~4 km NW of the clustered earthquakes, near the CIMA seismic station. Courtesy of INGEOMINAS. |
In December 2011, INGEOMINAS reported that rockfall-type seismic signals were detected within the area. A total of 19 signatures were counted on 11 December; some events had durations up to 73 seconds. The largest earthquake that month was an M 2.32 that occurred at 0542 on 1 December.
Seismicity from January to November 2012. Rockfall-type signatures were also recorded in January 2012. These events occurred on 10 January at 1556 and lasted up to 64 seconds. As frequently observed during previous months, VT earthquakes tended to occur beneath the dome, S, and SE in the area of Moralito.
From January to August 2012, seismic swarms occurred intermittently (table 2). Elevated seismicity occurred during April 2012 and was felt by local residents. During this time period, the largest earthquake was an M 2.8 VT detected on 11 April at 0655. In April, VT earthquakes clustered ~1 km S of the dome complex and were ~4 km deep.
During May-August 2012, earthquakes were rarely clustered and occurred at a wide range of depths (0-16 km). In August, several earthquakes were located ~8 km SE of the CIMA station at depths between 12-15 km. The largest earthquake that month was an M 1.45 detected at 2026 on 9 August.
During September-October, seismic swarms occurred on six days (table 2). Local residents in the municipalities of Cajamarca and Ibagué (locations appear in figure 2 of BGVN 36:04) as well as the nearby departments of Quindio, Risaralda, and Caldas reported shaking due to these earthquakes (locations of these districts appear in the regional map of figure 5 in this report). These events were clustered beneath the dome complex at depths between 2 and 5 km. In October, however, relatively large earthquakes were detected in an area ~8 km SE of the dome at depths around 13 km. The largest earthquakes were on 9 September (M 3.6) and on 7 October (M 4.6) prompting INGEOMINAS staff to visit residences and investigate the impact of the events (figure 10). The M 4.6 earthquake was one of several located SE of the dome (near the TAPI seismic station, see figure 9).
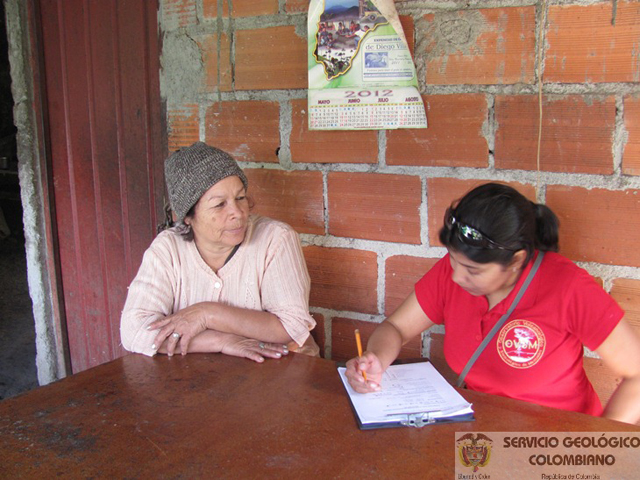 |
Figure 10. A visit to areas around Machín by INGEOMINAS staff in order to evaluate the possible damage from seismic unrest that was detected on 7 October 2012. Courtesy of INGEOMINAS. |
In November, INGEOMINAS reported that VT earthquakes continued to occur beneath the dome although at a reduced rate compared to October. Earthquakes tended to occur 2-5 km beneath the dome, and deeper events were detected to the SE at depths between 9 and 15 km. The largest earthquake detected was an M 2.8 on 20 November at 1754. This earthquake was located at a depth of 2.75 km and was ~2 km SW of the dome complex.
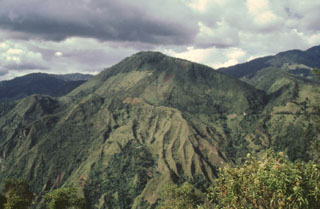
Geological Summary. The small Cerro Machín stratovolcano lies at the southern end of the Ruiz-Tolima massif about 20 km WNW of the city of Ibagué. A 3-km-wide caldera is breached to the south and contains three forested dacitic lava domes. Voluminous pyroclastic flows traveled up to 40 km away during eruptions in the mid-to-late Holocene, perhaps associated with formation of the caldera. Late-Holocene eruptions produced dacitic block-and-ash flows that traveled through the breach in the caldera rim to the west and south. The latest known eruption of took place about 800 years ago.
Information Contacts: Instituto Colombiano de Geologia y Mineria (INGEOMINAS), Observatorio Vulcanológico y Sismológico de Manizales, Manizales, Colombia (URL: https://www2.sgc.gov.co/volcanes/index.html).