Report on Nevado del Huila (Colombia) — January 2013
Bulletin of the Global Volcanism Network, vol. 38, no. 1 (January 2013)
Managing Editor: Richard Wunderman.
Edited by Julie A. Herrick.
Nevado del Huila (Colombia) Dome growth and displaced glacier in 2009; decreasing activity during 2010-2012
Please cite this report as:
Global Volcanism Program, 2013. Report on Nevado del Huila (Colombia) (Herrick, J.A., and Wunderman, R., eds.). Bulletin of the Global Volcanism Network, 38:1. Smithsonian Institution. https://doi.org/10.5479/si.GVP.BGVN201301-351050
Nevado del Huila
Colombia
2.93°N, 76.03°W; summit elev. 5364 m
All times are local (unless otherwise noted)
Lava dome emplacement occurred at Nevado del Huila's Pico Central (central peak) in late 2008, and was accompanied by seismic unrest and significant sulfur dioxide (SO2) emissions (BGVN 37:10). Extrusion continued between November 2008 and November 2009. Ash plumes were frequently observed by webcameras during late 2008 to December 2009, and satellite imagery reviewed by the Washington Volcanic Ash Advisory Center (VAAC) detected intermittent ash emissions between October 2009 and April 2011. From January 2009 to December 2012, the Instituto Colombiano de Geología y Minería (INGEOMINAS) reported persistent emissions from the lava dome and dramatic changes to the perched glacier as the lava dome expanded across the E and W flanks. Activity generally decreased in November 2010 through 2012.
In this report, we focus on the time period of December 2008-December 2012 and also discuss monitoring efforts overseen by INGEOMINAS with collaborators such as the Colombian Air Force (FAC), the Washington VAAC, and the Sulfur Dioxide Group's Ozone Monitoring Instrument (OMI). The following subsections review webcamera and aerial observations, thermal-camera imaging, satellite images of volcanic plumes, seismicity, SO2 measurements (DOAS, Flyspec, and OMI), acoustic flow monitoring, and new tilt data. The local monitoring network was expanded during this reporting period, adding two infrasound monitoring stations in 2009 and 2012, two webcameras in 2010 and 2012, and instrumentation at the Caloto site that included a broadband seismometer and an electronic tilt station in 2012.
Web-camera observations. From December 2008 to December 2009, the Tafxnú web-camera (located ~15 km S of the volcanic edifice) frequently recorded gas-and-ash plumes rising higher than 2,000 m above the active dome (figure 26). In 2009, plumes (frequently ash-and-gas, but in some cases gas without ash) rose to maximum heights above the dome as follows: 1,000-2,000 m in June; 1,000-2,500 m in November; and 2,000-5,000 m in December.
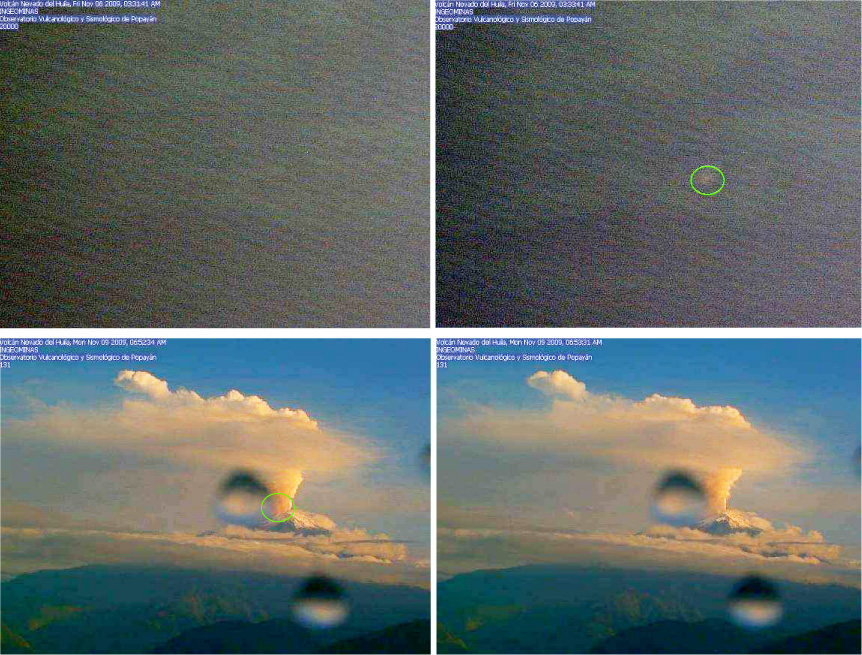 |
Figure 26. On 6 and 9 November 2009, summit activity from Nevado del Huila was observed by INGEOMINAS' N-looking Tafxnú web-camera. Accelerated dome growth was noted by INGEOMINAS that month (discussed in text below), and they annotated this image to circle the location of incandescence and summit activity. Note that these images have been altered from the originals; GVP staff increased the brightness and contrast in order to better distinguish the peaks of the Huila complex. (Top images) Incandescence on 6 November was absent at 0331 (left image) but appeared at 0333 within the green circled region (right image). INGEOMINAS suggested this incandescence resulted from dome collapse events exposing hot rock. The darker peak centered in the foreground is Pico Sur, while the active Pico Central is located higher and to the right of that peak in these images. (Bottom images) Plumes of ash and gas drifting NW from Pico Central were observed on 9 November at 0652 (left image) and 0653 (right image). The green circled region in the left-hand image corresponds to the same location circled in the image from 0333 on 6 November. Two water droplets on the camera lens created the local circular distortions. Courtesy of INGEOMINAS. |
An additional camera was brought online in July 2010, located in the town of Maravillas (~10 km SE). A third camera, located at the Caloto site (~4 km SSW of the active dome) came online in July 2012 (figures 27 and 28).
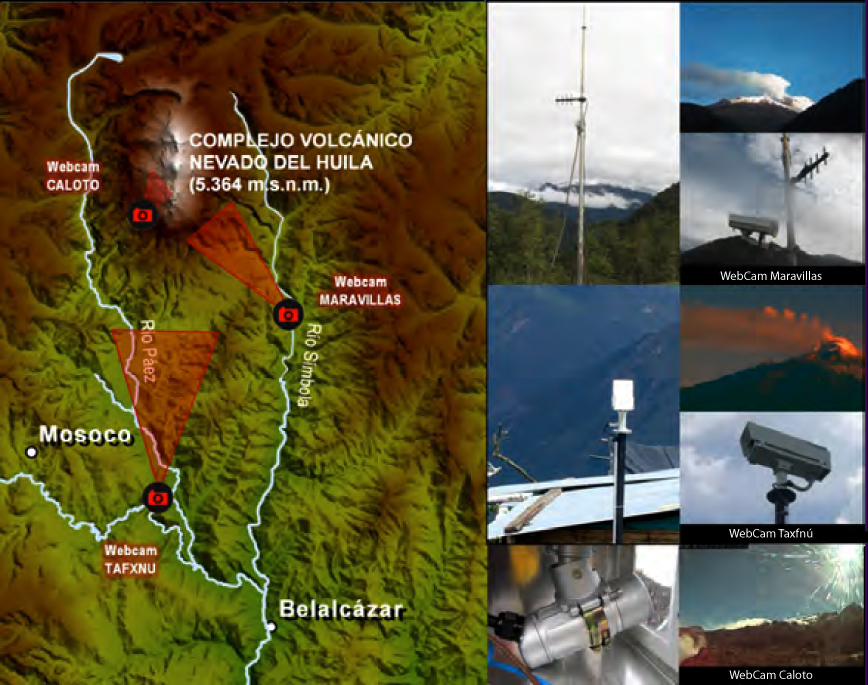 |
Figure 27. This composite image shows, at left, a map view of the three Nevado del Huila webcamera locations and the extent of their viewsheds. Photos at right show camera installation sites. The newest monitoring station (Caloto) was installed on 19 May 2012 on the SW flank. Courtesy of INGEOMINAS. |
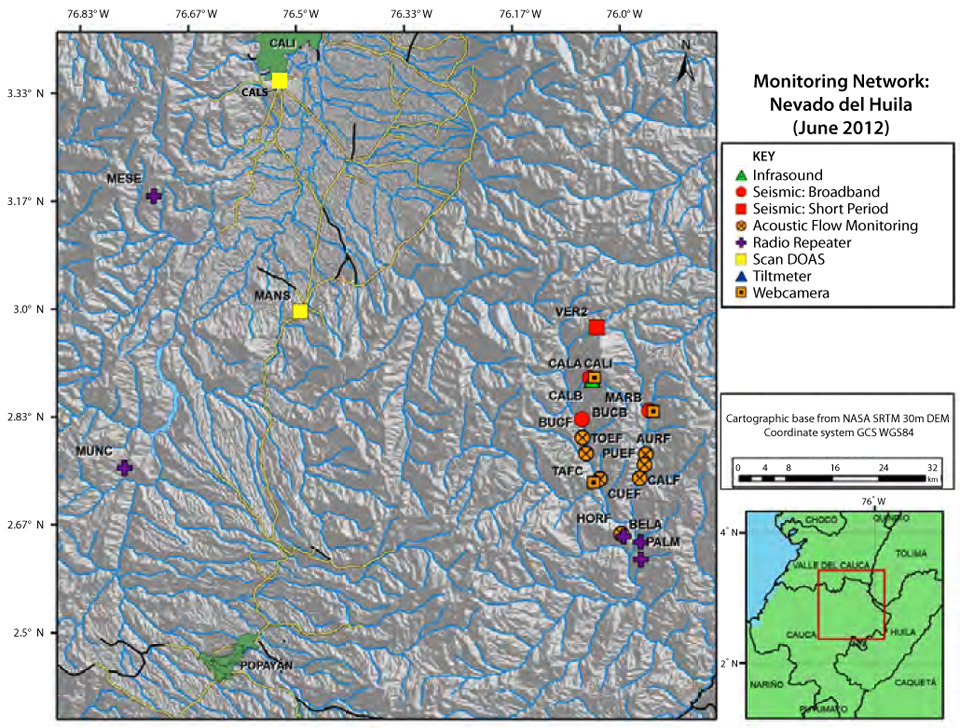 |
Figure 28. A map of monitoring stations for Nevado del Huila from June 2012 included locations of webcameras and seismic, geochemical, and geophysical instruments. The summit of Pico Central is located approximately beneath the text BUCB. Note that yellow and black lines represent major and minor roads, respectively, and blue lines represent rivers. Courtesy of INGEOMINAS. |
Observations of dome growth and summit activity during 2009-2010. With support from the Colombian Air Force (FAC) during 2009-2012, INGEOMINAS monitored dome growth and geomorphological changes at Huila by conducting aerial observations with helicopters.
During February 2009 and June-December 2009, INGEOMINAS reported numerous episodes of tremor that were likely associated with ash emissions, but cloud cover and nightfall sometimes precluded direct observations. Notable ash plumes were observed on 11 February, 23 July, 3 August, 16-23 October, and 3, 9, 12, 13 and 15 November; ashfall was noted by observers on all days except 11 February. A crack that had formed along the N face of Pico Central in 2007 continued to steam during this time period.
During three overflights conducted in January 2009, INGEOMINAS determined that the Pico Central lava dome had grown since November 2008. With repeat aerial photography, scientists calculated a total dome volume of 52 x 106 m3 with dimensions of 1,000 m N-S and 250 m E-W. The fresh dome rock continuously degassed (figure 29). Tafxnú webcamera images also showed that gas emissions frequently rising above Pico Central were often blue-colored. Due to continued unrest at Nevado del Huila (note that this name is shortened to 'Huila' during the remainder of this report), especially seismicity and active dome growth at Pico Central, INGEOMINAS maintained Orange Alert (Alert Level II; the second highest Alert Level on a 4-color scale from Green/IV-Yellow/III-Orange/II-Red/I) during January-February 2009.
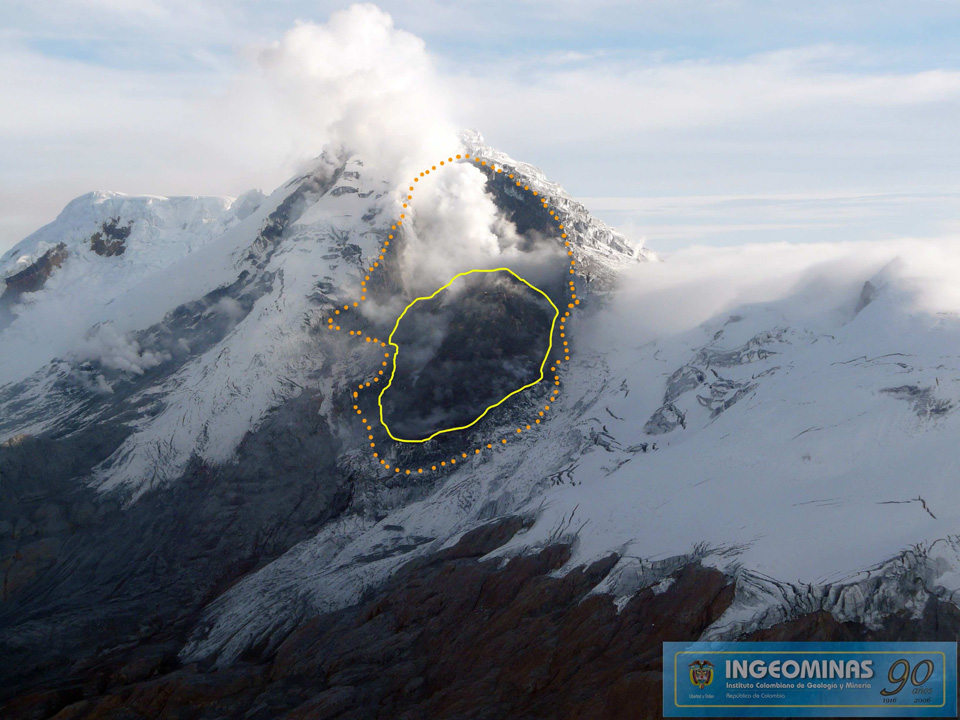 |
Figure 29. On 28 January 2009, the FAC facilitated observations of Nevado del Huila's growing lava-dome. In this view, the SW flank (centered) emitted a small gas column. This image highlights the zone of active lava dome growth (outlined in yellow) and the perimeter of the crater (outlined in orange). Courtesy of FAC and INGEOMINAS. |
On 11 February 2009, a small pulse of tremor was accompanied by an ash plume discharged at Pico Central which was captured by the Taxfnú webcamera during 0745-0751. During that time period, INGEOMINAS noted a small pulse of tremor. On 23 February, an INGEOMINAS passenger on a commercial aircraft saw diffuse gas escaping from both the crater that hosts the dome and from the N-flank crack. During March, the webcamera frequently showed degassing from the crater and the lava dome. Clear conditions enabled observers on commercial flights to observe a white plume rising from Pico Central in the morning of 10 March. INGEOMINAS noted that both seismicity and remote observations of dome growth indicated decreased activity since February. Accordingly, on 31 March 2009, INGEOMINAS reduced the Alert Level to Yellow (II).
Aerial observations in April highlighted the presence of ash covering the S glacier, confirming the ongoing eruption. Elevated temperatures were concentrated at the extreme high and low points of the dome and degassing continued from the higher-elevation portion of the crater (figure 30).
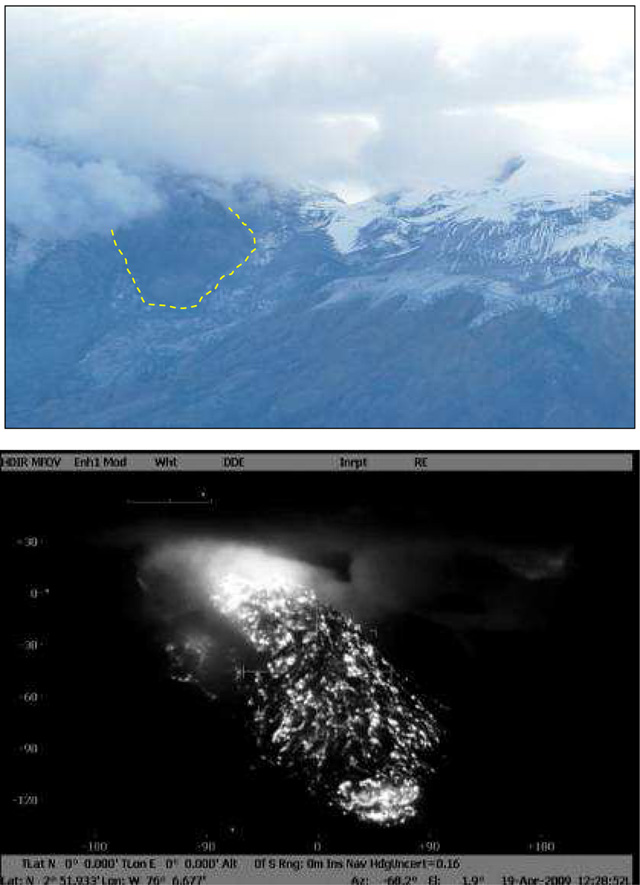 |
Figure 30. Photos taken on 19 April 2009 showed Nevado del Huila's active dome and the adjacent ash-covered and locally disturbed glacier. (top) In this visible-light view, the active lava dome has extended down the SW flank of Pico Central (yellow line). Cloud cover obscures the upper peaks of Pico Central (left) and Pico Sur (right). The glacier around Pico Central is difficult to distinguish due to ash cover and cracking attributed to dome emplacement. (bottom) This image is a close-up of the lava dome's SW flank with a forward-looking infrared (FLIR) camera which disclosed higher thermal flux from the dome's upper and lower regions. Gas emissions had been more concentrated from the higher region of the dome, however, the bright glow in this image may also be due to the reflective cloud-cover seen in the visible-spectrum image (top). Courtesy of FAC and INGEOMINAS. |
During May and June 2009, the dome's surface continued to produce thermal anomalies, and dome growth was inferred based on the observable fragmentation of dome rock and a wider distribution of fresh material. INGEOMINAS noted that the color of the extruded material in the higher region of the dome had changed to a red-brown color (earlier dome rock was distinctively gray).
On 23 July ashfall was reported at the local military base in Santo Domingo and José Jair Cuspian (Caloto). They reported ashfall in the NW sector of the volcanic edifice. INGEOMINAS reported that this ash event coincided with a pulse of tremor registered that day at 0442.
On 3 August there was a pulse of tremor at 0036 and INGEOMINAS received reports of ashfall in the municipalities of Toribío and Santander de Quilichao (~30 km and ~50 km W of the edifice, respectively). Aerial observations on 16 August established that the crater had grown wider.
During September 2009 there were no major changes observed via webcam. On 16 and 23 October, reports of widespread ashfall came from various municipalities of N Cauca, Valle del Cauca, and in the foothills around the volcano (departments of Cauca, Valle, Tolima, and Huila) (figure 31). There were also reports of sulfur odors from the most proximal communities.
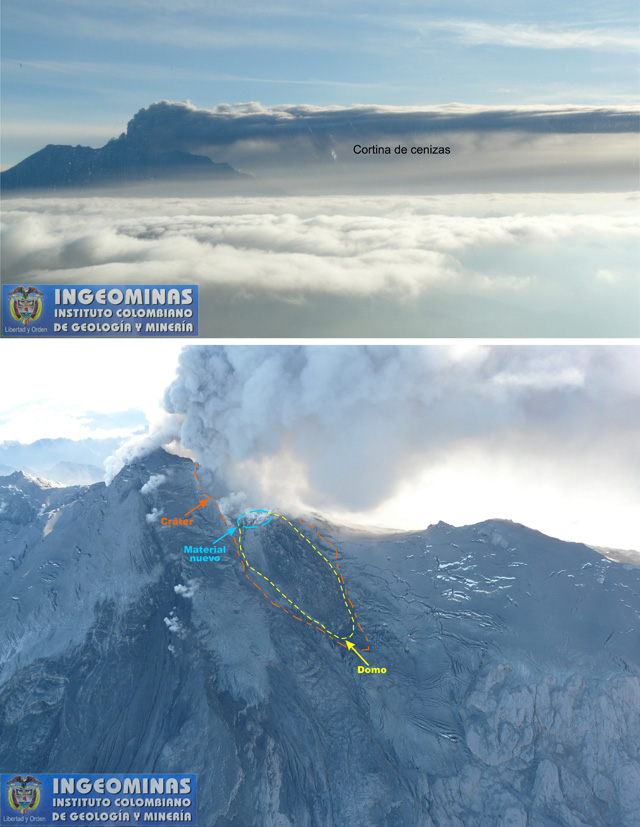 |
Figure 31. An ash plume from Nevado del Huila's newly-formed crater and fumarolic sites was observed from aircraft on 23 October 2009. (top) A dark curtain of ash ("Cortina de cenizas") drifted SE from Pico Central that day; the plume height was ~1,000 m above the crater. The Washington VAAC reported ash in satellite images at 1015 that day, and noted that the ash plume rose to 6 km altitude, was ~46 km long, and drifting SE at 5 m/s. (bottom) A closer view of the W flank highlights gas-and-ash plumes rising from the upper crater (orange outline) while isolated sites released white plumes, including the site on the N flank of Pico Central (at left) where steam from a fissure had been observed consistently since November 2007. The accumulation of newly erupted material was typically observed from the upper region of the dome (circled in blue); the extent of the dome is outlined with yellow. Ashfall had covered the snow and glaciers of Huila; however, cracks in the glacier remained visible as jagged black and white lines, particularly on Pico Sur (right-hand edge of photo). Courtesy of FAC and INGEOMINAS. |
At 0541 on 16 October 2009, the webcamera captured images of an ash plume rising in pulses from Pico Central and drifting E. Accordingly, the Alert Level was raised from Yellow (III) to Orange (II), where it stayed until 5 January 2010. An overflight on 23 October provided views of both intense fumarolic activity from the dome and a column of ash that reached up to 1,000 m above the crater. The summit and glaciers were covered by ashfall, lava extrusion was continuing from the upper region of the crater, and there were thermal anomalies where gas emissions were concentrated. An 11-minute-long episode of tremor that began at 0200 on 28 October was thought to signify dome rock extrusion.
Based on observations during overflights on 30 October and 2 November, INGEOMINAS calculated that the dome volume had increased by ~9 x 10⁶ m3 since the previous estimate in January 2009. Aerial observers saw ash emitted in pulses.
Rapid dome growth occurred in November as witnessed during five aerial investigations (2, 4, 6, 10, and 25 November). On 3 November, an explosion was heard and ashfall was reported by the communities of Inzá, Mosoco, Jambaló y Belalcázar, and other communities SW of the volcano. New layers of ash had accumulated around the summits of Huila, often appearing brown-red as opposed to the gray material deposited in previous months (figure 32). A weekly INGEOMINAS report announced that by 10 November 2009, the dome volume had increased by ~16 x 106 m3 since the previous estimate, more than doubling the amount of growth that had occurred during January-October 2009.
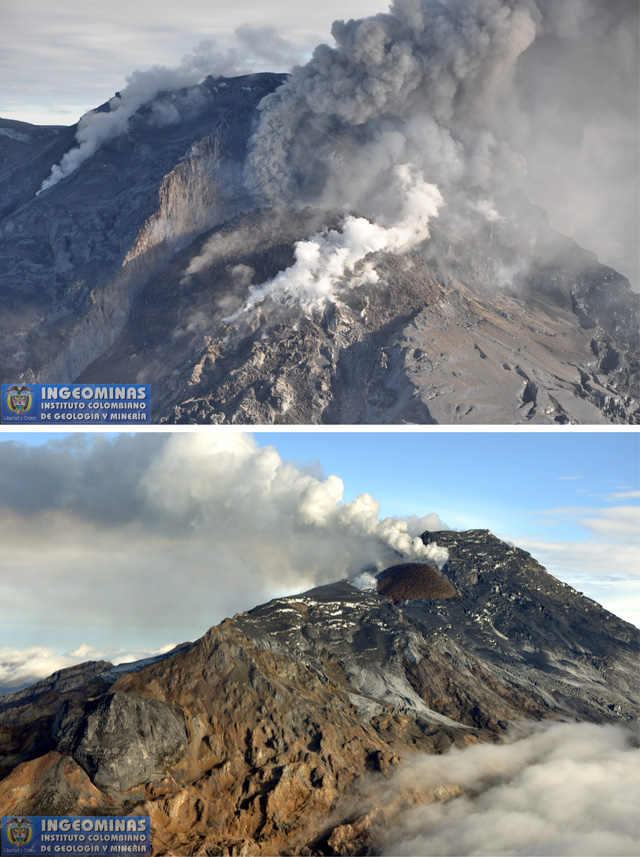 |
Figure 32. Aerial photos from November 2009 documented rapid changes on Nevado del Huila's Pico Central. (top) On 4 November INGEOMINAS observed additional ejecta surrounding the lava dome and elevated ash emissions. In this photo of the S face of Pico Central, steam and ash rise from the crater, and brown-red ash and blocks cover the glacier that surrounds the active dome. Dome rock extends from the center of Pico Central to lower elevations on the W flank. (bottom) This view of Nevado del Huila's SE flank on 25 November 2009 reveals the increased size of the lava dome which towers above Pico Sur, the rugged-looking peak centered in this view. Ash covered snow and glacial ice surrounds the immediate region of the dome while plumes of gas drift westerly. The dark gray, rounded peak to the lower left is Cerro Negro, the location of a seismic station that remained offline during this reporting period. Courtesy of FAC and INGEOMINAS. |
Gas emissions were observed by the webcamera at Tafxnú and during four overflights in December 2009; however, fumarolic activity dropped during the first week of December. Aerial observations determined that 2008 dome rock was being covered by 2009 lava that contained fewer large blocks; the 2008 dome material was distinctively more gray and blocky. During an overflight on 29 December, clear weather allowed INGEOMINAS scientists to observe minor dome collapse events, new cracks in the glacier along the lower E dome contact, and additional dome rock extending down the E flank.
In January 2010, dome growth continued and notably expanded the dome E by ~50 m, further displacing portions of the Pico Central glacier. Gray ash continued to be deposited in the area, covering the glacier surfaces. White plumes were observed this month during overflights and from the webcamera. On 5 January, INGEOMINAS reduced the Alert Level from Orange (II) to Yellow (III); this status was maintained until 15 June 2010.
On 22 February 2010, scientists on board an FAC helicopter noted displaced glacial ice, some steaming along the dome edge, and the surface textures of the 2008 and 2009 lava domes persisted (blocky vs. smaller clast sizes, respectively; figure 33). Based on aerial observations, INGEOMINAS calculated a total dome volume of at least 70 x 106 m3.
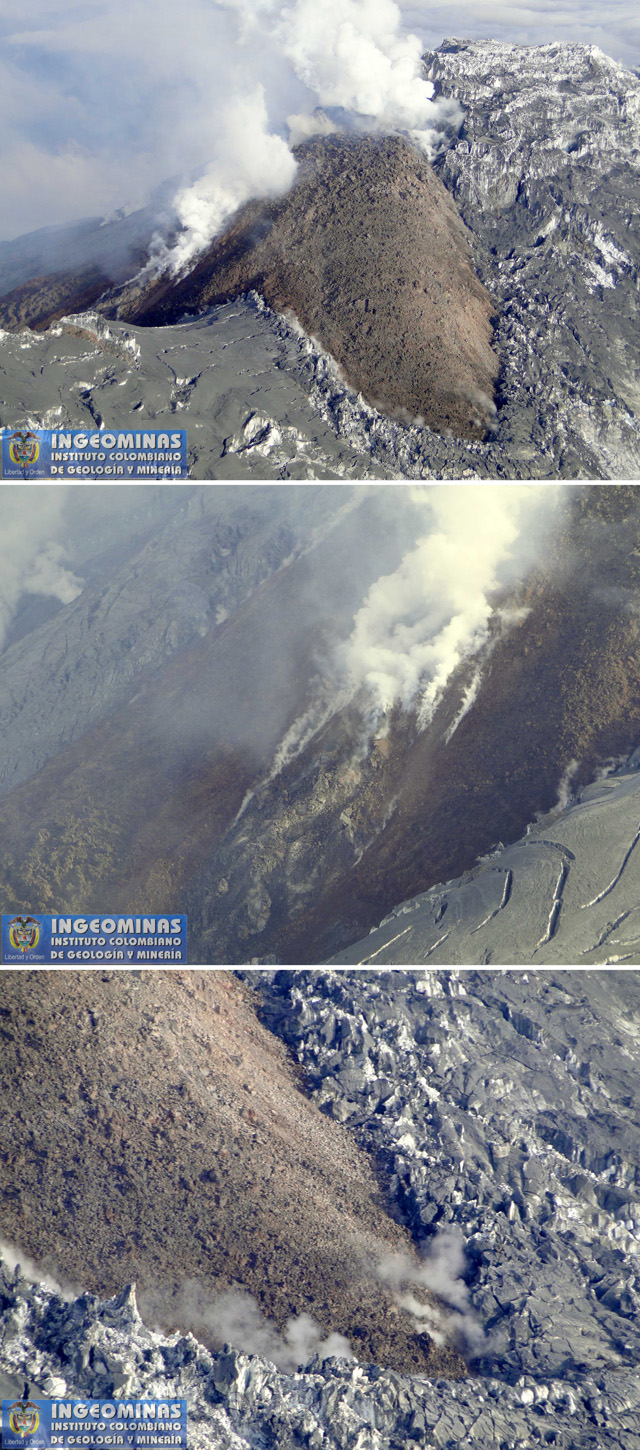 |
Figure 33. During an overflight on 22 February 2010, Nevado del Huila's active dome, displaced ice, and gas emissions were visible. Fresh volcanic material clearly began to extend W and E, divided by the long axis of the Huila complex. (Top) An aerial view of Pico Central's S-facing peak where the active dome was shedding material to the W and E. (Middle) Degassing dome rock is visible along the W flank. The blocky gray rock centered in this region was attributed to 2008 lava extrusion. (Bottom) New dome rock is in contact with the fragmented glacial ice on the E flank, and dome steaming is visible along the margin. Courtesy of FAC and INGEOMINAS. |
INGEOMINAS reported that on 12 April additional ash had accumulated on the glacier and lava extrusion was continuing. Columns of gas continued to be emitted from the surface of the new dome, at the contact of 2008 and 2009 lava, and from the crack that had formed in 2007 on the N flank of Pico Central.
No overflights were conducted in June, however the Alert Level was raised to Orange (II) due to increased seismicity, primarily hybrid earthquakes and SO2 emissions (see seismic and SO2 discussion below). INGEOMINAS suggested that the marked increase in hybrid earthquakes may have been linked with the ascent of new magmatic material within the volcanic edifice.
In July, degassing continued and intermittent, small ash emissions were observed toward the end of the month by the ground-based cameras Tafxnú and Maravillas. By 16 July, INGEOMINAS reduced the Alert Level to Yellow (III), due to the reduction in seismicity and SO2 flux, where it remained through August. The Washington VAAC reported possible ash plumes drifting from Huila during 28-30 of July but an absence of such plumes during August.
A 19 August flight revealed that snow had accumulated on the dome. INGEOMINAS noted that some episodes of tremor were likely related to the process of lava dome extrusion and these conditions did not show wide variations in August. Minor ash emissions were reported toward the end of the month. The Maravillas camera detected incandescence on 26 and 29 August, possibly from hot rockfalls from the lava dome.
A pulse of tremor on 30 August at 0635 coincided with ash emissions also observed by the Tafxnú camera. In the afternoon that day, people in the town of Toribío (~30 km W) noted an ash plume. There was also a report that the Símbola River changed color due to the presence of ash. The VAAC noted a hotspot at the summit in satellite images on 31 August.
During September, webcameras imaged plumes of gas as well as gray and reddish-colored emissions attributed to volcanic ash. These plumes were not visible in satellite imagery; however, the Washington VAAC released two notices on 9 September in response to reports from INGEOMINAS that ground-based observations included continuous emissions of gases and some ash.
During the first week of September, the Maravillas webcamera and local populations observed incandescence from the active dome; INGEOMINAS attributed the activity to hot rockfalls on the dome. On 9 September, INGEOMINAS raised the Alert Level to Orange (II); seismicity (particularly energetic tremor) and frequent incandescence were considerations for this announcement. On 9 September, both webcameras captured images of ash and incandescence. On 10 September, drumbeat earthquakes (earthquake signatures related to dome extrusion) had appeared in the seismic records. The last time that drumbeat earthquakes had been detected from Huila was in November 2008 (BGVN 37:10). By 21 September, INGEOMINAS announced that 1,799 drumbeat earthquakes had been detected over the past 13 days.
An overflight on 15 September determined that conditions at the dome were continuing to change; extrusion continued from the highest part of the dome (near the contact with the crater wall). They also observed a debris flow containing rocks and ice that had originated from the edge of the dome and had traveled ~1.5 km down the E flank (figure 34). By the end of the month, gas emissions continued and incandescence was observed by the webcameras.
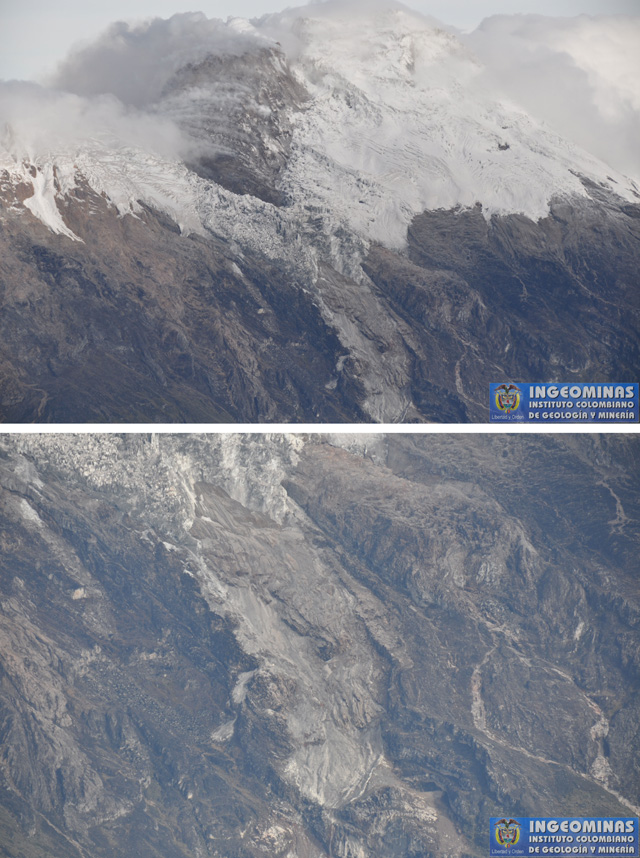 |
Figure 34. On 15 September 2010 INGEOMINAS observed debris flows along the E flank of Nevado del Huila. (top) Snow had visibly collected on the active dome that continued to degass and displace the glacier. Near the dome, the glacier was notably fragmented and discolored due to overlying debris and ash. (bottom) This view is a closeup of the area below the fragmented glacier on Huila's E flank. The extent of the debris flow is visible as a 1.5 km long trace of gray material that had incorporated blocks of ice and rocks. Courtesy of FAC and INGEOMINAS. |
Aerial observations on 29 September, 1 October, and 4 November confirmed ongoing dome growth. On 1 October, the VAAC reported ash drifting from the summit. On 12 October, INGEOMINAS reduced the Alert Level to Yellow (III); they stated that conditions appeared to have stabilized, in particular local seismicity and gas-and-ash emissions. The webcameras continued to capture images of white gas emissions during the second week of October. White plumes and some incandescence were visible in October. Thermal images from 4 November found that the W-central dome's temperature was 250°C. On 11 November the Washington VAAC reported ash drifting from the summit.
Observations during January-December 2011. The webcameras continued to record images of white plumes rising from the Pico Central dome throughout 2011. Aerial observations during the year noted frequent gas emissions and infrequent ash plumes. During an overflight on 25 January, a FLIR camera detected temperatures up to 90°C from various locations on the dome (figure 35). During an overflight on 29 March, observers noted degassing and odors of sulfur.
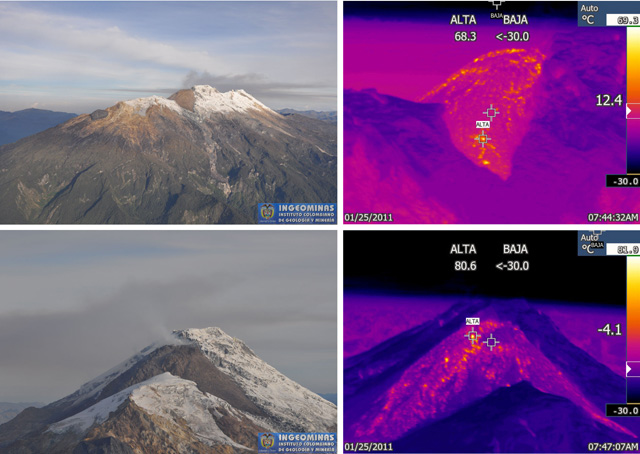 |
Figure 35. In these photo pairs taken during an overflight on 25 January 2011, INGEOMINAS measured surface temperatures of Nevado del Huila's lava dome. (top) These photos are centered on the E flank of Huila. The thermal image is zoomed in on the brown-colored lava dome that continued to steam and degass, forming a small plume rising above Pico Central. For the dome, the minimum ("BAJA") and maximum ("ALTA") temperatures were less than 30 and 68.3°C, respectively. (bottom) These photos are viewing the S-facing Pico Central with the lava dome (centered). Gas emissions were rising from the highest region of the dome and the minimum and maximum temperatures were less than 30 and 80.6°C, respectively. Courtesy of FAC and INGEOMINAS. |
On 19 April, the Washington VAAC reported that an ash plume was detected in enhanced multispectral imagery at 0315. The plume was drifting NNW from Huila. The announcement included a note that the ash plume did not appear to be the result of an explosive event. Later that day, after sunrise, INGEOMINAS confirmed that low seismicity was detected, a white plume was visible, but ash emissions were absent.
Aerial observations on 26 April included intense degassing from the NW side of the lava dome; the emissions were gray. A thermal camera detected temperatures of the dome in the range of 78-83°C. The glacier also appeared to have further deformed since the last aerial observations in March.
In May, degassing was observed with the webcameras on days where weather conditions permitted clear views. On 6 and 20 June, scientists confirmed that degassing continued during an overflight; they also observed the accumulation of snow on the lava dome as well as on the surrounding glacier. On 20 June, notable rockfalls were visible from the lava dome that contributed to scree along the dome's lower edges.
Degassing continued to appear in clear webcamera views and during overflights in June-July and September-December. Aerial observers on 22 October saw snow avalanches on the Pico Norte glacier and intense steaming from the upper regions of the dome.
Observations during January-December 2012. Throughout 2012, INGEOMINAS recorded observations of the dome based primarily on webcamera images. No major changes were noted in the weekly and monthly online reports; pervasive steaming and white plumes were frequently observed throughout the year by the two webcameras (Tafxnú and Maravillas). INGEOMINAS maintained Yellow Alert (III) during 2012.
One overflight was conducted by INGEOMINAS in 2012. On 14 January 2012, scientists observed the usual degassing and noted that snow had collected on the dome and glacier. That day's clear viewing conditions allowed detailed observations of the lava dome texture and INGEOMINAS attributed the spiny texture of the dome to late-stage extrusion (figure 36).
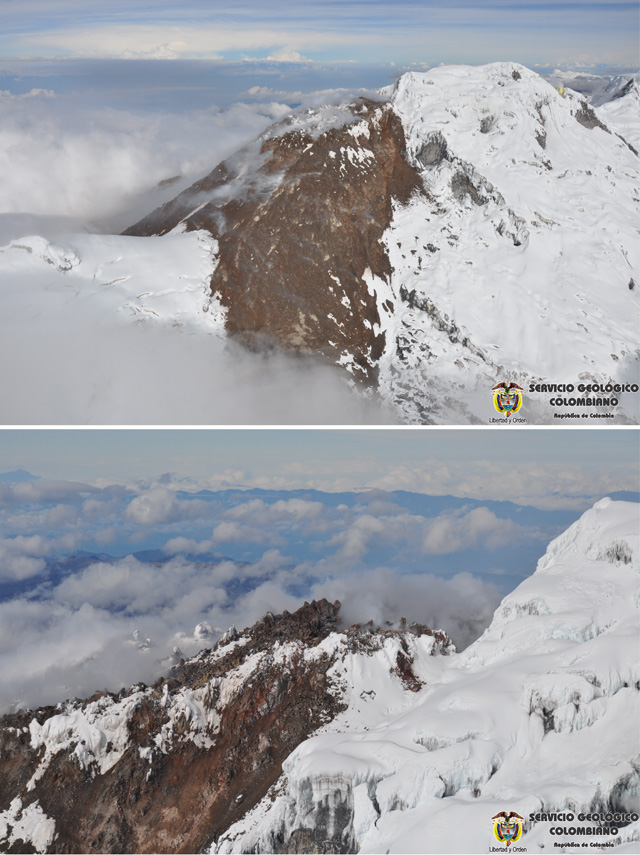 |
Figure 36. On 14 January 2012, clear conditions provided aerial views of Nevado del Huila's lava dome texture. (top) This view of the dome's SE face is centered on the part of the lava dome that had started to accumulate snow cover. Steaming was visible from some regions of the dome but a strong plume was not visible during this overflight. (bottom) INGEOMINAS noted that the higher region of the dome had distinguishable spines that may have formed recently. Courtesy of FAC and INGEOMINAS. |
Declining seismicity during January-August 2009. During 2009, four seismometers (two broadband and two short-period stations) were maintained by INGEOMINAS. Ash emissions in October 2009 temporarily disabled the short-period Verdún 2 station, located ~5 km N of the active dome. The Cerro Negro short-period station, closest to the active dome, was not operating during this reporting period (2009-2012). In general, three to four seismic stations were operating during 2009-2012.
In 2009, a total of nine earthquakes were large enough for people nearby to feel shaking; these events had magnitudes between 2.8 and 4.8 with focal depths between 6.2 and 12 km. The epicenters were 3-25 km away from the closest seismic station, CENE, which was located ~3 km S of Pico Central. INGEOMINAS highlighted these earthquakes in their monthly technical bulletins.
From January to September 2009, INGEOMINAS reported a decreasing trend in seismicity. In particular, volcano-tectonic (VT) and long period (LP) earthquakes were becoming less frequent on a monthly basis (figure 37). INGEOMINAS described VT earthquakes as resulting from rock-fracturing events, and LP earthquakes from fluid transport processes within the volcanic edifice. Large daily counts of LP earthquakes generally became less frequent over time. Low levels of tremor, hybrid events, and superficial activity (rockfalls and explosions) were detected throughout this time interval.
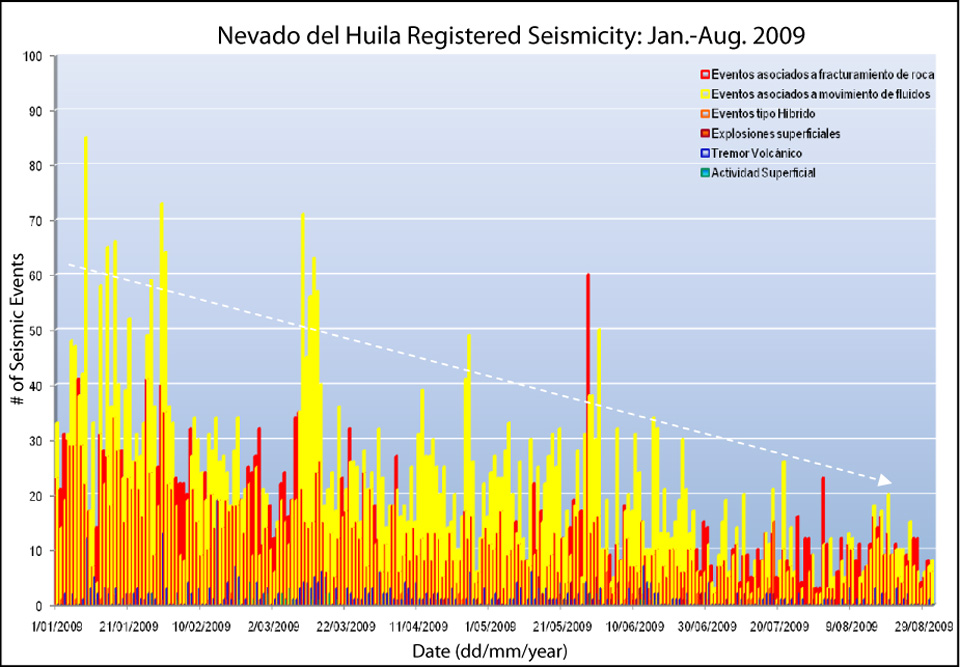 |
Figure 37. Nevado del Huila's seismicity, in particular VT, LP, and tremor earthquakes, decreased overall during January-August 2009. In this plot, the number of events were tallied per day and plotted over time. The legend in the upper right-hand corner lists terminology in Spanish that relates to these conventions: VT (red), LP (yellow), hybrid (orange), explosions (red with black outlines), tremor (blue), and surface activity such as rockfalls (green). Explosions were detected during this time period, but are difficult to read from this plot. Explosions were detected mainly in June and July; see previous subsection "Observations of dome growth and summit activity during 2009-2010" for descriptions of explosive activity. Courtesy of INGEOMINAS. |
Clustered epicenters in 2009. Beginning in January 2009, INGEOMINAS described a clustering of seismicity notable in distinct regions of the volcanic edifice. These consisted of three regions, the SW sector, the SE sector, and beneath the central edifice (Pico Central). This pattern was particularly clear in June, October, and December. The June 2009 map of seismicity appears in figure 38. The deepest earthquakes (8-12 km) tended to occur S of the edifice while shallow events were distributed throughout the area. Several deep and distal earthquakes occurred each month with depths between 10-20 km and epicenters up to 25 km from the edifice; these events have been attributed to regional faults.
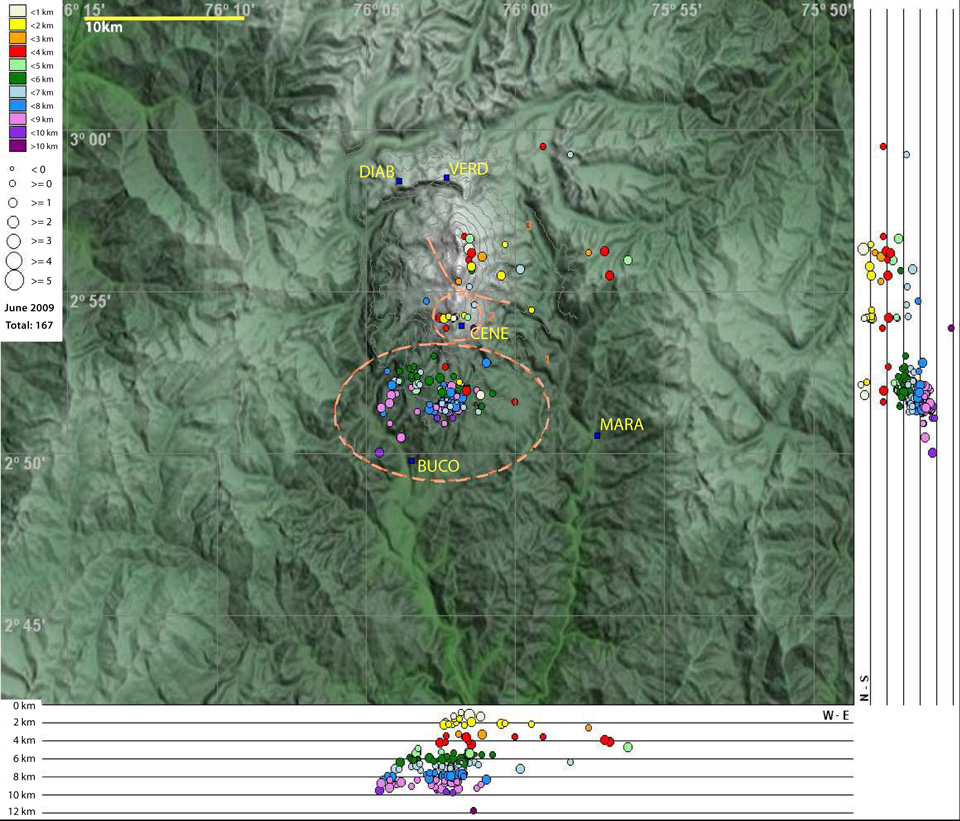 |
Figure 38. A map with cross-sections plotting epicenters and hypocenters of volcano-tectonic and hybrid earthquakes during June 2009 at Nevado del Huila. Three zones of clustered activity took place beneath the volcanic edifice (dashes lines). Note the yellow bar for scale (10 km) and the yellow text labeling five seismic stations (marked with blue squares). Four stations were operating; Cerro Negro (CENE) was offline during this reporting period. The active summit area of Pico Central is ~3 km N of the CENE station. Courtesy of INGEOMINAS. |
Peaks in seismicity and ash emissions between October 2009 and May 2010. INGEOMINAS reported an abrupt increase in seismicity in October 2009. The occurrence of VT, LP, hybrid, and tremor events had more than doubled since September. On 12 October, a swarm of VT events was detected (figure 39). During the onset of elevated seismicity, INGEOMINAS reported ash emissions during 17-21 October and the Washington VAAC released reports of ash observations from satellite imagery on 16 October.
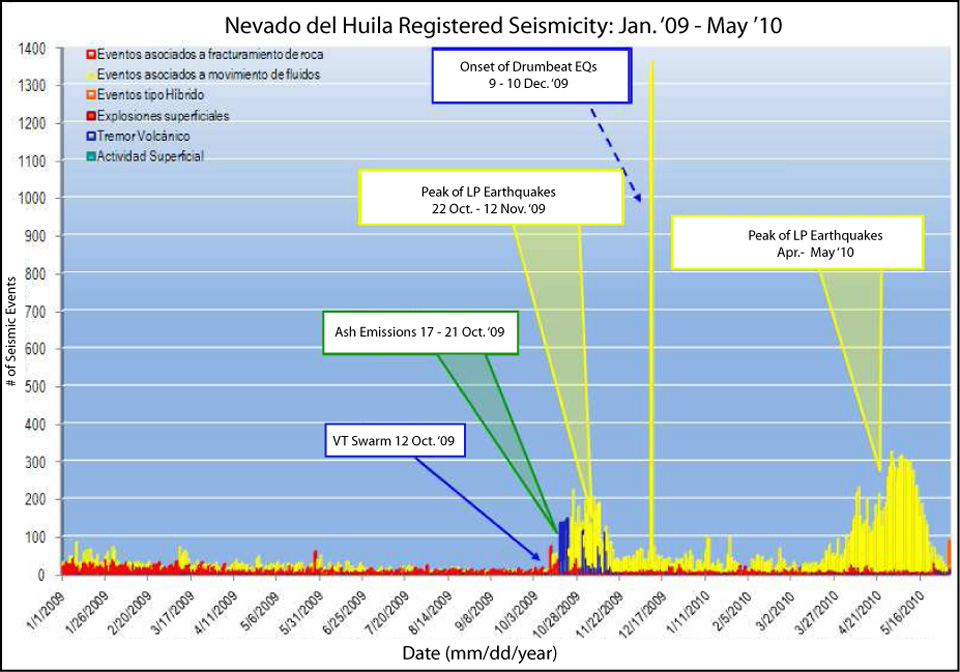 |
Figure 39. Seismicity from January 2009 through May 2010 detected from Nevado del Huila included notable peaks in LP earthquakes. In their May 2010 report, INGEOMINAS noted that tremor had been recorded continuously throughout January-May. The legend in the upper left-hand corner lists VT (red), LP (yellow), hybrid (orange), explosions (red with black outlines), tremor (blue), and surface activity such as rockfalls (green). Explosions were detected during this time period, but are difficult to read from this plot. Courtesy of INGEOMINAS. |
The appearance of volcanic ash in satellite images was periodically reported by the Washington VAAC from October through mid-November 2009. Aided by the web-camera Tafxnú, INGEOMINAS reported observations of ash plumes frequently occurring through November.
The Washington VAAC reported that, after 15 November 2009, volcanic ash was no longer visible in satellite images. In their monthly technical report, INGEOMINAS noted seismic signals suggesting ash emissions in December 2009, and visual observations of white plumes from the summit that were inferred to be gas-rich. As seen on figure 39, LP events peaked dramatically during 9-10 December when signals characterized as drumbeats were detected (see BGVN 37:10 for additional descriptions of drumbeat earthquakes). INGEOMINAS suggested the onset of drumbeat earthquakes was associated with the extrusion of new material to the surface and growth of the lava dome.
INGEOMINAS reported an average of 995 LP earthquakes per month during January-March 2010. VT events tallied on a monthly basis averaged 239 during that same time interval, suggesting an absence of discernible major changes in the volcanic system since the drumbeat earthquake swarm in December 2009. Tremor was detected more frequently over time and from February to May an average increase of 37 events per month was recorded.
As seen at the right on figure 39, during April-May 2010, very high LP seismicity returned. LP earthquakes peaked in May, with a total of 5,141 events. During April-May, the Washington VAAC released advisories in response to possible ash plumes from Huila, however, they did not detect ash due to frequent cloud cover, and because numerous reports indicated eruptions at night, when satellite instruments offer fewer means of detecting ash.
An ML 3.8 earthquake shook the towns of Toéz and Tálaga (15 km SSW and 22 km S respectively) at 0708 on 23 May. These towns are located SW of Pico Central. The earthquake was located 8.13 km SW of Pico Central and was 7.2 km deep (relative to the elevation of the active crater).
Seismicity and ash observations during June-December 2010. In June, direct observations of ash plumes were rare due to weather conditions; however, the Washington VAAC reported ash visible in satellite imagery on 2 June 2010. While LP seismicity remained low in early June 2010, hybrid seismicity emerged from background levels (figure 40). During January-May, typically 3-34 hybrid earthquakes were detected per month. By 14 June, more than 200 hybrid events were occurring per day; however, by 24 June, hybrid earthquakes had decreased to less than 50 events per day. Hybrid earthquakes, events INGEOMINAS attributes to the combined mechanisms of fluid transport and rock fractures, rarely dominate Huila's seismic records.
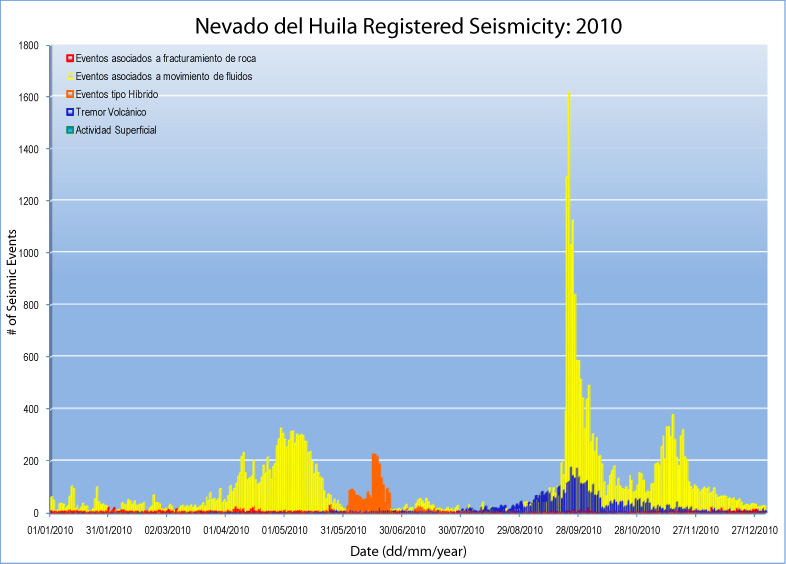 |
Figure 40. Seismicity from Nevado del Huila during 2010 included peaks of LP, VT, and tremor episodes. The legend in the upper left-hand corner lists VT (red), LP (yellow), hybrid (orange), explosions (red with black outlines), tremor (blue), and surface activity such as rockfalls (green). Explosions were detected during this time period, but are difficult to read from this plot. Courtesy of INGEOMINAS. |
As seen on figure 40, during August-November 2010, elevated tremor persisted (630-2,576 episodes per month). LP seismicity peaked in May and then twice between September and December. For the tallest peak (September 2010), counts reached more than 1,000 events per day.
On 3 December at 2054 a felt M 3.4 earthquake within the Páez River drainage centered 6.2 km S of Pico Central had a relatively shallow focal depth of 5.2 km (as measured beneath the crater). Another felt earthquake was reported by residents in the Belalcázar-Cauca area on 29 December. This ML 2.9 event occurred at 2106 with a focal depth of 8 km, located 8.5 km SW of Pico Central. This earthquake lacked any noticeable effect on the stability of the volcanic system.
Seismicity in 2011. In 2011, INGEOMINAS noted that both LP earthquakes and tremor were decreasing over time (figure 41). Tremor persisted at low levels. In June VT and LP earthquakes notably increased to 434 and 623 events, respectively, but returned to background levels during the following month.
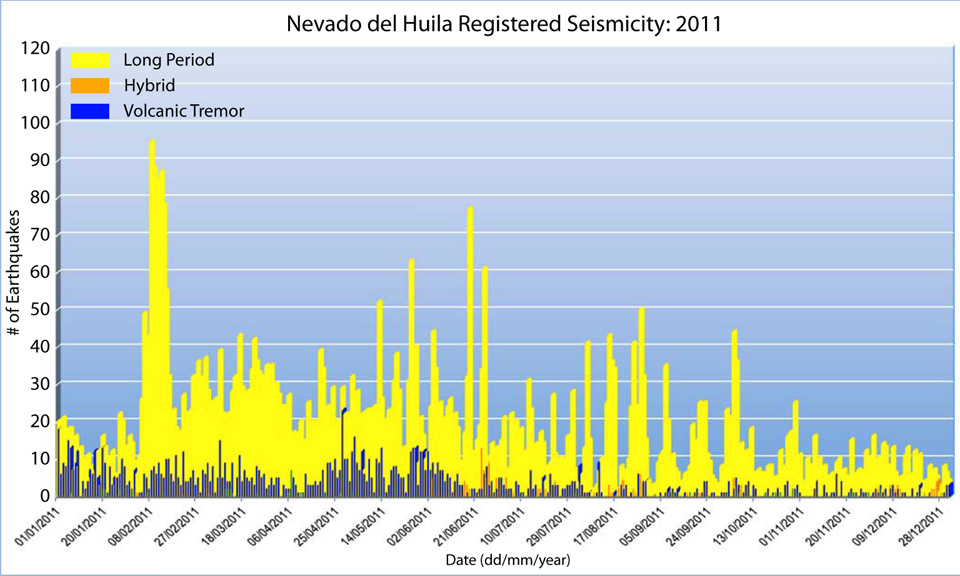 |
Figure 41. This plot of Nevado del Huila's seismicity during January-December 2011 shows a general decline in seismicity. This plot excludes VT earthquakes, highlighting instead the daily count of LP, hybrid, and tremor events. Courtesy of INGEOMINAS. |
In November 2011, several moderate earthquakes (M≤4) struck near Huila. In particular, three events had magnitudes 2.8, 3.2, and 4.0. For example, on 26 November, inhabitants of Mesa de Toéz felt an M 4.0 event whose epicenter was 8.5 km SW of Pico Central with a depth of 7.4 km (as measured below the crater). VT epicenters in November were widely distributed throughout the edifice and local region (figure 42). Depths of these earthquakes were within the range of past VT earthquakes (0-12 km). Persistent seismicity SW of Huila also continued in November.
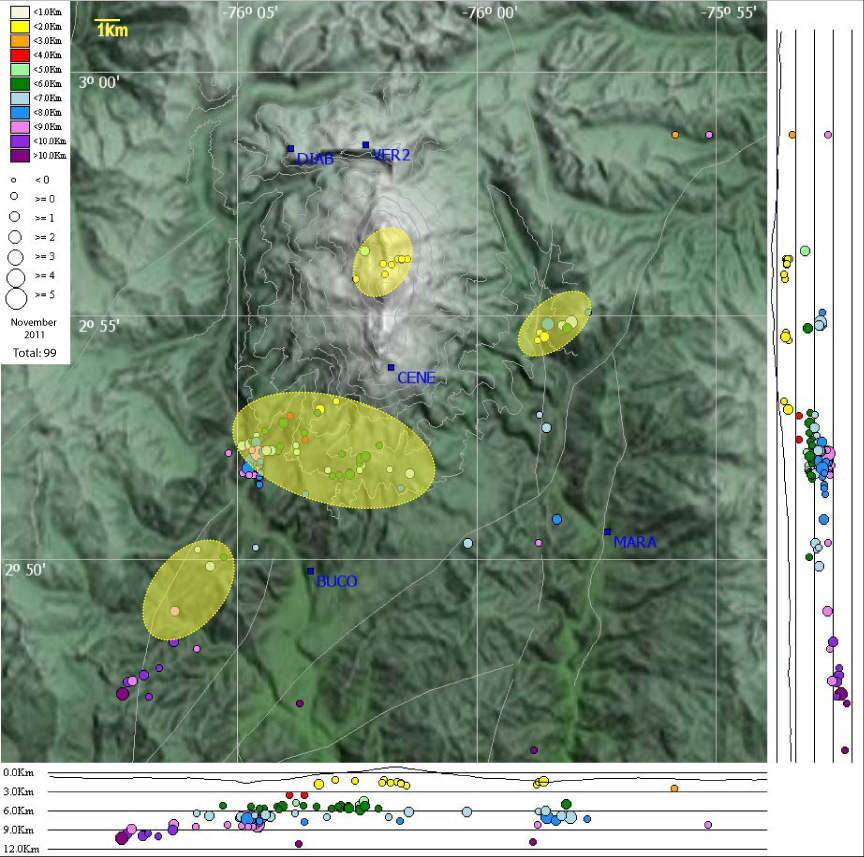 |
Figure 42. A map and cross-sections showing Nevado del Huila's VT epicenters during November 2011. The active dome is ~3 km N of CENE. INGEOMINAS noted four areas where seismicity was clustered (yellow shaded ovals). Note that the largest highlighted region has been an area of persistent seismicity throughout the year (for example, see figure 38). Seismic stations are marked with blue squares and labels (DIAB, VER2, CENE, BUCO, and MARA). Courtesy of INGEOMINAS. |
Seismicity in 2012. The low-level seismicity observed in the last months of 2011 continued through 2012. In a comparison with 2011, the average number of events per year was remarkably reduced in 2012 (VT, LP, and tremor); hybrid earthquakes, however, were the exceptions. The average for hybrid earthquakes per month was slightly higher in 2012 (table 4). Hybrid earthquakes were quite variable in number during 2011, ranging from 0 to 60 per month.
Table 4. Monthly counts for volcanic-tectonic, long period, tremor, and hybrid events detected at Nevado del Huila during 2011-2012. More event types and data appear in INGEOMINAS online reports. Courtesy of INGEOMINAS.
| Month | Volcanic-tectonic | Long-period | Tremor | Hybrid |
| Jan 2011 | 284 | 388 | 220 | 2 |
| Feb 2011 | 217 | 1,064 | 154 | 15 |
| Mar 2011 | 217 | 876 | 168 | 13 |
| Apr 2011 | 168 | 634 | 152 | 0 |
| May 2011 | 136 | 729 | 220 | 0 |
| Jun 2011 | 434 | 623 | 128 | 60 |
| Jul 2011 | 165 | 416 | 77 | 25 |
| Aug 2011 | 143 | 491 | 51 | 32 |
| Sep 2011 | 137 | 304 | 27 | 8 |
| Oct 2011 | 110 | 371 | 50 | 13 |
| Nov 2011 | 176 | 219 | 32 | 2 |
| Dec 2011 | 164 | 195 | 32 | 34 |
| 2011 Avg: | 196 | 526 | 109 | 17 |
| Jan 2012 | 155 | 245 | 27 | 28 |
| Feb 2012 | 111 | 159 | 12 | 18 |
| Mar 2012 | 145 | 200 | 27 | 21 |
| Apr 2012 | 154 | 244 | 19 | 21 |
| May 2012 | 87 | 200 | 34 | 13 |
| Jun 2012 | 121 | 183 | 11 | 18 |
| Jul 2012 | 109 | 208 | 14 | 16 |
| Aug 2012 | 118 | 178 | 15 | 30 |
| Sep 2012 | 93 | 172 | 5 | 14 |
| Oct 2012 | 168 | 257 | 18 | 23 |
| Nov 2012 | 171 | 205 | 9 | 14 |
| Dec 2012 | 158 | 227 | 26 | 32 |
| 2012 Avg: | 133 | 207 | 18 | 21 |
The wide distribution of epicenters noted in November and December 2011 persisted during January-February 2012, but fewer earthquakes were detected during these months. From March through December, significant clustering was absent, although, in October some events appeared concentrated along Huila's N-S axis.
The largest earthquake in 2012 occurred in March; a 3.8 earthquake shook the town of Toribio (in Cauca) at 0248 on 15 March. The epicenter was 1.8 km E of Pico Central with a focal depth of approximately 3.2 km. Seismicity that month was slightly higher than February (table 4). Throughout the year, VT earthquakes were typically less than M 2.6.
Infrasound monitoring 2009-2012. Augmenting seismic monitoring efforts, an infrasound station installed at the Diablo monitoring site (located ~5 km NNW of the active dome) became operational in July 2009. An additional acoustic monitoring system was installed at the Caloto station (located ~3.7 km from the active dome) in May 2012. Data collected with infrasonic microphones complements seismic instrumentation and can be analyzed with similar techniques. The method has also detected distant explosions from volcanoes such as Sakura-jima, Japan (BGVN 20:08), Fuego, Guatemala (BGVN 36:06), and Stromboli, Italy (BGVN 26:07).
Sulfur dioxide emissions during 2009-2012. INGEOMINAS conducted routine sulfur dioxide (SO2) gas monitoring with differential optical absorption spectroscopy (DOAS) equipment from January 2009 through December 2012. With this mobile scanner, INGEOMINAS conducted traverses along the Pan-American Highway between the cities of Calí and Popayán (figure 43).
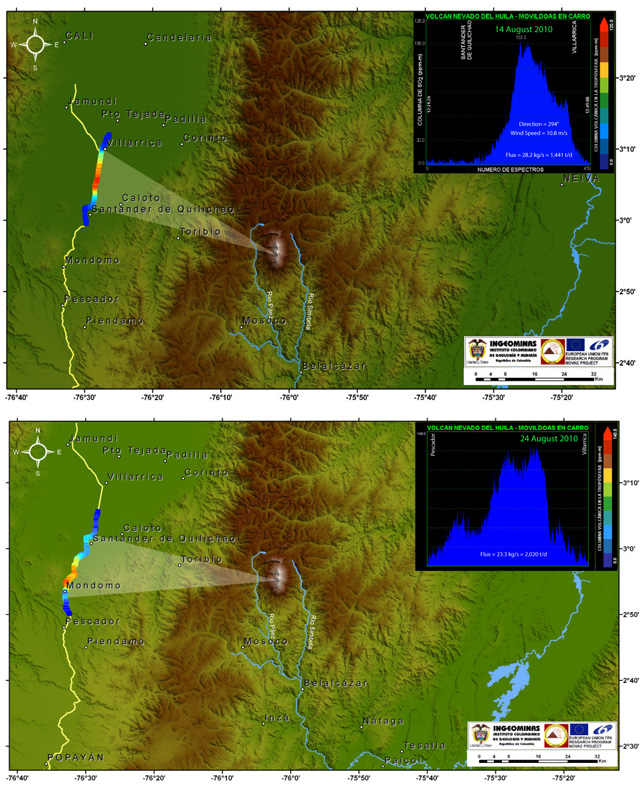 |
Figure 43. On 14 and 24 August 2010, INGEOMINAS technicians traversed routes along the Pan-American Highway with mobile DOAS equipment to measure Nevado del Huila's SO2 gas fluxes. These images include color-coded line segments that correspond to high and low concentrations (red and blue, respectively). The approximate locations of the plume have been shaded to correspond with the locations of high SO2 flux. The plots shows the wavelength on the x-axis and concentration-pathlength (ppm-m) on the y-axis. (Top) This image includes the mapped route between the towns of Santander de Quilichao and Villarrica where the gas plume was scanned on 14 August. The wind speed was 10.8 m/s, wind direction was 294°, and SO2 flux was 28.2 kg/s (1,441 t/d). (Bottom) This image includes the results from 24 August when field technicians traversed routes between Pescador and Villarrica. SO2 flux was 23.3 kg/s (2,020 t/d); wind speed and direction were not reported. Courtesy of INGEOMINAS. |
Scanning DOAS systems at fixed locations were operating during 2009-2012. During October 2009, elevated SO2 emissions were detected by the Calí and Santander de Quilichao stations (figure 44). In September 2009, a station was operating in Manantial (~53 km W of Huila).
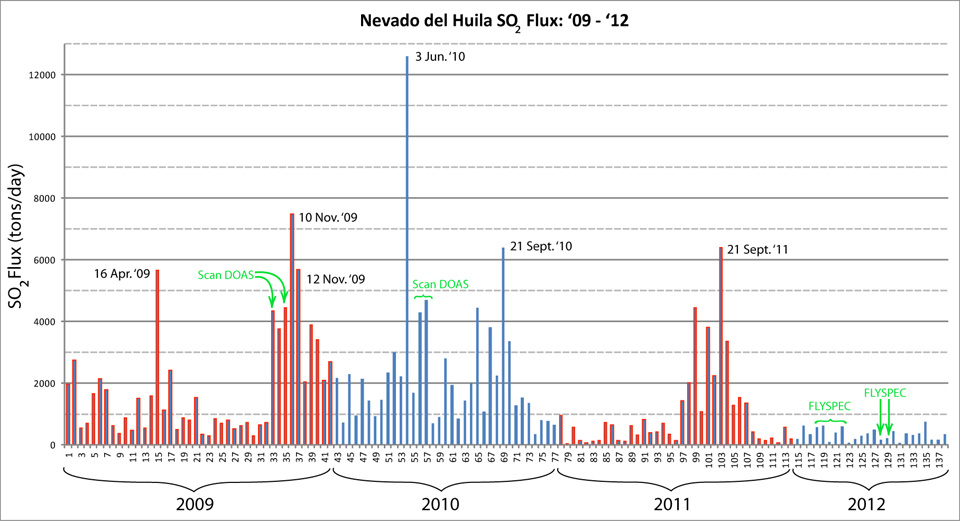 |
Figure 44. During 7 January 2009-27 November 2012, INGEOMINAS measured the SO2 flux from Nevado del Huila in a series of numbered campaigns (x-axis). A total of 137 values were reported from three detection methods, scan DOAS stations (corresponding to numbers 33 and 35 dating from October 2009, and 55-57 dating from June 2010), FLYSPEC (numbers 118-122 dating from May 2012, and 128 and 129 dating from August 2012), and mobile DOAS (all other values). Red and blue highlighting distinguishes the datasets from each year. SO2 detection was conducted several times each month and the maximum value from each measurement was reported. Courtesy of INGEOMINAS. |
Wind velocity has a strong bearing on the computed SO2 flux. In their December 2011 technical bulletin, INGEOMINAS discussed the variability in windspeed and direction, including the Weather Research and Forecasting (WRF) modeling system used for calculations during 2011 (figure 45). The WRF was public domain software available online and was developed in order to provide atmospheric simulations based on numerical modeling.
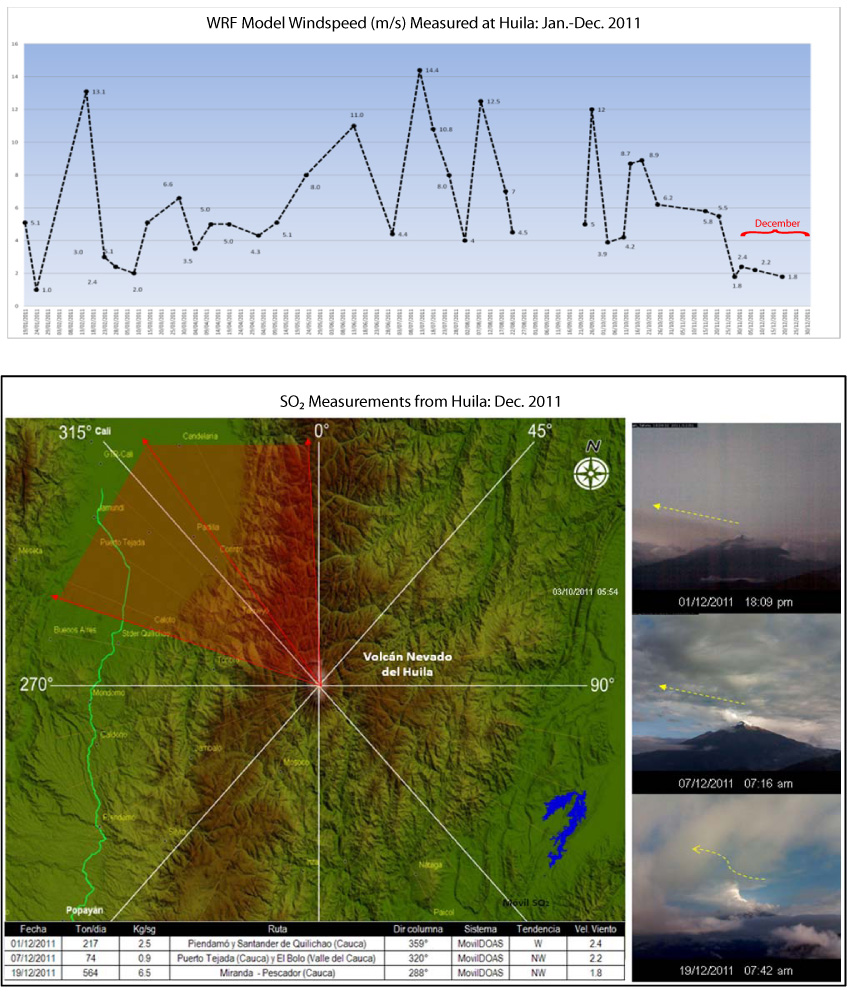 |
Figure 45. INGEOMINAS released the source of their windspeed data used for SO2 flux calculations in their December 2011 technical report. (top) This plot shows the datapoints used throughout 2011 for windspeed values determined by the WRF Model. (bottom) These images show a map of the expected aerial extent of the gas plume, a series of photos showing plume conditions during the SO2 surveys, and a table of the measurements from three surveys in December. Courtesy of INGEOMINAS. |
In May and August 2012, INGEOMINAS reported the results from FLYSPEC (a portable UV spectrometer) surveys and discussed the variations observed in SO2 flux. They emphasized that SO2 fluxes were low, a finding consistent with previous measurements during this post-crisis period (dome growth had ceased by November 2009). They also mentioned that seismicity had been low in May 2012, particularly in those events related to fluid motion (LP earthquakes, for example).
Flux calculations required wind speed data from the WRF models and daily forecasts from the Institute of Hydrology, Meteorology, and Environmental Studies (IDEAM), Colombia. Wind speeds in the range of 6-12 m/s during 8-29 May 2012 were applied to SO2 flux calculations.
Elevated SO2 emissions from Huila were detected almost daily by the OMI spectrometer during 2009-2012. The AURA satellite maps SO2 in the atmospheric column using ultraviolet solar backscatter. A flux can be estimated for the OMI spectrometer data by looking at the total mass of SO2 measured and the time it took to accumulate. On this basis, INGEOMINAS compared peaks in SO2 flux detected during traverses with DOAS (mobile and scanning) with OMI data for October 2009 (figure 46).
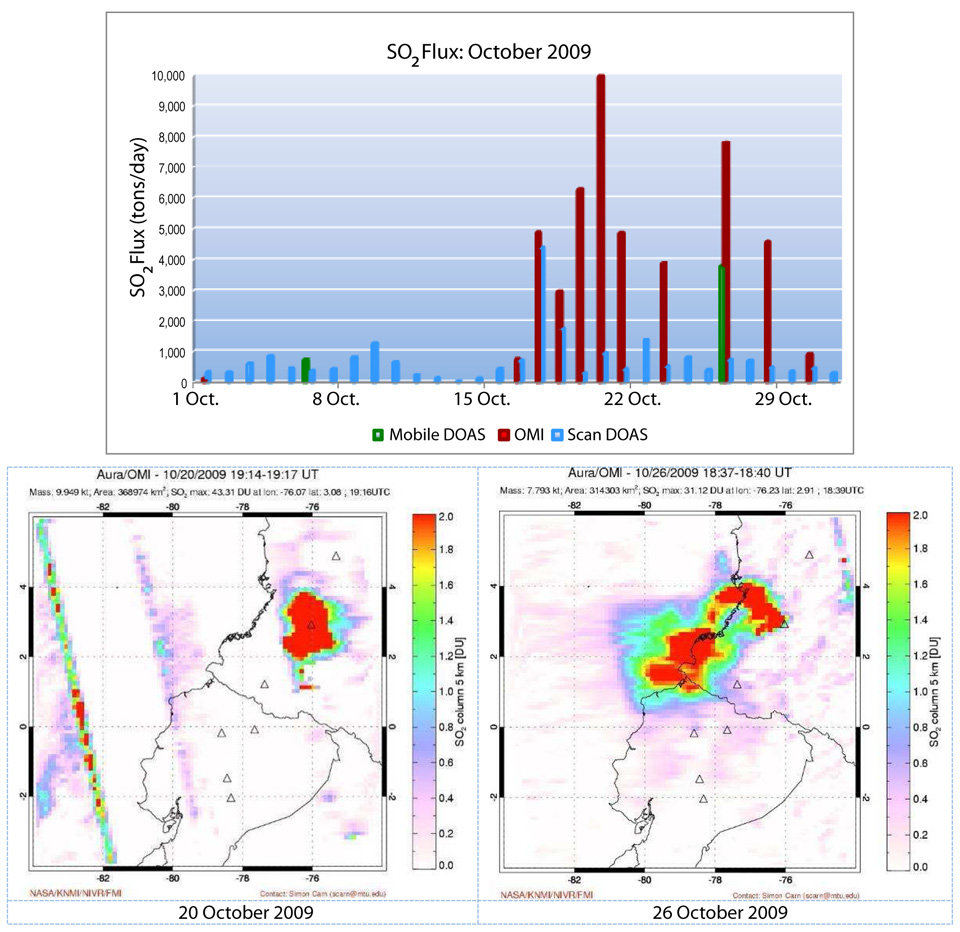 |
Figure 46. In October 2009, elevated SO2 flux was detected from Nevado del Huila by three remote sensing techniques. (Top) The plotted values show combined datasets from mobile DOAS, OMI, and scan DOAS. (Bottom) The OMI spectrometer on the AURA satellite detected 9.95 kt of SO2 on 20 October 2009 (left) during its pass at 2414-2417 local time (coverage area of 368,974 km2, recording a maximum value of 43.3 Dobson Units (DU)). On 26 October 2009 (right) it detected 7.79 kt of SO2 during its pass at 2337-2340 local time (coverage area of 314,303 km2, recording a maximum value of 31.12 DU). Courtesy of INGEOMINAS and Simon Carn, Michigan Technological University and Joint Center for Earth Systems Technology, University of Maryland Baltimore County. |
Lahar investigations. INGEOMINAS maintained seven early warning systems to warn of downstream flooding in vulnerable municipalities such as Belalcázar. At sites within the drainages of the Páez and Símbola rivers, flow monitoring with geophones has continued since October 2006, employing equipment installed by the INGEOMINAS Popayan Observatory in collaboration with the Nasa Kiwe Corporation (CNK). CNK is a relief group that has been active in this area of Colombia since the 1994 earthquake and resultant landslides that devastated the Cauca and Huila regions, including communities along the Páez river (BGVN 19:05). Those events also damaged the Tierradentro archaeological sites, a UNESCO World Heritage Site since 1995.
Following Huila's 2007 lahars (BGVN 33:01), Worni and others (2012) conducted fieldwork and reconstructed events in order to model future lahars for mitigation purposes. The researchers argued that large-volume lahars (tens to hundreds of millions of cubic meters) require targeted studies. The authors noted that "in 1994, 2007, and 2008, Huila volcano produced lahars with volumes of up to 320 million m3." To constrain the dimensions of simulated flows, they used inundation depths, travel duration, and observations of flow deposits from the April 2007 events and applied the two programs LAHARZ and FLO-2D for lahar modeling.
LAHARZ was developed by USGS scientists in order to provide a deterministic inundation forecasting tool; this program was designed to run in a Geographic Information System (GIS) environment (Schilling, 1998; Iverson and others, 1998). "For user-selected drainages and user-specified lahar volumes, LAHARZ can delineate a set of nested lahar-inundation zones that depict gradations in hazard in a manner that is rapid, objective, and reproducible" (Schilling, 1998). Worni and others (2012) presented results from the semi-empirical LAHARZ models along with physically-based results from FLO-2D (FLO-2D Software I, 2009) in order to forecast future inundation areas with specified flow volumes (figure 47). The authors concluded that, despite local deviations, the two models produced reasonable inundation depths (differing by only 10%) and encouraged future investigations that could address sources of uncertainty such as the effects of sediment entrainment that would cause dynamic changes in lahar volumes.
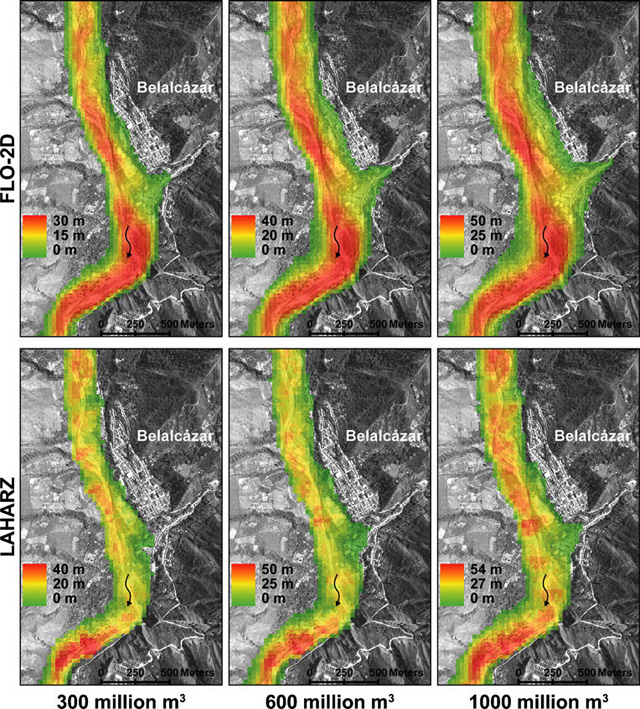 |
Figure 47. Results are shown from two modeling programs to understand lahar hazards from Nevado del Huila, FLO-2D (top three images) and LAHARZ (bottom three images), for the specified flow volumes. Note the modeled effects on the Belalcázar region (located ~20 km S of Huila). Three scenarios are presented based on lahar flow volumes of 3 x 10⁸, 6 x 10⁸, and 10 x 108 m3. Image from Worni and others (2012). |
Deformation monitoring during 2009-2012. An electronic tilt station was operating in July 2009, located at the Diablo monitoring site ~6.26 km NW of Pico Central (4.1 km above sea level). Telemetered data from a new electronic tilt station became available in May 2012; the station was located in the town of Caloto, located ~4 km SSW of Pico Central (4.2 km above sea level). Data from Diablo and Caloto was presented in the monthly technical bulletins posted online by INGEOMINAS.
After seven months of calibrations, INGEOMINAS developed an initial baseline for the new tilt data. The N and E components of Caloto recorded minor fluctuations during this time period. The trend of the E component was generally stable while the N component detected a gradual excursion during 17 June-25 September 2012.
References. FLO-2D Software I, 2009, FLO-2D User's Manual. Available at: www.flo-2d.com.
Iverson, R.M., Schilling, S.R, and Vallance, J.W., 1998, Objective delineation of areas at risk from inundation by lahars, Geological Society of America Bulletin, v. 110, no. 8, pg. 972-984.
Schilling, S.P, 1998, LAHARZ: GIS programs for automated mapping of lahar-inundation hazard zones, U.S. Geological Survey Open-File Report 98-638, 80 p.
Worni, R., Huggle, C., Stoffel, M., and Pulgarín, B., 2012, Challenges of modeling current very large lahars at Nevado del Huila Volcano, Colombia, Bulletin of Volcanology, 74: 309-324.
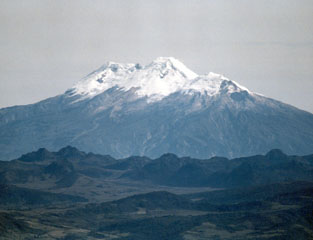
Geological Summary. Nevado del Huila, the highest peak in the Colombian Andes, is an elongated N-S-trending volcanic chain mantled by a glacier icecap. The andesitic-dacitic volcano was constructed within a 10-km-wide caldera. Volcanism at Nevado del Huila has produced six volcanic cones whose ages in general migrated from south to north. The high point of the complex is Pico Central. Two glacier-free lava domes lie at the southern end of the volcanic complex. The first historical activity was an explosive eruption in the mid-16th century. Long-term, persistent steam columns had risen from Pico Central prior to the next eruption in 2007, when explosive activity was accompanied by damaging mudflows.
Information Contacts: Instituto Colombiano de Geologia y Mineria (INGEOMINAS), Observatorio Vulcanológico y Sismológico de Popayán, Popayán, Colombia; Washington Volcanic Ash Advisory Center (VAAC), NOAA Science Center Room 401, 5200 Auth road, Camp Springs, MD 20746, USA (URL: http://www.ospo.noaa.gov/Products/atmosphere/vaac/); Ozone Monitoring Instrument (OMI), Sulfur Dioxide Group, Joint Center for Earth Systems Technology, University of Maryland Baltimore County (UMBC), 1000 Hilltop Circle, Baltimore, MD 21250, USA (URL: https://so2.gsfc.nasa.gov/); Nasa Kiwe Corporation (CNK) (URL: http://www.nasakiwe.gov.co/index.php); Weather Research Forecasting (WRF) (URL: http://www.wrf-model.org/index.php).