Report on Tungurahua (Ecuador) — March 2013
Bulletin of the Global Volcanism Network, vol. 38, no. 3 (March 2013)
Managing Editor: Richard Wunderman.
Tungurahua (Ecuador) Return of explosions and earthquakes through at least October 2010
Please cite this report as:
Global Volcanism Program, 2013. Report on Tungurahua (Ecuador) (Wunderman, R., ed.). Bulletin of the Global Volcanism Network, 38:3. Smithsonian Institution. https://doi.org/10.5479/si.GVP.BGVN201303-352080
Tungurahua
Ecuador
1.467°S, 78.442°W; summit elev. 5023 m
All times are local (unless otherwise noted)
As noted in our last report (BGVN 34:08), activity at Tungurahua had started to decline in late June 2009, a trend that continued through mid-December 2009. This report summarizes heightened activity witnessed from 30 December 2009 to 4 February 2010, and again from 26 May to very early August 2010. Seismicity began to increase in mid-December 2009 in prelude to the above-mentioned escalation.
This report is based on reports received from and direct correspondence with staff members of the Instituto Geofísico Politécnica Nacional Casilla ("Instituto Geofísico," IG).
Seismic overview. A plot by IG presented a synthesis of seismicity (figure 45) during the interval of 1 January 2006 to 17 October 2010, and is one way to portray the long-term pace of Tungurahua's eruption. The x-axis shows time with small tick marks every 30 days, and years indicated. The y-axis shows level of seismic activity on a scale indexed to an unstated normalized peak value. During the time period plotted, the number of recorded events assessed had a maximum peak at index value of ~74%. That peak occurred around 14 July 2006 ("2006 07 14" at left on the plot).
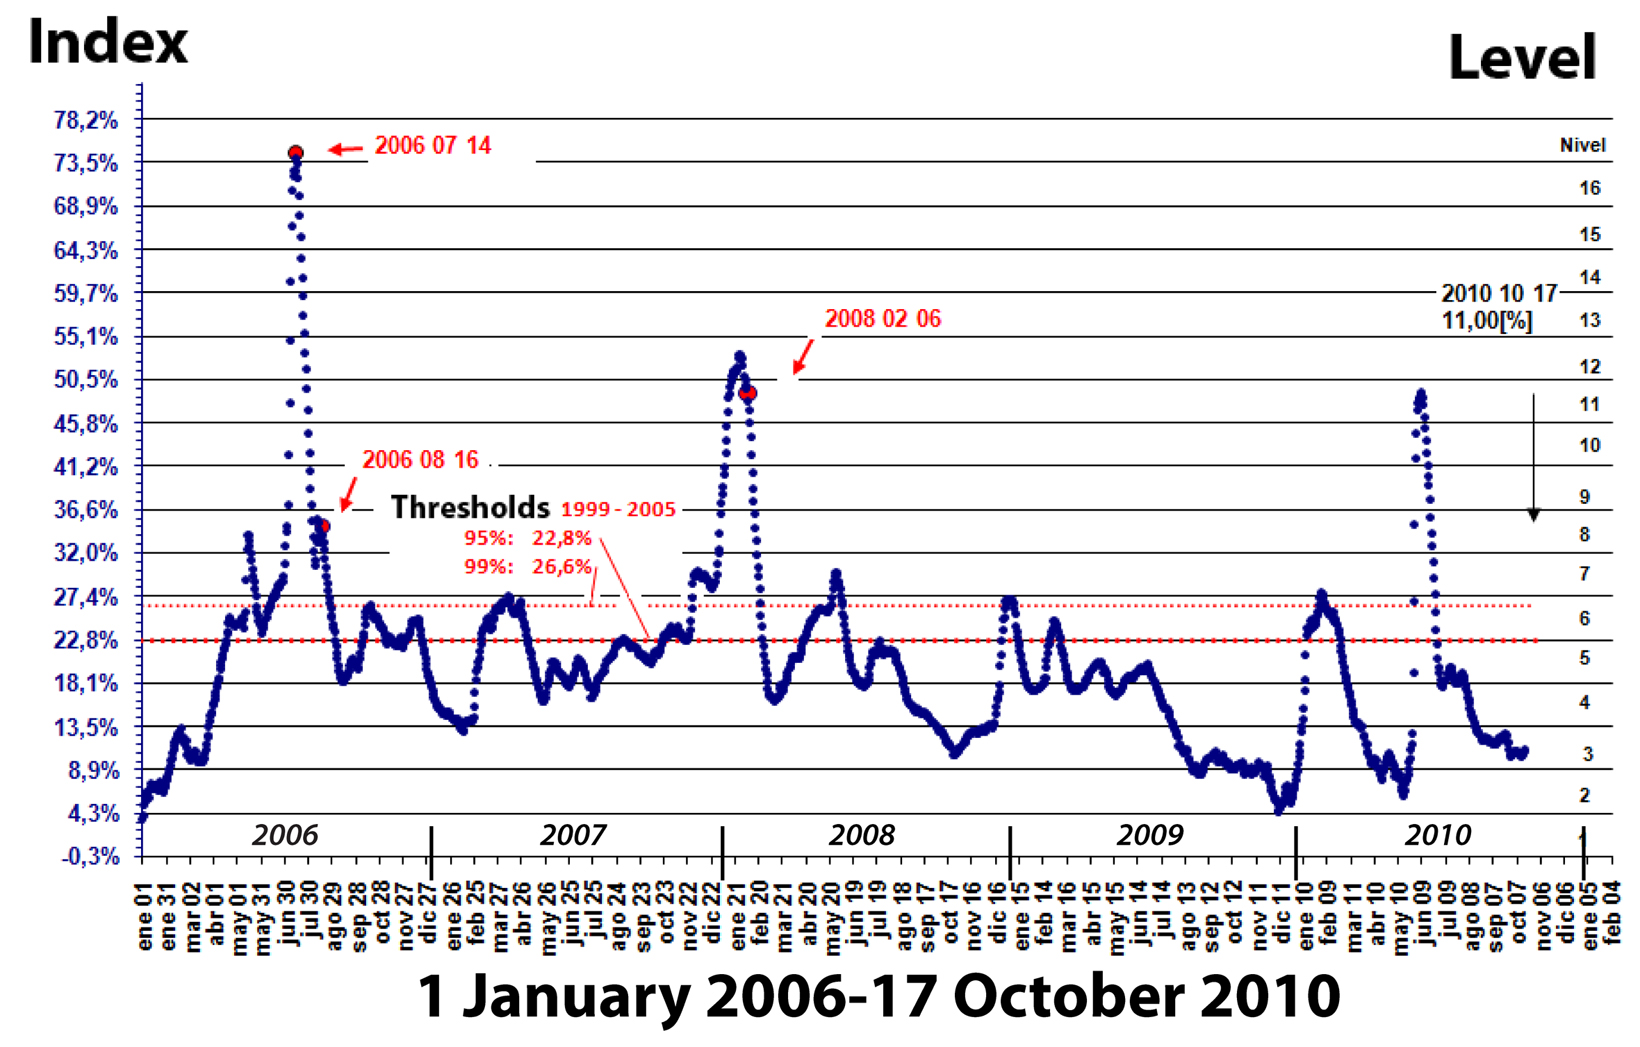 |
Figure 45. A plot of Tungurahua's seismicity versus time for the interval 1 January 2006 to 17 October 2010. The scale on the left (Index value) is in terms of percent of the IG's custom defined index of activity scale (IAS) for Tungurahua. The bar was auto-scaled with 4.6 units between horizontal lines. The X-Y intercept is slightly below zero (-0.3). The Y-axis on the right shows the IG's defined 'level of the IAS.' The horizontal red dots refer to thresholds during 1999-2005, corresponding to index values at 22.8 and 26.6% (95% and 99% confidence intervals, respectively). Modified from a plot by IG. |
During 2010 seismicity rose sharply in January, peaked at index values near 27%, and then descended during February into June 2010. The intervals of low seismicity in late 2009 and early 2010 are some of the lowest index values during the ~5 years displayed on this plot. The second peak during 2010 was sudden and ascended from low index values; it reached maximum values in late May 2010, approaching index values 50%. The downward arrow at the right side of the plot calls attention to the last day on the plot, 17 October 2010, when the index value stood at 11%.
The seismicity shown in figure 45 shows strong correlation with Tungurahua's behavior summarized below.
Renewed activity (and SO2 compilations). After six months of calm that included occasional diffuse emissions of vapor that rose no higher than 100 m, more intense activity resumed on 30 December 2009. On 1 January ash plumes rose to ~6 km altitude, and on 3 and 4 January they rose as high as ~9 km. Similar plume altitudes were seen at times during the rest of January and February. On 11-12 January, Strombolian outbursts ejected material ~1 km above the crater and to distances of ~1.5 km away from the vent. Ash often blew in a broadly westerly direction (see below).
Significant SO2 fluxes were measured in January 2010. On 6 January, SO2 fluxes reached a value of 3,200 metric tons/day (t/d); on 8 January, they reached 7,500 tons/day. In contrast, some recent values during the 6 month lull were between 100 and 200 tons/day.
On the broader subject of Tungurahua SO2 output, more comprehensive assessments and compilations have been captured than ever before, but the details are beyond the scope of this report. One group, NOVAC (Network for Observation of Volcanic and Atmospheric Change) established a global network of stations to measure emissions of SO2 (and BrO) by UV absorption spectroscopy by local instruments. Trained personnel working at various volcanoes and following protocols assured standard practices (DOAS, mini DOAS, Flyspec). The instruments are based at over 21 volcanoes, including Tungurahua. SO2 is also monitored from instruments on satellites (e.g. OMI, GOME 2, and SCIAMACHY). Understanding and possibly reconciling those two set of atmospheric measurements, local (ground- and aircraft-based measurements) and satellite based, has also been the subject of recent papers. Tungurahua and adjacent degassing volcanoes have played a major roles in this effort (McCormick and others, in press, Carn and others, 2008, and Arellano and others, 2008).
Figure 46 shows Tungurahua in a Strombolian eruption on or about 10 January 2010. Incandescent material fell onto the flanks.
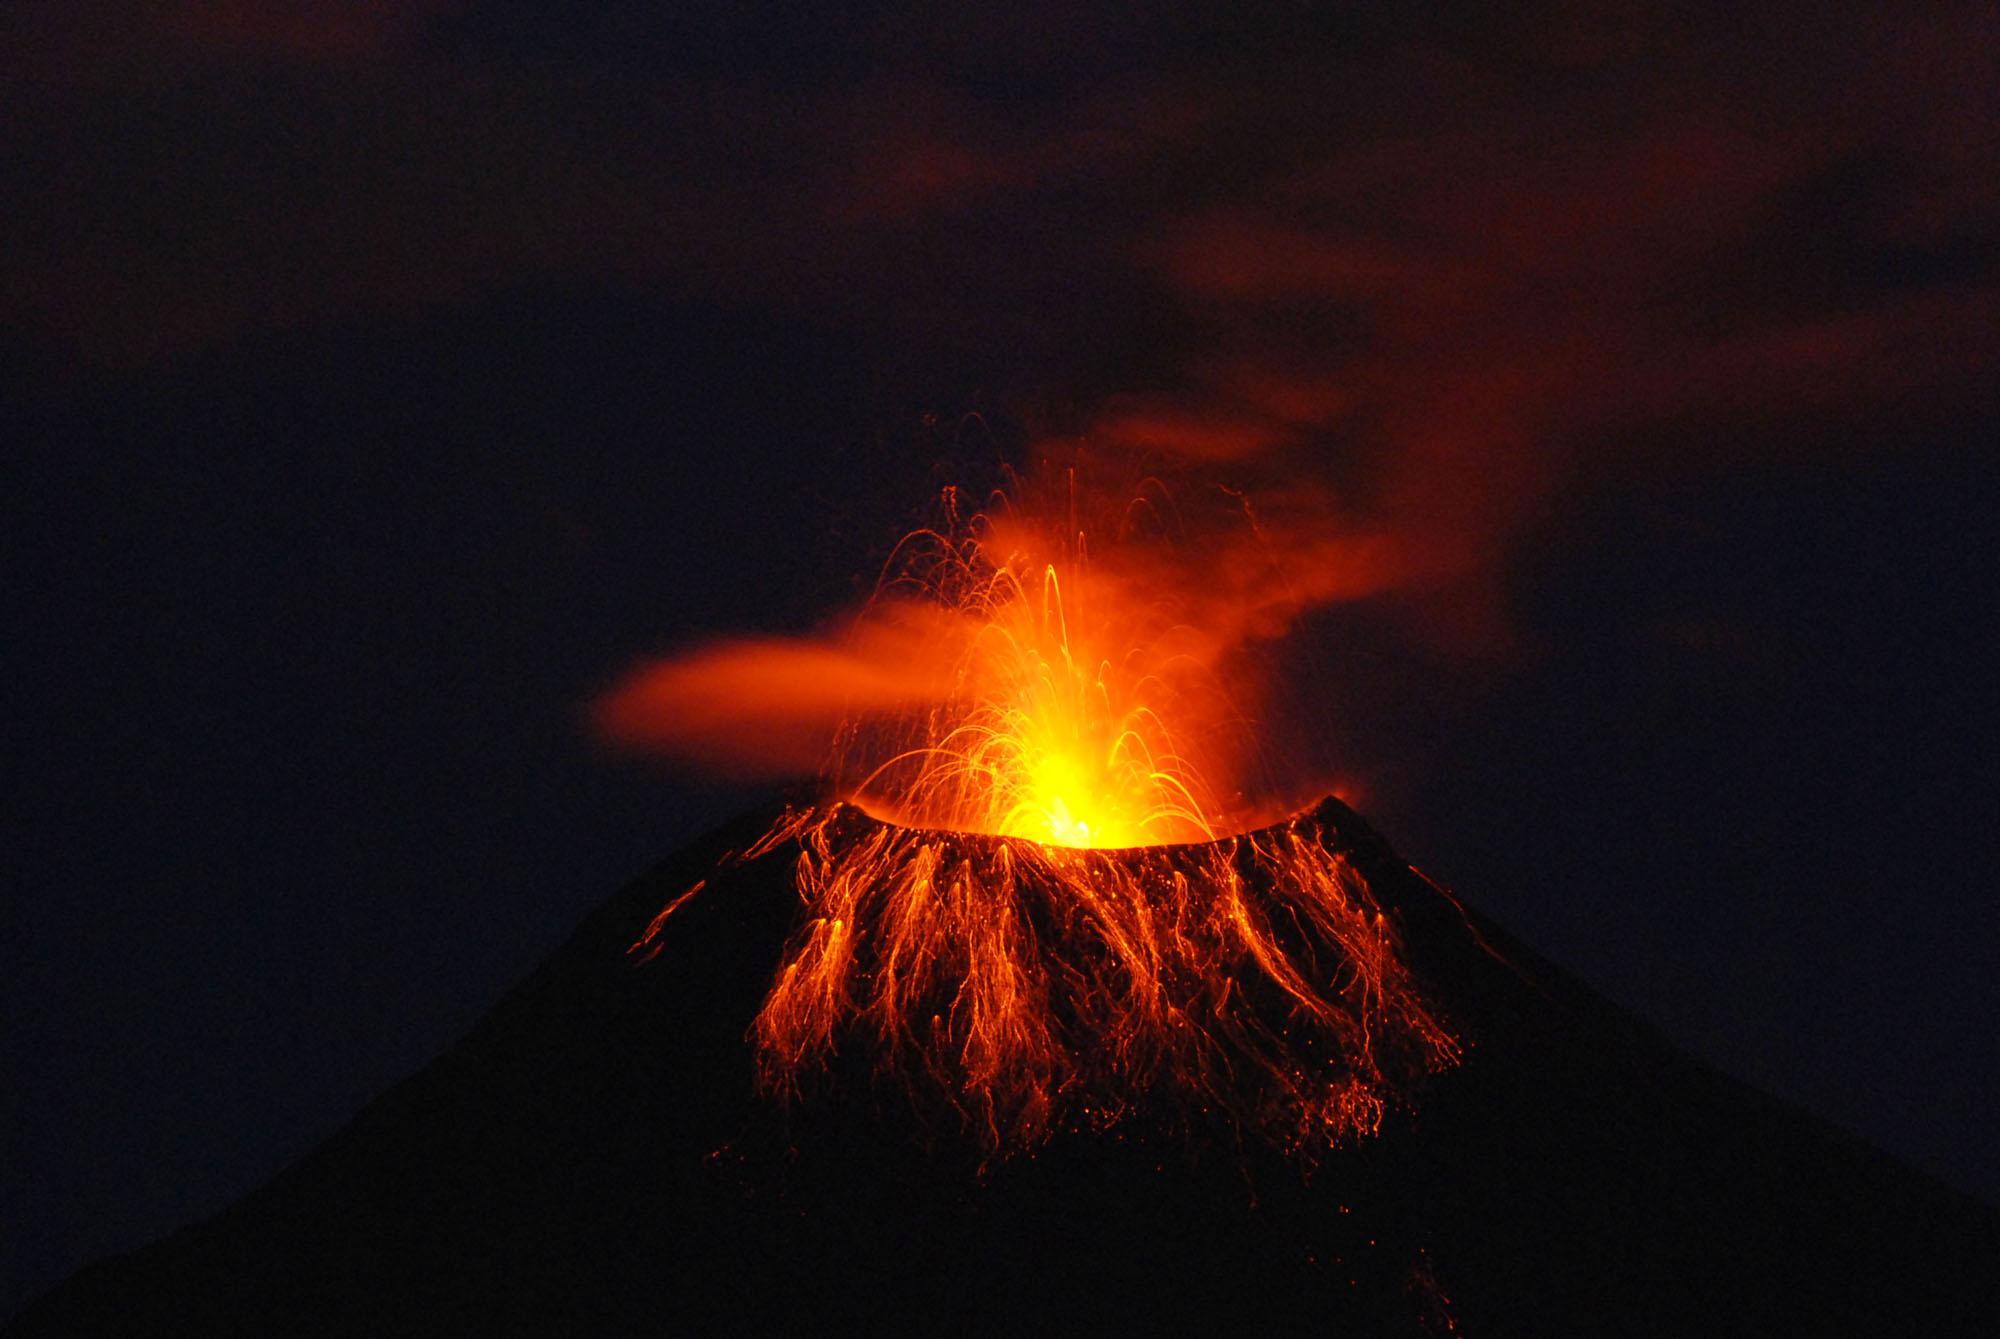 |
Figure 46. After 6 months of comparative quiet, Tungurahua renewed more vigorous eruptions during 30 December 2009 to 1 January 2010. This extended-exposure night photo was taken on or around 10 January 2010. The volcano's profile appears dark, almost black, whereas Strombolian discharges at the summit crater glow a bright red-orange. The extended exposure captured the paths of glowing projectiles arcing out of the crater, and impacting and in many cases bouncing down the upper flanks. An ash cloud in the background reflects a softer more continuous glow across a broad area including, in fainter light, portions of the plume trailing off to the upper right. Photo by Jorge Bustillos A., IG. |
Strong explosions were heard on the evening of 14 January. Small amounts of ash fell nearby and as far away as the Chimborazo glaciers and Guaranda (64 km SW).
The return of ongoing ash plumes initiated a variety of civil responses. In towns close in and on Tungurahua's W to SW flanks (e.g., Choglontús), roofs were inspected and where necessary, ash was removed. This measure was undertaken to prevent ash loading and potential roof collapse. Many building roofs are nearly flat, requiring ash removal with brooms and shovels.
Figure 47 shows an elementary schematic created to address the upsurge in Tungurahua's ash falls, and to broaden understanding and raise public awareness of ash fall processes and hazards from Tungurahua. It shows the progressive shift in the range of grain sizes falling out of ash plumes as they drift, in this idealized case, W to SW with plume tops rising to altitudes approaching 10 km. More complex depositional patterns may develop owing to factors like discharges to variable height, discharges containing differing grain-size distributions, and shifts in wind velocity. Assessment of ashfall often results in maps displaying the thickness or mass of these deposits on the ground (respectively, isopach and isopleth maps). Several isopach maps appear below, describing the Tungurahua's January-February 2010 upsurge in ashfall in more quantitative and technical terms.
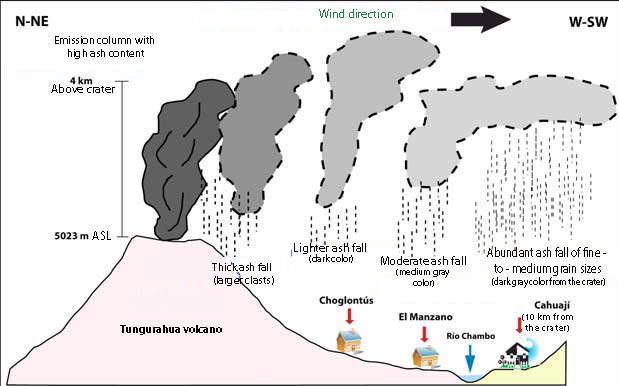 |
Figure 47. An idealization of ash plume evolution emphasizing the expected changes in grain sizes falling from Tungurahua plumes and the range of distance to some settlements. The plume shown is assumed to blow W to SW (common wind directions in this region). Graphics like this help inform the public. Courtesy of IG. |
Tungurahua's ash clouds are also closely monitored out of concern for keeping aircraft out of potentially damaging plumes, some of which extended ~150 km W of the summit during the reporting interval. Ecuador maintains a Meteorological Watch Office (MWO) in the city of Guayaquil, ~180 km SSW of the summit (figure 48; and see inset map showing Guayaquil's location on the coast in figure 25 in BGVN 30:06). The Guayaquil MWO feeds critical data, including observations made by IG at Tungurahua and satellite data they interpret about Tungurahua's plumes, to the Buenos Aires Volcanic Ash Advisory Center. Tungurahua was a frequent subject of aviation reports during the reporting interval. As seen on figure 48, Guayaquil sits just S of the ends of W-directed envelopes around the January 2010 ash clouds.
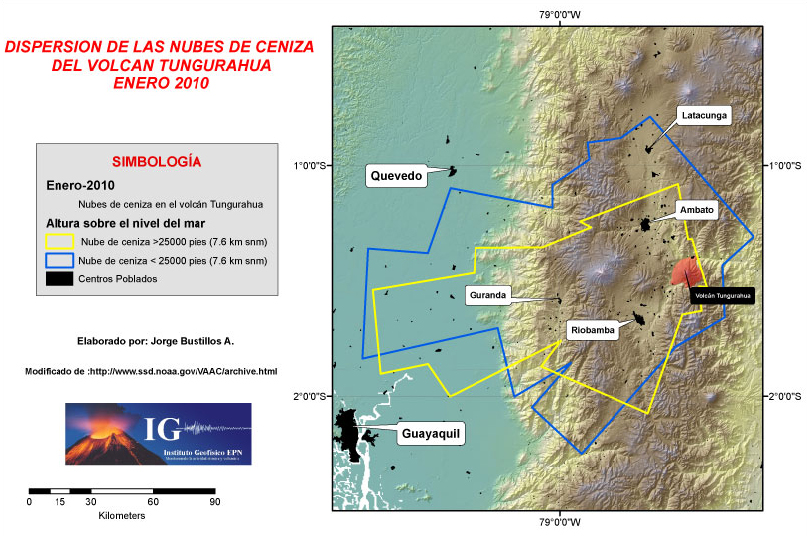 |
Figure 48. Plan view of the overall atmospheric dispersion patterns of Tungurahua ash during January 2010. This is vital information to the aviation community. Although the key is in Spanish, the gist is this: The yellow and blue envelopes apply to ash above and below 7.6 km altitude, respectively (note scale at far left). Courtesy of IG (graphic and key composed by Jorge Bustillos A. after a graphic found at the Washington VAAC). |
Figures 49 and 50 respectively show 1-10 and 11-31 January ash-fall deposits created by plumes that rose to the 5.4-9.1 km altitude range (up to 3 km above the crater). On these maps, the farthest measured isopach, 1 mm in thickness, was as far away as 19 km from the crater. For figure 49, the points where the thickness was measured (yellow) best constrained the deposits maximum extent on the N, NW, and W sides. For that map, ash volumes estimated using conventional approaches (Pyle, 1989; Fierstein and Nathenson, 1992; and Legros, 2000) yielded 313,000 m3 (stated in terms of vesicle-free rock; often abbreviated as DRE, dense-rock equivalent).
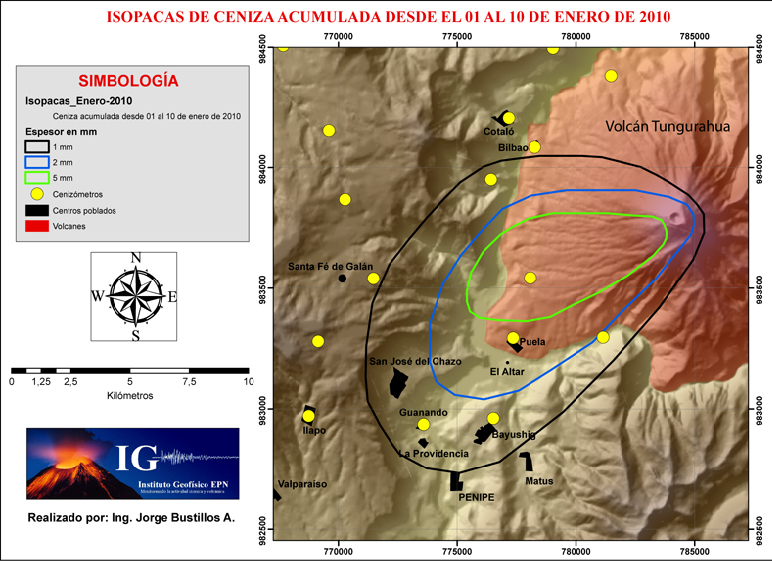 |
Figure 49. The isopach map IG compiled for Tungurahua ash deposited during 1-10 January 2010. Key shows the following (from top): Isopach thicknesses (3 colors), points where the thickness data were collected (yellow dots); population centers (black shaded areas), and Tungurahua (reddish shading). Courtesy of IG (composed by Jorge Bustillos A.). |
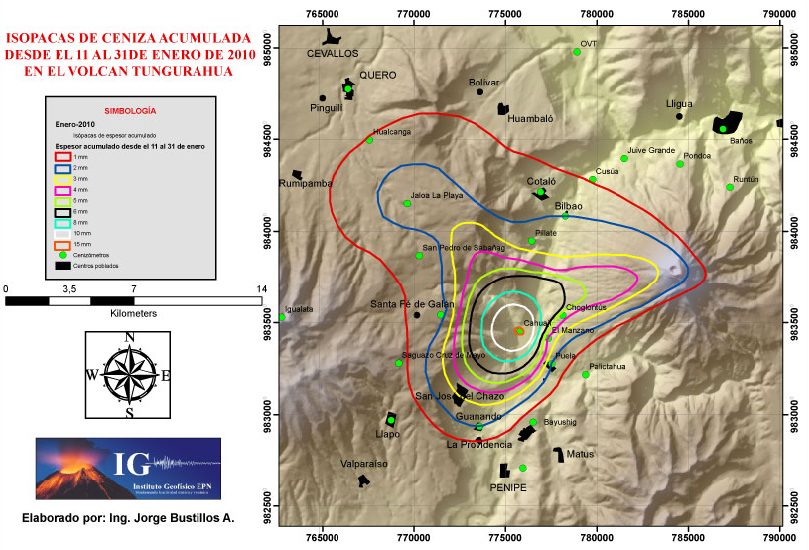 |
Figure 50. The isopach map IG compiled for Tungurahua ash deposited during 11-31 January 2010. The thickest area was inferred to lie ~9 km WSW of the summit at Cahual (where 15 mm fell). Key at left shows isopach thicknesses (9 colors), points where the thickness data were collected (green dots); and population centers (black shaded areas). Courtesy of IG (composed by Jorge Bustillos A.). |
In figure 50, the thickest ash (1.5 cm) was mapped at the town of Cahual (~9 km WSW of the summit), and the mapped pattern suggested lobes trending both WNW and WSW. Such thickening at a spot well away from the summit is unusual but not unprecedented. Future studies considering meteorological or other data may help explain this pattern, which could have public safety implications.
IG's report for 11-31 January noted near constant ash plumes during that interval. Ash had impacted banana plantations and livestock, falling over an area of ~15,000 km2.
The ash volume estimate in DRE for 11-31 January was 806,000 m3 (figure 50). Taken with the earlier (1-10 January) estimate based on figure 49, this made the January total ~1,120,000 m3 (DRE). This is best shown to two significant figures, thus 1.1 x 10⁶ m3. In contrast, the volume for the full month of February was estimated at 1.6 x 10⁶ m3.
Figure 51, an isopach map created for the entire month of February 2010, extends farther outward than either of the two maps representing January. February's 1 mm isopach extends up to 22 km from the summit in the WNW direction. February's map also shows some thicker deposits close to the active summit crater (25 mm thickness at Cahuaji), but it reflects a longer time interval than each of the two January maps. February's elevated deposition of ash conformed with IG's Special Bulletin (No. 6), which explained that after 6 February 2010 they had seen a notable increase in the frequency and magnitude of explosions, and plumes rising 4 km above the summit. People tens of kilometers away heard blasts. Observers noted glowing blocks thrown more than 1.5 km and rolling downslope. Infrasonic microphones recorded signals suggesting four explosions of high energy during 8-9 February.
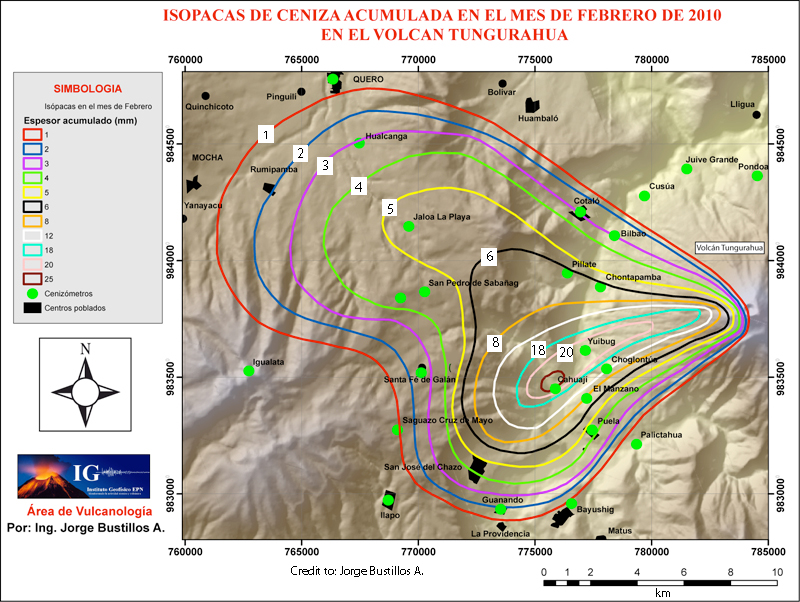 |
Figure 51. An isopach map showing Tungurahua's ash accumulation during February 2010 (thicknesses in millimeters). Courtesy of IG (composed by Jorge Bustillos A.). |
5 February ash plume dynamics. Figure 52 shows intriguing ash plume behavior on 5 February 2010, disclosing complexities infrequently discussed in the literature. At discharge, the plume rises vertically in a thrust phase that appears to be well on its way to farther ascent in a convective phase. The continued rise of earlier emissions (perhaps less energetic or perhaps in gusts of stronger wind) were thwarted by wind having sheared and carried them off. That portion of the plume appears to the right of the crater. As these earlier components progressed downwind and above the lee side of the volcano, their path descended rather than ascended. Farther downwind and away from the volcano the plume appears much broader and its top has risen higher than the original thrust phase. The presence of weather clouds like those in the background could compromise ground-based estimates of the ultimate height for the plume's top.
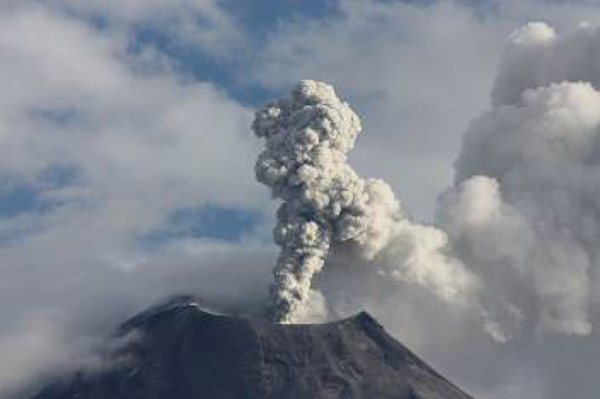 |
Figure 52. Tungurahua discharged this vapor-dominated emission (containing low-to-medium density of ash) at 2200 on 5 February 2010. That day's eruptions were described as rising 1 km above the summit and continuing W to SW. The scene is discussed further in text. Image taken from IG's 1-7 February 2010 report (photo credit to J. Bourquin IG). |
Geometries like this may also complicate reliable estimates of gas-flux, although scanning imaging infrared spectrometers compensate for these problems (e.g. Grutter and others, 2008). Pilots and meteorologists are familiar with these topographic wind-related effects, which they call lee waves. An acclaimed book by Pretor-Pinney (2007) discusses and provides a diagram to explain similar wind-driven topographic effects and lenticular clouds common near tall peaks.
11 February secondary pyroclastic flows. As IG reported (in their Special Bulletin Number 6), on 11 February an M 3.3 volcano-tectonic earthquake struck in vicinity of Tungurahua. Strong explosions ensued, and about 20 minutes later an ash plume rose ~4 km above the summit. About three hours later IG observers at the Tungurahua Volcano Observatory (OVT) in Guadalupe, (11 km N of the summit), photographed the paths and thermal images revealed still hot deposits from small pyroclastic flows. These flows started at the crater rim and descended several kilometers down the upper one-third of the volcano on the N and NNW flanks.
The pyroclastic flows were interpreted as secondary, generated by the gravitational instability of still-hot ejecta that had accumulated at the crater rim and adjacent areas downslope.
February rain brings destructive lahars. Special Bulletin No. 5 of 4 February 2010 contains a detailed set of notes compiled as strong rains fell and caused lahars to descend along gullies and ravines. The Ulba river (on the volcano's E to NE flanks) was strongly impacted. The lahars also closed some recently repaired roads.
At 1100 on 4 February 2010, a large amount of rock debris flowed down the Chinchín river, which flows from the S to the N along the outer NE flank as close as ~10 km from the summit crater. According to the Baños Fire Department, the lahars destroyed or damaged ~18 homes in Chinchín (16 km NE of the summit). Four people were injured (two children, two adults) and four people were missing. The lahars carried debris up to 5 m in diameter. Debris flowed over the brink of Bride's Veil waterfall, disrupting a well-known scenic attraction.
March to June activity. Although poor visibility hampered views in March, seismicity remained high and indicative of explosions with several ash emissions reaching altitudes of 8-9 km. Comparative quiet prevailed during April and the earlier parts of May, although visibility was often compromised. Early May reports noted lahars on the N, W, and S flanks.
Eruptive vigor rose again on 26 May 2010, when an eruption resulted in small (~1 km runout distance) pyroclastic flows and an ash plume that rose to 12 km altitude.
An eruption on 28 May produced a plume that rose to 15 km altitude, resulting in pumice-fall in some inhabited areas. Pyroclastic flows extended as far as 3 km down the NW, N, and SW flanks, distances insufficient to impact inhabited areas. According to news articles, residents from two towns about 8 km NW were evacuated, and ashfall at the airport in Guayaquil temporarily shut it down.
On 2 and 7 June pyroclastic flows traveled 1.5 km down the NW flank; this took place amid the early June seismic low on figure 47.
Clouds often prevented observations during June and July, but when visible, plumes again rose to altitudes of 5-8 and occasionally 9 km. Some intervals of comparative quiet also occurred (e.g., 23 June to 4 July). As had occurred during many intervals of high eruptive vigor, loud booming noises associated with explosions often caused structures to vibrate. For example, on 6 June large windows vibrated at OVT.
During 28 July-2 August steam emissions, often containing ash, 1-2 km above the crater and drifted NW or W. Minor ashfall was reported to the SW in the Choglontus area during 28-29 July.
According to IG's October report, a lull in activity began in late July and continued through all of October. Figure 47 shows that comparatively low seismicity prevailed through at least 17 October 2010.
Online book in Spanish on Tungurahua. Readers searching for background on this restless, dangerous, news-making volcano, will find it summarized in accessible terms in a compact (118 page) well-illustrated book (Le Pennec and others (2005), in Spanish; available free online as a PDF file). Topics include events from Tungurahua's geologic past, the onset of the current eruption in 1999, and approaches to monitoring. The book covers behavior as late as mid-2005. A few important recent eruptions after the book's publication included those in July and August 2006 (respectively, VEI 2 and 3) and in February 2008 (VEI 1-2).
Figure 53 features a map from the book. In the book's digital version (a PDF file), the search function will identify place names on this map, a welcome feature.
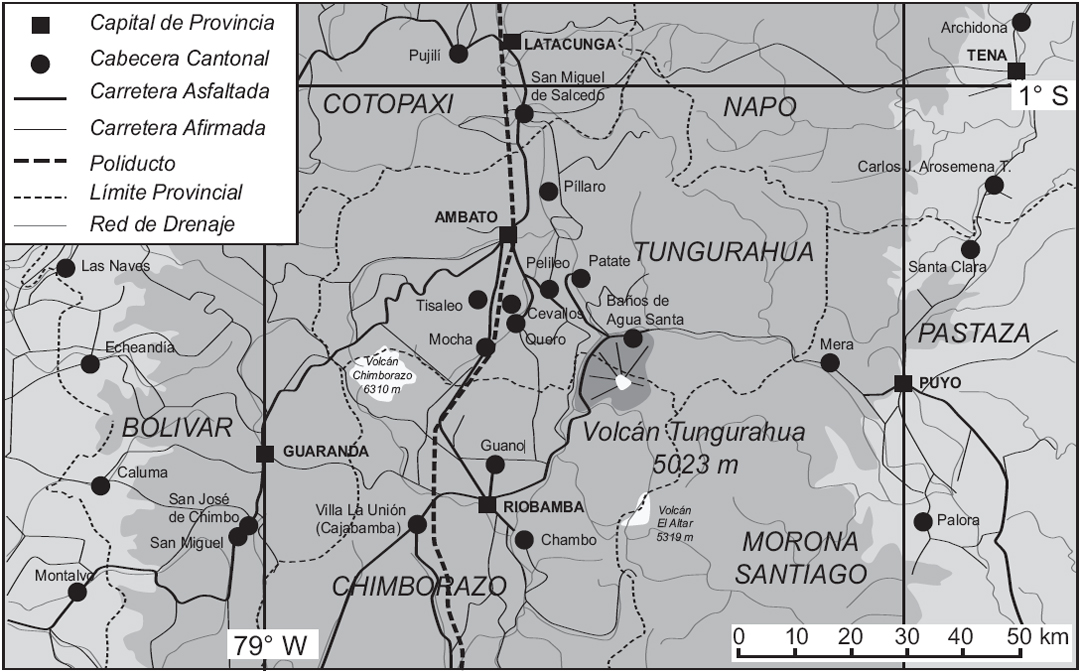 |
Figure 53. Location of Tungurahua and surroundings showing cities and districts, places confronting varying degrees of impacts from the ongoing eruption. Translation of terms in key: province capital, cantonal capital, paved road, dirt road, pipeline, province margin, and drainage network. Taken from Le Pennec and others (2005). |
References. Arellano, S.R., Hall, M., Samaniego, P., Ruiz, A., Molina, I., Palacios, P., Yepes, H., OVTIGEPN staff, 2008. Degassing patterns of Tungurahua volcano (Ecuador) during the 1999-2006 eruptive period, inferred from remote spectroscopic measurements of SO2 emissions. J. of Volcanology and Geothermal Research 176, 151-162.
Carn, S.A., A.J. Krueger, N.A. Krotkov, S. Arellano, and K. Yang, 2008, Daily monitoring of Ecuadorian volcanic degassing from space, J. of Volcanology and Geothermal Research, 176(1), 141-150.
Grutter, M., Basaldud, R., Rivera, C., Harig, R., Junkerman, W., Caetano, E., and Delgado Granados, H., 2008, SO2 emissions from Popocatpetl volcano: emission rates and plume imaging using optical remote sensing techniques, Atmos. Chem. Phys., 8, 6655-6663.
Le Pennec. J-L, Samaniego, P, Eissen, J-P, Hall, MP, Molina, I, Robin, C, Mothes, P, Yepes, H, Ramón, P, Monzier, M, and Egred, J., 2005, Los peligros volcánicos asociados con el Tungurahua, 2nd edición, Serie: Los peligros volcánicos en el Ecuador. Corporación Editora Nacional, ISBN: 9978-84-402-3 (118 pp., in Spanish). [PDF online at http://horizon.documentation.ird.fr/exl doc/pleins_textes/divers11 12/010036187.pdf]
McCormick, B.T., M. Herzog, J. Yiang, M. Edmonds, T.A. Mather, S.A. Carn, S. Hidalgo, and B. Langmann (2013), An integrated study of SO2 emissions from Tungurahua volcano, Ecuador, Journal of Geophysical Research (under review).
Pretor Pinney, G., 2007, The Cloudspotter's Guide: The Science, History, and Culture of Clouds by Gavin, Penguin Group (USA).
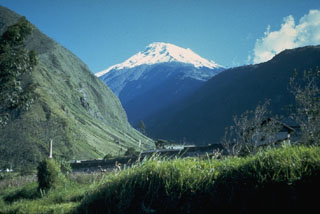
Geological Summary. Tungurahua, a steep-sided andesitic-dacitic stratovolcano that towers more than 3 km above its northern base, is one of Ecuador's most active volcanoes. Three major edifices have been sequentially constructed since the mid-Pleistocene over a basement of metamorphic rocks. Tungurahua II was built within the past 14,000 years following the collapse of the initial edifice. Tungurahua II collapsed about 3,000 years ago and produced a large debris-avalanche deposit to the west. The modern glacier-capped stratovolcano (Tungurahua III) was constructed within the landslide scarp. Historical eruptions have all originated from the summit crater, accompanied by strong explosions and sometimes by pyroclastic flows and lava flows that reached populated areas at the volcano's base. Prior to a long-term eruption beginning in 1999 that caused the temporary evacuation of the city of Baños at the foot of the volcano, the last major eruption had occurred from 1916 to 1918, although minor activity continued until 1925.
Information Contacts: Instituto Geofísico (IG), Escuela Politécnica Nacional, Casilla 1701-2759, Quito, Ecuador; Jorge E. Bustillos A. (IG), Patricia A. Mothes (IG), and Buenos Aires and Washington Volcanic Ash Advisory Centers.