Report on Kizimen (Russia) — April 2013
Bulletin of the Global Volcanism Network, vol. 38, no. 4 (April 2013)
Managing Editor: Richard Wunderman.
Edited by Julie A. Herrick.
Kizimen (Russia) Active lava flows and ash emissions during October 2011-May 2013
Please cite this report as:
Global Volcanism Program, 2013. Report on Kizimen (Russia) (Herrick, J.A., and Wunderman, R., eds.). Bulletin of the Global Volcanism Network, 38:4. Smithsonian Institution. https://doi.org/10.5479/si.GVP.BGVN201304-300230
Kizimen
Russia
55.131°N, 160.32°E; summit elev. 2334 m
All times are local (unless otherwise noted)
Significant eruptions began at Kizimen in December 2010 (BGVN 36:10) and continued through May 2013. Our previous report highlighted frequent ash explosions, the development of a ˜2.3 km lava flow, and elevated seismicity through September 2011. In this report we continue to present data based on the monitoring efforts of the Kamchatka Branch of the Geophysical Service of the Russian Academy of Sciences (KB GS RAS) and the Kamchatka Volcanic Eruptions Response Team (KVERT).
Developments in data analysis based on Kizimen's 2010 eruption. The onset of activity in late 2010 provided opportunities for new methods of data analysis. Ji and others (2013) and Senyukov (2013) highlighted distinctive precursory activity that could successfully forecast volcanic behavior. Both investigative groups also mentioned the challenge of limited datasets for a volcanic system that recently became active without past records of geophysical data (in particular, deformation or seismic data during a time of elevated activity). The last eruption from Kizimen occurred during 1927-1928 (Siebert and others, 2010), before satellite or seismic monitoring (instrumentation was available in 1961) had begun.
The remote sensing investigation by Ji and others (2013) concluded that InSAR datasets from 2008 and 2010 measured > 6 cm of progressive surface displacement in the satellite's line-of-sight before the eruption began. While "InSAR has been demonstrated to be an important tool for investigating volcanic deformation and understanding magma supply dynamics at many of the world's volcanoes," this was the first significant deformation observed at a Kamchatka volcanic site.
The seismic study by Senyukov (2013) detailed a new method for short-term forecasting explosive eruptions. Development for this technique began with Bezymianny datasets and was followed by a successful application to the 2010 eruption of Kizimen using the correlation between height of ash emissions and the integral of absolute velocity as recorded by local seismic stations.
Elevated alert status continued through May 2013.From October 2011 through May 2013, Kamchatkan authorities maintained elevated an alert status (most frequently an Aviation Color Code of Orange) except for a few days during April-December 2012 and one day in March 2013 (figure 14). A Red level, indicating that an "eruption is underway with significant emission of ash into the atmosphere" was announced and maintained for one day in December 2011. There were several days of unassigned status during July-September 2012 primarily the result of station outages and meteorological conditions that inhibited observations which are based on satellite remote sensing, a video camera, and field visits.
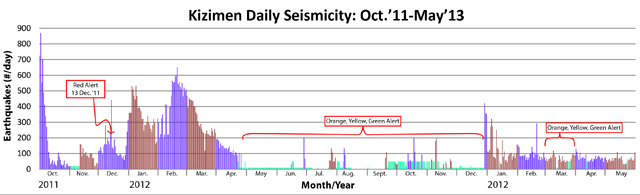 |
Figure 14. This plot of earthquakes per day at Kizimen has been annotated with Aviation Alert Levels during the time period of October 2011 to May 2013. Blue and maroon colors alternate to distinguish each month; green indicates approximate values that are based on the following scheme: background levels = 10 events/day, slightly above background levels = 20 events/day, and above background levels = 50 events/day. Note that during this time period, the Aviation Color Code varied between Orange and Yellow except where noted otherwise. Data from Kamchatka Branch of the Geophysical Service of the Russian Academy of Sciences (KB GS RAS). |
Observations during October 2011-May 2013. KVERT reported in regular notifications to aviation authorities (Volcano Observatory Notification to Aviation, VONA), that lava continued to extrude from the summit of Kizimen from October 2011 through May 2012. New notices of visual confirmation of lava extrusion and ash plumes were released starting on 25 October 2012 and until the time of this report in May 2013 (figure 15).
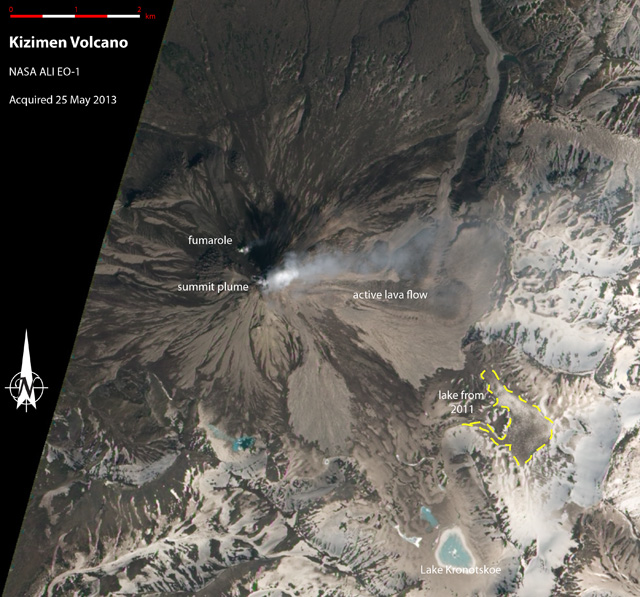 |
Figure 15. This natural-color NASA EO-1 ALI (Advanced Land Imager) image of Kizimen was acquired on 25 May 2013. A white plume drifted E from the summit, in high contrast with the ash-covered slopes which appeared gray-brown. Outlined in a dashed yellow line is the lake that had formed in late 2011, now mostly obscurred by snow and ash (see BGVN 36:10 for a comparison). Courtesy of NASA Earth Observatory. |
Volcano Observatory Notification to Aviation (VONA) reports were released regularly on the KVERT website covering daily and weekly activity for Kizimen and other Kamchatka volcanoes. This reporting style was adopted by the International Civil Aviation Organization (ICAO) in 2004 "as the international warning system for volcanic ash, becoming the first 'global standardized' VALS [Volcano Alert Level Systems]. In 2006, the USGS adopted two standardized VALS, one for ground-based hazards and the other for aviation ash hazards, replacing extant VALS that had been locally developed at each observatory" (Fearnley and others, 2012; Gardner and Guffanti, 2006). At the time of this report, KVERT notifications were focused on aviation ash hazards with no additional ground-based notification system (figure 16).
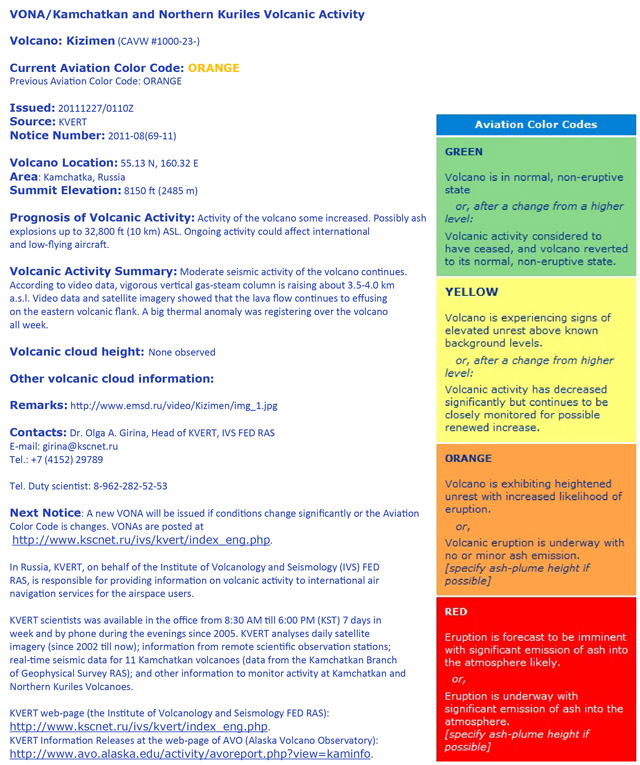 |
Figure 16. This Kizimen VONA from 27 December 2011 highlighted observed gas-and-steam plumes, visible effusive lava flows, and thermal anomalies. A forecast is also included as well as contact information for additional notices and KVERT representatives. Courtesy of KVERT. |
Thermal anomalies from the summit. Satellite remote sensing frequently detected elevated temperatures from Kizimen during 2011-2013 (figure 17) and a local monitoring camera maintained by KB GS RAS detected nighttime incandescence during clear viewing conditions (figure 18).
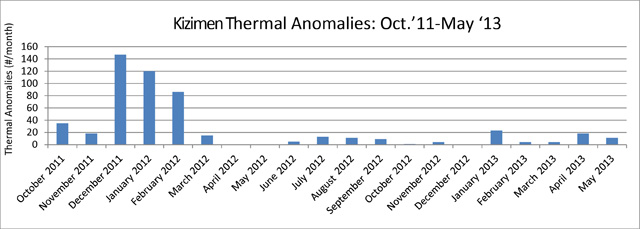 |
Figure 17. MODIS/MODVOLC detected thermal anomalies from the summit area of Kizimen during October 2011-May 2013. Note that months without anomalies may include time periods when viewing conditions did not allow detection of elevated temperatures. Courtesy of HIGP. |
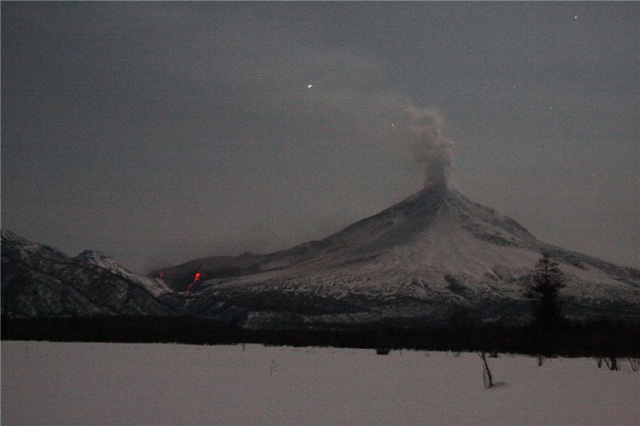 |
Figure 18. Summit emissions and incandescence from the active flow front was visible at night on 2 March 2012 from Kizimen's E flank. Courtesy of A. Sokorenko of the Institute of Volcanology and Seismology (FED RAS) and KVERT. |
Volcanic and seismic activity peaked in December 2011 and Red Aviation Color Code was announced on 13 December when more than 220 earthquakes were detected (figure 14). The next day, seismicity doubled and video observations showed hot avalanches from the E flank lava flow and occasional large pyroclastic flows. During 0620-0810 a large pyroclastic flow with co-ignimbrite clouds was observed. According to the Tokyo Volcanic Ash Advisory Center (VAAC), ash plumes rose 6.1-7.6 km a.s.l. Activity during 13-14 December generated an ash plume that extended ˜150 km E.
FED RAS scientists conducted an aerial survey on 23 December 2011 and determined Kizimen's range of surface temperatures (figure 19). During the overflight, temperatures were as high as 140°C, and a strong steam-and-gas plume was rising from the summit.
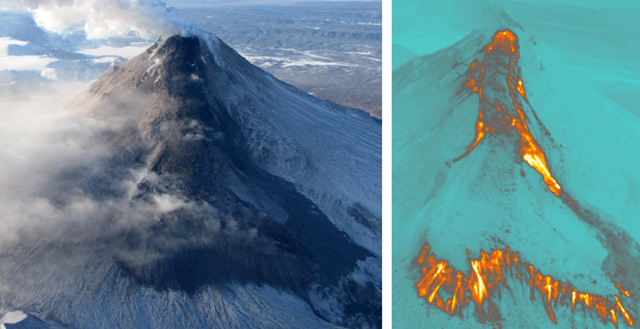 |
Figure 19. Aerial photos of Kizimen on 23 December 2011 captured the active lava flow located on the E flank. (left image) This aerial image of Kizimen shows a lobate flow extending several kilometers from the summit. (right image) This thermal image depicts the active margins of effusive lava flows where elevated temperatures were concentrated; maximum temperatures were ˜140°C. Courtesy of Sergey Chirkov of the Institute of Volcanology and Seismology (FED RAS) and KVERT. |
Seismicity during October 2011-May 2013. After peaking with ˜870 earthquakes on 2 October 2011, seismicity peaked again on 20 February 2012 (651 earthquakes/day) before beginning a long period of decline until June 2012 (figure 14). Possible avalanche signals were typical during this time period and explosion events frequently occurred. Seismicity also included spasmodic volcanic tremor, at times continuous, but more frequently intermittent episodes; tremor became less dominant in April and was absent in May.
During May-June 2012, seismicity rarely exceeded background levels (approximately 10 earthquakes/day). Spasmodic tremor was intermittent and rarely occurred during June-July, although an increase in tremor was detected during 24-30 July. Due to technical problems, there were data outages in July, the majority of August, and part of September. Tremor, explosions, and possible avalanche events were detected intermittently by the seismic network in August and September.
The seismic network detected intermittent explosive and rockfall events from October 2012 through December of that year. From October 2012 through May 2013, seismicity rarely exceeded 100 earthquakes/day. Several peaks in activity occurred in late December 2012 (a maximum of 422 earthquakes/day) and January 2013 (a maximum of 322 earthquakes/day). Tremor, explosions, and rockfall events became more frequent in January 2013 and February. After that, tremor became increasingly rare and was absent in May although explosion signatures were frequently-occurring throughout that time period. By May 2013, seismicity had decreased to an average of 62 earthquakes per day.
References:Fearnley, C.J., McGuire, W.J., Davies, G., and Twigg, J., 2012, Standardisation of the USGS Volcano Alert Level System (VALS): analysis and ramifications, Bulletin of Volcanology, 74: 2023-2036.
Gardner, C.A. and Guffanti, M.C., 2006, U.S. Geological Survey's Alert Notification System for Volcanic Activity. In: Fact Sheet 2006-3139. U.S. Geological Survey.
Ji, L., Lu, Z., Dzurisin, D., Senyukov, S., 2013, Pre-eruption deformation caused by dike intrusion beneath Kizimen volcano, Kamchatka, Russia, observed by InSAR, Journal of Volcanology and Geothermal Research, 256, 87-95.
Senyukov, S.L., 2013, Monitoring and Prediction of Volcanic Activity in Kamchatka from Seismological Data: 2000-2010, Journal of Volcanology and Seismology, vol. 7, no 1, 86-97.
Siebert, L., Simkin, T., Kimberly, P., 2010, Volcanoes of the World, 3rd edn. University of California Press, Berkeley.
USGS Volcano Hazards Program: Volcano Observatory Notices for Aviation (VONA), 8 June 2013, (http://volcanoes.usgs.gov/activity/vonainfo.php). Accessed 13 June 2013.
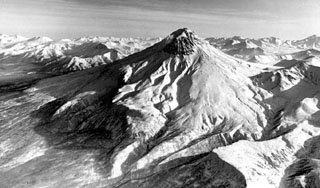
Geological Summary. Kizimen is an isolated, conical stratovolcano that is morphologically similar to St. Helens prior to its 1980 eruption. The summit consists of overlapping lava domes, and blocky lava flows descend the flanks of the volcano, which is the westernmost of a volcanic chain north of Kronotsky volcano. The 2334-m-high edifice was formed during four eruptive cycles beginning about 12,000 years ago and lasting 2000-3500 years. The largest eruptions took place about 10,000 and 8300-8400 years ago, and three periods of long-term lava dome growth have occurred. The latest eruptive cycle began about 3000 years ago with a large explosion and was followed by intermittent lava dome growth lasting about 1000 years. An explosive eruption about 1100 years ago produced a lateral blast and created a 1.0 x 0.7 km wide crater breached to the NE, inside which a small lava dome (the fourth at Kizimen) has grown. Prior to 2010, only a single explosive eruption, during 1927-28, had been recorded in historical time.
Information Contacts: Kamchatka Branch of the Geophysical Service of the Russian Academy of Sciences (KB GS RAS), Piip Ave. 9, Petropavlovsk-Kamchatsky, 683006, Russia; Kamchatka Volcanic Eruptions Response Team (KVERT), Institute of Volcanology and Seismology, Russian Academy of Sciences, Far East Division, 9 Piip Blvd., Petropavlovsk-Kamchatsky 683006, Russia (URL: http://www.kscnet.ru/ivs/); Tokyo Volcanic Ash Advisory Center (VAAC), Tokyo, Japan (URL: http://ds.data.jma.go.jp/svd/vaac/data/); MODVOLC, Hawai`i Institute of Geophysics and Planetology (HIGP), MODVOLC Thermal Alerts System, School of Ocean and Earth Science and Technology (SOEST), Univ. of Hawai`i, 2525 Correa Road, Honolulu, HI 96822, USA (URL: http://modis.higp.hawaii.edu/); Sergey Senukov, Kamchatka Branch of the Geophysical Service, Russian Academy of Sciences (KB GS RAS, Russia (URL: http://www.emsd.ru/); NASA Earth Observatory (URL: http://earthobservatory.nasa.gov/).