Report on Veniaminof (United States) — May 2013
Bulletin of the Global Volcanism Network, vol. 38, no. 5 (May 2013)
Managing Editor: Richard Wunderman.
Veniaminof (United States) Ongoing sporadic eruptions as late as 6 October 2013
Please cite this report as:
Global Volcanism Program, 2013. Report on Veniaminof (United States) (Wunderman, R., ed.). Bulletin of the Global Volcanism Network, 38:5. Smithsonian Institution. https://doi.org/10.5479/si.GVP.BGVN201305-312070
Veniaminof
United States
56.17°N, 159.38°W; summit elev. 2507 m
All times are local (unless otherwise noted)
In our last report on Veniaminof (figure 12) (BGVN 33:05), we noted that on 22 February 2008 several minor ash bursts had occurred, a process common in ten's of Bulletin and predecessor Smithsonian reports going back to 1983 (SEAN 08:05). In this report we provide a brief summary of activity from 1 March 2008 into October 2013, an interval including several episodes with lava flows, ash bursts, elevated seismicity, and ash fall. During 4 May 2008-7 June 2013 the available data suggest comparative quite, although during part of that time the volcano lacked a seismic monitoring system. During the reporting interval, the Aviation Alert Level often shifted between Orange and Yellow (high to intermediate values on a scale from Green to Red). As discussed below, there was also an interval without seismic monitoring announced 17 November 2009 when the hazard status was termed 'unassigned' owing to a seismic instrument outage. This report omits detailed seismic data published by the USGS (eg. Dixon and Stilher, 2009; Dixon and others, 2012). On 30 August 2013 ash plumes rose to over 6 km altitude.
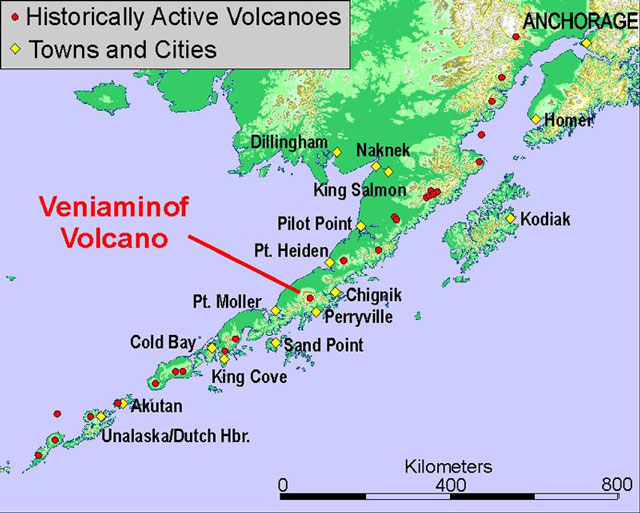 |
Figure 12. Location of Veniaminof on the Alaskan Peninsula. Map courtesy of AVO. |
Table 1 synthesizes available AVO reporting on Veniaminof behavior during February 2008 through 6 October 2013. See their reports for more details. During the interval 4 May 2008 to 7 June 2013 the volcano was often quietly steaming, although seismicity increased during part of May 2009. Several highlights follow. Weather permitting, satellite images showed some days with high elevated surface temperatures at the cinder cone inside the caldera consistent with lava effusion. For example, during 24 July-30 July 2013, a "river of lava" flowed down the cone. As discussed in a subsection below, several noteworthy images were acquired in mid-2013 showing ash and thermal signatures on the volcano. On 30 August 2013 the plume reached over 6 km altitude as an unusually vigorous eruptive event ensued. The last lava emissions of the reporting interval took place on 6 October 2013.
Table 1. Representative dates and noteworthy eruptive or non-eruptive intervals at Veniaminof during March 2008 through late August 2013. Courtesy of AVO.
| Date | Ash plume altitude and movement | Other comments |
| Late Feb through May 2008 | Below 2.7 km | Sporadic increases in seismic and eruptive activity were noted since 11 February, including tremor episodes that lasted 1-2 minutes and occurred several times per hour. Broadly during late February 2008, AVO noted both small ash bursts with local ashfall at the crater accompanied by seismicity, and occasional high thermal fluxes. |
| 4 May 2008-7 June 2013 | (Steaming) | 7-26 May 2009, often quiet steaming with generally low to occasional high seismicity and with absence of thermal anomalies. No reports during other portions of the interval 4 May 2008 to 7 June 2013. Seismic station outage announced 17 November 2009, with seismic reports returning 8 June 2013. |
| 19 June 2013 | 4.6 km NE | Cloudy weather sometimes prevented views of the caldera, although most days satellite images showed very high elevated surface temperatures at the cinder cone inside the caldera consistent with lava effusion. On 19 June, residents in Sandy River reported ash bursts. |
| 24-30 July 2013 | 4.5 km NW | Lava effusion, a "river of lava," flowing down the cone. |
| 14-20 August 2013 | 3.7 km W and then SSE | AVO reported that during 13-15 August seismic tremor at Veniaminof was high, and persistent elevated surface temperatures consistent with lava effusion were visible on satellite imagery. An 18 August webcamera image revealed minor ash emissions. On 19 August a helicopter overflight revealed two lava flows On 20 August, trace ash fall reported in Perryville ((32 km SSE); they also heard hearing explosions; infrasound equipment in Dillingham (322 km NE) also detected impulses. |
| 21 Aug-20 Oct 2013 | 4.6-6.7 km SE | 27-29 Aug, episodic tremor bursts interpreted as lava effusion and emissions; prominent satellite thermal anomalies. On 30 Aug, some of the strongest emissions since the eruption began in June 2013; ongoing into early Sept but diminishing in late Sept, and without evidence of eruption in satellite and webcamera data on and around 20 Sept. A lava effusion was recognized 6 October, then waning by mid-October. |
As noted above and in table 1, non-eruptive steaming prevailed at the volcano during much or all of the interval 4 May 2008-7 May 2009. On 17 November 2009 AVO announced that Veniaminof was one of four volcanoes in Alaska that they could no longer monitor because of seismic station outages. They then shifted both their Alert Level of Normal and the Aviation Color Code of Green to the category "unassigned." AVO stated that these volcanoes "will likely remain without real-time seismic monitoring until next summer, when necessary upgrades at these and other networks will occur. As at other volcanoes without real-time seismic networks, AVO will continue to use satellite data and reports from pilots and ground observers to detect signs of eruptive activity."
Following the announced station outage, the next update at Veniaminof was on 8 June 2013.
Pilots of aircraft PEN241 saw on 27 August 2013 intermittent ash discharges at 1720 UTC . "Occasional ash to [~3 km a.s.l.] moving NNE. Cloud height up to [~4 km a.s.l.] every 2-5 minutes." This reporting was transmitted to Air Traffic authorities and then to Bulletin editors via the Volcanic Activity Reporting Form (VAR; Appendix 2 of Federal Aviation Administration, 2012). Reports like these are valuable to engineers and scientists who benefit from the direct observations provided by pilots.
During 6-7 May 2009, seismic activity from Veniaminof increased, prompting AVO to raise the Volcanic Alert Level to Advisory and the Aviation Color Code to Yellow. Small magnitude earthquakes occurred at rates of 5-10 per hour during quieter periods and 1-3 per minute during periods of more intense activity. Visual observations indicated typical steaming from the summit caldera cone. Seismicity remained elevated during 8-12 May 2009. On 26 May 2009, AVO reported that seismicity from Veniaminof had decreased during the previous week. The Volcanic Alert Level was lowered to Normal and the Aviation Color Code was lowered to Green.
During 2010-12 the volcano was relatively quiet (table 1). There were no AVO weekly reports on Veniaminof during this interval.
On 13 June 2013, low-level emissions led the AVO to increase the aviation color code to orange. The Anchorage Volcanic Ash Advisory Center (VAAC) reported on 15 June 2013 that the eruptions had ended, but AVO still reported intermittent activity continuing through 8 July 2013. In addition, MODVOLC had detected 248 thermal alerts during 14 June-11 July 2013 (figure 13).
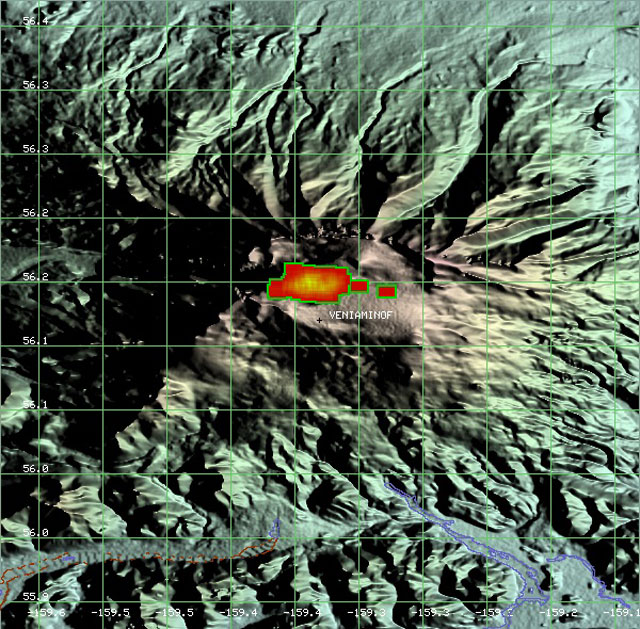 |
Figure 13. This image of Veniaminof displays MODVOLC thermal alerts from 14 June 2013 to 11 July 2013. Thermal alerts from MODVOLC are derived from data collected by the MODIS thermal sensors aboard the Aqua and Terra satellites and processed by the Hawaii Institute of Geophysics and Planetology using the MODVOLC algorithm. Note that the hotspots (red) are clustered in the immediate region of the summit and are not wildfires. |
July 2013 activity. Figure 14 shows a satellite image from 4 July 2013 portraying both ash desposits on the snow surface and the thermal signature of an ongoing lava flow. On 8 July 2013, AVO reported that nearly continuous, low-level volcanic tremor had occurred during the previous 24 hours. Cloudy satellite images detected thermal anomalies (figure 14). Web camera images from Perryville (32 m SSE) showed incandescence from the Veniaminof intracaldera cone.
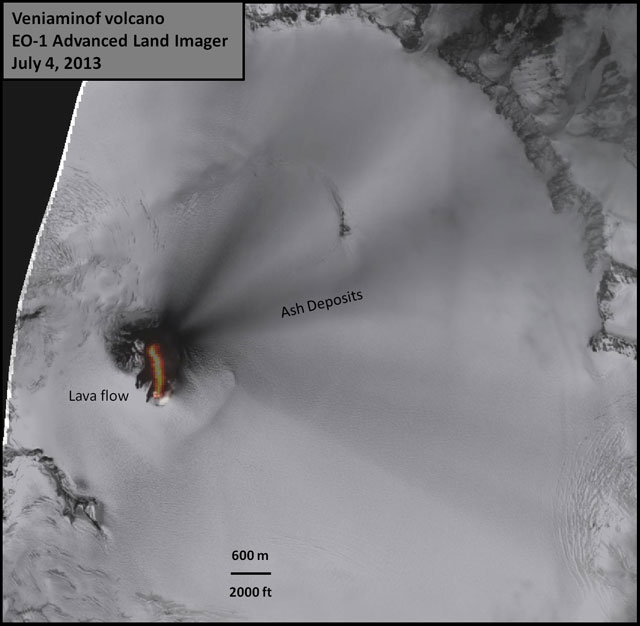 |
Figure 14. This satellite image from 4 July 2013 shows thermal emissions from an active lava flow as detected by shortwave infrared data, The image also shows ash deposits covering the snow fields that engulf the volcano. N is to the top. The ash appears as radial spokes due to deposition during changing wind directions. The lava flow was active at the time of this photo, extending southward from the vent. Image courtesy of Alaska Volcano Observatory. |
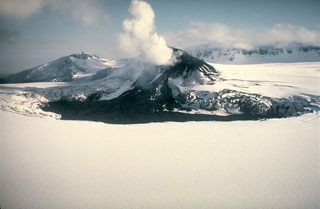
AVO reported that the ongoing low-level eruption of Veniaminof, characterized by lava effusion and emission of minor amounts of ash and steam, continued during 26 June-8 July 2013, indicated by nearly continuous volcanic tremor and occasional small explosions detected by the seismic network. Figure 15 shows a photo taken on 26 June. Satellite images showed elevated surface temperatures at the cinder cone inside the caldera consistent with lava effusion. During 26-30 June web camera images from Perryville showed a small light-colored plume rising above the cone to just above the rim of the caldera, and night time images showed persistent incandescence from the cone. The Volcano Alert Level remained at Watch and the Aviation Color code remained at Orange.
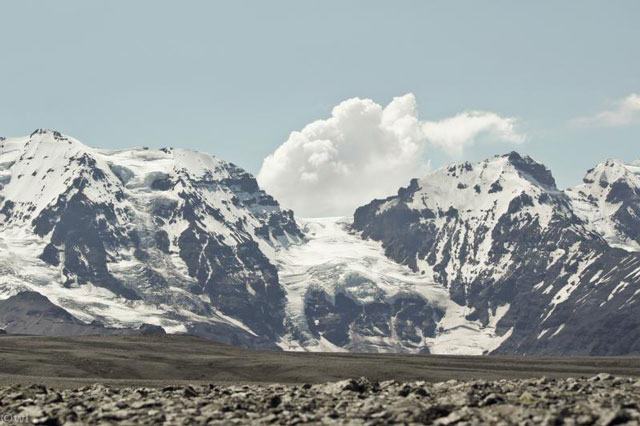 |
Figure 15. Steam rising from the active intracaldera cone of Veniaminof. The photo was taken from ~600 m elevation, looking SW toward the volcano on 26 June 2013. Photo courtesy of Will Lawrence. |
2008-2011 seismicity. According to Dixon and others (2009) and additional AVO reports, the monitoring network for Veniaminof included nine stations, at least through 2011. The network experienced intermittent outages (eg. figure 16 of broken solar panel.) The number of recorded earthquakes between 2008-2011 is presented in table 1.
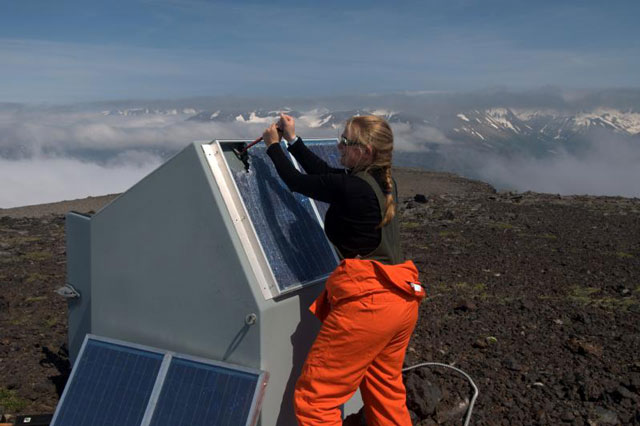 |
Figure 16. Helena Buurman works to remove smashed solar panels at station VNFG- one of the main repeaters in the Veniaminof network (17 July 2010). Photo courtesy of Cyrus Read. |
Table 2. Veniaminof VT and LF earthquakes detected during 2008-2011. Because of occasional equipment outages, values in the table may under-represent actual numbers. Values for 2012 were not yet available. Sources included Dixon and others (2008, 2009, 2010, 2011).
| Year | Earthquakes located | Volcano-tectonic (VT) | Low frequency (LF) |
| 2008 | 17 | 14 | 3 |
| 2009 | 4 | 3 | 1 |
| 2010 | 22 | 18 | 4 |
| 2011 | 7 | 6 | 1 |
2009 annual seismicity. The Aniakchak, Cerberus, Gareloi, Great Sitkin, Pavlof, Veniaminof, and Wrangell subnetworks had insufficient numbers of located earthquakes to calculate a Mc. The Mc ranged from -0.1 to 1.5 for the individual subnetworks.
2010 annual seismicity. The seismograph networks on Aniakchak, Korovin, and Veniaminof were repaired in 2010. There were many station outages in the previous two years.
Seismicity at Veniaminof and Westdahl were the only areas in which an increase over the seismicity in 2009 was noted. The increase in seismicity at Veniaminof was a result of a small swarm of activity northwest of the active cone in late July.
2011 annual seismicity. There were fewer station outages and more than four were operating during the year. Veniaminof had insufficient numbers of located earthquakes in 2011 to calculate a magnitude completeness.
References. Dixon, J.P., Stihler, S.D., Power, J.A., and Searcy, C.K., 2011, Catalog of earthquake hypocenters at Alaskan Volcanoes: January 1 through December 31, 2010: U.S. Geological Survey Data Series 645, 82 p.
Dixon, J.P., Stihler, S.D., Power, J.A., and Searcy, C.K., 2012, Catalog of earthquake hypocenters at Alaskan Volcanoes: January 1 through December 31, 2011: U.S. Geological Survey Data Series 730, 82 p.
Dixon, J.P., Stihler, S.D., Power, J.A., and Searcy, Cheryl, 2010, Catalog of earthquake hypocenters at Alaskan volcanoes: January 1 through December 31, 2009: U.S. Geological Survey Data Series 531, 84 p.
Dixon, J.P., and Stihler, S.D., 2009, Catalog of earthquake hypocenters at Alaskan volcanoes: January 1 through December 31, 2008: U.S. Geological Survey Data Series 467, 86 p.
Federal Aviation Administration, 2012, Aeronautical Information Manual, Official Guide to Basic Flight Information and ATC Procedures (issued 9 February 2012; with revisions as late as 22 Aug ust 2013) (URL: http://www.faa.gov/air_traffic/publications/atpubs/aim/index.htm).
Geological Summary. Veniaminof, on the Alaska Peninsula, is truncated by a steep-walled, 8 x 11 km, glacier-filled caldera that formed around 3,700 years ago. The caldera rim is up to 520 m high on the north, is deeply notched on the west by Cone Glacier, and is covered by an ice sheet on the south. Post-caldera vents are located along a NW-SE zone bisecting the caldera that extends 55 km from near the Bering Sea coast, across the caldera, and down the Pacific flank. Historical eruptions probably all originated from the westernmost and most prominent of two intra-caldera cones, which rises about 300 m above the surrounding icefield. The other cone is larger, and has a summit crater or caldera that may reach 2.5 km in diameter, but is more subdued and barely rises above the glacier surface.
Information Contacts: Alaska Volcano Observatory, a cooperative program of a)U.S. Geological Survey, 4200 University Drive, Anchorage, AK 99508-4667 USA URL: http://www.avo.alaska.edu/); b)Geophysical Institute, University of Alaska, PO Box 757320, Fairbanks, AK 99775-7320 USA and c)Alaska Division of Geological & Geophysical Surveys, 794 University Ave., Suite 200, Fairbanks, AK 99709, USA (URL: http://www.dggs.alaska.gov/); Anchorage Volcanic Ash Advisory Center (VAAC), 6930 Sand lake Road Anchorage, AK 99502-1845 USA (URL: http://vaac.arh.noaa.gov/); and Hawai'i Institute of Geophysics and Planetology (HIGP), MODVOLC Thermal Alert System, School of Ocean and Earth Science and Technology (SOEST), University of Hawai'i, 2525 Correa Road, Honolulu, HI 96822, USA (URL: http:hotspot.higp.hawaiii.edu/).