Report on Fuego (Guatemala) — May 2013
Bulletin of the Global Volcanism Network, vol. 38, no. 5 (May 2013)
Managing Editor: Richard Wunderman.
Edited by Julie A. Herrick.
Fuego (Guatemala) Continuous activity and a VEI 3 eruption during 13-14 September 2012
Please cite this report as:
Global Volcanism Program, 2013. Report on Fuego (Guatemala) (Herrick, J.A., and Wunderman, R., eds.). Bulletin of the Global Volcanism Network, 38:5. Smithsonian Institution. https://doi.org/10.5479/si.GVP.BGVN201305-342090
Fuego
Guatemala
14.4748°N, 90.8806°W; summit elev. 3799 m
All times are local (unless otherwise noted)
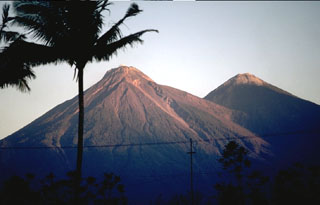
In this report we highlight Fuego's ongoing eruptive activity during January 2011-March 2013. Elevated activity occurred during May-September 2012 and included regular thermal, gas, and ash emissions with occasional lava fountaining and pyroclastic flows. Activity peaked during 13-14 September 2012 with a VEI 3 (Volcanic Explosivity Index; where 3 is considered moderate (Newhall and Self, 1982)) summit eruption and SW-directed pyroclastic flow.
During this reporting period, continuous monitoring efforts by the Instituto Nacional de Sismologia, Vulcanología, Meteorología e Hidrologia (INSIVUMEH) included seismic monitoring, regular ground-based observations, and field visits. The Washington Volcanic Ash Advisory Center (VAAC) regularly included monitoring data from INSIVUMEH with satellite remote sensing emissions announcements. We also summarize a recent international collaboration between INSIVUMEH and the International Volcano Monitoring Fund (IVM-Fund) during 2010-2013.
Local observers reported ashfall, shockwaves, and lahars. According to INSIVUMEH, during 2011-2013, ashfall and explosive sounds were frequently reported by communities located within the W sector and up to 8 km of Fuego's summit. Lahars occurred on the S-sector flank in the Taniluyá, Ceniza, Santa Teresa, Las Lajas, and Trinidad drainages (figure 16). Those drainages were also hazardous due to channelization of pyroclastic flows, block avalanches, and lava flows (figure 17); significant events occurred in mid-to-late 2012 and February 2013 (described later in this report). On the SE flank, Las Lajas was frequently affected by pyroclastic flows, and the drainages Taniluyá and Ceniza (SW flank) occasionally contained active lava flows and block avalanches.
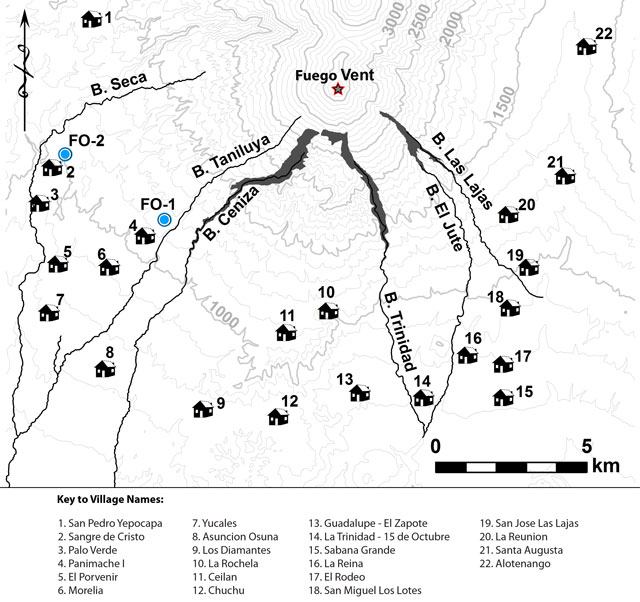 |
Figure 16. This location map includes villages (numbered), observation sites in Panimaché I (FO-1) and Sangre de Cristo (FO-2), and primary drainages located within 15 km of Fuego's summit vent (red star). Elevation contours are shown for 100 m intervals. Pyroclastic flow deposits from 13 September 2012 are shown as dark gray areas within Ceniza, Trinidad, El Jute, and Las Lajas drainages. Courtesy of Rüdiger Escobar-Wolf (Michigan Technological University). |
 |
Figure 17. This annotated photograph is centered on Fuego's SW flank, the location of the Ceniza drainage, which channeled the major pyroclastic flow of 13 September 2012. The yellow dotted line marks the centerline of the pyroclastic flow; the orange lines enclose the region burned and scoured by ash cloud surges. Courtesy of INSIVUMEH. |
Thermal anomaly detection during 2011-2013. Hotspots from the summit region were detected by satellite remote sensing instruments including MODIS (onboard the Terra and Aqua satellites), Landsat 7, and EO-1 Advanced Land Imaging (ALI) throughout this reporting period.
The MODVOLC thermal alert system recorded ~90 significant anomalies between 1 January 2011 and 1 January 2012, ~375 between 1 January 2012 and 1 January 2013 when explosive activity escalated, and ~255 between 1 January 2013 and 31 March 2013 when lava flows were active near the summit region (figure 18). Thermal anomalies were detected by satellite images at least once per month from January 2011 through March 2013 except for July 2011, suggesting poor weather may have inhibited satellite observations that month (note that heaviest rainfall typically occurs during June-October (The World Bank, 2013)). During July 2011, ground-based observations of nighttime incandescence were noted in INSIVUMEH's Report # 1863; other reports that month highlighted the effects of heavy rain from tropical storms and Hurricane Calvin.
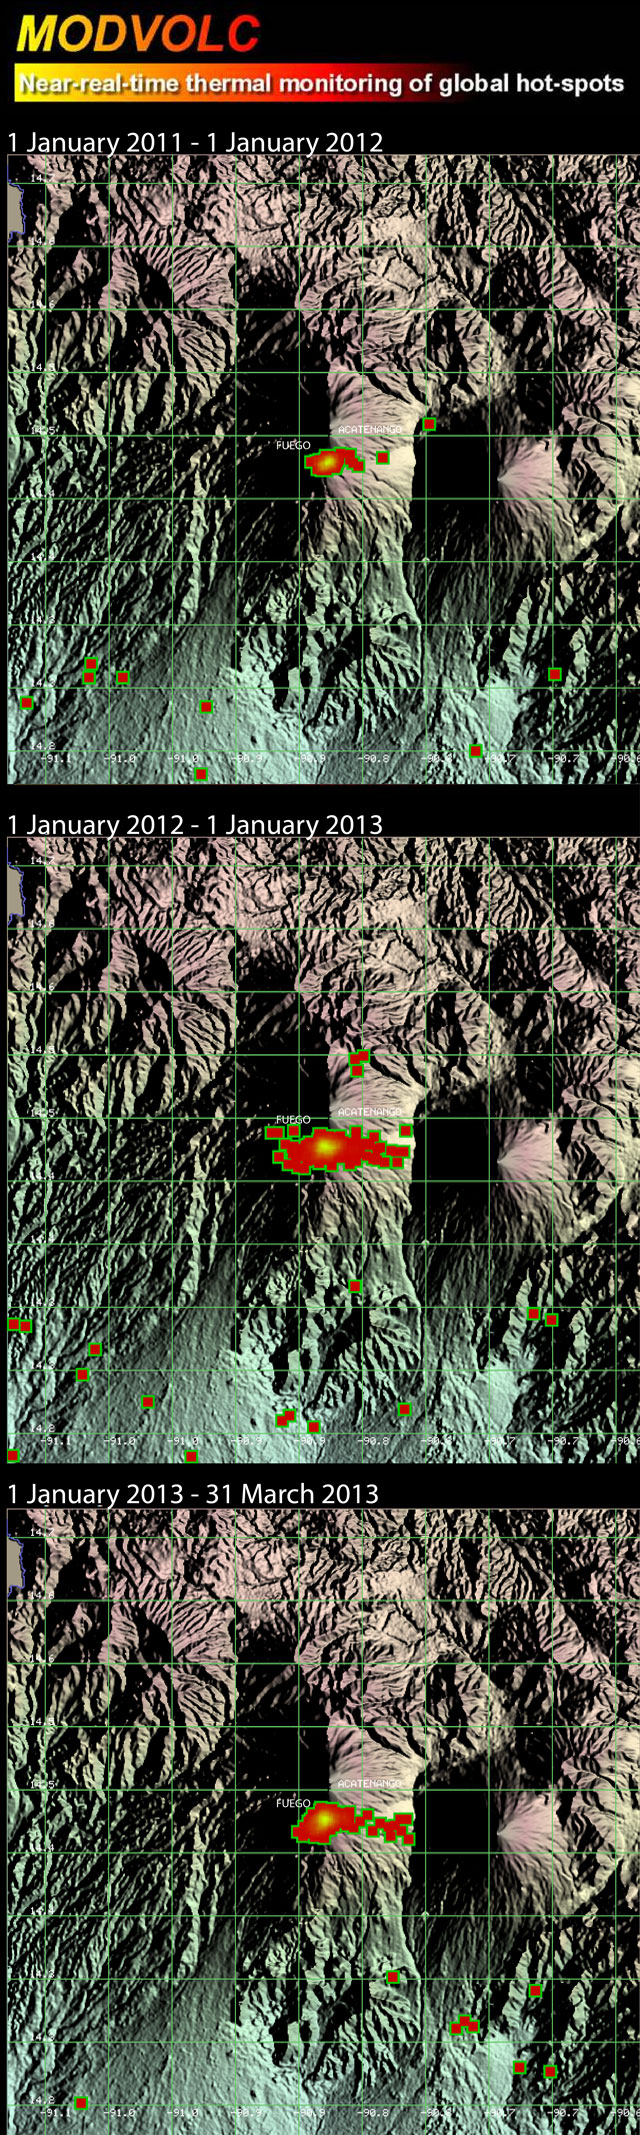 |
Figure 18. During 1 January 2011-31 March 2013, the MODVOLC system frequently detected elevated temperatures in the area of Fuego's summit. This series of images includes hotspots detected during three time periods: 2011, 2012, and 1 January-31 March 2013. Courtesy of the Hawai`i Institute of Geophysics and Planetology (HIGP), MODVOLC Thermal Alerts System. |
MODVOLC continued to detect hotspots during late April 2013 totaling 22 pixels during 21-28 April. Thermal anomalies became rare during May and June 2013; one pixel was detected on three different days.
Regular images captured by ALI and Landsat 7 detected variable incandescence from Fuego's summit during 2011-2013 (figure 19). During 2011, hotspots were mainly located at Fuego's summit; however, during March and December, distinctively elongate, incandescent lava flows extended from the summit to the SW (figure 19A and 19B).
 |
Figure 19. Satellite images from 2011-2013 detected incandescence from Fuego's summit area. (A) This ALI image from 3 February 2011 showed a small region of incandescence isolated at the summit. (B) A Landsat 7 image from 7 November 2011 revealed a ~300 m incandescent flow originating from the summit and extending down the SW flank. (C) This Landsat 7 image from 4 September 2012 (nine days before the VEI 3 eruption began) captures intense incandescence that extends in three directions from the summit; some image distortion is present from cloudcover and artifact stripes (on the left-hand side). Distinctive yellow regions indicate lava reaching at least 500 m SE and SW. (D) This ALI image from 20 March 2013 captures a lava flow extending ~1,500 m SW from the summit crater within the upper region of the Ceniza drainage; some cloudcover blocks the middle region of the lava flow, but the red glow is visible and especially bright at the termination point SW of the clouds. Image processing by Rüdiger Escobar-Wolf (Michigan Technological University); courtesy of NASA/USGS. |
Summit incandescence extending SW, SE, and in the immediate summit area was visible during 2012; some of the strongest incandescence extended at least 1 km from the summit to the SW during November-December. Incandescent flows directed SE appeared in April, June, and September. On 4 September 2012, three narrow flows were visible from the summit extending ≥ 500 m from the summit within the S sector; despite significant cloudcover that day and image artifacts, the lava flows were well-defined (figure 19C).
Satellite images from December 2012 through January 2013 included a long lava flow that persisted in the SW drainage (Ceniza), although cloudcover frequently obscured the full view of Fuego's SW quadrant. That incandescent lava flow remained visible in satellite images until late February 2013. Incandescence was isolated at the summit in early March, but on 20 March incandescence re-appeared within the Ceniza drainage and extended ~2,000 m SW of the summit (figure 19D).
Effusive activity during 2011-2013. The style of eruptive activity at Fuego changed near the end of 2010 when lava effusion events started to occur more frequently than explosive eruptions (figure 20). "At a very general level, the more Strombolian eruptions happen typically during lava effusion times and are much smaller than the more Vulcanian eruptions," commented Rüdiger Escobar-Wolf (Michigan Technological University) with respect to Fuego's more than 12 year-long eruption. Continuous unrest (background-level explosions and effusion) was frequently punctuated by short periods of elevated activity during the preceding six years and, during 2012 and 2013, this activity was interrupted by several significant episodes: in 2012, 25-26 May; 10-11 June; 3-4 and 13-14 September; and in 2013, 17-18 February; 3-4 and 19-20 March (figure 19D).
 |
Figure 20. Fuego time series from late 1999 to early 2013 with color codes indicating eruption style (Escobar-Wolf, 2013). Beginning in 1999, the eruption mainly consisted of periods of explosive events (color coded as green) and lava effusion (coded as gray); this constant unrest is considered background activity that has been occasionally interrupted with significant episodes (red lines). This timeline was created and provided by Rüdiger Escobar-Wolf, Michigan Technological University. |
The Washington VAAC released an increasing number of notices for the aviation community about volcanic ash throughout 2011- March 2013 (table 8). During 2011, these announcements rarely contained calculated plume altitudes due to poor viewing conditions with satellite remote sensing. Data from INSIVUMEH supplemented these reports with direct observations from Fuego Volcano Observatory, located in Panimaché, 8 km SW of Fuego. On 1 January, 8 January, 23 October, and 24 December 2011, reported plume altitudes were less than 5.2 km a.s.l. and had drift speeds in the range of 2.5-10 m/s, drifting S and SW of Fuego's peak.
Table 8. The Washington VAAC released regular advisories due to emissions from Fuego during 2011-March 2013. Date, time, altitude, drift direction, and reporting sources are included as well as comments that described additional eruption characteristics such as thermal anomalies and weather conditions that may have affected observations. Drift velocities and plume width were also calculated when viewing conditions were optimal. INSIVUMEH was a frequent contributor to these reports; other reporting sources included the satellite GOES-2 (NOAA geostationary weather satellite), MWO (local Meteorological Watch Office), Guatemala City's (MGGT) meteorological reports (METAR), and the global numerical weather prediction models GFS and NAM. Courtesy of Washington VAAC.
| Date - Time (UTC) | Altitude (km) | Drift Direction | VAAC Sources | Comments |
| 01 Jan 2011 - 1515 | 5.2 | 9 km wide line; W 10 m/s | GOES-13. GFS WINDS. | Several small emissions. |
| 08 Jan 2011 - 1015 | 5.2 | 18.5 km wide plume; SW 2.6-5 m/s | GOES-13. GFS WINDS. | Multiple exhalations since 08/0600 UTC; these explosions have been seen in satellite before dissipating. |
| 13 Feb 2011 - 0504 | -- | -- | GOES-13. INSIVUMEH. | INSIVUMEH reported increased activity within the summit area; low height emissions of volcanic ash moving W; hot spot was also detected in short wave infrared imagery. |
| 14 Feb 2011 - 0427 | -- | -- | GOES-13. INSIVUMEH. | INSIVUMEH continued to report low levels of volcanic ash near the summit. |
| 15 Feb 2011 - 0427 | -- | -- | GOES-13. INSIVUMEH. | Only steam reported. |
| 23 Oct 2011 - 1327 | -- | -- | GOES-13. | Information received about a possible volcanic ash eruption. |
| 23 Oct 2011 - 1245 | 4.3 | W 2.6-5 m/s | GOES-13. GFS WINDS. | Confidence in height of volcanic ash is medium-high based on movement and density of ash in models and satellite imagery. |
| 22 Nov 2011 - 1530 | -- | -- | GOES-13. INSIVUMEH. | Ash observed at 1530 UTC. |
| 22 Nov 2011 - 1745 | -- | -- | Tegucigalpa MWO. GOES-13. GFS WINDS. INSIVUMEH. | INSIVUMEH observed thin plume of possible ash moving SW at 5 m/s at 1530 UTC. This weak plume was observed in satellite imagery at 1415 UTC but had dissipated by 1545 UTC. |
| 02 Dec 2011 - 1845 | -- | -- | Tegucigalpa MWO. GOES-13. GFS WINDS. INSIVUMEH. | INSIVUMEH reported emission of gases near the summit and light ash that was too small to see in clear satellite imagery. Ash was reported to 305 m above the summit and dispersing SW around 18.5 km. |
| 06 Dec 2011 - 1845 | -- | -- | GOES-13. GFS WINDS. INSIVUMEH. | INSIVUMEH reported volcanic ash cloud to 3 km observed at 1600 UTC. No ash was observed in satellite imagery. |
| 24 Dec 2011 - 1904 | -- | -- | GOES-13. INSIVUMEH SEISMIC DETECTION. | Small narrow plume of unknown content began around 1645 UTC; VAAC received information suggesting a possible ash eruption. |
| 24 Dec 2011 - 1845 | 4 | 5.6 km wide line; S 2.5 m/s | GOES-13. INSIVUMEH SEISMIC DETECTION. | Small plume of gases with possible ash extended 9 km; small puff seen in visible imagery started around 1645 UTC and drifted S 2.5 m/s; estimated height 4 km a.s.l. with wind forecast uncertain. Plume was projected to dissipate within 6 hours. |
| 25 Dec 2011 - 0015 | -- | -- | GOES-13. | A possible eruption at 1845 UTC; ash not identifiable in satellite imagery; there were no reports of ash. |
| 03 Jan 2012 - 2041 | -- | -- | GOES-13. | Possible volcanic ash detected in visible imagery at 2015 UTC moving SE. |
| 03 Jan 2012 - 2045 | 5 | 3.7 km wide line; S 2.6 - 5 m/s | GOES-13. GFS WINDS. INSIVUMEH. | Small puff seen in visible imagery at 5 km a.s.l. moving SE 3.5 m/s. At 2045 UTC the leading edge was 12 km SE of summit and dispersing. Plume was projected to dissipate within 6 hours. |
| 16 Jan 2012 - 1724 | -- | -- | INSIVUMEH. | The VAAC received information suggesting a possible volcanic ash emission. |
| 16 Jan 2012 - 1740 | -- | -- | GOES-13. GFS WINDS. INSIVUMEH. | INSIVUMEH reported ash to 4.3 km; no ash seen in imagery through 1715 UTC with clear skies. |
| 18 Jan 2012 - 1215 | 6.7 | W at 5-7.5 m/s | GOES-13. GFS WINDS. | Visible and multi-spectral imagery showed a single puff of gas and ash moving W from the summit; ash was projected to dissipate within a few hours as it continued W. A hotspot was detected. |
| 01 Feb 2012 - 1645 | -- | -- | GOES-13. GFS WINDS. INSIVUMEH. | INSIVUMEH reported ash to ~5 km at 01/1600 UTC; ash not observed in satellite imagery even with sparse clouds. |
| 01 Apr 2012 - 1315 | 5 | 9.3 km wide line; SW 2.6-5 m/s | GOES-13. GFS WINDS. NAM WINDS. | Plume extended 13 km WSW from the summit; well-defined hotspot seen in imagery; forecast confidence was low based on latest GFS and NAM. |
| 19 May 2012 - 0915 | -- | -- | GOES-13. GFS WINDS. INSIVUMEH. | Ash was not seen in satellite imagery due to darkness; hotspot was visible; INSIVUMEH reported volcanic ash up to 5.5 km a.s.l. to 40 km SW of the summit. |
| 19 May 2012 - 1515 | -- | -- | GOES-13. GFS WINDS. INSIVUMEH SEISMIC DETECTION. INSIVUMEH Photos. | Ash was not seen in satellite imagery due to cloudcover; a strong hotspot was visible in satellite multispectral imagery; seismicity was high. |
| 19 May 2012 - 2045 | -- | -- | GOES-13. GFS WINDS. METAR. INSIVUMEH. |
Volcanic ash was not detected in satellite imagery due to extensive cloud cover; INSIVUMEH indicated pyroclastic flows likely and ashfalls have been observed. |
| 20 May 2012 - 0245 | -- | -- | GOES-13. GFS WINDS. | Ash was not observed in satellite imagery due to cloudcover; hotspot had decreased in intensity and late afternoon bulletin indicated decreased energy. |
| 20 May 2012 - 1415 | -- | -- | GOES-13. NAM WINDS. INSIVUMEH. | No ash was observed in imagery although there were thick clouds in the area; INSIVUMEH reported ash emissions up to 3,000 m above the summit moving SW. |
| 20 May 2012 - 1945 | -- | -- | GOES-13. GFS WINDS. INSIVUMEH SEISMIC DETECTION. | No ash was seen in imagery due to cloudcover; seismic signal has almost gone to background but with very occasional bursts that may contain volcanic ash. |
| 21 May 2012 - 0045 | -- | -- | GOES-13. GFS WINDS. INSIVUMEH. | No volcanic ash detected due to cloudcover; INSIVUMEH's evening report only mentioned occasional emission of ash to 4 km a.s.l. or just above the crater drifting SW and dispersed within 9.3 km; seismic activity was back to normal with only occasional small bursts. |
| 25 May 2012 - 1542 | -- | --; | GOES-13. INSIVUMEH. | Eruption of lava began around 1300 UTC; some volcanic ash was possible. |
| 25 May 2012 - 1615 | -- | -- | GOES-13. GFS WINDS. INSIVUMEH SEISMIC DETECTION. METAR. Pilot Report. INSIVUMEH. | No plume was seen in satellite imagery due to partly cloudy conditions; pilot report of ash to 7 km a.s.l. moving SW; lava flows generated volcanic ash and gas; no explosive eruption seen in the seismic records; ash was forecasted to moving SW; a strong hotspot was visible in satellite imagery. |
| 26 May 2012 - 0415 | -- | -- | GOES-13. GFS WINDS. | Volcanic ash was not detected in satellite imagery due to extensive cloudcover; INSIVUMEH indicated constant pyroclastic flows and reports of ashfall. |
| 26 May 2012 - 1015 | -- | -- | GOES-13. GFS WINDS. SEISMIC DETECTION. |
Volcanic ash was not seen due to darkness and weather conditions; strong hot spot was visible in satellite imagery and seismic activity remained elevated. |
| 26 May 2012 - 1615 | -- | -- | GOES-13. GFS WINDS. INSIVUMEH SEISMIC DETECTION. | Ash was not seen in imagery due to cloud cover; INSIVUMEH indicated that ash and gas emissions continued. |
| 26 May 2012 - 2215 | -- | -- | GOES-13. GFS WINDS. INSIVUMEH SEISMIC DETECTION. | Ash was not seen in satellite imagery due to cloudcover; INSIVUMEH reported decreasing seismicity; a hot spot persisted in multispectral imagery. |
| 27 May 2012 - 0415 | -- | -- | GOES-13. INSIVUMEH. | INSIVUMEH indicated ongoing lava flows; decreasing seismic activity and no mention of ashfall in the most recent report. |
| 05 Jun 2012 - 1732 | -- | -- | GOES-13. INSIVUMEH. | INSIVUMEH reported increasing activity and suggested that an explosive eruption with little or no warning was possible; hot spot was seen in satellite imagery but no volcanic ash due to cloud cover. |
| 06 Jun 2012 - 1729 | -- | -- | GOES-13. INSIVUMEH. | INSIVUMEH reported intermittent explosions expelling ash and gas up to ~600 m above the summit; they warned that an explosive eruption with little or no warning was possible. |
| 07 Jun 2012 - 1715 | -- | -- | GOES-13. INSIVUMEH. | INSIVUMEH reported activity that was limited to within 11 km of the summit; no ash was visible in satellite imagery due to partly cloudy conditions. |
| 11 Jun 2012 - 0945 | -- | -- | Tegucigalpa MWO. GOES-13. GFS WINDS. INSIVUMEH. | No ash seen in satellite imagery due to nighttime darkness; hotspots see for last few hours. INSIVUMEH reported ash to 5 km. |
| 11 Jun 2012 - 1545 | -- | -- | GOES-13. INSIVUMEH. | No ash was seen in imagery although there was some cloudcover; there was a strong hotspot occasionally seen in shortwave imagery; INSIVUMEH reported continuous ash emissions up to 15 km to the W and WNW of volcano. |
| 21 Jun 2012 - 1552 | -- | -- | Tegucigalpa MWO. GOES-13. GEOPHYSICAL INST. EMAILED PHOTOS. |
No ash detected due to cloudcover; INSIVUMEH reported ash moving E from rockfalls and aided by heat of lava flows; bit hotspots were visible through clouds. |
| 21 Jun 2012 - 2138 | -- | -- | GOES-13. GFS WINDS. | No ash detected in visible satellite imagery due to cloudcover; hotspot seen in infrared imagery. |
| 22 Jun 2012 - 0340 | -- | -- | GOES-13. GFS WINDS. | No ash seen in visible or multispectral satellite imagery due to night time darkness and cloudcover; hotspot observed prior to clouds moving in 22/0015 UTC. |
| 03 Sep 2012 - 1415 | 4.3/5.2 | 5.6 km wide line; SW 5-7.5 m/s 7.4 km wide line; W 2.6-5 m/s |
GOES-13. GFS WINDS. | Ash plume height confidence is medium, the estimation is based on models and history of volcanic activity; a well-defined hotspot was seen overnight. |
| 03 Sept 2012 - 2015 | -- | -- | GOES-13. GFS WINDS. INSIVUMEH SEISMIC DETECTION. | Due to clouds, no good detection of ash but before the clouds arrived, faint ash was seen W-SW as far as 27.7 km; strong hotspots due to lava flows and rockfalls. |
| 04 Sep 2012 - 0145 | -- | -- | GOES-13. GFS WINDS. INSIVUMEH SEISMIC DETECTION. | No ash detected due to clouds and darkness; multiple hotspots were seen due to rockfalls and lava flows; some ashfall was reported SW of the summit up to 13 km. |
| 04 Sep 2012 - 0445 | 4.5 | W 2.6-5 m/s | GOES-12. GFS WINDS. INSIVUMEH SEISMIC DETECTION. | A plume was visible in multispectral imagery extending about ~145 km W of the summit. |
| 04 Sep 2012 - 1015 | 4.5 | W 2.6-5 m/s | GOES-13. | A continuous emission of ash was visible in multispectral imagery extending ~145 km W of volcano; large hotspot was detected by shortwave imagery. |
| 04 Sep 2012 - 1615 | -- | -- | GOES-13. GFS WINDS. INSIVUMEH. | Ash was not seen due to weather conditions; strong hotspot remains in thermal imagery and INSIVUMEH reported elevated seismic activity. |
| 04 Sep 2012 - 2145 | -- | -- | GOES-13. GFS WINDS. INSIVUMEH SEISMIC DETECTION. | No ash or hotspots detected due to thick clouds; INSIVUMEH reported continued lava flows and rockfalls that generated ash to ~4.5 km a.s.l. moving SW; ashfall was reported up to 15 m SW and W of the summit. |
| 05 Sep 2012 - 1545 | -- | -- | GOES-13. INSIVUMEH. | Ash not seen in the satellite imagery due to partly cloudy skies; a faint hotspot was visible in the morning; INSIVUMEH confirmed that no ash emissions were detected. |
| 13 Sep 2012 - 1115 | 5 | W 7.5 m/s | GOES-13. GFS WINDS. INSIVUMEH. | Faint plume was detected with multispectral imagery that extended ~111 km W; INSIVUMEH reported ash up to 1,000 m above the summit and moving W and SW. |
| 13 Sep 2012 - 1602 | 4.5 /6.7 | SW 7.5 m/s / SW 7.5-10 m/s | GOES-13. GFS WINDS. INSIVUMEH. | INSIVUMEH reported new emission to 3,000 m above the summit W and SW of the summit. 13/1602 UTC image showed a dense ash plume spreading W and SW. Imagery through 13/1632 UTC showed dense volcanic ash emissions continuing. |
| 13 Sep 2012 - 2045 | 7.3 | W 10-13 m/s | GOES-13. GFS WINDS. METAR. INSIVUMEH. |
Ash plume was 148 km wide and extended 226 km W of summit; ash was reported at MGGT METAR station. |
| 14 Sep 2012 - 0045 | 7.3 | W 10-13 m/s | GOES-13. GFS WINDS. METAR. INSIVUMEH. |
Ash plume was 111 km wide and extended 417 W of the summit; ash closest to summit was obscured by cloudcover and was likely rained out; METAR from MGGT continued to report ash. |
| 14 Sep 2012 - 0710 | 4.3 /7.3 | W 5 m/s / W 5 m/s | GOES-13. GFS WINDS. INSIVUMEH. | A bright hotspot persisted with a small plume in multispectral imagery extending 36 km to the W of the summit; latest report indicated current activity was more intermittent and lower in height; larger area to 7.3 km a.s.l. continued to dissipate about 648 km to W of summit moving W. |
| 14 Sep 2012 - 1245 | 4 /7.3 | W 7.5-10 m/s / W 10-13 m/s | GOES-13. GFS WINDS. METAR. INSIVUMEH. |
Multispectral imagery showed dissipating ash to 7.3 km a.s.l. between 370 km and 926 km W moving W; in addition, continuous attached plume to 4 km a.s.l. was seen moving SW; local surface observations reported 4 km a.s.l. |
| 14 Sep 2012 - 1845 | 6 | W 10 m/s | GOES-13. GFS WINDS. INSIVUMEH. | A dissipating area of ash, about ~1,000 km W of the summit, was detected in multispectral imagery; no ash was seen near the summit at 1845 UTC; INSIVUMEH reported ash emissions within 15 km of the summit. |
| 15 Sep 2012 - 0045 | -- | -- | GOES-13. GFS WINDS. INSIVUMEH SEISMIC DETECTION. | No ash was detected in satellite imagery; the previous plume located S of Mexico had dispersed around 14/2200 UTC. INSIVUMEH reported weaker seismic activity with rockfalls generating ash plumes to 4 km a.s.l. and 15 km W-SW of the summit; a strong hotspot was visible. |
| 29 Sep 2012 - 1245 | -- | -- | GFS WINDS. GOES-14. INSIVUMEH. | In the morning, satellite imagery detected discreet puffs of ash moving W and WSW from the summit; INSIVUMEH reported ash 500 m to 900 m above the summit with fine ashfall. |
| 17 Feb 2013 - 0544 | -- | -- | GOES-13. INSIVUMEH. | INSIVUMEH reports incredible outpouring of lava from the crater which is confirmed by brilliant hot spot in satellite imagery; INSIVUMEH reported no ash plume at the moment, but emissions are possible over the next few hours up to 10 km to the S and SW of the summit. |
| 17 Feb 2013 - 1315 | 5 | W 2.6-5 m/s | Tegucigalpa MWO. GOES-13. GFS WINDS. INSIVUMEH. | In the morning, visible imagery showed a plume of ash extending 18.5 km to the W of the volcano; INSIVUMEH reported ash to 4.8 km a.s.l. |
| 17 Feb 2013 - 1445 | 5 | W | Tegucigalpa MWO. GOES-13. GFS WINDS. INSIVUMEH. | Imagery showed ash moving W-SW and S from the volcano; at 17/1445 UTC ash extended 18.5 km SW and 5.6 km S of the volcano. |
| 17 Feb 2013 - 2015 | 5.2 | 0-5 m/s | Tegucigalpa MWO. GOES-13. GFS WINDS. INSIVUMEH. | Ongoing emissions of lava with gas and light ash; in imagery the ash is mixed with clouds and, due to light winds spreading N-W-SW from the summit ~13 km; this is mainly a lava event but some light ashfall was being reported in cities on the slopes of the volcano. |
| 18 Feb 2013 - 0815 | -- | -- | GOES-13. GFS WINDS. INSIVUMEH. | Ongoing lava emission with gases and light ash; no ash detected due to large thunderstorm that developed SW of summit and regional cloudcover. INSIVUMEH reported in the afternoon that less energetic lava, gas, and ash events were occurring. |
| 03 Mar 2013 - 2345 | -- | -- | GOES-13. GFS WINDS. INSIVUMEH. | Lava emission with occasional light ash due to rockfalls and small venting; hotspot due to lava but no ash was visible in satellite imagery; plume drifted up to 9 km according to INSIVUMEH; wind forecast was light and variable, so the plume was expected to remain close to the summit region. |
| 04 Mar 2013 - 0334 | -- | -- | GOES-13. GFS WINDS. INSIVUMEH. | An INSIVUMEH special report indicated that a new stage of emissions began and possible ash fall was likely around 18.5 km from the summit. Ash was not seen in multispectral satellite imagery; a very large hotspot was observed with infrared. |
| 04 Mar 2013 - 0845 | -- | -- | GOES-13. GFS WINDS. | Ash was not seen in overnight satellite imagery; very large and bright hotspot was detected with infrared sensors; emissions of gas and ash were likely. |
| 04 Mar 2013 - 1315 | 4.3 | moving NE 5-7.5 m/s | GOES-13. GFS WINDS. INSIVUMEH. | Ongoing emissions; satellite imagery showed a faint ash plume 13 km wide and extending 42.5 km NE of the summit; a very bright hot spot was detected with infrared sensors. |
| 04 Mar 2013 - 1915 | -- | -- | GOES-13. GFS WINDS. INSIVUMEH. | Ongoing emissions; ash was too light to be seen in visible satellite imagery although reports indicate that ash was present; a strong hot spot persisted. |
| 05 Mar 2013 - 0115 | -- | -- | Tegucigalpa MWO. GOES-13. | Ongoing activity; Tegucigalpa MWO canceled Sigmet for the event; a well-defined hotspot was visible in multi-spectral imagery; no ash was present in the last visible images of the day. |
| 18 Mar 2013 - 1345 | 4.3 | moving SW 2.6-5 m/s | Tegucigalpa MWO. GOES-13. GFS WINDS. | Very light volcanic ash emissions; MWO indicated ash moving SW; the ash had a SSW component in satellite imagery and was very light in nature. |
| 18 Mar 2013 - 1945 | -- | -- | GOES-13. GFS WINDS. INSIVUMEH. | Emissions of gas and occasional light ash were near the summit; no ash was detected or reported in cloudy conditions; INSIVUMEH reported near-summit emissions of gas and occasional, very light ash below 4.3 km a.s.l. and within 9 km of the summit. |
| 19 Mar 2013 - 2232 | -- | -- | GOES-13. GFS WINDS. INSIVUMEH. | INSIVUMEH reported ash to 5 km a.s.l. at 19/2045 UTC moving SE at 5 m/s; ash not visible in imagery; special observatory report indicated elevated activity with the volcano; a persistent hotspot was present since 1915 UTC and had become increasingly bright in the past hour. |
| 20 Mar 2013 - 0415 | -- | -- | GOES-13. GFS WINDS. INSIVUMEH SEISMIC DETECTION. | Ash plume was not identifiable in multispectral satellite imagery; a bright hotspot was detected with infrared sensors; occasional bursts of seismic activity were reported; SIGMET reports ash to 5 km a.s.l. moving SE at 5 m/s. |
| 20 Mar 2013 - 1015 | -- | -- | GOES-13. GFS WINDS. | Near summit emissions of gases and occasional light volcanic ash; although brilliant hot spot was readily apparent in satellite imagery, no ash was detected under partly cloudy conditions. |
| 21 Mar 2013 - 1332 | 5.5 | E 7.5 m/s | GOES-13. GFS WINDS. | Intermittent emissions; ash emissions and a persistent hotspot were observed in satellite imagery in clear skies; several discreet puffs were noted; ash plume extends ~32 km to the ESE of the volcano. |
| 28 Mar 2013 - 1315 | 4.6 | W 2.6 - 5 m/s | GOES-13. INSIVUMEH. ECMWF HIRES WINDS. | Continuous emissions; a series of emissions has resulted in an ash plume extending up to 18.5 km to the WSW of the summit. |
| 30 Mar 2013 - 1415 | 5 | S 8 m/s | GOES-13. GFS WINDS. INSIVUMEH SEISMIC DETECTION. | INSIVUMEH reported degassing with occasional bursts of ash at 1240 UTC, 1330 UTC, and 1415 UTC; multibursts of gas and ash seen moving to S and SE from the summit extending 55.5 km from the summit and dispersing; light ashfall was reported within 18.5 km of the summit. |
| 30 Mar 2013 - 1945; | 5 | S 2.6-5 m/s | GOES-13. GFS WINDS. | Ongoing emissions; satellite imagery showed a 20 km wide plume of light ash extending 13 km S of the summit; ash was expected to disperse within 6 hours. |
| 31 Mar 2013 - 1345 | -- | -- | GOES-13. GFS WINDS. INSIVUMEH. | Ongoing emissions; ash not seen in satellite imagery under clear skies; however, sun may be preventing light ash from being observed; ash had been reported in the village of Panimaché. |
| 31 Mar 2013 - 1945 | -- | -- | GOES-13. GFS WINDS. INSIVUMEH. | Continuous gas emissions with occasional short bursts of light ash; INSIVUMEH reported continued gas emissions with short bursts of light ash moving S; ashfall was reported within 9.3 km of the summit; ash not seen in satellite imagery due to cloud cover around the summit. |
During 2011, INSIVUMEH reported that Fuego's activity included small-scale explosions and effusive lava flows. Lava flow activity was reported mainly during late March, late April, June, and early July. The longest lava flows traveled SW within the Ceniza and Santa Teresa drainages. Maximum flow lengths were in the range of 100-200 m and were frequently incandescent at night during spalling events.
Escalating summit activity during 2012. In early 2012, three VAAC advisories included plume altitudes as high as 6.7 km a.s.l. and drift directions up to 7.5 m/s S, SW, and W (table 8). INSIVUMEH reported that during the first week of January 2012, the Alert Level was raised to Yellow due to elevated activity; incandescent explosions were observed during 18-19 and 23 January. Lava flows and intermittent incandescent spatter continued from the summit throughout the rest of this reporting period (2011-March 2013).
The Coordinadora Nacional para la Reducción de Desastres (CONRED) announced Alert Level Orange (third highest on a four-color scale) and evacuations from El Porvenir in Alotenango (9 km ENE) on 19 May due to escalating activity (figure 21). Energetic Strombolian eruptions occurred during 19-20 and 25-27 May. Pyroclastic flows during 25-26 May were directed E and SE (impacting the Las Lajas and El Jute drainages), unlike previous events that concentrated flows within the W sector. Significant populations, resorts, and infrastructure such as the RN-14 road are located along the Las Lajas and El Jute drainages.
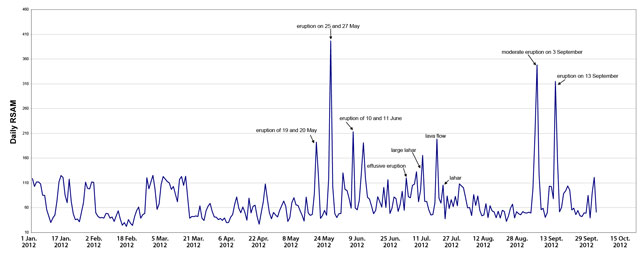 |
Figure 21. A plot of the daily average RSAM (Real-time Seismic-Amplitude Measurement) from Fuego's seismic station FG3 during January through September 2012. Notable peaks include eruptions during 19-20, 26-27 May and 11 June; the effusive eruption of 1 July; the 3 September eruption, lahars, and lava flows; and the 13 September eruption. During this time period, seismicity was dominated by long-period (LP) earthquakes generated by processes such as explosions, fluid movement, lava flows, and block avalanches. Courtesy of INSIVUMEH. |
During May-June, there were ~20 VAAC advisories that highlighted INSIVUMEH observations and the possibility of ash plumes; satellite observations and calculations of plume altitudes, however, were not available (table 8). INSIVUMEH reported lava flows throughout May-August (extending up to 1.7 km from the summit and as wide as 25 m) and pyroclastic flows occurred during May.
Increased explosivity at Fuego during September 2012. During the first week of September 2012, the Washington VAAC issued advisories describing ash plumes up to 5.2 km a.s.l. (table 8). A large event, on 3 September, generated two ash plumes dispersing SW and W, the former was ~5.5 km wide, and the latter was ~7.5 km wide. Ash plumes and hot spots continued to be visible within satellite images through 4 September (figure 19C) with INSIVUMEH reporting a lack of ash clouds on 5 September, followed by a break in reports until the major eruption on 13 September.
Beginning at 0400 on 13 September, a significant eruption occurred which led to evacuations from local communities within a 10-km radius (figures 22 and 23). At 0715, a vertical plume erupted from the summit. Large pyroclastic flows were generated between 0900 and 1000 local time which became channelized within two drainages. Within the Las Lajas drainage (on the SE flank), flows reached as far as 2 km from the summit; within the Ceniza drainage (SSW flank), they traveled as far as 7.7 km, stopping just 3 km short of Panimaché. On 14 September, the Washington VAAC reported ash plumes up to 7.3 km a.s.l. that drifted W at ~10 m/s (table 8).
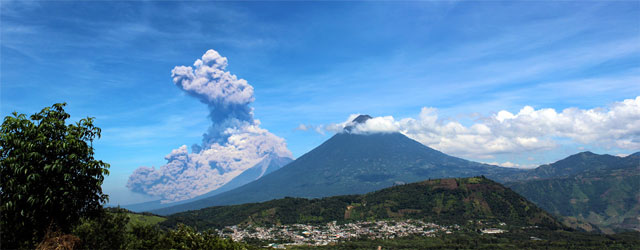 |
Figure 22. On 13 September 2012, a large plume of ash erupted from Fuego and pyroclastic flows descended the flanks. Between 0900 and 1000 local time, a lateral cloud and a tall plume expanded from the summit. The sharp peak to the right of Fuego is Agua volcano. This photo was taken from a viewpoint near the base of Pacaya volcano, ~30 km S of Guatemala City. Photo courtesy of Kent Caldwell. |
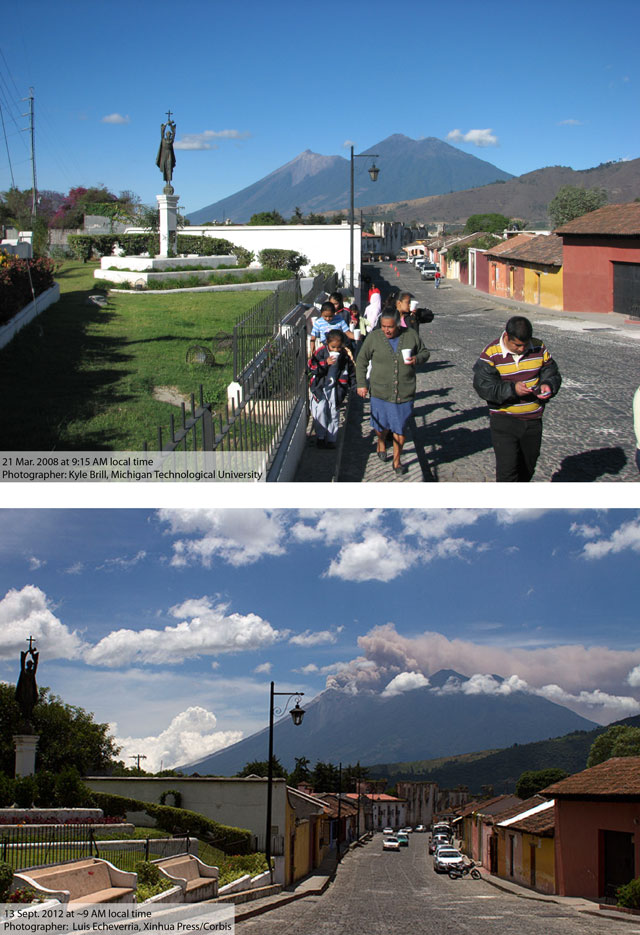 |
Figure 23. Comparison views of Fuego made from the city of Antigua (~18 km from Fuego) looking SW. (Top) This view from the center of Antigua, was taken on 21 March 2008 at 0915 when volcanic unrest was dominated by intermittent, impulsive eruptions which generated short gas-and-ash plumes (see figure 20 for the timeline of explosive vs. effusive activity). Photo courtesy of Kyle Brill (Michigan Technological University). (Bottom) This photo taken at ~0900 on 13 September 2012 captures a view SW of the ongoing explosive eruption that continued through 14 September. Photo courtesy of Luis Echeverria (Xinhua Press/Corbis). |
In a special report by INSIVUMEH, the 13-14 September 2013 eruption was described as the largest explosive event within the last 13 years; they assigned the event VEI 3 (Volcanic Explosivity Index) based on the volume of pyroclastic material. This was the first eruption since 1974 that directly impacted the S and SW zones of Fuego, areas within 5-7 km of the summit that contained numerous small villages (figure 24). Approximately 10,600 people were evacuated from Panimaché I, Panimaché II, Sangre de Cristo, Morelia, and El Porvenir (figure 16) to the town of Santa Lucía Cotzumalguapa (18 km SW). INSIVUMEH estimated that ~5 mm of ashfall accumulated in those regions closest to the channelized pyroclastic flows. Ashfall damaged coffee and other agricultural crops in the region and congested the air, decreasing visibility in many communities within 10 km of the summit.
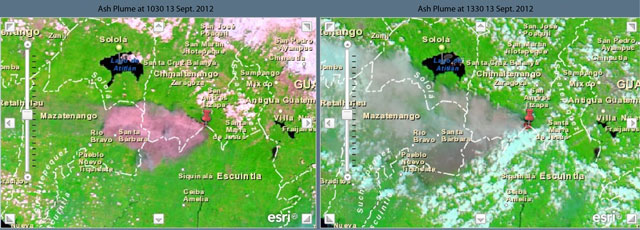 |
Figure 24. Two hybrid graphics each merging a regional map and MODIS image centered on Fuego (at the red pushpin icon). (A) Results captured at 1030 local time showing a plume generated by the eruption covered approximately ~900 km2. (B) At 1330 local time, the ash plume covered approximately ~2,500 km2, with less density; 47 municipalities in seven departments were primarily affected. The ash extends off this graphic and later reached Chiapas, Mexico. Image modified from CATHALAC, 2012. |
Prior to the eruption, there wsa a notable increase in LP seismicity and high-amplitude tremor that lasted for hours. INSIVUMEH seismic records became saturated between 0947 and 0949, the time period when observers noted ash plumes rising from the summit (figure 7). During the explosive event that began at 0400 on 13 September 2012, a lava flow advanced 300 m down the flank from the S side of the summit crater. At roughly the same time, a vertical plume rose from the crater and drifted SW; strong ENE winds rapidly spread the ash into the coastal Suchitepéquez Department. At 0715 the ash plume had risen up to 2 km above the summit crater; by 1500 that day, a diffuse ash plume was reported over the S region Mexico's Chiapas Province. The ash continued to expand W and NW on 14 September, and was ~100 km wide and more than 415 km W of the summit (table 8 and figure 10); ash persisted in the atmosphere for more than 36 hours.
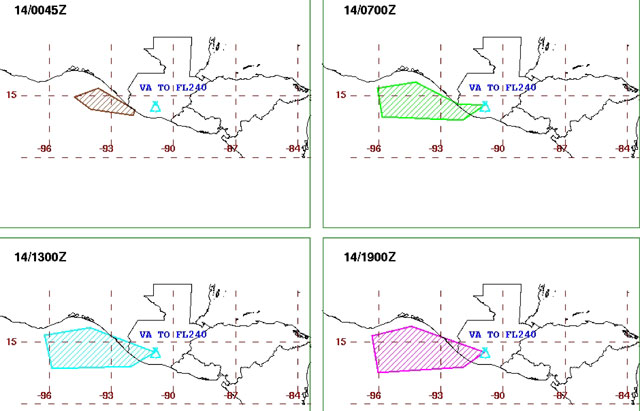 |
Figure 25. A large ash plume drifted W and NW from Fuego on 14 September 2012; observations were made at 0045, 0700; 1300; and 1900 local time and remote sensing measurements determined an altitude of ~7 km a.s.l. These graphics notified the aviation community about airspace containing ash plumes. Note that "VA to FL 240" means "volcanic ash to flight level 24,000 (~7 km)." Courtesy of Washington VAAC. |
Seismicity and surface activity returned to low levels after the powerful 13-14 September 2012 eruption. Field studies conducted by INSIVUMEH determined that the Las Lajas, El Jute, Trinidad, and Ceniza drainages received the largest concentration of volcanic material during the eruption, making these regions susceptible to lahars with the onset of the rainy season.
Within the Ceniza drainage, in particular, pyroclastic flows had extended ~8 km (figures 17 and 26) and had deposited tree branches and trunks (many that were charred) within the canyon along with large (1-3 m diameter) blocks and volcanic bombs. Preliminary assessments of the deposits within the Ceniza drainage determined that ~13,000,000 m3 of material had been deposited and was already becoming mobilized.
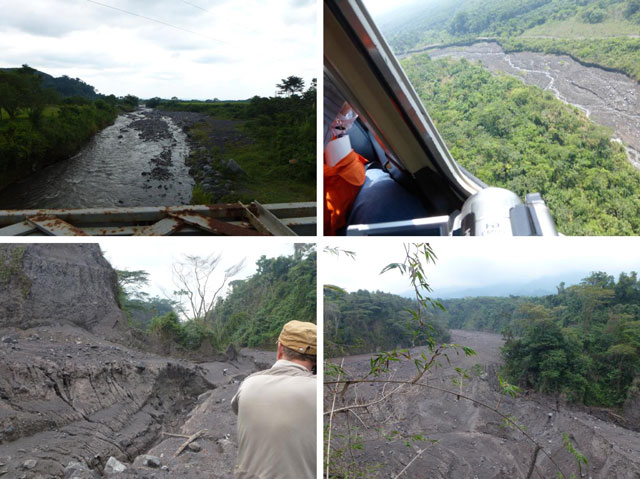 |
Figure 26. During field investigations immediately after the 13 September 2012 eruption, INSIVUMEH surveyed the Ceniza drainage to assess both the damage and potential new hazards from lahars. This area sits in the region of Siquinala and San Andrés Osuna, ~13 km SSW of Fuego's summit. Courtesy of INSIVUMEH. |
Assessments by INSIVUMEH at the end of 2012 determined that two months of heavy rain had cut deep incisions into the new deposits and that loose, fine-grained volcaniclastic material had already migrated down to the road crossing at Siquinala and San Andrés Osuna, ~13 km SSW of the summit. The study also described the increased vulnerability of the road access for Siquinala and the community of La Róchela (figure 16) due to possible stream capture by Ceniza with Platanares. A narrow (~15 m) zone of the Ceniza drainage had been filled with volcaniclastic material, changing the drainage profile in a location ~2 km upstream from an important stream crossing. The Ceniza drainage had been migrating laterally toward the Platanares over time, especially due to erosion following Tropical Storm Agatha in 2010.
Explosive and effusive activity continued during September 2012-March 2013.From late September 2012 through March 2013, INSIVUMEH documented ash plumes (100-1,300 m above the crater), incandescent spatter (50-200 m above the crater), lava flows (mainly flowing 100-900 m down the SW flank), and lahars. In 2012, hot lahars were reported on 1 June, and later on 27 September and 3 October. Lava flows were frequently channelized within the Ceniza, Trinidad, and Taniluya drainages (SW flank). The last significant VAAC report of 2012 highlighted discreet puffs of ash that reached a maximum of 900 m above the crater on 29 September (table 8).
Large pyroclastic flows on 16 and 17 February 2013 traveled 3 km down the Ceniza drainage (table 8). Ash plumes generated on 16 February caused ashfall in communities up to 12 km from the summit, primarily SW. On 17 February there were collapses at lava-flow fronts.
On 4 March 2013 there were large lava flows following incandescent explosions up to 100 m above the crater (table 8).
On 19 March an explosive eruption occurred with effusive lava flows; a ~5 km a.s.l. ash plume was detected by the Washington VAAC (table 8). Lava fountaining reported on 20 March rose 300-400 above the crater; a ~1.5 km long lava flow within the Ceniza drainage was also observed that day (figure 19D). Incandescent explosions were frequently observed through the rest of the month.
International collaboration aids monitoring capabilities in 2013. In 2010, a partnership was established between INSIVUMEH observatories and the International Volcano Monitoring Fund (IVM-Fund), a non-profit organization based in Seattle, WA. After a successful project to improve monitoring efforts at the Santiaguito Volcano Observatory (OVSAN), the IVM-Fund began working with the Fuego Volcano Observatory (OVFGO), located in Panimaché, in 2012. During March 2013, this observatory received significant support from the IVM-Fund and international donors. Jeff Witter, president and CEO of the IVM-Fund, delivered ~$4,500 worth of field equipment to OVFGO to help outfit the observers and contribute to volcano monitoring capacity in Guatemala (figure 27). Additional visits to Guatemala are planned once sufficient funds are raised to continue the IVM-Fund's collaborative work with Guatemalan volcanologists. Volcano monitoring support projects between the IVM-Fund and INSIVUMEH are planned to address additional needs at OVFGO and OVSAN.
 |
Figure 27. On 21 March 2013, INSIVUMEH technician Amilcar Cardenas (left) and Edgar Barrios (far side of river) measure the width of Taniluya drainage to collect baseline data for monitoring geomorphologic changes in the canyon. This drainage is particularly susceptible to lahars and pyroclastic flows. Courtesy of Jeff Witter (IVM-Fund). |
References. CATHALAC, 2012, "Preliminary Analysis of the Eruption of Volcan de Fuego, Guatemala -- 13 September 2012," posted on 27 September 2012, https://servirglobal.net/Global/Articles/tabid/86/Article/1169/preliminary-analysis-of-the-eruption-of-volcan-de-fuego-guatemala-13-september.aspx, accessed on 17 July 2013.
Escobar-Wolf, R., 2013, Volcanic processes and human exposure as elements to build a risk model for Volcán de Fuego, Guatemala [PhD Dissertation]: Houghton, MI, Michigan Technological University.
Newhall, C.G., and Self, S., 1982, The volcanic explosivity index (VEI): An estimate of explosive magnitude for historical volcanism, Journal of Geophysical Research: 87, 1231-1238.
The World Bank, 2013, Country Data: Guatemala Climate Change, http://data.worldbank.org/country/guatemala, accessed on 18 June 2013.
Geological Summary. Volcán Fuego, one of Central America's most active volcanoes, is also one of three large stratovolcanoes overlooking Guatemala's former capital, Antigua. The scarp of an older edifice, Meseta, lies between Fuego and Acatenango to the north. Construction of Meseta dates back to about 230,000 years and continued until the late Pleistocene or early Holocene. Collapse of Meseta may have produced the massive Escuintla debris-avalanche deposit, which extends about 50 km onto the Pacific coastal plain. Growth of the modern Fuego volcano followed, continuing the southward migration of volcanism that began at the mostly andesitic Acatenango. Eruptions at Fuego have become more mafic with time, and most historical activity has produced basaltic rocks. Frequent vigorous eruptions have been recorded since the onset of the Spanish era in 1524, and have produced major ashfalls, along with occasional pyroclastic flows and lava flows.
Information Contacts: Gustavo Chigna M., Instituto Nacional de Sismologia, Vulcanología, Meteorología e Hidrologia (INSIVUMEH), Ministero de Communicaciones, Transporto, Obras Públicas y Vivienda, 7a. Av. 14-57, zona 13, Guatemala City 01013, Guatemala (URL: http://www.insivumeh.gob.gt/inicio.html); Coordinadora Nacional para la Reducción de Desastres (CONRED), Av. Hincapié 21-72, Zona 13, Guatemala City, Guatemala (URL: http://conred.gob.gt/www); Washington Volcanic Ash Advisory Center (VAAC), NOAA Science Center Room 401, 5200 Auth road, Camp Springs, MD 20746, USA (URL: http://www.ospo.noaa.gov/Products/atmosphere/vaac/); Rüdiger Escobar-Wolf, Michigan Technological University, Department of Geological and Mining Engineering and Science, Houghton, MI, USA (URL: http://www.geo.mtu.edu/); Hawai`i Institute of Geophysics and Planetology (HIGP) Thermal Alerts System (MODVOLC), School of Ocean and Earth Science and Technology (SOEST), Univ. of Hawai`i, 2525 Correa Road, Honolulu, HI 96822, USA (URL: http://modis.higp.hawaii.edu/); Jeff Witter, International Volcano Monitoring Fund (IVMF) (URL: http://www.ivm-fund.org/guatemala-fuego/); NASA/USGS Landsat Program (URL: https://landsat.usgs.gov/); and NASA ALI (URL: http://eo1.gsfc.nasa.gov/).