Report on Bardarbunga (Iceland) — October 2014
Bulletin of the Global Volcanism Network, vol. 39, no. 10 (October 2014)
Managing Editor: Richard Wunderman.
Bardarbunga (Iceland) Substantial dike eruption ~45 km NE at Holuhraun begins 29 August 2014
Please cite this report as:
Global Volcanism Program, 2014. Report on Bardarbunga (Iceland) (Wunderman, R., ed.). Bulletin of the Global Volcanism Network, 39:10. Smithsonian Institution. https://doi.org/10.5479/si.GVP.BGVN201410-373030
Bardarbunga
Iceland
64.633°N, 17.516°W; summit elev. 2000 m
All times are local (unless otherwise noted)
[Barbarbunga is a subglacial caldera beneath the NW part of the Vatnajokull ice cap. Carrivick and Gertisser (2014) described the volcano as a caldera 700 m deep with a diameter of 11 km, covered by glacial ice ~850 m thick. This report is divided into two major sections, the first discussing activity between 1986 and 2008 and the second looking at more recent activity from 2014 to early 2015.]
1986-2008 activity. In 2010, the Icelandic Meteorological Office (IMO) presented a list of Icelandic volcanic eruptions from 1902-2010 on their website. That list lacks any eruption at the Bardarbunga caldera. Seibert and others (2010) stated that between 1986 and 2008, there were several uncertain cases of eruptions or unrest in the area of Loki-Fögrufjöll (S-SW of Bardarbunga caldera), which they consider a part of the larger Bardarbunga volcanic system (green in figure 1). The eruptive characteristics of these events included regional fissure and subglacial events associated with jökulhlaups (glacier bursts).
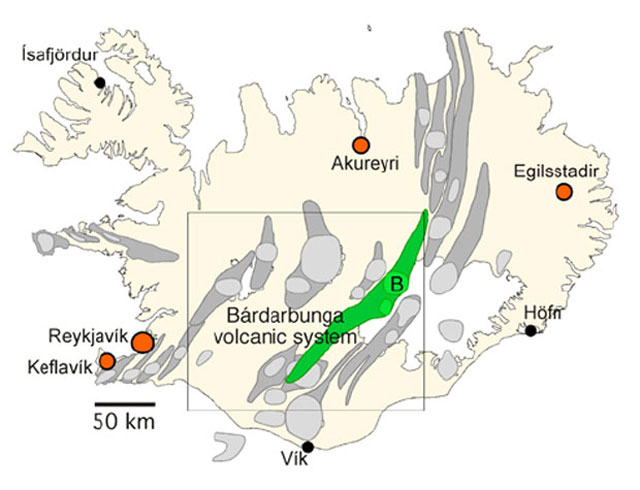 |
Figure 1. Map of Iceland that highlights the Bardarbunga volcanic system (shaded in green), which is 190 km long (NE-SW) and up to 25 km wide (NW-SE). The main Bardarbunga volcano, a subglacial caldera, is represented by the letter 'B' on the map. This map, showing all of Iceland was part of a more detailed map of the Bardarbunga volcanic system. Iceland's capital, Reykjavik, and other towns are also highlighted on the map. Taken from Larsen and others (2014). |
The associated jökulhlaups from 1986-2008 originated from the East and West Loki cauldrons found along the Loki Ridge of the Loki-Fögrufjöll system (figure 2). The cauldrons are located ~15 km SW of the center of the Bardarbunga caldera. Other terms for the Loki cauldrons include the East and West Skaftárketill cauldrons; the Eastern and Western Skaftá cauldrons; and the Eastern and Western cauldrons.
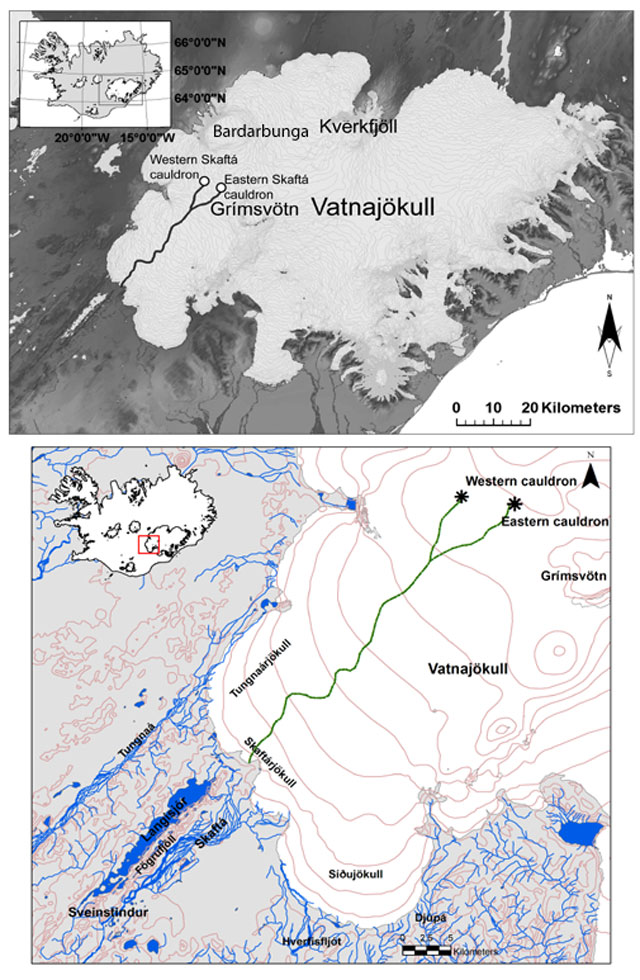 |
Figure 2. Two maps showing the location of East and West Loki cauldrons on the Vatnajokull glacier surface. The Loki cauldrons are found along the Loki Ridge of the Loki-Fögrufjöll system, located SW of Bardarbunga volcano and are within the larger Bardarbunga volcanic system. (Top) The Loki cauldrons are labeled as the Eastern and Western Skaftá cauldrons. (Bottom) The cauldrons are labelled the Eastern and Western cauldrons and the Skatfá river is highlighted. Both maps highlight the inferred subglacial water route (black and green lines) of melt water that is eventually discharged during a jökulhlaup. The jökulhlaups that originate from the Loki cauldrons empty into the Skatfá river. Top map after being taken from Marteinsson and others (2013) was slightly edited and the bottom map was taken from Einarsson (2009). |
The Loki cauldrons are depressions formed in the Vatnajokull glacier surface by two underlying, subglacial geothermal areas (Einarsson, 2009). The geothermal areas melt the glacier's base and melt water collects forming subglacial lakes. As the lakes grow, the ice above them flattens. Eventually, the melt water escapes from the subglacial lakes in a jökulhlaup. The water of the jökulhlaup then travels ~40 km subglacially to flood the Skatfá river (Einarsson, 2009). Once the subglacial lake has emptied, the overlying ice collapses and the cauldrons can be seen again in the glacier surface (Einarsson, 2009).
Table 1 presents the dates of uncertain cases of eruption within the Bardarbunga volcanic system. The source of the jökulhlaups associated with these uncertain eruptions consistently originated from the East or West Loki cauldron or both.
Table 1. Table condensing Bardarbunga's uncertain cases of eruptive history during 1986-2008. The uncertain cases all reside in the area of Loki-Fögrufjöll. The table also show the source of the jökulhlaup associated with each of the cases. None of these uncertain cases occurred at the Bardarbunga caldera. Data in this table summarizes written communication with Páll Einarsson in 2008.
| Month | Jökulhlaup source |
| Nov 1986 | East Loki |
| Aug 1991 | East Loki |
| Jul 1995 | East Loki |
| Aug 1996 | West Loki |
| Aug 1997 | East Loki |
| Aug 2000 | East and West Loki |
| Jul 2002 | West Loki |
| Sep 2002 | East Loki |
| Jul-Aug 2005 | West Loki |
| Apr 2006 | East Loki |
| Aug 2008 | West Loki |
Two examples of uncertain eruptions at the East Loki cauldron follow. They occurred in November 1986 and August 1991. For the 1986 case, Björnsson and Einarsson (1990) stated, "There is a seismic indication that a small eruption occurred in 1986 during a Skaftá jökulhlaup from beneath the easternmost ice cauldron [figure 2]. The flood in Skaftá began on November 29, and on November 30 and the following day short bursts of continuous tremor were recorded on seismographs around Vatnajokull.... It is likely that the pressure release associated with the jökulhlaup triggered a short eruption that did not reach the surface of the glacier."
For the 1991 case, Björnsson and Einarsson (1990) reported that "Bursts of tremor were recorded on seismographs near Vatnajokull on Aug. 12, 1991, during a jökulhlaup in Skaftá. The course of events is similar to that of Nov. 30, 1986, and suggests that a small and short-lived eruption may have occurred beneath the Eastern Loki cauldron."
Based on the communication between Einarsson and GVP, the other cases in table 1 followed a similar pattern. For each of those events, the occurrence of a jökulhlaup was followed by either an eruption tremor or bursts of eruption tremor, which suggested the possibility of a small, subglacial eruption at East or West Loki.
Confirmed 1996 eruptions. There are two confirmed eruptions at Bardarbunga, both within a few weeks of each other in 1996 (1 and 2 below).
(1) Einarsson and others (1997) discuss the complex interplay of events that occurred during 29 September through 7 November 1996, which involved seismicity, dikes, jökulhlaups, and various eruptions at Bardarbunga, Grímsvötn and Gjálp (fissure between the two calderas). Einarsson and others (1997) start with this introduction: "A volcanic eruption beneath the Vatnajokull ice cap in central Iceland... began on September 30, 1996, along a 7-km-long fissure between the volcanoes Bardarbunga and Grímsvötn. The eruption continued for 13 days...."
They further note "... a minor subglacial eruption occurred on the southeast rim of the Bardarbunga caldera, 6-7 km to the north. Two small depressions formed in the ice surface there." Regarding this, Páll Einarsson added this comment in a 2015 email: "The small subglacial eruptions at the Bárðarbunga caldera rim, mentioned in our paper, are a separate event [from the one a few weeks later mentioned in (2) below]. They are evidenced by sinkholes in the glacier that were discovered late and the timing of these events is not known. Most likely the sinkholes were initiated during the Gjálp eruption, i.e. between September 30 and October 13."
(2) According to the Institute of Earth Sciences of the University of Iceland (IES, posting date uncertain), a small eruption took place at Bardarbunga in 1996. They wrote the following: "A small eruption started in Bardarbunga around 1300 hrs on November 6th. The eruption lasted for about 20 to 30 min. According to seismograms at the Meteorological office, the eruption was initiated by some intrusive activity. The intrusive activity is based on recorded eruption tremor picked up [by] the seismometers. Eruption column reached about 4 km in to the air. Relation between pressure decrease due to the flooding [has] been suggested as the main cause of the eruption." This eruption came a day after a jökulhlaup was released from the Grímsvötn caldera (BGVN 21:09 and 23:11, and IES (posting date uncertain). We have not found a clear description of where in the caldera the eruption took place on 6 November 1996.
In regards to the confirmed eruption of 6 November, Einarsson's email made these remarks: "Keep in mind that Bárðarbunga is very remote and observations of the activity are difficult and very dependent on weather conditions. The webpage of our institute describes a small explosive event that happened on Nov. 6 at the end of the large jökulhlaup, when the meltwater from the large Gjálp eruption was flushed down to the coast. Most of us think now that this was a phreatic reaction of the still hot edifice to the sudden pressure release when the caldera lake of Grímsvötn was emptied, i.e. not due to a fresh injection of magma. But observations were scarce and there may be other opinions on this."
2014-early 2015 activity. This section of the Bulletin report primarily summarizes events from 16 August 2014, when seismic activity began, into mid-January 2015. The eruption was still ongoing at that time.
Bardarbunga is monitored by a seismic network, an extensive GPS network, and various sensors such as webcams and infrared cameras. Monitoring and analyses at Bardarbunga is conducted by a group of collaborators that include the IMO, the Institute of Earth Sciences (IES) at the University of Iceland, and the National Commissioner of Police, and the Department of Civil Protection and Emergency Management.
Gudmundsson and others (2014) and IMO describe dike emplacement (without apparent breaching the ground surface) associated with a seismic swarm that began at the caldera and migrated tens of kilometers with branches to the N and NE during 16-31 August 2014. On 29 August 2014, two days before the swarm ended, an eruption was first documented at the surface at a flank vent devoid of ice cover ~45 km NE of the caldera.
Figures 3 and 4 help explain the location of volcanoes in Iceland and Bardarbunga lava that progressed northward as a dike and ultimately erupted in the Holuhraun vent.
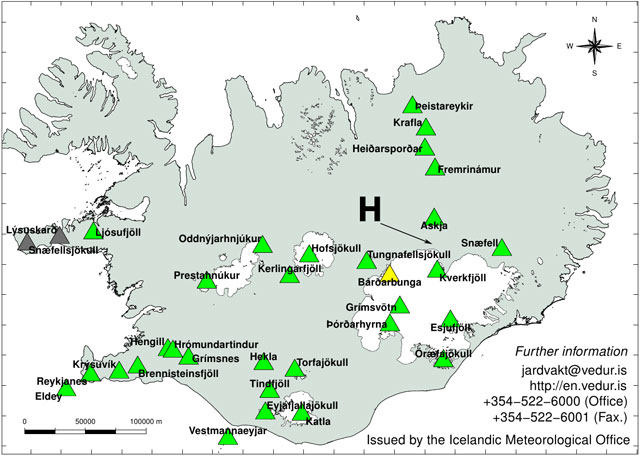 |
Figure 3. IMO map of Iceland showing key Holocene volcano locations. Bardarbunga (yellow triangle) is located on the NW part of the 14,000 km2 Vatnajokull ice cap (continental glacier). Although seismicity and dike injection began at Bardarbunga, intrusive processes seemingly prevailed until dikes had propagated to Holuhraun (tip of arrow designated with "H", location approximate). Holuhraun sits ~45 km NE of the caldera. Courtesy of Iceland Met Office. |
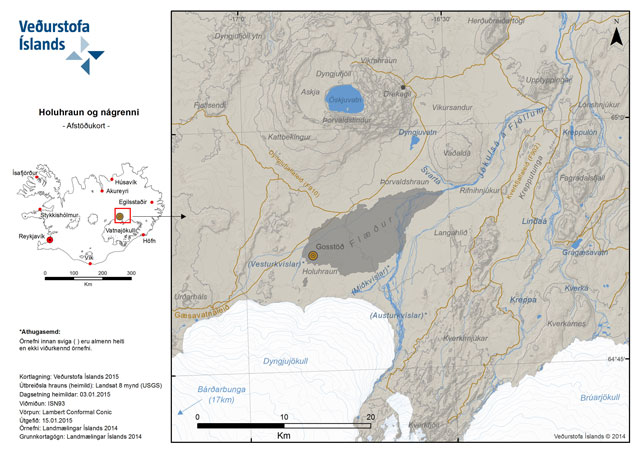 |
Figure 4. A map reflecting Bardarbunga's lava that erupted in the Holuhraun vent area between 29 August 2014 and about 15 January 2015 (shaded lens-shaped zone between the glacier and Askja volcano). The map shows the N margin of the Vatnajokull ice cap but Bardarbunga caldera lies 17 km off the map to lower left. The site of the eruptive fissure is in the vicinity of the orange bull's eye. Dyngjujokull glacier is an outlet glacier that forms a N-trending lobe streaming N and outward from the much larger Vatnajokull glacier. Note the E end of the new flow field following the drainage system (the Jökulsá á Fjöllum river). Image published online by the Icelandic Met Office (IMO) on 15 January 2015 (based, in part, on a NASA Landsat 8 image). |
The NE-trending dike reached an area outboard of the Vatnajokull ice cap at the Holuhraun volcanic field (figure 4), where the first clear eruption began on 29 August 2014. The fissure vent area was 4.5 km from the ice margin of the outlet glacier Dyngjujökull. The venting took place along an old fissure, and came out along an N-trending zone 600 m long. According to Gudmundsson and others (2014), that eruption was moderate and effusive.
Holuhraun is sometimes discussed in the context of Askja volcano (figure 4), which lies just to the N. Holuhraun is sometimes considered as peripheral vent system for Askja (Ialongo and others, 2015).
Figure 5 indicates the location of earthquakes during the first 16 days of dike emplacement (where days 1-16 correspond to 16-31 August 2014). Gudmundsson and others (2014) comment that "During this time, the dike generated some 17,000 earthquakes, more than produced in Iceland as a whole over a normal year." The venting to the surface at Holuhraun took place on 29 August 2014 and became strong by 31 August. In the early hours of the 29 August, the onset consisted of a minor, four-hour long, fissure eruption. The pattern on figure 5, depicting a 45-km-long dike injection along the rift system passing through Bardarbunga, testifies to the importance and utility of the seismograph in monitoring shallow magmatism leading to eruption.
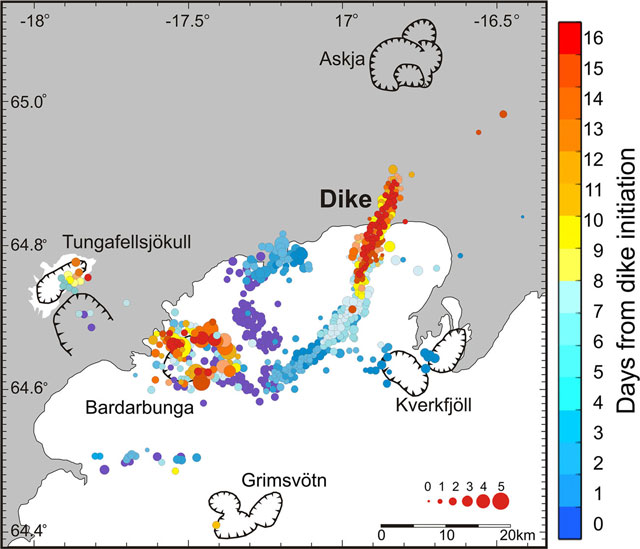 |
Figure 5. For the Bardarbunga eruption, earthquake locations during the first 16 days of the dike emplacement (16-31 August 2014). The word 'Dike' is located approximately where the fissure eruptions have taken place (at a volcanic field called Holuhraun). The white area is the Vatnajokull ice cap (including the associated Dyngjujokull outlet glacier; figure 4). Earthquake magnitudes are indicated in the lower right portion of the map. Taken from Gudmundsson and others (2014), based on preliminary data from IMO. |
According to IMO, seismic activity associated with Bardarbunga had gradually increased during the last seven years, although it temporarily diminished during the Grimsvotn eruption in May 2011. Vatnajokull GPS stations showed both upward and outward movements since early June 2014, and on 16 August 2014, the number of earthquakes significantly increased, with more than 300 earthquakes detected under the NW part of Vatnajokull ice cap (figure 5). As a result, the Aviation Color Code was increased to Yellow, the third level from the highest on a five color scale (Gray, Green, Yellow, Orange, and Red). On 18 August, IMO reported one earthquake swarm to the E and another swarm to the N of Bardarbunga. An M 4 earthquake occurred, the strongest in the region since 1996. By 18 August, 2,600 earthquakes had been detected at the volcano; earthquake locations from the E and N swarms had been migrating NE. In the evening of 18 August, earthquakes diminished in the N swarm. That same day the Aviation Color Code was raised to Orange.
According to IMO, GPS and seismic data during 20-26 August suggested that a NE-trending intrusive dike had increased from 25 to 40 km in length. During 22-26 August, several earthquakes in the 4.7-5.7 magnitude range had been detected at or near the volcano. These values were among the largest detected in the first few weeks of the swarm (Gudmundsson and others, 2014). The Aviation Color Code, chiefly Orange during this reporting interval, rose to the highest level, Red, several times during late August and September.
On 23 August seismic tremor indicated what IMO initially suggested was a small lava eruption at beneath the Dyngjujokull glacier (which is 150-400 m thick in this region). An overflight the next day found no evidence for an eruption.
On 27 August an overflight showed a 4- to 6-km-long row of cauldrons 10-15 m in diameter S of Bardarbunga.
Beginning on 31 August, lava erupted along a 1.5 km long fissure. During 1-2 September a white steam-and-gas plume rose to an altitude of 4.5 km and drifted 60 km NNE and ENE. Lava flowed N and lava fountains rose tens of meters. The number of earthquakes decreased from 500 earthquakes on 1 September to 300 earthquakes on 2 September. During the middle of September, seismicity persisted mainly around the caldera and the Dyngjujokull glacier.
On 2 September the lava had covered 4.2 km2 and was 4.5 km from the glacier's edge. By 3 September, the lava flow advanced ENE and covered 7.2 km2. The following day, the lava flow had an aerial extent of 10.8 km2. During 3-9 September, IMO observers noted ongoing lava effusion, high gas emissions, and elevated seismicity from the Holuhraun lava field. Ash production was almost negligible.
On 5 September, two new eruptive fissures were observed S of the main eruption site. These sites were less effusive and were located ~2 km from the edge of Dyngjujokull glacier (see this small shaded area in figure 2). The eruption also continued from the original fissure and generated a ~460 m high steam plume. Eventually, a row of craters formed along the eruptive fissure, the largest one was named Baugur crater.
The fissure eruption continued during 6-7 September, and the lava effusion rate was 100-200 m3/sec on 7 September (figures 6 and 7). Activity from the S fissures was less than that of the N fissure, which had been active since the beginning of the eruption. The advancing lava flow reached the W main branch of the Jökulsá á Fjöllum river (figure 4), which is fed by the icecap and exits the icecap ENE of the volcano. No explosive activity due to lava and river water interaction was observed, but steam rose from the area.
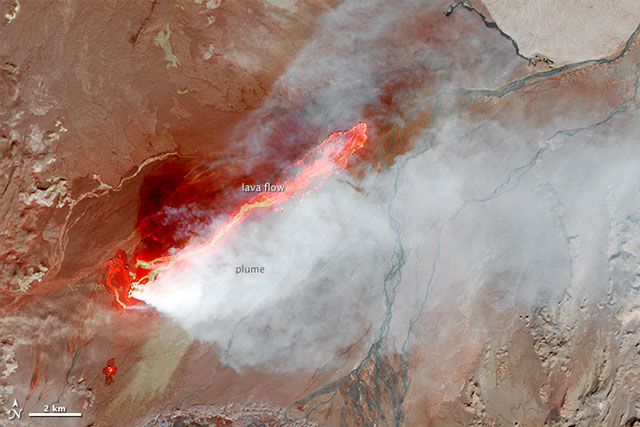 |
Figure 6. Lava fountaining, lava flows, and plumes emerging from Holuhraun on 6 September 2014, as viewed by NASA's Landsat 8. Much of the flow was in lava rivers on the surface during September. Courtesy of NASA Earth Observatory. |
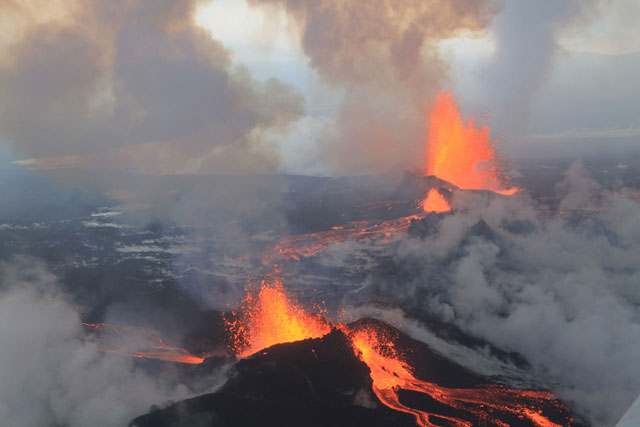 |
Figure 7. Aerial view Bardarbunga fissure eruptions taken on 4 September 2014. The fissure venting these eruptions is in Holuhraun lava field. Courtesy of Peter Hartree. |
During 8-9 September, activity was no longer detected from the southernmost fissure. Lava continued to advance and interact with the Jökulsá á Fjöllum river. The extent of the lava flow reached 19 km2 and gas emissions remained high.
During 10-16 September, lava flows continued to advance at a consistent rate toward the E and W. A report on 22 September noted that the total volume of the erupted lava was 0.4-0.6 km3 and the flow rate was 250-350 m3/sec. By 30 September, the lava field was 46 km2, and the main flow had entered the river bed of Jökulsá á Fjöllum and continued to follow the river's course. Steam rose from the river where the lava was in contact with water but no explosive activity occurred.
Although reporting noted a lack of tall mobile ash plumes blown towards Europe and causing air traffic delays, the plumes remained lower and more local causing widespread air quality problems in Iceland. IMO reported continued gas emissions that included elevated SO2 emissions during 10-16 September and issued warnings to the public in the municipality of Fjarðarbyggð (180 km ENE of Bardarbunga) on 13 September. These emissions persisted through at least November.
During 17-23 September, chemical analysis and geophysical modeling indicated that the source of the magma was at a depth of more than 10 km. On 21 September, field scientists estimated that about 90% of the SO2 from the eruption originated at the active craters and the rest rose from the lava field. Dead birds were also found around the eruption site.
Seismic activity at the N part of the dike and around the vents declined in October 2014, although the lava field continued to grow and lava production continued at the same output. On 5 October, a new lava front emerged at the S edge of the main lava flow and advanced E.
On 18 October, an M 5.4 earthquake struck in the N part of Bardarbunga caldera, one of the biggest earthquakes since the start of the eruption. The growing lava field at Holuhraun was 66 km2 by 31 October. By late October, the fissure's main vent (Baugur crater) had constructed a local topographic high that stood 80 m higher than the local landscape.
In November, eruption-associated seismicity remained strong although an IMO report on the 19th suggested that the number of large, M~5 events seemed to be decreasing. FLIR thermal images of the craters on 18 November showed that by then the most intense area of thermal convection was at a crater in the N part of the eruption site. On 20 November, observers characterized the eruption in the crater as pulsating explosions every 10-15 minutes, followed by a gush of lava down the main channel with splashing on either side. During 25-26 November, the activity was characterized as pulsating, with lava surging from the vent for 2-3 minutes at intervals of about 5-10 minutes. The upper parts of the lava channel developed a sinuous appearance owing to a series of bulges in the channel's margins.
On 12 November, IMO indicated that it monitored gas releases from Holuhraun using DOAS and FTIR instruments to estimate the fluxes of SO2 and other gases in the volcanic cloud. In the first month and a half of the eruption, the average flux was 400 kg/s (~35,000 metric tons per day, t/d) with peaks up to 1300 kg/s (~112,000 t/d). The IMO calculated that, assuming a constant release of gas through 12 November, the eruption had injected into the atmosphere an amount of SO2 in the range 3.5–11.2 Mega tons, Mt (depending on whether the computed from the average or the peak flux).
On 27 November, observers indicated that a plume rose 3.1 km above the sandy plain. A thermal image from 1 December showed several changes to the lava field. In just over 24 hours there was a new lava extrusion at the NE margin that had traveled 450 m. A new flow traveled N in an area just W of the lava lake. One or more new flows also developed S of the lava lake. The lava field from this eruption was just over 75 km2.
In early December, data also showed a decline in the eruption's intensity, although seismic activity remained strong. By 9 December, the lava field at Holuhraun had covered just over 76 km2, making its aerial extent the second largest in Iceland (but still considerably smaller than the largest historical field created by the Laki fissure eruption of 1783-1784). By 18 January 2015, the lava covered an area of 85 km2. A NASA photo of the lava flow is shown in figure 8. The vent area contained a lava lake, a large mass of highly radiant (molten, red-colored) lava.
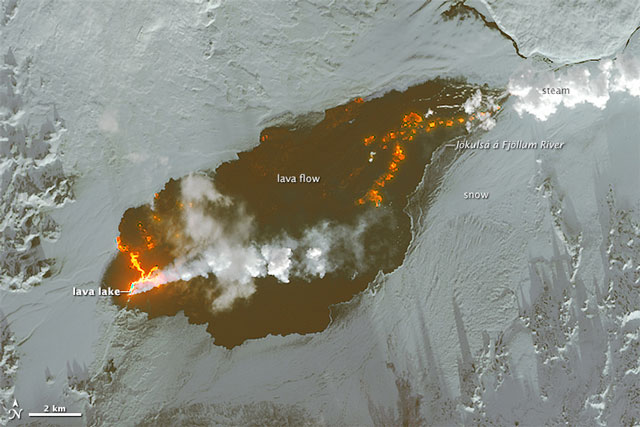 |
Figure 8. NASA image of the Bardarbunga eruption venting at Holuhraun on 3 January 2015, as captured by the Operational Land Imager on Landsat 8. According to the NASA caption, the false-color images combine shortwave infrared, near infrared, and red light. The dark area represents newly-formed basalt associated with the 2014-2015 eruption. The plume of steam and sulfur dioxide appears white, while fresh lava is bright orange. Courtesy of NASA Earth Observatory. |
According to the IMO, the ongoing eruption's very gas-rich emissions had affected the entire country. IMO stated that "we have to go 150 years back to find an event (Trölladyngja) that had a comparable impact on Iceland and its inhabitants, in terms of environmental and health issues."
Radar measurements of the flow field during a surveillance flight on 30 December 2014 provided preliminary evidence that lava thickness averaged ~10 m in the eastern part, ~12 m in the center, and at least 14 m in the western part. IMO indicated that the preliminary estimate of the lava volume was 1.1 km3. (A later estimate in 2015 took the volume to 1.4 km3, roughly 10% of the Laki fissure eruption.)
IMO reported that during 31 December-6 January fresh lava flowed N and also to the E where in part it transited through a closed channel (shallow lava tube). During 7-20 January 2015, IMO noted that the lava field expanded along its N and NE margins. Seismicity remained strong and local air pollution from gas emissions persisted. IMO said that on the days10 and 15 January the lava field covered 84.1 and 84.3 km2, respectively.
Figure 9 shows the eruption on 21 January 2015.
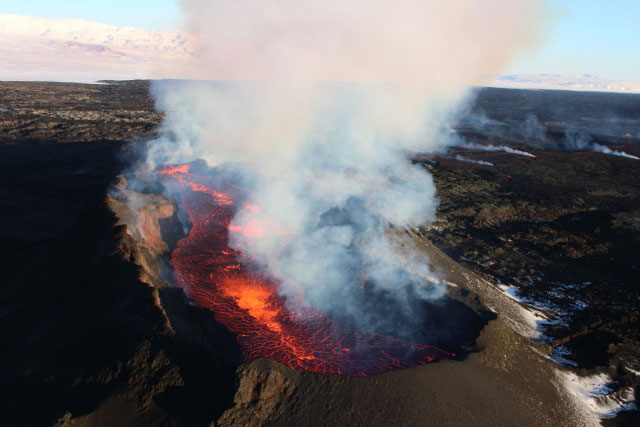 |
Figure 9. Photo taking on 21 January 2015 showing the Bardarbunga' eruption site at Holuhraun, including fissure vent, crater, lava flow, and plumes. The margins of the flow field are distinct in the distance, owing to snow cover. The main body of the flow field lies off the photo's margin to the right. Courtesy of IMO (Morten S. Riishuus). |
Subsidence. The caldera had been subsiding during the reporting period. The subsidence at Bardarbunga caldera was visible on the ice surface and was interpreted as reflecting deformation of the caldera itself. The depression developed in a roughly bowl-shape area that, as of 20 January 2015, was about 80 km2 in area with a volume exceeding 1.5 km3.
Figure 10 shows the chronology of subsidence levels between 5 September 2014 and 30 December 2014. The subsidence in the center of the caldera was about 60 m by 20 January 2015, a value determined by comparing the ice surface elevation with that elevation at the same location before the beginning of the collapse. Gudmundsson states that the assumption is that the ice surface lies more or less passively on top of the bedrock in the caldera. As of 20 January, no evidence of major ice melting had been observed; however, increased geothermal activity on the caldera rims has resulted in ice depressions over the hot spots. Other ice depressions on the Dyngjujokull glacier were also observed, suggesting that small, short sub-glacial eruptions may have occurred there. According to Gunnar Gudmundsson, there was no evidence of a subglacial eruption within the caldera.
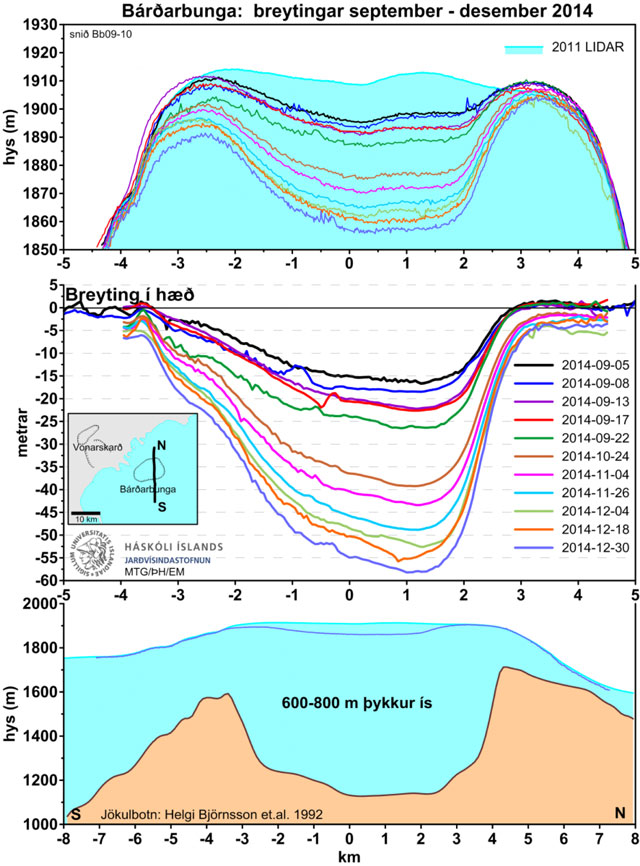 |
Figure 10. Topographic profiles plotted along a line across Bardarbunga's caldera for 5 September-30 December 2014. The N-trending profile crosses the E-central caldera (see inset on middle panel). The ice surface (top of light blue area) was constrained by lidar in 2011. The y-axis terms hys (m) and metrar refer to elevation and subsidence (both in meters). Subsidence (colored lines) was measured by a GPS station on the glacier surface in the caldera's center and by radar altimetry from aircraft. The bottom profile shows the overall picture with the caldera's surface and the 30 December 2014 profile (maximum subsidence). Courtesy of the Institute of Earth Sciences, University of Iceland (Magnus Gudmundsson and Thordis Hognadottir). |
During early December, IMO reported that the Scientific Advisory Board of the Icelandic Civil Protection had reviewed data from the beginning of the eruption to 3 December. They acknowledged that the subsidence rate had decreased during that time, dropping from highs of up to 80 cm/day down to 25 cm/day, with most of the subsidence concentrated at the caldera center.
References. Björnsson, H. and Einarsson, P., 1990, Volcanoes beneath Vatnajokull, Iceland: Evidence from radio echo-sounding, earthquakes and j kulhlaups, Jökull, no. 40, pp 147-168.
Carrivick, J and Gertisser, R, 2014, Bardabunga: eruption develops in Iceland, Geology Today, v. 30, Issue 6, pp. 205-206, November/December 2014, John Wiley & Sons Ltd.
Einarsson, P., B. Brandsdóttir, M. T. Gudmundsson, H. Björnsson, K. Grínvold, and F. Sigmundsson, 1997, Center of the Iceland hotspot experiences volcanic unrest, Eos Trans. AGU, 78(35),369–375, doi:10.1029/97EO00237.
Einarsson, B., 2009, Jökulhlaups in Skaftá: A study of a jökulhlaup from the Western Skaftá cauldron in the Vatnajokull ice cap, Iceland, Thesis for Master of Science in Geophysics degree, School of Engineering and Natural Sciences, Faculty of Sciences, University of Iceland, (URL: https://notendur.hi.is/~mtg/nemritg/BE-MS_2009.pdf)
Gudmundsson, A, Lecoeur, N, Mohajeri, N, and Thordarson, T, 2014, Dike emplacement at Bardarbunga, Iceland, induces unusual stress changes, caldera deformation, and earthquakes. Bulletin of Volcanology, vol. 76, no. 10, pp. 1-7.
Hartley, M. E., and Thordarson, T., 2013, The 1874–1876 volcano-tectonic episode at Askja, North Iceland: Lateral flow revisited. Geochemistry, Geophysics, Geosystems, vol. 14, no. 7, pp. 2286-2309.
Ialongo, I., Hakkarainen, J., Kivi, R., Anttila, P., Krotkov, N. A., Yang, K., & Tamminen, J., 2015, Validation of satellite SO2 observations in northern Finland during the Icelandic Holuhraun fissure eruption. Atmospheric Measurement Techniques Discussions, vol. 8, no. 1, pp. 599-621.
Institute of Earth Sciences (IES), 1996, The Gjálp eruption in Vatnajokull 30/9 - 13/10 1996, Institute of Earth Sciences (IES), University of Iceland, Accessed on 31 March 2015 (URL: http://earthice.hi.is/gjalp_eruption_vatnajokull_309_1310_1996) .
Larsen, G. and Gudmundsson, M. T., 2014, Volcanic system: Bárðarbunga system, pre-publication extract from the Catalogue of Icelandic Volcanoes, Accessed on 4 April 2015, (URL: http://blog.snaefell.de/images/Bardarbunga_kafli20140825.pdf).
Icelandic Meteorological Office, 2010, List of recent volcanic eruptions in Iceland, Accessed on 31 March 2015 (URL: http://en.vedur.is/earthquakes-and-volcanism/articles/nr/1874).
Marteinsson, V.T., Rúnarsson, Á., Stefánsson, A., Thorsteinsson, T., Jóhannesson, T., Magnússon, S.H., Reynisson, E., Einarsson, B., Wade, N., Morrison, H., and Gaidos, E., 2013, Microbial communities in the subglacial waters of the Vatnajokull ice cap, Iceland, The ISME Journal, vol. 7, pp. 427–437, doi:10.1038/ismej.2012.97, (URL: http://www.nature.com/ismej/journal/v7/n2/full/ismej201297a.html).
Seibert, L., Simkin, T., and Kimberly, P., 2010, Volcanoes of the World (Third Edition), pp. 204-205, University of Cailfornia Press, ISBN 978-0-520-26877-7.
Geological Summary. The large central volcano of Bárðarbunga lies beneath the NW part of the Vatnajökull icecap, NW of Grímsvötn volcano, and contains a subglacial 700-m-deep caldera. Related fissure systems include the Veidivötn and Trollagigar fissures, which extend about 100 km SW to near Torfajökull volcano and 50 km NE to near Askja volcano, respectively. Voluminous fissure eruptions, including one at Thjorsarhraun, which produced the largest known Holocene lava flow on Earth with a volume of more than 21 km3, have occurred throughout the Holocene into historical time from the Veidivötn fissure system. The last major eruption of Veidivötn, in 1477, also produced a large tephra deposit. The subglacial Loki-Fögrufjöll volcanic system to the SW is also part of the Bárðarbunga volcanic system and contains two subglacial ridges extending from the largely subglacial Hamarinn central volcano; the Loki ridge trends to the NE and the Fögrufjöll ridge to the SW. Jökulhlaups (glacier-outburst floods) from eruptions at Bárðarbunga potentially affect drainages in all directions.
Information Contacts: Icelandic Met Office (IMO) (URL: http://en.vedur.is/); London Volcanic Ash Advisory Centre (URL: http://www.metoffice.gov.uk/aviation/vaac/); Institute of Earth Sciences (IES), University of Iceland (URL: http://earthice.hi.is); Pall Einarsson, IES, University of Iceland; Gunnar Gudmundsson, IMO; Magnus Tumi Gudmundsson, IES, University of Iceland (URL: http://earthice.hi.is); National Commissioner of Police, Department of Civil Protection and Emergency Management (URL: http://avd.is/en/):NASA Earth Observatory (URL: http://earthobservatory.nasa.gov); Peter Hartree, Reykjavik, Iceland (UR: https://web.peterhartree.co.uk/).