Report on Nyamulagira (DR Congo) — January 2015
Bulletin of the Global Volcanism Network, vol. 40, no. 1 (January 2015)
Managing Editor: Richard Wunderman.
Nyamulagira (DR Congo) April 2011-January 2015: Lava fountains; and by 1 November, a lava lake
Please cite this report as:
Global Volcanism Program, 2015. Report on Nyamulagira (DR Congo) (Wunderman, R., ed.). Bulletin of the Global Volcanism Network, 40:1. Smithsonian Institution. https://doi.org/10.5479/si.GVP.BGVN201501-223020
Nyamulagira
DR Congo
1.408°S, 29.2°E; summit elev. 3058 m
All times are local (unless otherwise noted)
This report covers activity at Nyamuragira (also called Nyamulagira) (figure 47), primarily from April 2014 to January 2015, during which time there were intervals with lava fountains, high SO2 fluxes, elevated thermal infrared emissions, and high seismicity. A lava lake was in clear evidence starting in November 2014 and into 2015. In the previous reporting interval (BGVN 39:03) an eruption occurred on 6 November 2011 and continued through April 2012. The reporting below begins with [information provided] by Benoît Smets and scientific colleagues including Nicolas d'Oreye, Nicolas Theys, and Julien Barriere.
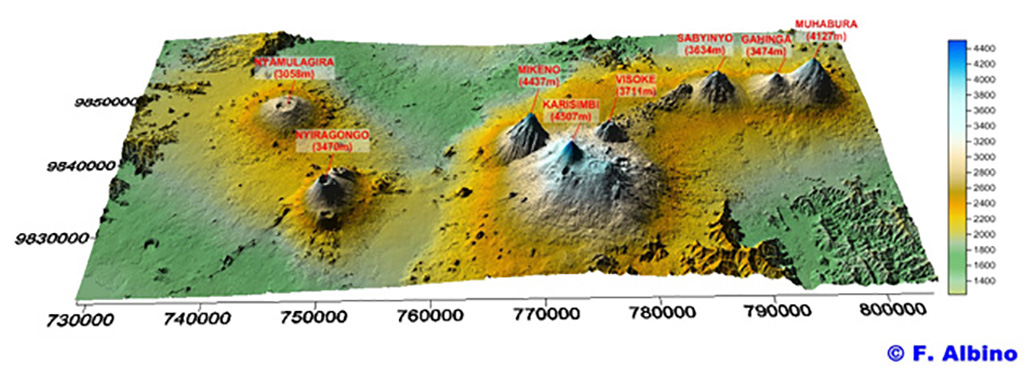 |
Figure 47. 3D perspective view of the Virunga Volcanic Province, located between D.R. Congo and Rwanda. During the project TanDEM-X, radar interferometry was used to calculate a Digital Elevation Model (5-m resolution). Courtesy of F. Albino. |
Activity during 2012 to early 2015. [The following is from the report submitted by Smets.]
"Starting from early March 2012, i.e. in the final stage of the five month-long eruption on the NE flank of Nyamulagira, SO2-rich gas fumaroles were observed in the summit caldera of the volcano (D. Tedesco, Pers. Comm.). These fumaroles escaped from several fractures and from the 400-m-wide, 50-80-m-deep pit crater located in the NE part of the caldera. During the second half of April 2012, a larger and permanent SO2-rich gas plume started to escape from that pit crater.
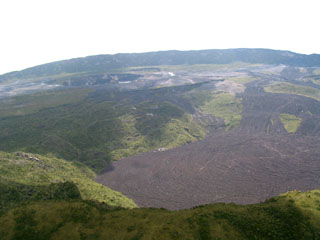
"In April 2014, local testimonies reported red glow on top of Nyamulagira. This was accompanied by unusual seismic activity recorded by the Goma Volcano Observatory (GVO). Because of intense degassing, helicopter flights at day and night did not allow detecting any fresh lava at ground surface. This kind of event reappeared on 22 June 2014. This time, helicopter flights and field surveys on 1 and 5 July 2014 did allow observing lava fountains escaping from the lowest inner flanks of the now ~500 m-deep and ~400 x 600 m-wide pit crater [figure 48]. At that time, lava fountains were not vigorous enough to create and sustain a basin of molten lava in the pit crater. This [lava fountaining] was also characterized by large amounts of SO2-rich gas emissions.
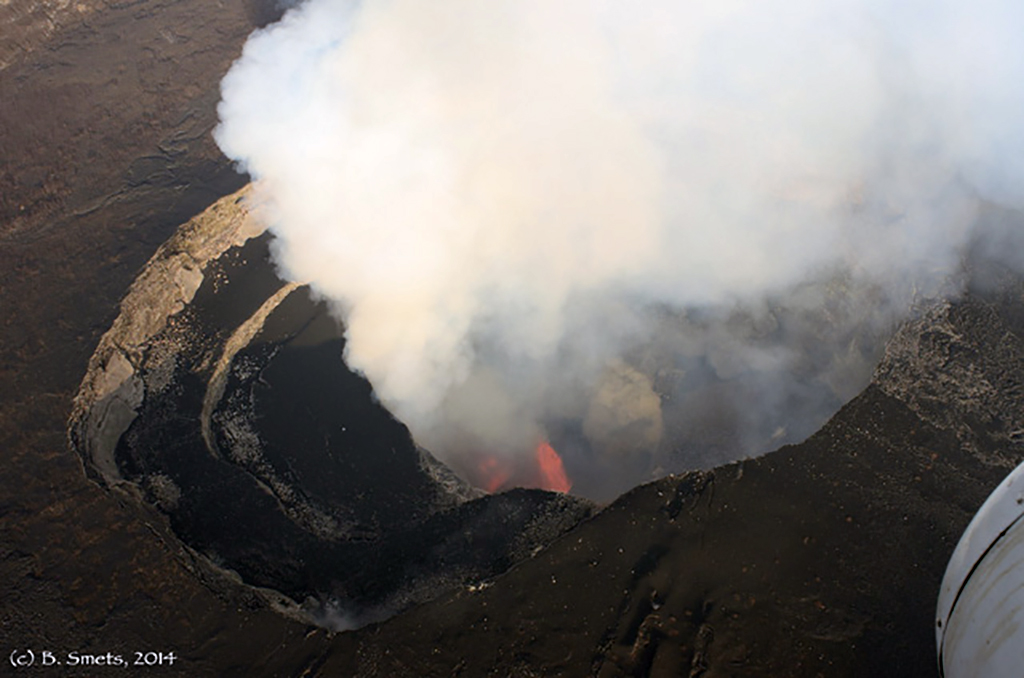 |
Figure 48. A lava fountain in the deep crater at Nyamuragira, as seen by Smets from a helicopter on 1 July 2014. In addition, he posted a video of the helicopter flyby to YouTube (see Benoît Smets, 2015, in the References section). A lava lake was not indicated. Courtesy of Benoît Smets. |
"This [lava fountaining] stopped mid-September 2014 and, on 1 November 2014, a small lava lake, i.e. a small bubbling lava basin, appeared in the deepest section of the pit crater (GVO, Pers. Comm.). The related SO2 emissions appeared lower than during lava fountain activity. The lava lake activity at Nyamulagira seems to continue since [1 November 2014 through at least January 2015]. SO2 gas emissions, radiated energy, and seismic activity during the April-December 2014 period illustrate very well the evolution of this new activity and the transition from lava fountaining activity to long-lived lava lake activity [figure 49]."
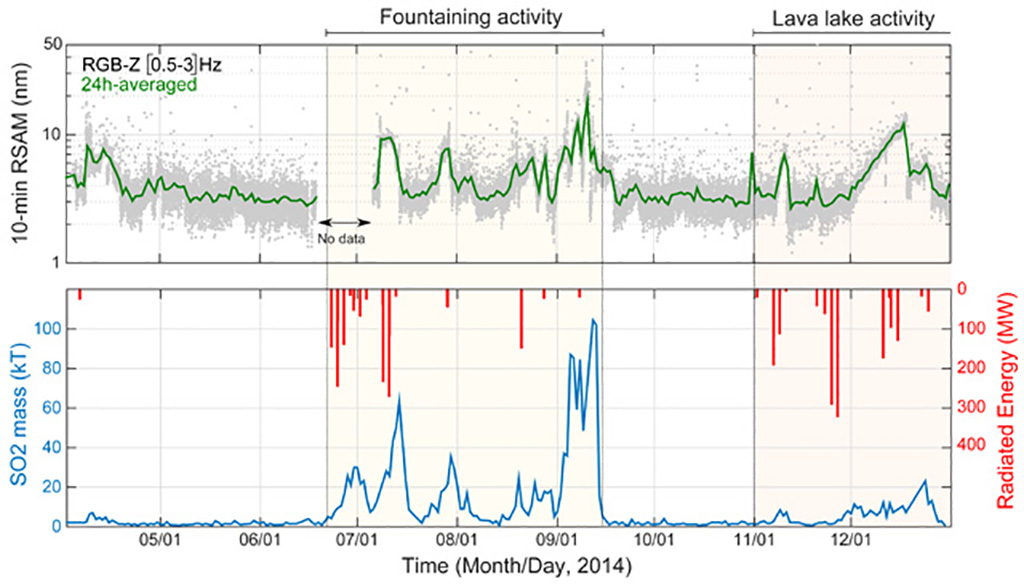 |
Figure 49. Graphs illustrating (top panel) seismicity, and (bottom panel) SO2 flux and radiated infrared energy at Nyamuragira during April to December 2014; (Green) seismicity in terms of Realtime Seismic Amplitude Measurement (RSAM), calculated using broadband seismometers at the Rumangabo station, ~20 km NE of the crater (installed in the RESIST and RGL-GEORISK projects); (Blue) SO2 emissions in the Virunga region, calculated using OMI measurements; (Red) radiated energy over Nyamuragira, calculated using MODIS imagery and the MODVOLC algorithm (Wright and others, 2004). Courtesy of Smets, d'Oreye, Nicolas Theys, and Julien Barriere. |
Labels at the top of figure 49 represent behavior that Smets' team inferred on the basis of field observations. The intervals of quiet are unlabeled. The intervals with lava fountaining correspond with some intervals of high seismicity, high radiance, and pronounced SO2 emissions. The intervals with the lava lake are somewhat similar to the fountaining in terms of seismicity and radiance but the SO2 emissions were subdued.
According to the NASA MEASURES dataset, total atmospheric column SO2 spiked during 19 to 26 June 2014. There was a period of low values during late September to early November 2014. After that and during the rest of the reporting interval, SO2 was often elevated.
Lava lake. Observations of a lava lake were infrequent during much of 2014. Landsat 8 satellite images taken on 30 June 2014 and 29 July 2014 were interpreted by NASA Earth Observatory analysts Jesse Allen and Robert Simmon. They found "very hot surfaces" they interpreted as representing "the lava lake within the summit crater." Smets' team did not observe a lava lake during helicopter missions and an expedition to the volcano in July 2014. The team noted that by 1 November 2014 GVO had seen a small lava lake in the deepest part of the crater.
According to Bobrowski and others (2015) during 25 October to 5 November 2014 the lava lake was "still under formation" and field surveys carried out failed to find evidence for it. On the other hand, lava fountains were clearly observable in a ~350-m-wide crater, originating from an area of ~20 to 40 m2. These fountains ejected materials and exhibited activity that the authors said might evolve into a new lava lake.
Once formed (by 1 November 2014), the lava lake was described as deep-seated and formed in a pit within the caldera's central N to NE area (Campion, 2014; Smets and others, 2014). As mentioned at the top of this report, Smets also noted that the lava lake continued to exist through and beyond January 2015 (the end of this reporting interval).
MIROVA stands for Middle InfraRed Observation of Volcanic Activity, where middle infrared is defined as 0.4-14.4 micrometer wavelengths. The infrared processing system uses source data that comes from the MODIS instrument that flies on the Aqua and Terra satellites. MIROVA makes plots of Volcanic Radiative Power (VRP). These are measurements of the heat radiated by hot volcanic products at the time of satellite acquisition. The VRP is calculated in Watts (W) and represents a combined measurement of the area of the volcanic emitter and its effective radiating temperature. MIROVA calculates the Volcanic Radiative Power (VRP) by using the "MIR method", an approach which was initially introduced by in order to estimate the heat radiated by active fires using satellite data (Wooster et al., 2003).
This approach (also known as Middle InfraRed method) relies on the fact that whenever a hot emitter has an effective radiating temperature higher than 600 K, the excess radiance detected in the MIR region (DLMIR), can be linearly related to the radiative power. Hence, for any individual hot-spot contaminated MODIS pixels, MIROVA calculates the VRP. (VRP = 18.9 x APIX x DLMIR where 18.9 is a best-fit regression coefficient (Wooster and others, 2003), APIX is the pixel size (1 km2 for the MODIS pixels) and DLMIR is the above background MIR radiance of the pixel.) When a hot-spot is detected in more than one pixel, the total VRP is calculated as the sum of all pixels detecting a hot-spot.
Figure 50 is a time-series plot compiled by the MIROVA infrared processing system. All of the events on the plot that correspond to thermal anomalies are in the categories labeled low, moderate, and high. All of the events in the range moderate to high came from sources within 5 km of the crater (blue data points). Thermal emissions increased in June 2014, were minor for a period from late September to early November 2014, and increased once again for an interval extending through January 2015. Note the continuity of more elevated anomalies starting in November 2014, when there was clear evidence of the lava lake.
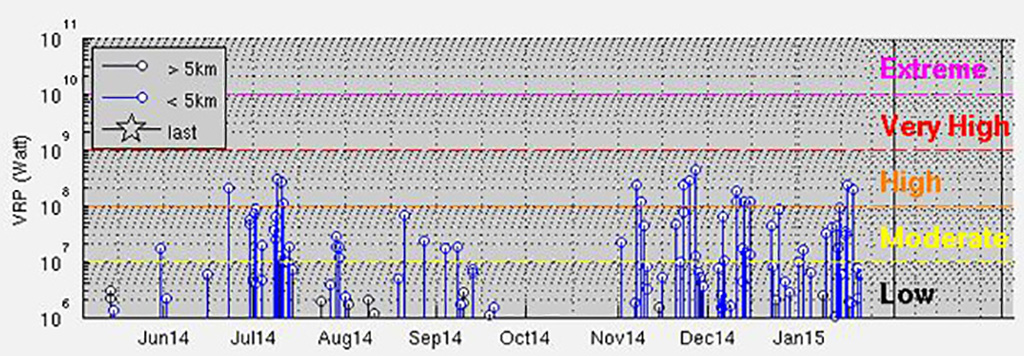 |
Figure 50. MODIS infrared data using MIROVA for the interval May 2014 through January 2015. The vertical scale shows 'Volcanic Radiative Power' (VRP, in Watts on a log scale, see text). Time is on the horizontal scale. As seen in the key at upper left, the blue data points represent those that occurred within 5 km of Nyamuragira's active crater, and the dark gray ones, over 5 km away. Courtesy of MIROVA. |
MODIS instrument infrared data is automatically analyzed with the MODVOLC algorithm, creating alerts for cases with above-threshold thermal emissions. During April-May 2014, there were only six days with thermal alerts. Subsequently, the number of alerts increased in June 2014, in concurrence with the lava fountains. There were heightened periods of activity during 22–29 June and 1–3, 10–12, and 28 July. During August and September 2014, thermal events were once again sparse with occurrences only on three days. No events were observed in October. Consistent with other observations of the formation of a lava lake, alerts increased on 1 November and continued during 6–10 and 22–26 November. Thermal events occurred during 10–15 December and on 22, 24, and 31 December 2014. In January 2015, thermal activity was detected regularly during 9–18 and 25–30 January.
References. Bobrowski, N., Calabrese, S., Giuffrida, G., Scaglione, S., Liotta, M., Brusca, L., D'Alessandro, W., Yalire, M., Arellano, S., Galle, B., Tedesco, D, 2015, Intercomparison of gas emissions from the lava lakes of Nyiragongo and Nyamulagira, DR Congo/ Plume composition and volatile flux from Nyamulagira volcano, (abstract) Geophysical Research Abstracts, 2015 European Geophysical Union Meeting, Vienna, Austria (URL: http://meetingorganizer.copernicus.org/EGU2015/EGU2015-6540.pdf; http://meetingorganizer.copernicus.org/EGU2015/EGU2015-13100-1.pdf)
Campion, R., 2014, New lava lake at Nyamuragira volcano revealed by combined ASTER and OMI SO2 measurements, 7 November 2014, Geophysical Research Letters (URL: http://onlinelibrary.wiley.com/doi/10.1002/2014GL061808/full)
Calabrese, S., Scaglione, S., Milazzo, S., D'Alessandro, W., Bobrowski, N., Giuffrida, G. B., and Yalire, M., 2014, Passive degassing at Nyiragongo (DR Congo) and Etna (Italy) volcanoes. Annals of Geophysics.
ESA Eduspace, date unknown, Nyiragongo and Nyamuragira, based on USGS, European Science Agency (URL: http://www.esa.int/SPECIALS/Eduspace_Disasters_EN/SEMDGLNSNNG_0.html) [accessed in May 2015]
Smets, B., 2015, Renewing activity at Nyamulagira volcano, 30 April 2015, Youtube (URL: https://www.youtube.com/watch?v=w1IHSjsgL48) [accessed in May 2015]
Smets, B., d'Oreye, N., Kervyn, F., 2014, Toward Another Lava Lake in the Virunga Volcanic Field?, 21 October 2014, EOS, Transactions American Geophysical Union (URL: http://onlinelibrary.wiley.com/doi/10.1002/2014EO420001/pdf)
Wooster, MJ, Zhukov, B, Oertel, D, 2003, Fire radiative energy for quantitative study of biomass burning: derivation from the BIRD experimental satellite and comparison to MODIS fire products. Remote Sensing Of Environment, 86(1), 83-107.
Wright, R., Flynn, L.P., Garbeil, H., Harris, A.J.L., Pilger, E., 2004. MODVOLC: near-real-time thermal monitoring of global volcanism. Journal of Volcanology and Geothermal Research 135, 29–49. doi:10.1016/j.jvolgeores.2003.12.008
Geological Summary. Africa's most active volcano, Nyamulagira (also known as Nyamuragira), is a massive high-potassium basaltic shield about 25 km N of Lake Kivu and 13 km NNW of the steep-sided Nyiragongo volcano. The summit is truncated by a small 2 x 2.3 km caldera that has walls up to about 100 m high. Documented eruptions have occurred within the summit caldera, as well as from the numerous flank fissures and cinder cones. A lava lake in the summit crater, active since at least 1921, drained in 1938, at the time of a major flank eruption. Recent lava flows extend down the flanks more than 30 km from the summit as far as Lake Kivu; extensive lava flows from this volcano have covered 1,500 km2 of the western branch of the East African Rift.
Information Contacts: Benoît Smets, (a) Center for Geodynamics and Seismology, Walferdange, Luxembourg; (b) Vrije Universiteit Brussel, Department of Geography; Earth System Science, Brussels, Belgium; (c) Royal Museum for Central Africa, Department of Earth Sciences, Natural Hazards and Cartography Service, Tervuren, Belgium; Nicolas d’Oreye, European Center for Geodynamics, and Seismology, Walferdange, Luxembourg and National Museum of Natural History, Geophysics/Astrophysics Department, Walferdange, Luxembourg; Nicolas Theys, Belgian Institute for Space Aeronomy, Brussels, Belgium; and Julien Barriere, European Center for Geodynamics and Seismology, Walferdange, Luxembourg and National Museum of Natural History, Geophysics/Astrophysics Department, Walferdange, Luxembourg; Goma Volcanological Observatory (GVO, aka Observatoire Volcanologique de Goma), Mt. Goma, Goma, Democratic Republic of Congo; Jesse Allan and Robert Simmon, NASA Earth Observatory (URL: http://earthobservatory.nasa.gov); NASA MEASURES (URL: https://so2.gsfc.nasa.gov/); MODVOLC alerts team, Hawai’i Institute of Geophysics and Planetology (HIGP), University of Hawai’i at Manoa, 1680 East-West Road, Post 602, Honolulu, HI 96822, USA (URL: http://modis.higp.hawaii.edu/); and MIROVA, Universities of Turin and Florence, Italy, Centre for Volcanic Risk of the Italian Civil Protection Department (URL: http://www.mirovaweb.it/).