Report on Bardarbunga (Iceland) — January 2015
Bulletin of the Global Volcanism Network, vol. 40, no. 1 (January 2015)
Managing Editor: Richard Wunderman.
Bardarbunga (Iceland) Eruption ceases on 28 February 2015
Please cite this report as:
Global Volcanism Program, 2015. Report on Bardarbunga (Iceland) (Wunderman, R., ed.). Bulletin of the Global Volcanism Network, 40:1. Smithsonian Institution. https://doi.org/10.5479/si.GVP.BGVN201501-373030
Bardarbunga
Iceland
64.633°N, 17.516°W; summit elev. 2000 m
All times are local (unless otherwise noted)
This report extends our recent coverage of Bardarbunga (BGVN 39:10) by discussing activity between 7 January 2015 and 1 May 2015, although the eruption ceased on 28 February 2015. Most of the information below is based on reports from the Icelandic Met Office (IMO), with ancillary information from other agencies as noted. For sources other than the IMO reports shown in the reference list, see the websites provided in the "Information contacts" section at the end of this report. In general, the information sources there closely coincides with the date range of interest. The eruption began at Holuhraun on 31 August 2014 (BGVN 39:10).
IMO reports for January 2015 noted that activity at Bárdarbunga's Holuhraun lava field grew slightly along its N and NE margins. The lava field covered 84.1 km2on 10 January, 84.3 km2 on 15 January, and 84.7 km2 on 22 January. Seismicity remained strong, for example, an earthquake swarm occurred on 29 January 2015. (Specific numbers of earthquakes appear in some IMO reporting, although no plot has emerged with graphical depiction of earthquakes in this reporting interval such as figure 5 in BGVN 39:10.) Local air pollution from gas emissions persisted. GPS measurements showed that subsidence continued. As measured on the ice surface, total subsidence of the Bárdarbunga surface between mid-August 2014 and the end of January 2015 was 61 m. During this period, IMO maintained an Aviation Colour Code of Orange (the second highest on a five-color scale).
IMO noted that on 21 January, "Handheld meters, carried by scientist near the eruptive site . . . showed SO2 concentrations of 29 ppm and 14 ppm. This is in concordance with the sulphur veils apparent from the aircraft and is reminiscent of the circumstances in SE Iceland [on] 28 October 2014. Since 1 ppm is about 3000 μg/m³ [micrograms per cubic meter ] this refers to concentrations of 87,000 μg/m³ and 42,000 μg/m³ respectively. For comparison, see values in the table compiled by the Environment Agency of Iceland and the Directorate of Health."
According to the Environmental Agency of Iceland, an SO2 concentration above 14,000 μg/m3 is the most hazardous of six health hazard categories; the Agency advises that serious respiratory symptoms are to be expected. More specifically, the Agency states that when SO2 concentrations exceed 14,000 μg/m3, residents should remain indoors, close the windows, and shut down air conditioning.
The Institute of Earth Sciences (IES) at the University of Iceland provided a map prepared on 21 January showing that the lava field was thickening and not spreading significantly; the volume of erupted lava was an estimated 1.4 km3 (15% uncertainty)(figure 11). An IMO report on 27 January stated that the average rate of lava emission during the previous three weeks had been just less than 100 m3 per second, taken by the report authors as a sign that the eruption intensity was slowly decreasing. On 27 January, a plume rose to an estimated height of 1.3 km above the plain.
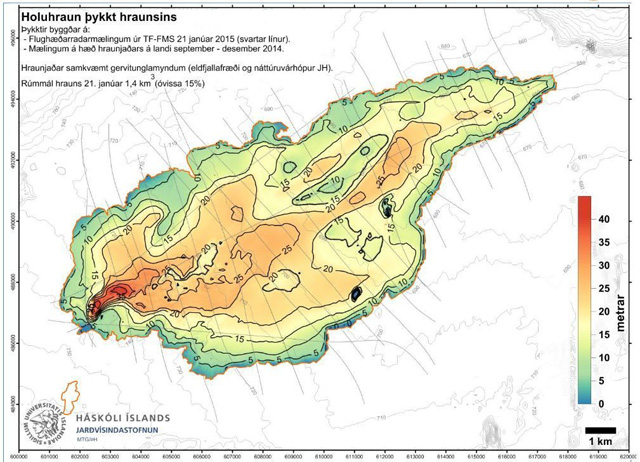 |
Figure 11. Map of the new lava from Bardarbunga, prepared on 21 January 2015. During January, the lava thickened, without extending much further. Numbers indicate the thickness (m) which is also color-coded (legend on right). Courtesy of Institute of Earth Sciences (IES), University of Iceland. |
On 6 February, IMO issued a statement that eruptive activity had decreased visibly during the previous two weeks, although seismicity was still strong. Lower seismicity continued during 11-19 February with many days of over a dozen earthquakes and seismic activity ranging up to M 4.3. On 14 February, the lava field covered 85 km2; measurements of the lava field's size on 4 and 12 February found no significant change.
An IES report issued on 20 February 2015 for 17-19 February 2015 noted "There is only one active vent inside the crater and the surface of the molten lava continues to sink. The lava channel has crusted over, except the 200-300 m nearest to the vent. The eruption column reaches no more than 1000 m above ground. The photos below show breakouts 15–16 km ENE of the vent, fed by the closed lava pathway which is inflating the lava field."
According to the IMO, a lava tube continued to feed the N and NE parts of Holuhraun, inflating the lava field. They also noted a reduced rate of effusion no longer sustained active breakouts in an area 17-18 km ENE from the vent.
A 24 February report noted that the rate of subsidence at Bardarbunga caldera was less than 2 cm per day. (IMO cautioned that care was needed with the interpretation of these data, given that GPS measurements are affected by ice flowing slowly into the caldera.) The eruption rate decreased substantially, and seismic activity continued to decrease although it was still considered strong.
IMO reported that a 27 February 2015 evening overflight found no visible incandescence at Holuhraun. According to FLIR thermal measurements, the radiant heat was greatest from the crater's rim, and lesser from the crater's depths. A gas detector in flight showed a maximum concentration of 0.5 ppm SO2, and a maximum concentration of 0.4 ppm when tested on the ground at the SW edge of the lava field. Glowing areas were observed in the NE part of the lava field; the maximum temperature detected was 560°C (compared to 1,200°C earlier). Radar measurements showed that the extent of the lava field had not increased since mid-February. (Data from SENTINEL-1 radar image 0741 UTC 27 February 2015 and helicopter flight, 1515 UTC 27 February 2015). According to IMO, experience with other lava-bearing eruptions suggested that the Holuhraun lava field would continue to emit gas for a long time. Without buoyant rise, driven by thermal emission from an active vent, the gases would remain low (near the ground surface). Therefore, IMO expected even greater concentrations of gas than residents had previously seen.
IMO reported that the eruption at the fissure of Bárdarbunga's Holuhraun, which began on 31 August 2014 ended on 28 February 2015. The Aviation Colour Code was lowered to Yellow.
IMO scientists conducted a field study on 3-4 March 2015, and found no signs of activity, other than a diffuse bluish haze at ground level across the lava field (figure 12). The IMO scientists reported that the crater rim had several cracks at the very edge, and while standing close to the crater rim it was possible to hear rumbling due to movements of rocks/solidified lava inside the crater.
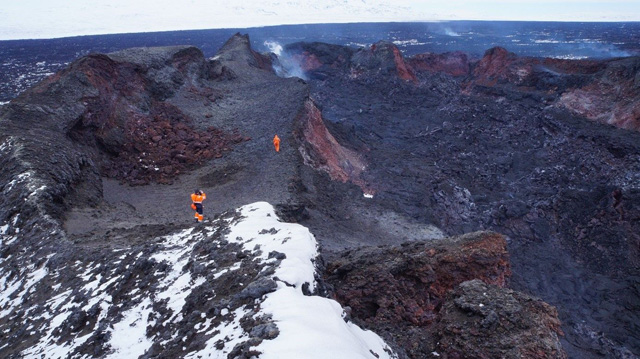 |
Figure 12. Photo of IMO geologists inside the Baugur crater on 4 March 2015. From the photo it appears that the vent discharging the lava is in the distance at the far end of the crater (area with white plume). According to the IMO caption, the photo was taken from the central part of Baugur crater as viewed looking along it to the N. The encrusted surface of the lava lake has collapsed, its remains seen as coarse, black rubble at the crater floor. On the crater floor, observers saw small vents sporadically discharging bluish gas. Part of the crater rim seen on the right side had broken, providing an outlet onto the lava field beyond. The resulting lava channel was about 50 m wide and 40 m deep. Courtesy of IMO (Ármann Höskuldsson; taken from IMO's March-April 2015 report). |
In early March maximum CO (carbon monoxide) and SO2 concentrations, measured with personal sensors near and at the crater rim, were 3 ppm and 2.5 ppm, respectively. A multiGAS instrument at the crater rim measured concentrations of SO2, CO2, H2S, and H2 for about 30 minutes, and provided ratios of CO2/SO2, H2O/SO2, and H2O/CO2 of 17, 101, and 6, respectively. The scientists noted that comparing the CO2/SO2 ratio with previous measurements showed a clear increase, consistent with the end of an eruption. The maximum concentrations measured with the MultiGAS instrument were at the level of 30 ppm for SO2 (the concentration at which the instrument saturates). For CO2 and H2S, the respective measurements were 700 ppm and 5 ppm. The level of SO2 was measured with an automatic gas detector, as reported by the Science Advisory Board of the Icelandic Civil Protection and disseminated by the Icelandic Commissioner of the Icelandic Police, as 500 µg/m3 (~0.5 ppm). Blönduós is a town and municipality in the North of Iceland situated on Route 1 at the mouth of the glacial river, Blanda. The report of the Police contained a links to a Gas Forecast and a Gas Model and involved scientists from the IMO and the IES along with representatives from the Icelandic Civil Protection, the Environmental Agency of Iceland and the Directorate of Health. The area to the SW and S of Blönduós was reported as possibly affected on the day following the measurement.
On 26 April, IMO lowered the Aviation Color Code to Green (the second lowest level), stating that no further signs of unrest had been noted since the end of the eruption on 28 February. Seismicity both within the caldera and the associated dyke intrusion continued to decline.
References.IMO, 2015 (January), Bárðarbunga 2015-January events, Seismic and volcanic events, 1-31 January, Icelandic Meteorological Office Accessed on 31 March 2015 (URL: http://en.vedur.is/earthquakes-and-volcanism/articles/nr/3071 ) (accessed May 2015).
IMO, 2015 (February), Bárðarbunga 2015-February events, Seismic and volcanic events, 1-28 February, Icelandic Meteorological Office Accessed on 31 March 2015 (URL: http://en.vedur.is/earthquakes-and-volcanism/articles/nr/3087 ) (accessed May 2015).
Geological Summary. The large central volcano of Bárðarbunga lies beneath the NW part of the Vatnajökull icecap, NW of Grímsvötn volcano, and contains a subglacial 700-m-deep caldera. Related fissure systems include the Veidivötn and Trollagigar fissures, which extend about 100 km SW to near Torfajökull volcano and 50 km NE to near Askja volcano, respectively. Voluminous fissure eruptions, including one at Thjorsarhraun, which produced the largest known Holocene lava flow on Earth with a volume of more than 21 km3, have occurred throughout the Holocene into historical time from the Veidivötn fissure system. The last major eruption of Veidivötn, in 1477, also produced a large tephra deposit. The subglacial Loki-Fögrufjöll volcanic system to the SW is also part of the Bárðarbunga volcanic system and contains two subglacial ridges extending from the largely subglacial Hamarinn central volcano; the Loki ridge trends to the NE and the Fögrufjöll ridge to the SW. Jökulhlaups (glacier-outburst floods) from eruptions at Bárðarbunga potentially affect drainages in all directions.
Information Contacts: Icelandic Met Office (IMO) (URL: http://en.vedur.is/); Institute of Earth Sciences (IES), University of Iceland (URL: http://earthice.hi.is); National Commissioner of Police, Department of Civil Protection and Emergency Management (URL: http://avd.is/en/); and The Environmental Agency of Iceland (URL: http://www.ust.is/the-environment-agency-of-iceland).