Report on Tungurahua (Ecuador) — March 2015
Bulletin of the Global Volcanism Network, vol. 40, no. 3 (March 2015)
Managing Editor: Richard Wunderman.
Tungurahua (Ecuador) Three periods of intense volcanism during late 2010-2011
Please cite this report as:
Global Volcanism Program, 2015. Report on Tungurahua (Ecuador) (Wunderman, R., ed.). Bulletin of the Global Volcanism Network, 40:3. Smithsonian Institution. https://doi.org/10.5479/si.GVP.BGVN201503-352080
Tungurahua
Ecuador
1.467°S, 78.442°W; summit elev. 5023 m
All times are local (unless otherwise noted)
Introduction. This Bulletin report covers activity at Tungurahua from November 2010 through December 2011, during which Ecuador's Instituto Geofísico-Escuela Politécnica Nacional (IG) reported three Eruptive Episodes (EE). The last Bulletin (BGVN 38:03) reported explosions and earthquakes at Tungurahua through late July 2010, followed by a lull in activity until October 2010.
This reporting period was characterized by ashfall; lahars; emissions of ash, water vapor, and gases such as SO2; strombolian activity; explosions; various types of earthquakes; and pyroclastic flows (PFs) among other events. Temporally, the majority of these events occurred during EE7 (November-December 2010), EE8 (April-May 2011), and EE9 (November-December 2011). Spatially, the processes such as lahars and PFs followed drainages, the geography of which is partly aided by maps and information in the next section. Intervening periods of low activity occurred during January-March 2011 and June-October 2011. The data presented here was gathered from various types of reports, special bulletins, and announcements published by IG.
Setting. Figure 54 displays a map of Tungurahua that includes ravines on its flanks and nearby inhabited areas. For ravines not seen in figure 54, such as those on the E flank, see figure 22 in BGVN 29:01. Table 8 in BGVN 29:01 gives the distances and direction of towns around Tungurahua, some of which are mentioned in this report. Mapa de Peligros–Tungurahua (Map of Hazards–Tungurahua) can also be viewed on IG's website, for a more general view of Tungurahua and environs.
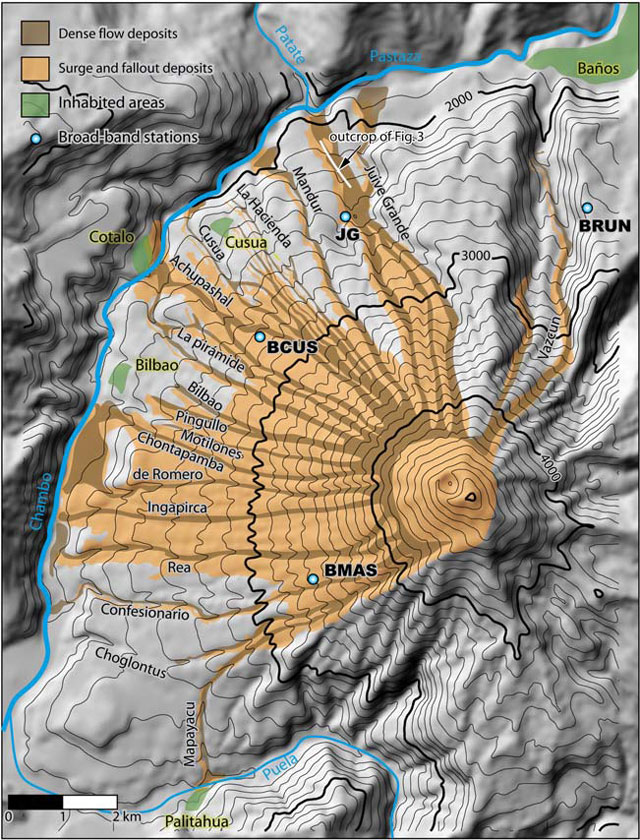 |
Figure 54. Map showing ravines and several inhabited areas around Tungurahua. Part of the network of stations that monitors seismic-acoustic activity is also shown. Deposits (noted in the key) were laid down in the August 2006 eruption. The Chambo and Patate Rivers join to form the Pastaza River, which flows E. Taken from Kelfoun and others (2009). |
Eruptive episodes (EEs). In 2006, IG partnered with Japan's International Cooperation Agency to improve the monitoring of Tungurahua's seismic-acoustic activity, through the deployment of a network of broadband seismic sensors and infrared sensors. By 2008, the network had five stations (BMAS, BPAT, BRUN, BBIL and BULB), each located 5-7 km from Tungurahua's crater (figure 55). The sensors record seismic and acoustic signals propagated by volcanic explosions, emission tremors, booms, and chugging-type events. Information from the sensors and other observations, are used to define each EE. Table 18 shows the nine EEs registered from 2006-2011 based on information from IG's 2011 annual report on Tungurahua's explosive activity.
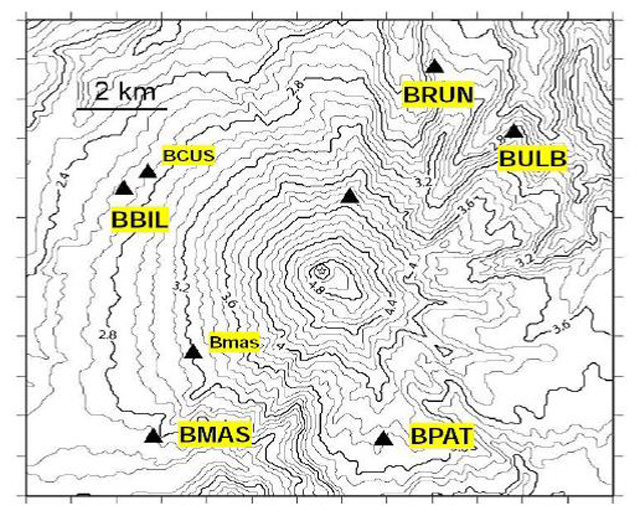 |
Figure 55. Map of the network of stations that monitor seismic-acoustic activity at Tungurahua. Each station is equipped with broadband seismic sensors and infrared sensors. Source: Instituto Geofísico-Escuela Politécnica Nacional (IG). |
Table 18. The nine Explosive Episodes (EEs) recorded by IG at Tungurahua since 2006. The table also shows the number of explosions recorded during each EE. Source: Instituto Geofísico-Escuela Politécnica Nacional (IG).
| Eruptive Episode (EE) | Eruptive Episode Number | Number of explosions |
| 14 July 2006-16 August 2006 | EE1 | 118 |
| 25 February 2007-18 April 2007 | EE2 | 366 |
| 13 July 2007-10 February 2008 | EE3 | 1165 |
| 26 March 2008-27 June 2009 | EE4 | 822 |
| 5 January 2010-19 March 2010 | EE5 | 502 |
| 26 May 2010-28 July 2010 | EE6 | 1331 |
| 22 November 2010-25 December 2010 | EE7 | 110 |
| 22 April 2011-26 May 2011 | EE8 | 64 |
| 27 November 2011-22 December 2011 | EE9 | 55 |
Activity through mid-November 2010. After a four-month lull in activity, Tungurahua revived in November 2010, displaying somewhat elevated seismicity that included a series of volcano-tectonic (VT) earthquakes and a few low-energy explosions. IG's weekly report no.46, detailing activity from 15-21 November, stated that activity remained low with 88 long period (LP) earthquakes; 4 VT earthquakes; weak fumarolic activity; and weak emissions of water vapor and volcanic gases. Rains of varying intensities produced lahars from 15-19 November. On 16 November, the largest lahars of the week descended all of Tungurahua's ravines, with the most significant lahars descending the Mapayacu, Bilbao, and Vazcún ravines (figure 54).
EE7: 22 November-25 December 2010. A sudden increase in activity on 22 November, characterized by explosions in the afternoon and at night, marked the beginning of Tungurahua's EE7, according to IG's 2010 annual report on explosive activity. At 1408, a low-energy explosion was heard around Tungurahua and at the Observatorio del Volcán Tungurahua (OVT), located 14 km to the NW in Guadalupe. Movements of blocks along the upper flanks and an emission of low-to-moderate ash content that moved S accompanied the explosion. At 2235, a sudden large explosion generated an ash plume that rose to more than 7 km in altitude. This explosion triggered the ballistic expulsion of incandescent blocks, which descended ~1.5 km below the crater. Reports of ashfall and falls of gravel were received from communities to the W of Tungurahua, such as Choglontus.
Later, smaller explosions that produced emission columns 2-3 km above the crater were reported. Rains during the late afternoon generated a lahar that descended the Mapayacu ravine and temporarily dammed the Puela River. The Washington Volcanic Ash Advisory Center (VAAC) reported a 7.6 km altitude ash plume, during the night of 22 November, and ash emissions that rose 6.4 km in altitude on the morning of 23 November. EE7 continued until 25 December 2010. Figure 56 shows the number of explosions per day registered during this episode.
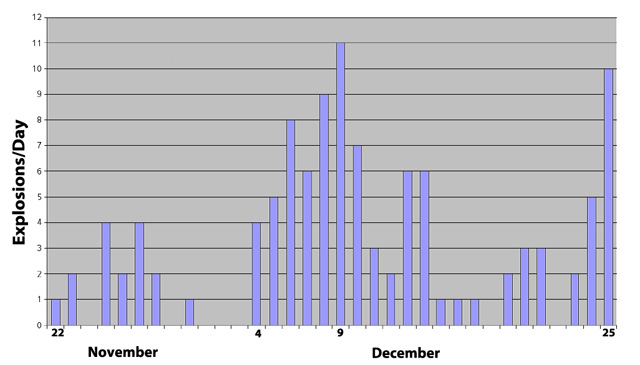 |
Figure 56. Histogram showing the number of explosions per day recorded seismically at Tungurahua from 22 November to 25 December 2010 during EE7. 110 explosions were recorded, with the highest number of explosions occurring on 9 December. Source: Instituto Geofísico-Escuela Politécnica Nacional (IG). |
According to IG's special bulletin no. 20, starting on 24 November 2010, the continuous ash emissions indicated the process of an open system, characterized by the constant generation of emission columns with variable amounts of ash due to an open and unsealed magma ascent path. Ashfall was reported in Ulba, Baños, Juive, Runtún, Bilbao, and Choglontus (settlements located on the NE-SW flanks).
Tungurahua's elevated activity continued through 3 December 2010 with (a) ash emissions, some rising ~3-4 km above the crater; (b) ashfall affecting communities such as Bilbao, Choglontus, El Manzano, and Cahuají; (c) strombolian activity with fountains up to ~1 km above the crater; (d) booming noises of varying magnitude; and (e) the expulsion of incandescent blocks, which rolled as much as ~1 km below the crater. On 29 November, an increase in SO2 was registered by the satellite-based Ozone Monitoring Instrument (OMI). IG also noted an increased SO2 flux through their fixed gas-monitoring stations.
On 4 December 2010, there was a very rapid and sudden increase in Tungurahua's seismic activity after no explosion signals were registered on the preceding days (figure 56). From 0830, the rapid increase in activity was manifested by (a) a speedy rise in the registered internal vibration; (b) an increase in the intensity and duration of booms and explosions; (c) an increase in the volume of emissions with higher ash levels; and (d) blocks moving more than 1.5 km below the crater. Residents in cities on the skirts of the volcano reported feeling vibrations. Due to this sudden increase in activity, the Alert Level was raised to Red by the National Secretariat of Risk Management, and populations around Tungurahua were evacuated.
Around 0939 on 4 December, observers saw pyroclastic flows (PFs) on Tungurahua's W and N flanks. At 0946, several PFs descended the Vazcún ravine. By 1130, PFs were still descending ravines on the W side, such as Mandur, Choglontus, and La Rea. The last PF of the day, at 1404, descended through the Juive sector. All the PFs on 4 December, descended ~2 km from the crater; the largest descended the Vazcún, Juive, and Mandur ravines.
During the afternoon of 4 December, IG noted a reduction in the intensity of activity, although a plume with moderate-to-high ash content rose ~3 km above the crater. Throughout the day, incandescent blocks rolled ~2 km down the flanks. During the evening, the seismic and surface activity continued to decrease. The Alert Level was lowered from Red to Orange.
An IG announcement, released on 4 December 2010, noted that this sudden increase in activity was unexpected in an open system. Special bulletin no. 23, also from 4 December, stated that Tungurahua's increased activity and the generation of PFs were associated with a rapid increase in the volume of magma entering the lower ducts of the volcanic vent and upon finding an open system, the magma was able to quickly rise to the crater and overflow as PFs.
After 4 December 2010, Tungurahua's activity returned to moderate levels. On 5 and 6 December, ashfall occurred in communities to the NW, W and SW. On 7 December, special bulletin no. 24 described activity marked by a constant emission of gases and ash, rising 2-3 km above the crater, occasionally accompanied by incandescent blocks, ejected hundreds of meters above the crater, before falling onto Tungurahua's flanks and rolling 1-2 km. According to that bulletin, secondary transport of ash also affected communities to the W of Tungurahua; crops in that area were reportedly covered by ash, no more than 1 mm thick.
On 9 December 2010, the maximum number of explosions for this EE was recorded (figure 56), and a PF descended also the Cusúa ravine. Tungurahua's explosive activity decreased thereafter. Between 9 and 23 December, activity included: incandescent blocks ejected above the crater rolled down Tungurahua's flanks; plumes containing variable amounts of ash often rose as high as 2-3 km above the crater; ashfall was reported in nearby communities; explosions caused vibrations of windows, "cannon shots", and plumes; and lahars. According to special bulletin no. 26, from 13 December, there was an increase in the number of LP earthquakes and from15 December, several VT earthquakes were recorded.
Between 24 and 25 December 2010, IG registered a series of small-to-moderate-sized explosions. Figure 56 shows 10 explosions were recorded on 25 December, after which explosive activity was reported to have stopped. Special bulletin no. 1, from 5 January 2011, stated Tungurahua's monitoring system had detected: smaller plumes with lower ash content; no explosions since 25 December 2010; fewer LP earthquakes and emission tremors (26 December 2010, 36 LPs and 4 emission tremors were recorded, while on 2 January 2011, 18 LPs and 1 emission tremor); decreased SO2 emissions (26 December, 2,200 tons/day of SO2 were recorded, but days before 5 January, 200 tons/day were recorded); and less pressure in the upper part of the cone. IG also reported 10 small VT earthquakes, interpreted to represent the entrance of new magma into the volcanic system and precursors to an increase in explosive activity.
Lull during January-March 2011. Weekly reports in January described moderate activity until 5 January, after which activity was moderate to low through 18 January. Special bulletin no.2 stated that between 5 and 17 January emissions mainly consisted of water vapor. January ended with activity being low and it remained so for the next two months (figure 57).
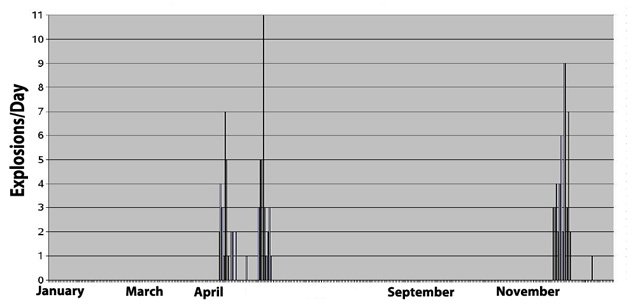 |
Figure 57. Histogram showing the number of explosions recorded per day at Tungurahua from January to December 2011. Source: Instituto Geofísico-Escuela Politécnica Nacional (IG). |
EE8: 22 April-26 May 2011. Tungurahua's monitoring stations began to register an episode of volcanic tremor at 1714 on 20 April 2011. A plume with low-to-moderate ash content rose 3 km above the crater and drifted SW. This was the first major sign of surface activity since the beginning of 2011. An IG announcement from 20 April stated that small seismic fracture events were observed. Deformation observed in the NW quadrant since February 2011 had recently increased. During the night of 20 April, IG personnel witnessed strombolian activity, accompanied by constant booms of moderate intensity. Incandescent blocks also rolled 1 km down the flanks.
At 1512 on 22 April 2011, a moderate-sized explosion signaled the beginning of Tungurahua's EE8, according to the 2011 annual report on explosive activity. EE8 continued until 26 May and was characterized by a total of 64 explosions (figure 58). According to IG's weekly report no. 16, detailing activity from 18-24 April, low-intensity rains produced muddy water in some of Tungurahua's ravines. During this interval, plumes with moderate-to-high ash levels rose 5 km above the crater. On some nights, strombolian activity was observed, and ashfall of varying intensities affected numerous settlements including Choglontus, Bilbao (figure 59), El Manzano, Puela, Cusúa, Guadalupe, Baños, Ulba, and Cevallos. SO2 was measured at 571 tons/day on 19 April and increased each day until it reached a maximum of 6,015 tons/day on 24 April.
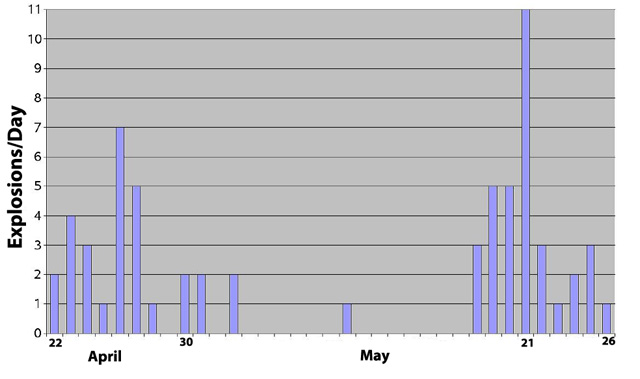 |
Figure 58. Histogram showing the number of explosions recorded per day at Tungurahua from 22 April to 26 May 2011. In total, 64 explosions were recorded, with the maximum number of explosions occurring on 21 May. Source: Instituto Geofísico-Escuela Politécnica Nacional (IG). |
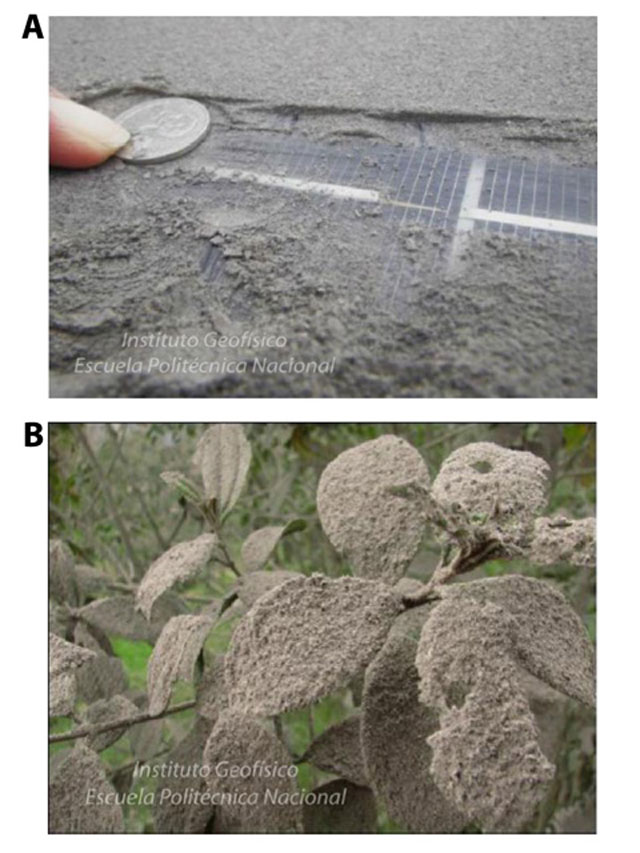 |
Figure 59. (A) Ash covering the surface of a solar panel in Bilbao (8 km W of Tungurahua) on 24 April 2011. (B) Ash covering vegetation in Bilbao on 24 April 2011. In Bilbao, ash accumulated over 12 hours due to constant emissions and reached a thickness of ~3 mm. Source: Instituto Geofísico-Escuela Politécnica Nacional (IG). |
According to special bulletin no. 5 from 26 April 2011, during 20-26 April ash emissions were accompanied by booms of varying intensity, lava fountains, and incandescent blocks rolling down the upper flanks. Data collected by inclinometers showed continued deformation in the NW quadrant.
On 26 April 2011, volcanic activity increased (figure 58), starting around 1245, with ash emissions rising 8-12 km above the crater. Areas to the NW and W experienced ashfall. OVT received reports that activity caused vibrations of the ground in areas close to the volcano. In Baños (8 km N), vibrations of doors and windows were reported. The National Secretariat of Risk Management declared an Orange Alert Level for areas around the volcano and evacuated families in Cusúa, Bilbao, and Chacauco. A widening of the volcanic cone was also detected on 26 April.
Another increase in activity occurred on 29 April 2011 and lasted for 48 hours. At ~0100, an increase in seismic amplitude and the presence of harmonic tremor were registered. Emissions with moderate-to-high ash content were often observed rising 2-3 km above the crater, moving NE. Baños, Runtún, Ulba, Juive and Cusúa received notable ashfall, while in Guadalupe, ash was lightly deposited. Emissions also rose 7 km above the crater and drifted mainly SE toward uninhabited areas. Strombolian eruptions also ejected blocks from the crater.
According to special bulletin no. 7, published on 3 May, the intensity of Tungurahua's emissions started to slowly decrease on 1 May, until returning to levels similar to those observed at the beginning of this EE. Special bulletin no. 7 also stated that Tungurahua's seismic and deformation monitoring systems continued to show evidence of internal pressurization. That bulletin also mentioned that IG and the French Institute for Research and Development (IRD) had estimated that ~1.6x10⁶ m3 to 3x10⁶ m3 of ash was deposited in areas around Tungurahua during an unstated amount of time; the maximum thickness reached 15.5 mm (figure 60).
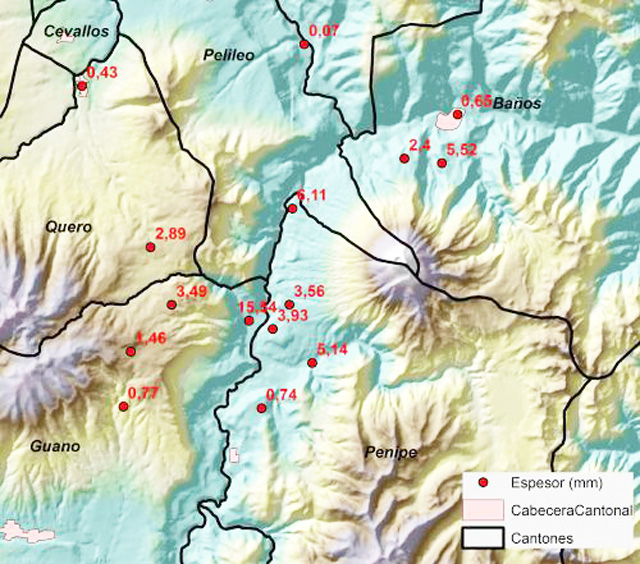 |
Figure 60. Map of accumulated ash thickness in areas around Tungurahua as measured on 2 May 2011. The interval over which the ash accumulated was unstated. Thicknesses were measured in mm. The English translations for the Spanish words in the key are: Espesor, thickness; Cabecera Cantonal, cantonal capital; and Cantones, districts. Source: Instituto Geofísico-Escuela Politécnica Nacional (IG). |
Special bulletin no. 8 from 6 May 2011 stated that since 3 May, surface activity had continued to decrease with respect to the height, frequency, and ash content of the plumes and in the number of explosions. Nevertheless, IG warned that the decrease in emissions did not signal the end of this EE. Evidence of increasing internal pressure, presumably caused by the ascent of a new volume of magma towards the upper volcanic ducts, continued to be registered through deformation recorded by GPS and inclinometers, rock fracture earthquakes, and constant emission of volcanic gases. SO2 fluxes surpassed 2,000 tons/day.
After 6 May, Tungurahua experienced a slight lull in its eruptive activity for ~ 10 days; however, roaring was sometimes still heard, ashfall was reported, and on 10 May an explosion produced an ash plume that rose 5 km above the crater. More consistent and elevated activity resumed at 2222 on 16 May when gas-and-ash plumes rose between 1.5 and 2 km above the crater and drifted NE. At dawn on 17 May, significant ashfall was reported in Río Negro, ~25 km E of Baños. Special bulletin no. 9 (issued 17 May) said that a slight decrease in deformation was recorded by inclinometers as well as a reduction in the gas fluxes (less than 300 tons/day were recorded through 16 May). On the afternoon of 17 May, new fumaroles were also identified ~ 1,000 m below the summit on the W flank.
Through 19 May 2011, Tungurahua continued emitting vapor and gas containing variable amounts of ash. Ashfall affected communities in the NE-E-SE sectors such as Río Negro, Baños, Runtún, Cusúa, and Bilbao. The greatest measured thickness was 3 mm in Trigal, located to the SE. At midday on 19 May, observers witnessed explosions of significant sizes producing ash plumes that rose 3 km above the crater and drifted W and SW.
During 18-25 May 2011, seismic activity was characterized by 37 explosions, the majority of which occurred on 21 May (figure 58). Some of the explosions generated "cannon shots" that vibrated structures in nearby areas. Activity was characterized by high seismicity, including LP events and tremors. On 25 May, surface activity had decreased, but seismicity was moderate-to-high, deformation continued, and SO2 was being still emitted.
Constant rains during 27-28 May generated lahars and the swelling of rivers. On 27 May, a large lahar descended the Pingullo ravine, halting traffic along the road between Baños and Penipe. Muddy water moved down the Juive, Vazcún, Pondoa, Bilbao, Mapayacu, Ulba, and Achupashal ravines. On 28 May, flows of muddy water traveled down the Bilbao, Pondoa, Juive, and La Pirámide ravines; swelling of the Chambo and Puela rivers was reported; and the Ulba River doubled its volume and carried large blocks of rock. At the end of May 2011, activity returned to moderate levels.
Lull from June to October 2011. A second lull in explosive activity occurred (figure 57). On 29 July, 20 landslides took place along the Baños access road, a vital escape route.
On 7 October 2011, the Washington VAAC reported an ash plume that rose ~1 km above Tungurahua's crater and drifted W. On 24 October, another ash plume rose slightly over 2 km above the crater and drifted W. However, IG stated they had not observed any ash emissions since June. On 9 November, the Washington VAAC reported an ash plume, while IG reported only gas-and-steam emissions. On 15 October, IG also reported the reactivation of a fumarole, first observed in May 2011, on Tungurahua's W flank. The fumarole's activity lessened during the following week.
EE9: 27 November-22 December 2011. Three explosions (figure 61) on 27 November marked the beginning of Tungurahua's EE9, which continued to 22 December.
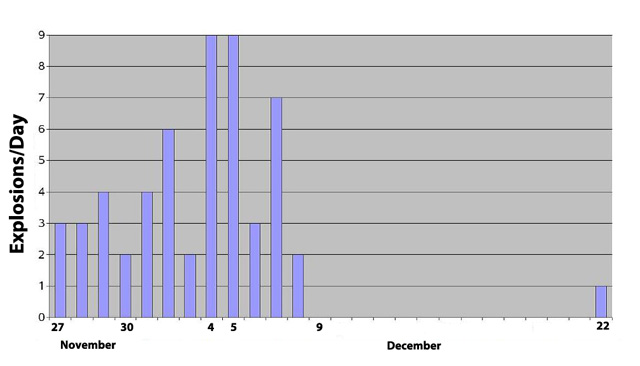 |
Figure 61. Histogram showing the number of explosions recorded per day at Tungurahua from 27 November to 22 December 2011. During this EE, 55 explosions were recorded and the maximum number of explosions was registered on 4 and 5 December. Source: Instituto Geofísico-Escuela Politécnica Nacional (IG). |
On 27 November 2011, seismic activity began steadily increasing at 1540. At 1700, explosions of varying sizes were detected. Booms and "cannon shots" produced by the explosions were heard in areas close to Tungurahua. As activity progressed, explosions generated PFs that descended ravines on the NW and W flanks. The explosions also ejected incandescent blocks that rolled to ~1 km below the crater. Four VT earthquakes were also registered beginning at 1650. IG received reports of ashfall in El Manzano and Bilbao; deposits of coarse-grained ash in Pillate; ash with shards in Cotaló; and only shards in Cusúa. Later, PFs descended the S and SW flanks. Distances traveled by the PFs on the NW, W, S and SW flanks were unstated.
During the last days of November 2011, activity remained high. On 28 November, an explosion ejected incandescent material and generated a PF in the Achupashal ravine. There were also almost constant booms of moderate-to-high intensity, lava fountains, and ejected incandescent blocks that traveled ~1 km down the W and NW flanks. A constant ash plume rose 3 km over the summit. Small PFs descended the S flank, and ash fell in El Manzano, Choglontus, and Runtún. At night, incandescent blocks were observed being ejected above the crater before they descended 400-500 m down the flanks.
On 29 November, two PFs were observed: the first traveled ~500 m down the NW flank; the second traveled ~1 km down the Pingullo ravine. Almost-constant booms of moderate-to-high intensity and muddy water flowing down several ravines on the W side were noted. Ash-and-gas plumes rose up to 4 km above the crater, and tremor was constant. On 30 November, plumes rose to average heights of 2 km and minor ashfall in Baños and Río Verde was reported.
Activity remained high during the beginning of December. On the night of 1 December, a decrease in tremor amplitude coincided with an increase in the number of explosions. Strong "cannon shots" were generated by some of the explosions and incandescent blocks ejected onto the flanks rolling 1 km downslope. Heavy rains during the night led to the descent of lahars in the Mapayacu and La Pampa ravines and the swelling of the Vazcún River. Early on 2 December, an increase in tremor amplitude corresponded with moderate to strong booms. An ash plume later rose 1.5 km above the crater, drifting E.
During the night of 2 December and dawn of 3 December, IG noted two periods with increased tremor amplitude, during which a great volume of incandescent blocks was expelled and high intensity booms resonated through nearby communities. On 3 December, several PFs traveled ~1.5 km in the upper parts of La Rea and Ingapirca ravines and ravines on the NW flank. A plume with high ash content rose 2-3 km above the crater. Ash fell in settlements, including Bilbao, Cusúa, El Manzano, and Penipe.
During 4-5 December, the maximum number of explosions for EE9 was recorded (figure 61). On both days, seismicity consisted of constant tremor intermixed with explosions. On 4 December, strong booms and "cannon shots", both associated with explosive activity, were reported by communities close to Tungurahua. A plume with moderate-to-high ash content rose 4 km high, a small PF was noted, and ash fell in Bilbao, Cusúa, and El Manzano. On 5 December, an ash plume rose 1 km above the crater and drifted N and NE, leading to ashfall in Baños and Runtún. Booms of low to moderate intensity were also reported. On 7 December, explosions generated "cannon shots" of moderate intensity; blocks descended the flanks generating noises; a plume with moderate ash content rose 1.5 km above the crater and drifted W; and Cusúa and Chacauco received ashfall. On 8 December, similar conditions prevailed, but some plumes also rose as high as 4 km above the crater.
Activity declined on 9 December according to special bulletin no. 18. Emissions contained only water vapor. SO2 fluxes had fallen to 500 tons/day, which was significantly less than the maximum 8,000 tons/day measured after 28 November. Special bulletin no. 18 noted that despite these declines, seismic events such as LP and VT earthquakes were still recorded (between 60 and 170 LP earthquakes were registered daily). That special bulletin also remarked that the network for deformation monitoring did not register any evidence of the ascent of a new volume of magma towards the surface. This decline in activity lasted until 21 December.
From about 0830 on 22 December, several seismic events indicated the movement of fluids within Tungurahua's interior. Three explosions produced ash plumes that rose less than 500 m above the crater, the second explosion of which led to a PF that descended 300-400 m down the NW flank. That afternoon, a high-energy explosion generated two PFs that descended the Achupashal and La Hacienda ravines. An ash plume rose 4 km above the crater and drifted NW. The PFs descended to a maximum of 2 km below the crater, without reaching inhabited or cultivated areas. Ashfall was reported in N and W communities. Ash-and-gas plumes continued, and at night strombolian activity ejected blocks ~500 m above the crater, which landed and rolled 500 m below the crater.
For the rest of December 2011, activity was considered moderate. After 22 December, ash was often deposited in areas to the SW of Tungurahua such as El Manzano and Choglontus, where up to 2-4 mm of ash was deposited. On 23 December constant gas-and-ash emissions rose ~200 m above the crater and were carried SW. Ashfall was reported in El Manzano, Choglontus and Chacauco. On 24 December, no surface observations were made, but there were reports of ashfall in El Manzano, Choglontus and Cahuají. On 25 December, an emission with moderate-to-high ash content was observed rising 500 m above the crater and drifted W. Ashfall was reported in El Manzano. From 27 to 29 December, the area around Tungurahua was cloudy and no reports of booms or ashfall were received. On the last day of 2011, small emissions of water vapor and minor rains were reported.
References. Kelfoun, K., Samaniego, P., Palacios, P., Barba, D., 2009. Testing the suitability of frictional behaviour for pyroclastic flow simulation by comparison with a well-constrained eruption at Tungurahua volcano (Ecuador). Bulletin of Volcanology, v. 71(9), p. 1057-1075 (URL: http://dx.doi.org/10.1007/s00445-009-0286-6)
Geological Summary. Tungurahua, a steep-sided andesitic-dacitic stratovolcano that towers more than 3 km above its northern base, is one of Ecuador's most active volcanoes. Three major edifices have been sequentially constructed since the mid-Pleistocene over a basement of metamorphic rocks. Tungurahua II was built within the past 14,000 years following the collapse of the initial edifice. Tungurahua II collapsed about 3,000 years ago and produced a large debris-avalanche deposit to the west. The modern glacier-capped stratovolcano (Tungurahua III) was constructed within the landslide scarp. Historical eruptions have all originated from the summit crater, accompanied by strong explosions and sometimes by pyroclastic flows and lava flows that reached populated areas at the volcano's base. Prior to a long-term eruption beginning in 1999 that caused the temporary evacuation of the city of Baños at the foot of the volcano, the last major eruption had occurred from 1916 to 1918, although minor activity continued until 1925.
Information Contacts: Instituto Geofísico (IG), Escuela Politécnica Nacional, Apartado 17-01-2759, Quito, Ecuador (URL: http://www.igepn.edu.ec/); Washington Volcanic Ash Advisory Center, Satellite Analysis Branch (SAB), NOAA/NESDIS E/SP23, NOAA Science Center Room 401, 5200 Auth Rd, Camp Springs, MD 20746, USA (URL: http://www.ospo.noaa.gov/Products/atmosphere/vaac/).