Report on Pavlof (United States) — April 2015
Bulletin of the Global Volcanism Network, vol. 40, no. 4 (April 2015)
Managing Editor: Richard Wunderman.
Pavlof (United States) Spatter-fed lava interacting with ice, spawning clastogenic lava flows, lahars, and pyroclastic flows
Please cite this report as:
Global Volcanism Program, 2015. Report on Pavlof (United States) (Wunderman, R., ed.). Bulletin of the Global Volcanism Network, 40:4. Smithsonian Institution. https://doi.org/10.5479/si.GVP.BGVN201504-312030
Pavlof
United States
55.417°N, 161.894°W; summit elev. 2493 m
All times are local (unless otherwise noted)
This report discusses Pavlof's behavior during May 2014 through 26 December 2014, a time period with two clear eruptive intervals that included lava fountaining, spatter, fragmental (agglutinate-rich, clastogenic) lava flows, lahars, pyroclastic flows, and diverse plumes. On 30 May 2014, an eruption began that continued intermittently through the first week of June. A thermal image taken from a satellite on 24 June 2014 showed warm areas ~5 km down the N flank interpreted as the signature of an earlier, still-warm lava flow. (This flow was perhaps similar to (fountain- and spatter-fed, fragmental, agglutinate-rich, clastogenic) lava flows and possible associated lahars seen during 2013; Waythomas and others, 2014; Wolf and Sumner, 2000.) Another eruption took placed during 12-16 November 2014. Besides the previously mentioned characteristics, common observations during eruptions included strombolian emissions, multiple-kilometer-long zones of incandescent lava, plumes ranging from those dominated by steam and gas to others that were rich in ash. Diagnostics from distant instruments included acoustical signals of eruption received with infrasonics and lightning from inferred ash plumes detected with a lightning detection array.
Background. In BGVN 38:05 we reported on the then most recent eruption at Pavlof, which occurred during May-June 2013. Waythomas and others (2014) summarized Pavlof's eruptive behavior during 2013. This is relevant, in part, because similar ice-spatter interactions also prevailed during 2014. "The 2013 eruption of Pavlof Volcano, Alaska began on13 May and ended 49 days later on 1 July. The eruption was characterized by persistent lava fountaining from a vent just north of the summit, intermittent strombolian explosions, and ash, gas, and aerosol plumes that reached as high as 8 km above sea level and on several occasions extended as much as 500 km downwind of the volcano. During the first several days of the eruption, accumulations of spatter near the vent periodically collapsed to form small pyroclastic avalanches that eroded and melted snow and ice to form lahars on the lower north flank of the volcano. Continued lava fountaining led to the production of clastogenic lava flows that extended to the base of the volcano, about 3–4 km beyond the vent. The generation of fountain-fed lava flows was a dominant process during the 2013 eruption; however, episodic collapse of spatter accumulations and formation of hot spatter-rich granular avalanches was a more efficient process for melting snow and ice and initiating lahars. The lahars and ash plumes generated during the eruption did not pose any serious hazards for the area. However, numerous local airline flights were cancelled or rerouted, and trace amounts of ash fall occurred at all of the local communities surrounding the volcano, including Cold Bay, Nelson Lagoon, Sand Point, and King Cove."
The reports by the AVO also announced Volcano Alert Levels and Aviation Color Codes. The four Alert Levels apply to conditions in vicinity to the volcano (of greatest concern to residents). The Levels consist of Normal, typical background or noneruptive state; Advisory, exhibiting signs of unrest or possible renewed increase; Watch, exhibiting escalating or heightened unrest; and Warning, hazardous eruption is eminent or underway. The respective Color Codes address risks to aircraft from ash plumes. The Codes consist, in increasing order of concern, Green, Yellow, Orange, and Red.
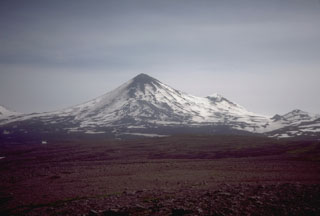
Pavlof is monitored by satellite imagery, observers, several in-situ and remote instruments, and by a Federal Aviation Administration (FAA) web camera. Figure 9 shows Pavlof as seen from the FAA web camera, which resides in Cold Bay. The photo shows conditions on a clear day when the volcano was quiet. The camera produces still images sometimes used to convey the volcano's behavior ('FAA supplementary weather products').
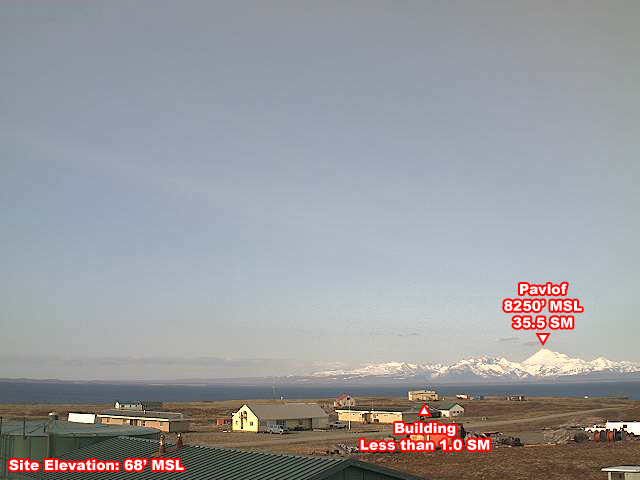 |
Figure 9. A NE view that features snow- and ice-clad Pavlof as seen from the FAA web camera in Cold Bay (Alaska) on a clear day, date unknown. MSL stands for elevation (in this case with respect to MSL, mean sea level, here expressed in feet, 1 foot = 0.305 m). SM stands for statue miles, used to describe the distance from the camera to a building and to Pavlof (~56 km away; 1 SM = 1.61 km). Courtesy of FAA (US Federal Aviation Administration). |
Eruption of 30 May to 4 June 2014. The AVO weekly report issued on 6 June 2014 summarized conditions during the 30 May-4 June eruption period as follows: "Pavlof Volcano is experiencing a typical Strombolian eruption, characterized by lava fountaining, minor explosions, and the accumulation of spatter on the upper north flank of the volcano. Accumulations of spatter have occasionally built up and collapsed, forming hot, ashy, particle-rich flows that generate high-rising steam plumes on the lower north flank of the volcano. As these flows interact with ice and snow on the volcano, they produce meltwater and steam plumes. Spatter-fed lava flows also are likely forming".
According to AVO's 6 June 2014 weekly summary, Pavlof began erupting on 30 May 2014. On the morning of 31 May 2014 elevated surface temperatures were detected at the summit of Pavlof, suggesting a low-level eruption with extruding lava. Campers near the volcano confirmed this detection, and noted lava flows originating from a vent on the NE flank. As those lava flows interacted with glacier ice, low-altitude ash clouds and plumes were created. The plumes were detected in satellite imagery, as well as by pilots and with the Cold Bay FAA web camera.
On the evening of 31 May 2014, small explosion signals were detected by a distant infrasound sensor. The eruption continued, followed by incandescence. The FAA web camera in Cold Bay detected weak incandescence glowing at the summit on the evenings of 31 May and 1 June. Clouds obscured views of the volcano by web camera although no ash clouds were detected in satellite imagery. Weak seismic activity was detected on the Pavlof network of seismometers near the volcano. An increase of seismic tremor occurred 2 June at 1500, decreasing around 2300 that evening (Alaska Standard Time = UTC - 9 hours; during May-June, Daylight Saving Time = UTC - 8 hours). The Aviation Color Code and Alert Levels on 31 May were Orange and Watch respectively.
On 2 June 2014, AVO reported a plume discharged almost continuously from the vent rising to an altitude of 6.7 km and extending over 75 km E, as seen in figure 10. The AVO daily report for this eruption stated "Hazardous conditions exist on the north flank and north side drainages heading on the volcano due to continued pyroclastic and lahar activity. Ash in the vicinity of the volcano remains a hazard to local air traffic" (figure 10).
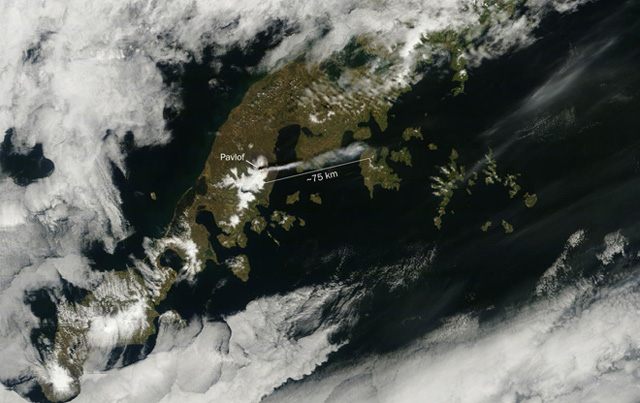 |
Figure 10. Visible image of a Pavlof plume acquired by the MODIS instrument on the Terra satellite on 2 June 2014 (2145 UTC 2 June, which corresponds to local Daylight Saving Time and date of 1345 on 2 June). The plume extended ~75 km E of Pavlof. Courtesy of NASA and AVO/USGS. |
The AVO photo archive for 2 June contained over 40 photos with captions. Some were taken from Cold Bay and others from at sea and aircraft, documenting eruptive activity that day. Chris Waythomas (AVO) noted incandescence associated with lava fountaining and low-level ash and steam plume on images caught by the FAA camera. Several photos by Rachael Kremer were captioned by AVO scientists. The caption of one image (ID #591161 written by Game McGimsey, AVO/USGS) not only described incandescence from lava fountaining at the summit vent, it also stated the presence of "spatter-fed lava flowing down the N flank." Further, "ash and steam clouds rising from lower on the north flank were likely generated by pyroclastic flows intermixing with glacier ice."
AVO daily reports issued on 2 and 3 June 2014 described a vigorous continuing eruption. Late on the 2nd, tremor increased again. During the night included observers noted intense lava fountaining and a spatter fed lava flow down the N flank. By the morning of the 3rd, and ash and steam plumes rose up to 7.3 km altitude. The AVO report issued at 1233 on the 3rd noted a wind shift and wind at the time of that report carrying the main plume SSW. Lower winds (below ~3 km altitude) carried a plume that may have contained trace ash to the WSW.
The AVO report issued at 1754 on the 3rd made these statements: "Although the eruption of Pavlof continues, seismic tremor has deceased over the past 12 hours and has remained relatively steady throughout the day at a much lower level than that of yesterday. Recent satellite data and web camera views of the eruption plume indicate that there are now two distinct parts of the plume. The part of the plume that reaches high above the volcano appears to be mainly steam and gas with minor ash present, extending south of the volcano. Additionally, pyroclastic flow activity on the north flank is producing diffuse ash emissions that result in areas of hazy air, with variable concentrations of ash below [~3 km]. Low-level winds are likely to disperse this ash to the west-southwest with no more than trace amounts accumulating. There are no reports of ash falling in nearby communities." The Aviation Color Code was reduced from Red to Orange and the Alert Level to Watch. Ash remained a hazard to local air traffic.
Similar conditions prevailed on 4 June, with plumes containing minor ash but rich in sulfur dioxide extending 30 to 100 km downwind over Cold Bay. Although incandescence was visible in early morning web cam images, seismicity had remained stable for the past 24 hours. Incandescence from lava fountaining was visible in webcam images on 4 June. According to a news article, flights in and out of Cold Bay and Unalaska were canceled on 4 June, affecting about 200 people. At 0205 and 0245 on 5 June 2014, seismic data indicated two distinct explosions. AVO inferred these represented the collapse of spatter built up around the vent, with a possible explosive component. A similar third, less energetic, event occurred at 0844. The explosions generated lightning, which was detected by the World Wide Lightning Location Network (WWLLN, a collaboration of over 50 universities) (Morton, 2014). AVO inferred that hot debris moved down the N flank, resulting in localized low-level clouds of fine ash. There was no ash above the meteorological clouds whose tops reached 8.8 km in height. As of 6 June 2014, elevated surface temperatures persisted but cited that on this morning they had observed greatly diminished ash and lava emissions. Steam or ash plumes were absent in satellite images since 4 June. A weekly summary issued on 6th noted plumes during the eruption that started on the evening of 30 May 2014 had reached about 9.1 km in altitude. Seismic data indicated lahars occurred intermittently.
Comparative quiet. During 7-23 June 2014, Pavlof was comparatively quiet. Although extreme temperatures associated with fountaining were not seen, a thermal image of Pavlof on 24 June 2014 suggested broad areas of warm temperatures from what AVO interpreted as a recent lava flow (figure 11). According to the scientist who prepared the image, David Schneider, "Composite satellite image of Pavlof Volcano showing the extent of the lava flows on the northeast flank. The base image was collected by the Worldview-2 satellite on May 9, 2014 (prior to the onset of eruptive activity) and is overlain (in color) with a Landsat-8 thermal infrared image collected early in the morning on June 24, 2014. The thermal infrared sensor measured the heat given off by the still-warm lava flow. The length of the longest branch of the lava flow is about 5 km (3 miles). Note that the lava flow appears to have traveled under the ice on the upper flank of the volcano."
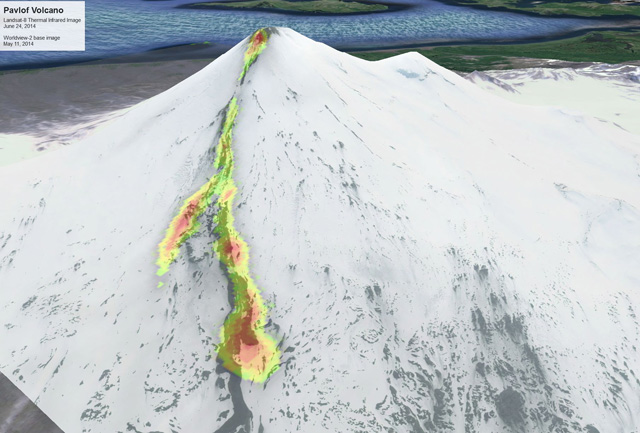 |
Figure 11. A thermal image from Landsat 8, with areas of increased infrared radiation, acquired in the early morning of 24 June 2014 showing the path of lava flows down the slopes. For scale, the longest arm of the flow was about 5 km. The lava flow traveled under the ice in an area of the upper flank. For more details, see text. Courtesy of AVO. Caption details and image preparation by D. Schneider (AVO/USGS). |
An AVO Notification issued on the 25th indicated that AVO had observed no evidence of ash emission from the volcano since early June. Clear web camera and satellite images of the volcano over the past several days showed no evidence of continued lava fountaining. The Aviation Color Code was reduced to Yellow and the Volcano Alert Level was reduced to Advisory. AVO further added that small discrete seismic events continued. They suggested that the signals may have been related to several processes including, (1) degassing of unerupted magma within the volcano's conduit and (2) periodic collapse of ejecta and other debris down the steep flanks of the volcano. The latter, appears consistent with the lava flow seen on figure 11.
On 30 July 2014 the Color Code was lowered to Green and the Volcano Alert Level to Normal. Since mid-June, levels of unrest had gradually declined. Rockfalls and small avalanches of debris still occurred sporadically on the NNW flank of volcano. The next eruptive event did not occur until 12 November.
Eruption of 12-16 November 2014. As previously mentioned, an eruption occurred during 12-16 November 2014. On 12 November 2014, AVO reported a ground observer in Cold Bay sighted ash emissions from Pavlof rising to an altitude of 2.7 km, signifying a new eruption. Minor ash emissions were visible in the Cold Bay web camera beginning around 1650 Alaska Standard Time (AKST) on 12 November. AVO raised the Aviation Color Code and Volcano Alert Level at 1957 on 12 November. Tremor remained elevated on the 12th, 13th, and 14th, with lava fountaining and ash emissions. On 14 November satellite imagery revealed a narrow ash plume extending ~200 km at 4.8 km altitude.
On 15 November 2014, AVO reported the eruption of had intensified. Thus, the Aviation Color Code was raised to Red and the Volcano Alert Level to Warning. Behavior was characterized by explosive eruptions, lava fountaining from a vent just N of the summit, and flows of rock debris and ash descending the N flank of the volcano. Ash emissions were observed from the ground and in satellite images. The intensity of seismic tremor had increased significantly, and satellite data indicated the ash cloud top at 7.6 km altitude extending 200 km NW from the vent. Figure 12 shows a Landsat 8 image captured on the 15th. The top of an ash plume in the image had reached an altitude of ~9 km. Another satellite image taken the same day showed ash plume above cloud cover and extending ~300 km NW from the volcano.
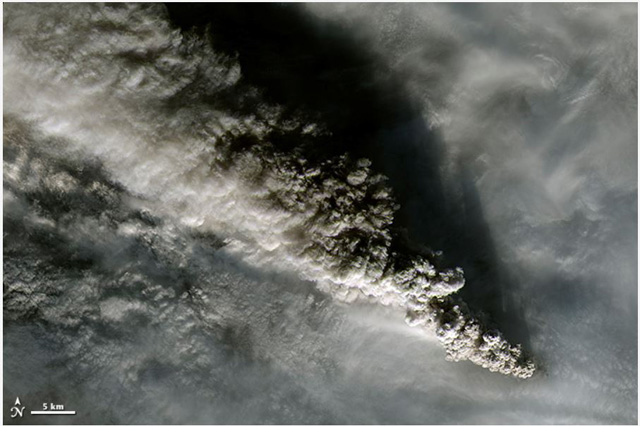 |
Figure 12. On 15 November 2015, Pavlof was lofting ash plumes to an altitude of 9 kilometers as shown in the natural-color image, acquired by the Operational Land Imager (OLI) on the Landsat 8 satellite. Pavlof's volcanic plume rises well above the cloud deck. NASA Earth Observatory image by Jesse Allen, using Landsat 8 data from the U.S. Geological Survey. Original image by David Schneider. |
Although as mentioned above, on 15 November 2014, the ash plume reached more than 9 km, tremor had abruptly decreased at about 1900 that day. This was accompanied by a large decrease in ash emissions, and the next day no evidence of an ash plume at the volcano was reported. On the 16th, the Aviation Color Code decreased to Orange and the Volcano Alert Level to Watch. During 17-18 November seismicity remained low; surface temperatures on the upper NW flank were elevated. The AVO weekly report issued on 21 November 2014 described the week's activity as still remaining low. Intermittent tremor was detected, and satellite images still showed lava flow on the volcano's NW flank. At that stage it reached ~7 km from the summit. On 25 November 2014, AVO further lowered the Aviation Color Code/Volcano Alert Level to Yellow/Advisory, citing continued low seismicity and lack of any observations to suggest ongoing lava fountaining or ash emission. According to the last AVO weekly report issued on 26 December 2014, the status of Pavlof remained unchanged. Seismicity at Pavlof continued slightly above background levels. Weather conditions continued to be cloudy during the week and no activity was observed in satellite or web camera views of the volcano.
References. Demas, A., (3 June) 2014, Volcano Warning Alert Issued for Alaska's Pavlof Volcano, U.S. Geological Survey [accessed August 2014] (URL: http://www.usgs.gov/blogs/features/usgs_top_story/volcano-warning-alert-issued-for-alaskas-pavlof-volcano/ ). [accessed August 2014]
Morton, M, (6 April) 2014, Volcanic Lightning Generated in a Bottle, Earth Magazine (URL: http://www.earthmagazine.org/article/volcanic-lightning-generated-bottle)
Schwaiger, H.F., Denlinger, R.P., and Mastin, L.G., April 2012, Ash3d: A finite-volume, conservative numerical model for ash transport and tephra deposition. Journal of Geophysical Research, v. 117, Issue B4, 20 p.[accessed August 2014] (URL: http://onlinelibrary.wiley.com/doi/10.1029/2011JB008968/pdf).
Schwartz, D., (11 August) 2013, Ash3D is Federal Answer to Ash Cloud Response, Peninsula Clarion [accessed August 2014] (URL: http://peninsulaclarion.com/news/2013-08-10).
Waythomas, C. F., Haney, M. M., Fee, D., Schneider, D. J., and Wech, A., 2014, The 2013 eruption of Pavlof Volcano, Alaska: a spatter eruption at an ice-and snow-clad volcano. Bulletin of Volcanology, 76(10), pp. 1-12.
Wolff, J. A., & Sumner, J. M. (2000). Lava fountains and their products. Encyclopedia of volcanoes, H Sigurdsson, B Houghton, S McNutt, H Rymer, J Stix (Eds.); pp. 321-329.
Geological Summary. The most active volcano of the Aleutian arc, Pavlof is a Holocene stratovolcano that was constructed along a line of vents extending NE from the Emmons Lake caldera. Pavlof and Pavlof Sister to the NE form a dramatic pair of symmetrical, glacier-covered stratovolcanoes that overlook Pavlof and Volcano bays. Little Pavlof is a smaller cone on the SW flank of Pavlof volcano, near the rim of Emmons Lake caldera. Unlike Pavlof Sister, eruptions have frequently been reported from Pavlof, typically Strombolian to Vulcanian explosive eruptions from the summit vents and occasional lava flows. The active vents lie near the summit on the north and east sides. The largest recorded eruption took place in 1911, at the end of a 5-year-long eruptive episode, when a fissure opened on the N flank, ejecting large blocks and issuing lava flows.
Information Contacts: Alaska Volcano Observatory (AVO), a cooperative program of a) U.S. Geological Survey, 4200 University Drive, Anchorage, AK 99508-4667 USA (URL: http://www.avo.alaska.edu/), b) Geophysical Institute, University of Alaska, PO Box 757320,Fairbanks, AK 99775-7320, USA, and c) Alaska Division of Geological & Geophysical Surveys,794 University Ave., Suite 200, Fairbanks, AK 99709, USA (URL: http://www.dggs.alaska.gov/); Christopher Waythomas, Game McGimsey, and Cheryl Cameron, AVO; Rachel Kremer (affiliation unknown); Federal Aviation Administration (FAA), 800 Independence Ave, SW, Washington, DC 20591, USA (URL: http://www.faa.gov/); and National Aeronautics and Space Administration (NASA) (URL: http://modis.gsfc.nasa.gov/).