Report on Monowai (New Zealand) — February 2017
Bulletin of the Global Volcanism Network, vol. 42, no. 2 (February 2017)
Managing Editor: Edward Venzke.
Research and preparation by Robert Andrews.
Monowai (New Zealand) Frequent submarine eruptions through November 2016; discolored water observations
Please cite this report as:
Global Volcanism Program, 2017. Report on Monowai (New Zealand) (Venzke, E., ed.). Bulletin of the Global Volcanism Network, 42:2. Smithsonian Institution. https://doi.org/10.5479/si.GVP.BGVN201702-242050
Monowai
New Zealand
25.887°S, 177.188°W; summit elev. -132 m
All times are local (unless otherwise noted)
Evidence of submarine volcanism at Monowai has been frequently observed since October 1977, when the Royal New Zealand Air Force (RNZAF) noted a plume of discolored water above the seamount. Most subsequent eruptions have been determined based on additional observations of discolored water or the seismic detection of acoustic waves (T waves or T phases) caused by explosive activity. Monitoring reports are provided by New Zealand's GeoNet through their website and other publications. The hydro-acoustic signals are most frequently detected by seismometers in Rarotonga (Cook Islands) or by the Polynesian Seismic Network (Réseau Sismique Polynésien, or RSP) in Tahiti. Research visits over the past 20 years have resulted in many detailed analyses of morphological changes due to volcanism and subsequent collapses.
Some of those results have been reviewed in previous Bulletin reports. This issue will focus on reviewing eruptive episodes after a sector-collapse event on 24 May 2002, which caused anomalous seismic signals originally thought to be explosive in nature. Following the May 2002 event, no activity was detected until T phases were recorded during 1-24 November 2002 (figure 28 and see BGVN 28:02). The next eruptive period began on 10 April 2003 (figure 28 and see BGVN 28:05) and continued until a seismic swarm on 14 August 2004 (BGVN 28:11, 30:07), which included the building of a new cone and ended just prior to a bathymetric survey from the R/V Tangaroa in September 2004. Another sequence of swarms began on 2 March 2005 and continued until 27 June 2006. Although there appear to have been small signals in September 2006, scientists at the Laboratoire de Géophysique, Commissariat à l'Energie Atomique (CEA/DASE/LDG) reported that there were 6 months of quiet after the June 2006 swarms (BGVN 32:01).
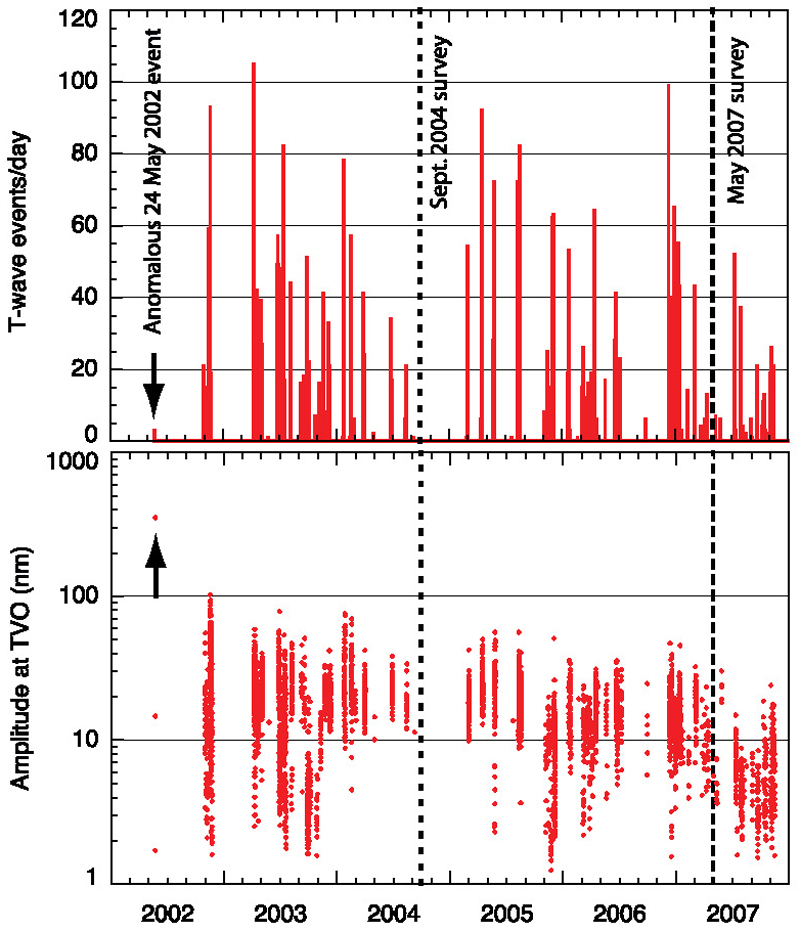 |
Figure 28. Monitoring data from the Polynesian Seismic Network showing T wave swarms at Monowai throughout January 2002-December 2007. The times of the September 2004 and May 2007 bathymetric surveys (dashed vertical lines), and the time of the anomalous 24 May 2002 swarm (arrows) are shown. (top) Number of T wave events per day. (bottom) Amplitudes of T wave events, in nanometers as recorded at station TVO in Tahiti. Note unusually high amplitude of the 24 May 2002 event, interpreted as the sector collapse between the 1998 and 2004 surveys. Modified from Chadwick et al. (2008). |
While the R/V Sonne was on site conducting a bathymetric survey during 1-4 May 2007 (Chadwick et al, 2008), scientists heard booming sounds and saw slicks and bubbles on the surface (BGVN 33:03). That activity was part of an eruptive period that began on 12 December 2006 and continued into at least early November 2007 (figure 29 and see BGVN 32:01). A "big acoustic event" was detected by the Polynesian Seismic Network (Réseau Sismique Polynésien, or RSP) on 8 February 2008 (BGVN 33:03).
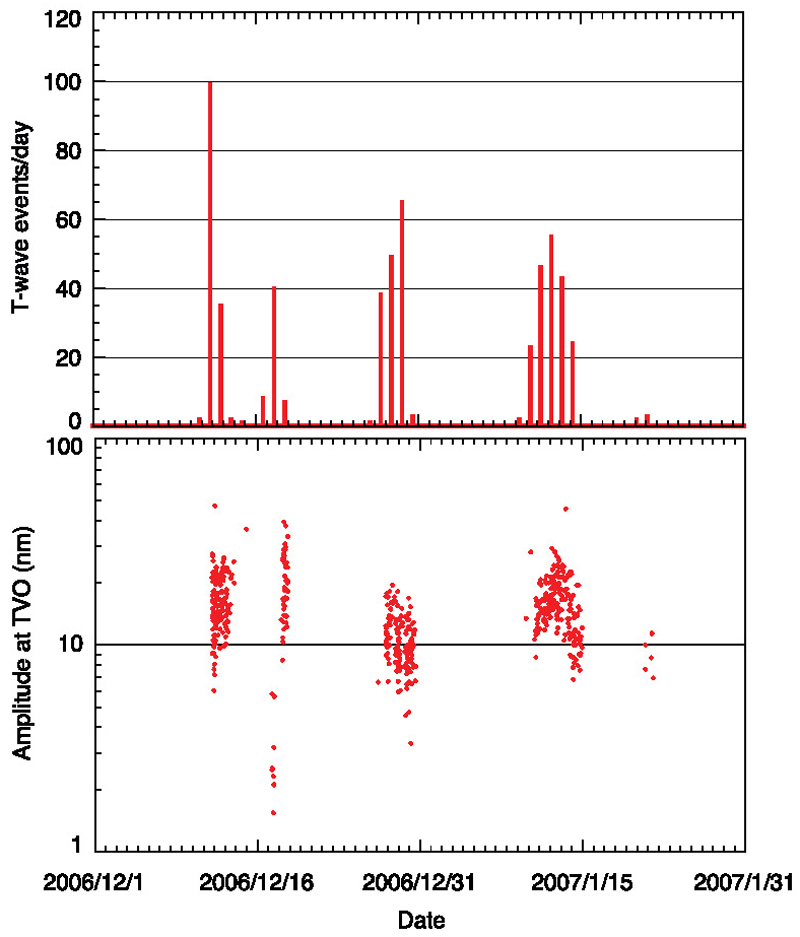 |
Figure 29. Monitoring data from the Polynesian Seismic Network showing the T wave swarms at Monowai in December 2006 and January 2007. (top) Number of events per day, (bottom) amplitude at station TVO in nanometers. Modified from Chadwick et al. (2008). |
A network of 23 ocean-bottom seismometers (OBS) and hydrophones was deployed in July 2007 over the fore-arc just to the E of Monowai at distances of 70-250 km to acquire data about local seismicity associated with subduction (Grevemeyer et al., 2016). The instruments also detected T waves and direct wave signals from the ongoing explosive activity. Analysis by Grevemeyer et al. (2016) showed that between deployment and recovery at the end of January 2008 there had been more than 2,000 events associated with Monowai, clustered into 13-15 major sequences that each lasted between several hours to about two days. Quiet periods between the event sequences varied between 1 and 70 days.
Intermittent activity during 2009 was described in a GeoNet posting from 6 January 2010. Activity was noted in early and mid-May, early July, mid-September (figure 30), late October (figure 31), mid-November, late November to early December, and mid-December 2009 based on seismic data recorded in Rarotonga, Cook Islands. On 27 October the RNZAF overflew the area and confirmed the activity, observing discolored sea water related to suspended sediment and precipitates. Another flight in May 2010 did not show similar activity. A summary of 2010 activity in New Zealand by GeoNet noted continued evidence of small-scale eruptive activity on the Rarotonga seismic record during the year (no dates given), but no activity was confirmed by surface observations.
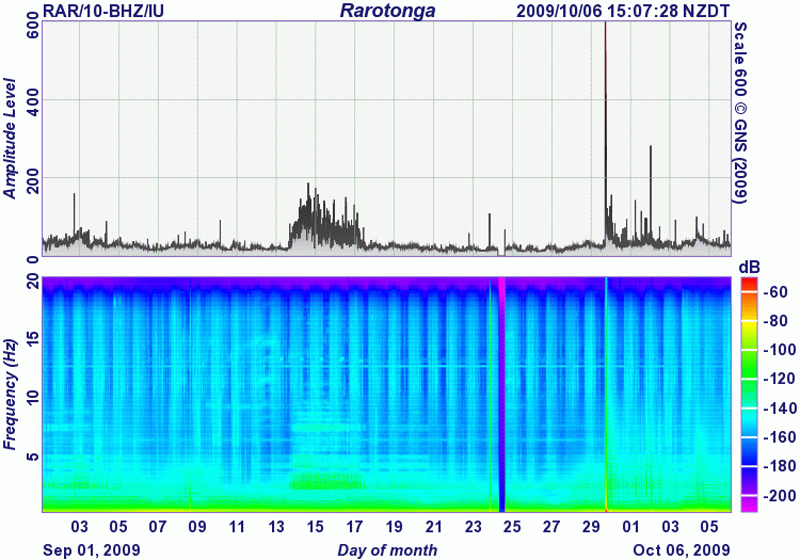 |
Figure 30. Seismic data from Rarotonga showing an eruption at Monowai during 13-17 September 2009. Courtesy of GNS. |
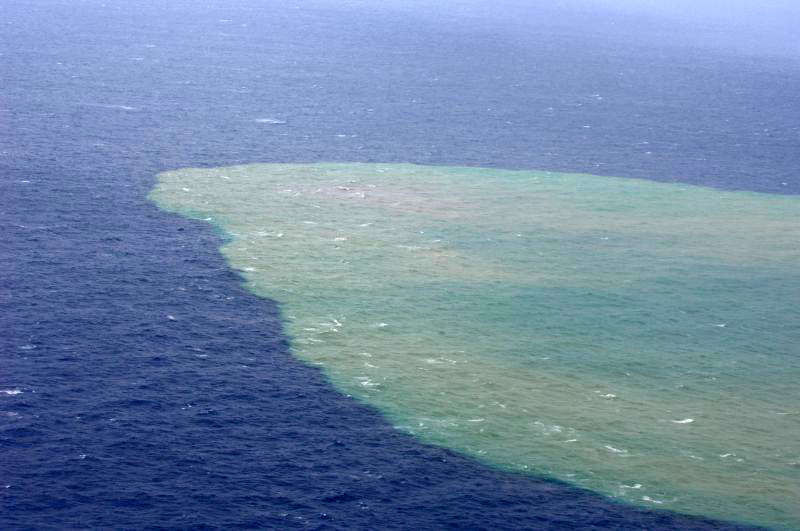 |
Figure 31. Aerial photo of discolored water near Monowai on 27 October 2009. Photo taken by Royal New Zealand Air Force, courtesy of GeoNet. |
[Discolored water with gas bubbles and a sulfurous odor was observed during a planned swath mapping visit by the R/V Sonne on 14 May 2011 (Peirce and Watts, 2011).] According to Metz et al. (2016), explosive eruptions took place over [17-22 May] as detected by T phase waves recorded at broadband seismic stations on Rarotonga (Cook Islands), Papeete (Tahiti), and the Marquesas Islands. Signals were also received at an International Monitoring System hydrophone array (maintained by the Comprehensive Nuclear-Test-Ban Treaty Organization) near Ascension Island, ~15,800 km from the seamount in the equatorial South Atlantic Ocean. A second round of mapping by R/V Sonne on the return transit was accomplished on 1-2 June, [following the explosive activity]. Watts et al. (2012) showed that there had been a depth change to the summit of 18.8 m between two surveys (BGVN 37:06), which was attributed to the growth of a cone or lava spine during the intervening eruption. There was an additional visual confirmation of activity in August 2011, and GeoNet stated that activity was continuing in September. The 2011 volcanic summary by GeoNet again noted undated evidence of small-scale activity seen in the Rarotonga seismic data.
Seismicity during 1-4 June 2012 indicated another period of significant activity, which was confirmed by discolored seawater in the area observed from an RNZAF flight on 3 June. Seismographs in Rarotonga recorded eruptive activity during 3-19 August 2012 (figure 32). A posting from GeoNet on 2 October noted that Monowai had "not been active recently."
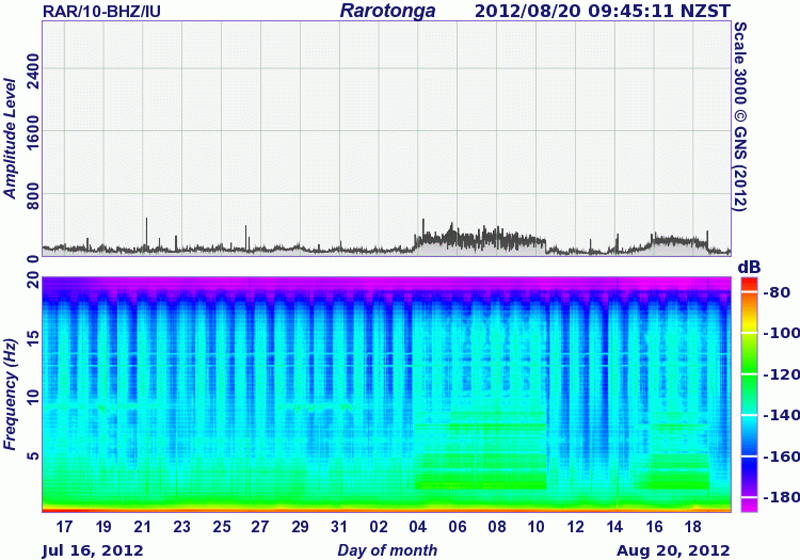 |
Figure 32. Seismic data from Rarotonga showing an eruption at Monowai during 3-19 August 2012. Courtesy of GNS. |
There were no GeoNet reports of activity during 2013. However, the R/V Sonne was planning to add to the time series of maps of Monowai while making a final transit to Auckland (Werner et al., 2013). While they were approaching the seamount on 1 January 2014, with a summit estimated to be ~60 m below the surface based on 2011 bathymetry data, scientists noticed a light yellowish water discoloration and a faint rumble. The cruise report further noted that during profiling close to the summit a "sudden and significant increase in volcanic activity with explosive hydroclastic eruptions was accompanied by thunder and shock waves rapidly spreading out on the water surface." Pumice was also collected in the vicinity, but the source volcano was not known.
In a GeoNet volcanic activity update on 10 November 2014, Brad Scott observed that there had been eruptions detected during approximately 16-22 and 23-27 October, and 1-5 November (figure 33) based on T phase waves measured at Rarotonga, but the activity appeared to be weaker than that seen in 2009 and 2012. Confirming these observations was material seen floating on the ocean surface over the seamount by a RNZAF airplane on 31 October 2014 (figure 34). GeoNet noted that volcanic activity regularly occurs about 3-10 days a month; the yearly summary said the seamount erupted often in 2014.
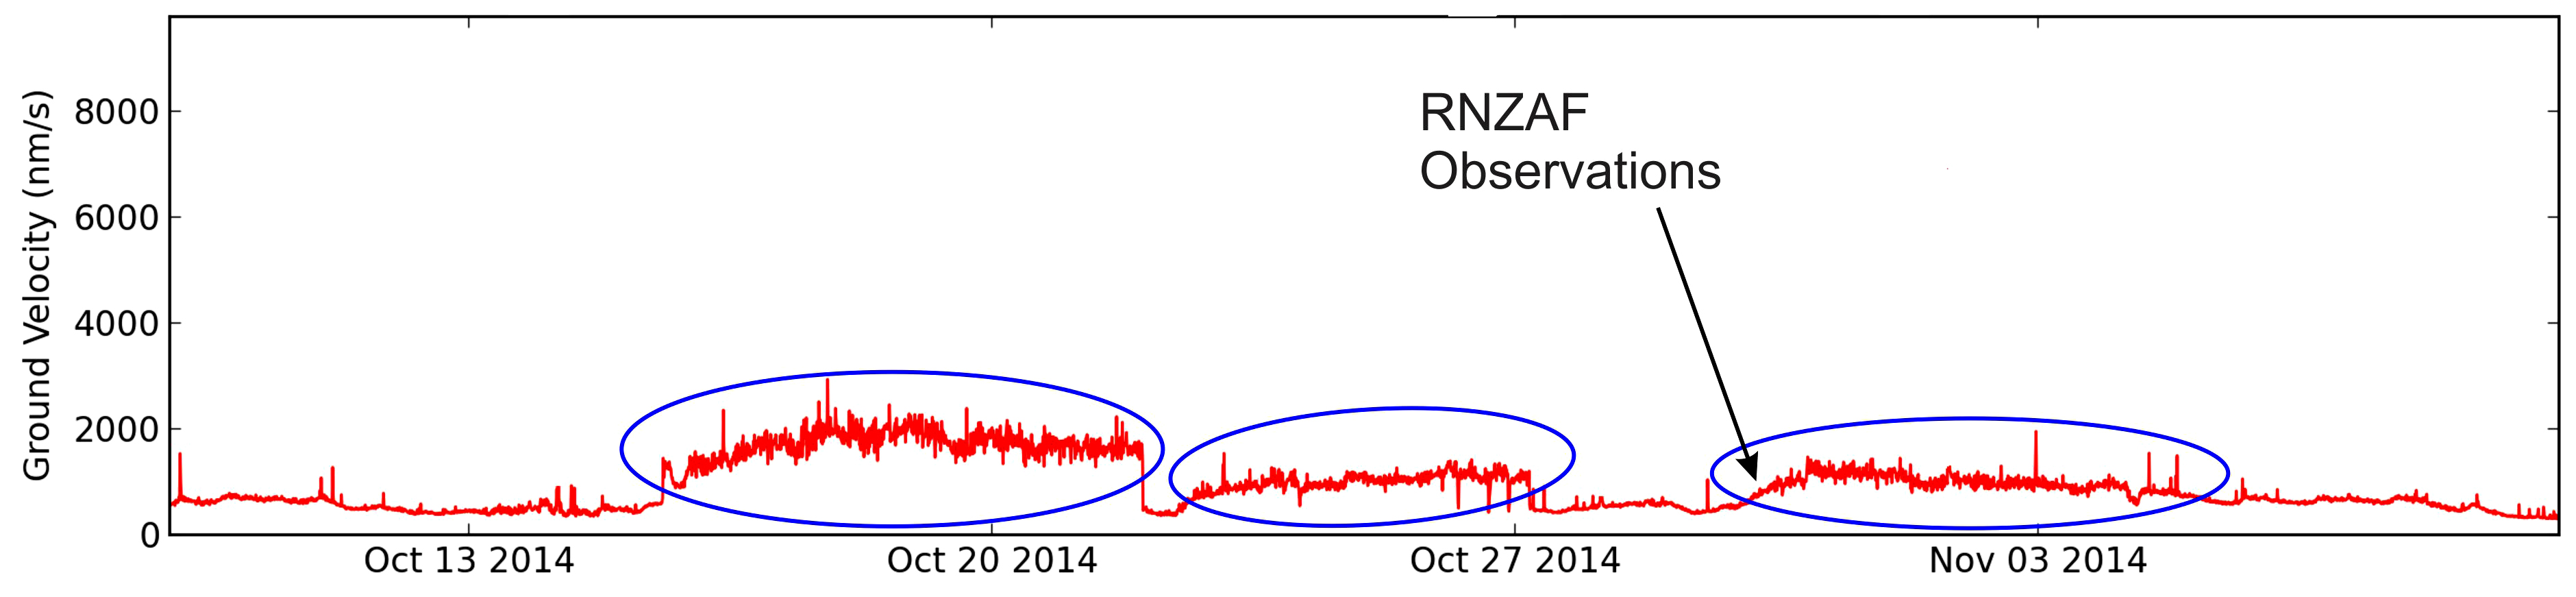 |
Figure 33. Eruptive activity at Monowai during October-November 2014 identified on a seismic amplitude plot recorded from the Rarotonga T phase seismic monitoring site. Courtesy of GeoNet. |
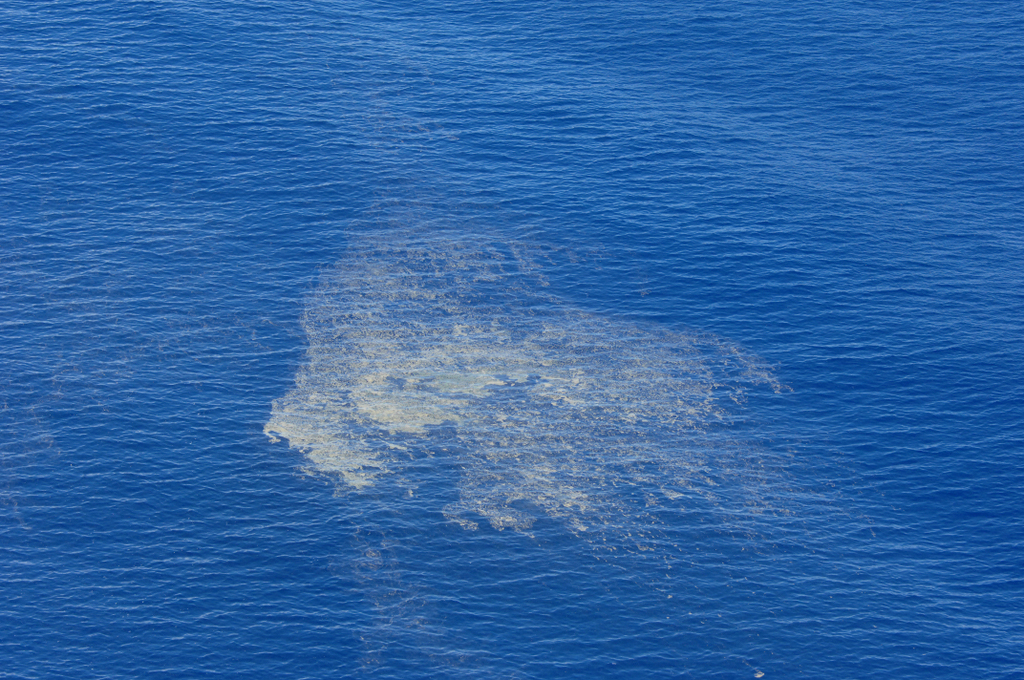 |
Figure 34. Aerial view from a RNZAF airplane of the ocean over Monowai showing floating debris (pumice) on 31 October 2014. Courtesy of GeoNet. |
There were no reports of activity during 2015, but a plume of discolored water was once again seen by the RNZAF on 19 May 2016. According to a 16 November 2016 GeoNet update by Brad Scott, activity was recorded for about 24 hours over 11-12 November. The report noted that this type of activity is seen a few days every month.
References: Chadwick, W.W., Jr., Wright, I.C., Schwarz-Schampera, U., Hyvernaud O., Reymond, D., and de Ronde, C.E.J., 2008, Cyclic eruptions and sector collapses at Monowai submarine volcano, Kermadec arc: 1998-2007, GeochemistryGeophysicsGeosystemsG3, v. 9, p. 1-17 (DOI: 10.1029/2008GC002113).
Grevemeyer, I., Metz, D., and Watts, A., 2016, Submarine explosive activity and ocean noise generation at Monowai Volcano, Kermadec Arc: constraints from hydroacoustic T-waves: EGU General Assembly 2016.
Peirce C, Watts A, 2011, R/V Sonne SO 215 - Cruise Report, The Louisville Ridge - Tonga Trench collision: Implications for subduction zone dynamics: Durham, Department of Earth Sciences, Durham University.
Metz, D., Watts, A.B., Grevemeyer, I., Rodgers, M., and Paulatto, M., 2016 (22 February), Ultra-long-range hydroacoustic observations of submarine volcanic activity at Monowai, Kermadec Arc, Geophysical Research Letters, v. 43, no. 4, p. 1529-1536.
Watts, A.B., Peirce, C., Grevemeyer, I., Paulatto, M., Stratford, W., Bassett, D., Hunter, J.A., Kalnins, L.M., and de Ronde, C.E.J., 2012 (13 May), Rapid rates of growth and collapse of Monowai submarine volcano in the Kermadec Arc, Nature Geoscience, v. 5, p. 510-515 (DOI: 10.1038/ngeo1473).
Werner, R., D. Nürnberg, and F. Hauff, 2013, RV SONNE — Cruise report SO 225, Helmholtz-Zentrum fur Ozeanforschung Kiel (GEOMAR) (DOI: 10.3289/GEOMAR_REP_NS_5_2012).
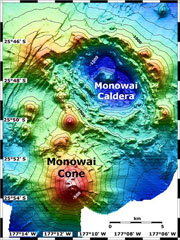
Geological Summary. Monowai, also known as Orion seamount, is a basaltic stratovolcano that rises from a depth of about 1,500 to within 100 m of the ocean surface about halfway between the Kermadec and Tonga island groups, at the southern end of the Tonga Ridge. Small cones occur on the N and W flanks, and an 8.5 x 11 km submarine caldera with a depth of more than 1,500 m lies to the NNE. Numerous eruptions have been identified using submarine acoustic signals since it was first recognized as a volcano in 1977. A shoal that had been reported in 1944 may have been a pumice raft or water disturbance due to degassing. Surface observations have included water discoloration, vigorous gas bubbling, and areas of upwelling water, sometimes accompanied by rumbling noises. It was named for one of the New Zealand Navy bathymetric survey ships that documented its morphology.
Information Contacts: New Zealand GeoNet Project, a collaboration between the Earthquake Commission and GNS Science, Wairakei Research Centre, Private Bag 2000, Taupo 3352, New Zealand (URL: http://www.geonet.org.nz/).