Report on Sabancaya (Peru) — May 2017
Bulletin of the Global Volcanism Network, vol. 42, no. 5 (May 2017)
Managing Editor: Edward Venzke.
Edited by A. Elizabeth Crafford.
Sabancaya (Peru) Eruption with continuing ash plumes began on 6 November 2016
Please cite this report as:
Global Volcanism Program, 2017. Report on Sabancaya (Peru) (Crafford, A.E., and Venzke, E., eds.). Bulletin of the Global Volcanism Network, 42:5. Smithsonian Institution. https://doi.org/10.5479/si.GVP.BGVN201705-354006
Sabancaya
Peru
15.787°S, 71.857°W; summit elev. 5960 m
All times are local (unless otherwise noted)
Although historical records of eruptive activity at Peru's Sabancaya volcano go back to 1750, there have only been a handful documented since the 1980s; activity that began in 1986 was the first recorded in over 200 years. During the last period of substantial ash eruptions between 1990 and 1998 ashfall deposits up to 4 cm thick were reported 8 km E of the volcano. Evidence for minor ash-emitting events was reported in 2000 and 2003. Intermittent seismic unrest and fumarolic emissions characterized activity from late 2012 through 2015. Seismically detected explosions during August 2014 led to releases of SO2 gases and steam plumes, some as high as 2 km, along with possible minor volcanic ash. Possible minor volcanic ash emissions were also mentioned by Peruvian authorities and pilot reports between September and December 2014 but there were no confirmed reports of ash emissions during this period. A crater inspection during 9-10 July 2015 found trace amounts of ash at the crater that contained crystals of plagioclase, biotite, and amphibole, along with fresh volcanic glass. These were interpreted by the volcanologists to represent minor ash emissions during recent weeks.
Unrest with steam plumes and variable seismicity continued during 2016 until 6 November when continuous ash-bearing explosions began. Activity during 2016 through February 2017 is covered in this report with information from the two Peruvian observatories that monitor the volcano: Instituto Geofisico del Peru - Observatoria Vulcanologico del Sur (IGP-OVS), and Observatorio Volcanologico del INGEMMET (Instituto Geológical Minero y Metalúrgico) (OVI-INGEMMET). Aviation reports and notices come from the Buenos Aires Volcanic Ash Advisory Center (VAAC), and satellite data is reported from several sources.
Sabancaya maintained a level of seismic and fumarolic unrest through most of 2016, similar to levels recorded in 2014 and 2015, with almost constant water-vapor and SO2 plumes rising from the crater. Additionally, tectonic (not volcanic) seismicity caused damage and fatalities in nearby villages. An explosion on 27 August 2016 did not produce ash, but new areas of fumarolic activity on the N flank were observed around this time. Hybrid seismic events related to the movement of magma, and SO2 emissions, increased noticeably during September and October 2016. An explosive eruption with numerous ash plumes began on 6 November 2016. Continuous ash emissions with plume heights exceeding 10 km altitude were recorded several times through February 2017. Thermal anomalies were first measured in satellite data in early November, along with numerous significant SO2 plumes.
Activity during January-October 2016. Heights of plumes consisting of water vapor and minor magmatic gases generally decreased during January 2016, from 1,800 m to less than 1,200 m by the month's end. Seismic activity was generally low in terms of both numbers of events and magnitude. The daily number of events ranged from 8 to 20, and the largest event, a M 4.0, was registered on 29 January.
Plume heights continued declining in February, from 1,000 m during the first week to 400-800 m by the end of the month. During March, April, and May the heights of steam and SO2 plumes ranged from 200 to 1,300 m above the crater, and values of SO2 flux ranged from 600 to 1,500 metric tons per day (t/d). These values increased only slightly in July and August; plumes rose 2,000 m above the crater rim and SO2 emissions were as high as 2,600 t/d.
Seismicity continued at low levels through late August. Three significant tectonic earthquakes in mid-August were not related to volcanic activity, but the earthquake 25 km NE of Sabancaya on the Ichupampa fault on 14 August caused at least four fatalities, and numerous aftershocks were recorded in the region. A spike in SO2 emissions at the volcano to 4,030 t/d occurred shortly after the earthquake.
On 27 August 2016 there was a hybrid-type seismic event that IGP-OVS interpreted as an explosion of 72 MJ (Megajoules) of energy. An official statement from the Scientific and Technical Committee for Risk Management (IGP-OVS, OVI-INGEMMET, and others) issued on 6 September noted that "dense gray gases reached 1,000 m above the crater and drifted E." However, no VAAC reports were issued, and ash was not mentioned in the OVI INGEMMET weekly report.
During the last two weeks of August, two large zones of new fumarolic activity were detected in satellite imagery. OVI visited the site on 25 August, and IGP-OVS visited on 1 September 2016. The scientists observed areas of increased fumarolic emissions outside of the crater on the NE and NW flanks of the volcano (figure 19). The first zone was located on the NW flank and extended from the vicinity of the crater down to 5,700 m elevation, while the second area was located on the NE flank at about 5,600 m. Both areas follow a NW-SE trend. The flux of SO2 increased to values greater than 4,000 t/d at the end of August.
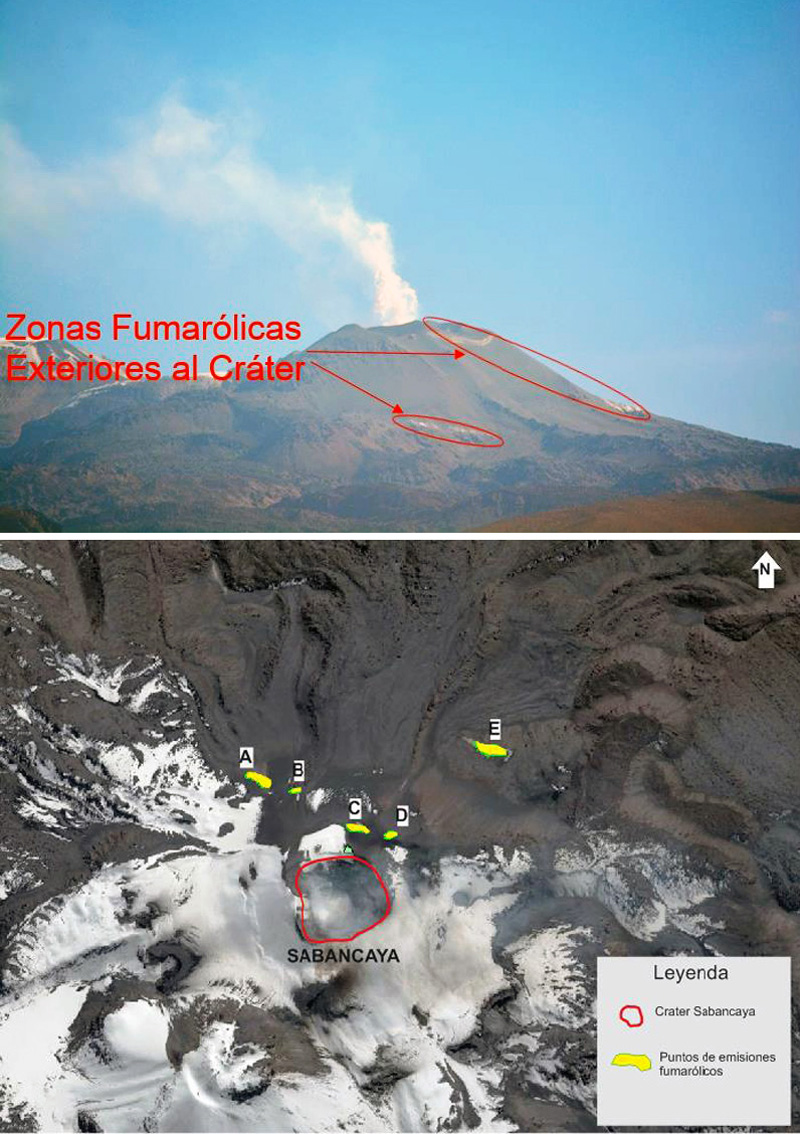 |
Figure 19. New areas of fumarolic activity at Sabancaya, August 2016. Top: Two large fumarolic areas photographed on 1 September 2016 that appeared on the flanks during late August. The main zone was located on the NW flank and extended from the vicinity of the crater down to 5,700 m elevation, while the second area was located on the NE flank at about 5,600 m. Courtesy of IGP-OVS (Sabancaya Report 27, 1 September 2016) Bottom: Google Earth image showing location of fumarolic fields. A, B, C, and D are part of the NW flank field and E is the NE flank field. Courtesy of OVI-INGEMMET (Special Report, 1 September 2016). |
OVI-INGEMMET reported an increase in the total number of seismic events during September 2016, especially hybrid-type events, along with generally lower plume heights, but increased emissions of SO2. IGP-OVS noted a swarm of hybrid-type seismic events on 27 September distinct from the distal tectonic-related events of the previous month, and indicative of an increase in volcanic activity. IGP-OVS returned to Sabancaya on 28 September 2016 to gather temperature measurements at the new fumarole areas. A NW-SE trending belt on the NE side of the volcano had temperature readings between 71° and 91°C.
At the beginning of October, water vapor and SO2 gas plumes rose as high as 2,000 m above the crater, and the SO2 flux was over 3,000 t/d. Volcanic seismicity increased from 220 earthquakes per day during the first week to 470 during the second week. SO2 emissions continued to increase and by 22 October were at 7,173 t/d.
From 9 January through 3 November 2016 the Buenos Aires VAAC issued 52 reports with pilot observations of ash. The VAAC was unable to confirm the presence of ash in emissions and instead described only water vapor or magmatic gases recorded via the web camera. There were no MODIS thermal anomalies shown by the MODVOLC or MIROVA systems from January 2014 through October 2016.
Activity during November 2016-February 2017. OVI-INGEMMET reported an eruption beginning at 2040 local time on 6 November 2016 (0140 on 7 November UTC) that started with an explosion and was followed by the continuous emission of low volume ash that rose up to 1,500 m above the crater rim (about 7,500 m altitude) (figure 20).
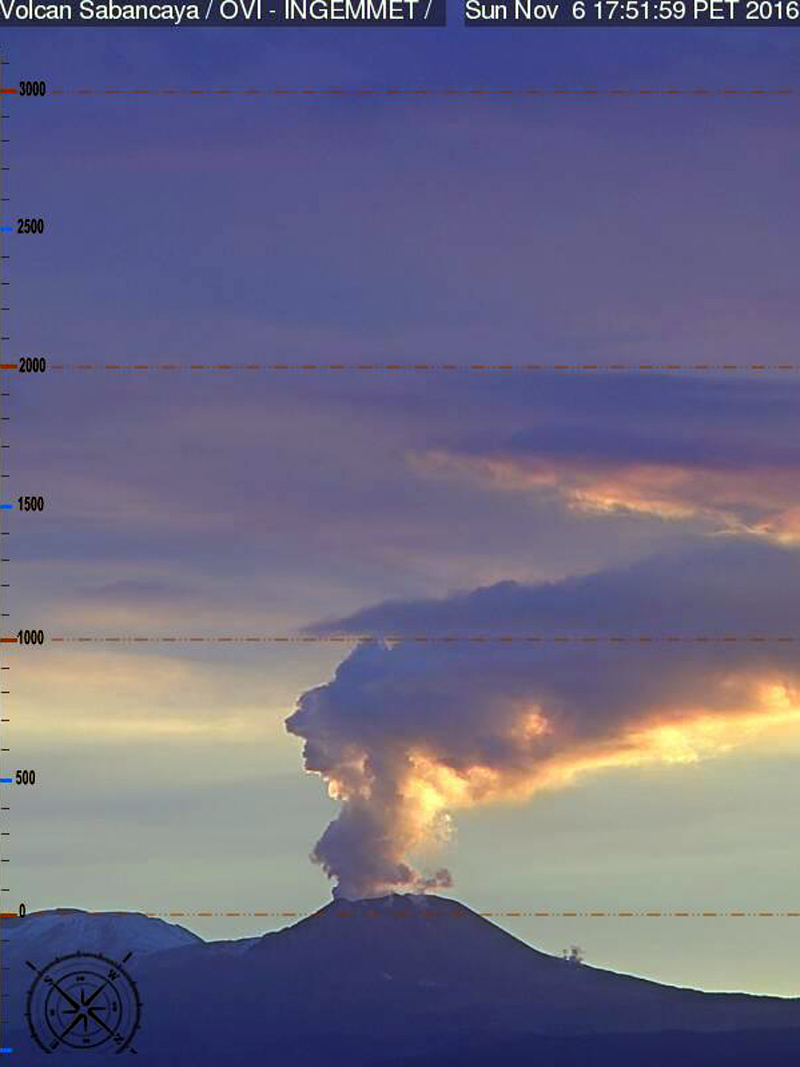 |
Figure 20. The beginning of the eruption at Sabancaya, in the province of Caylloma in Arequipa, on 6 November 2016. Courtesy OVI-INGEMMET (Sabancaya 2016 Weekly Report 45). |
Several types of volcanic-related seismic events continued to increase in number and intensity during November and December. The eruption exhibited an average of 39 daily explosive events with ash plumes (figures 21, 22, and 23) between 7 November and 15 December. There were 63 explosions on 30 November, and between 5 and 11 December there were 328 explosions.
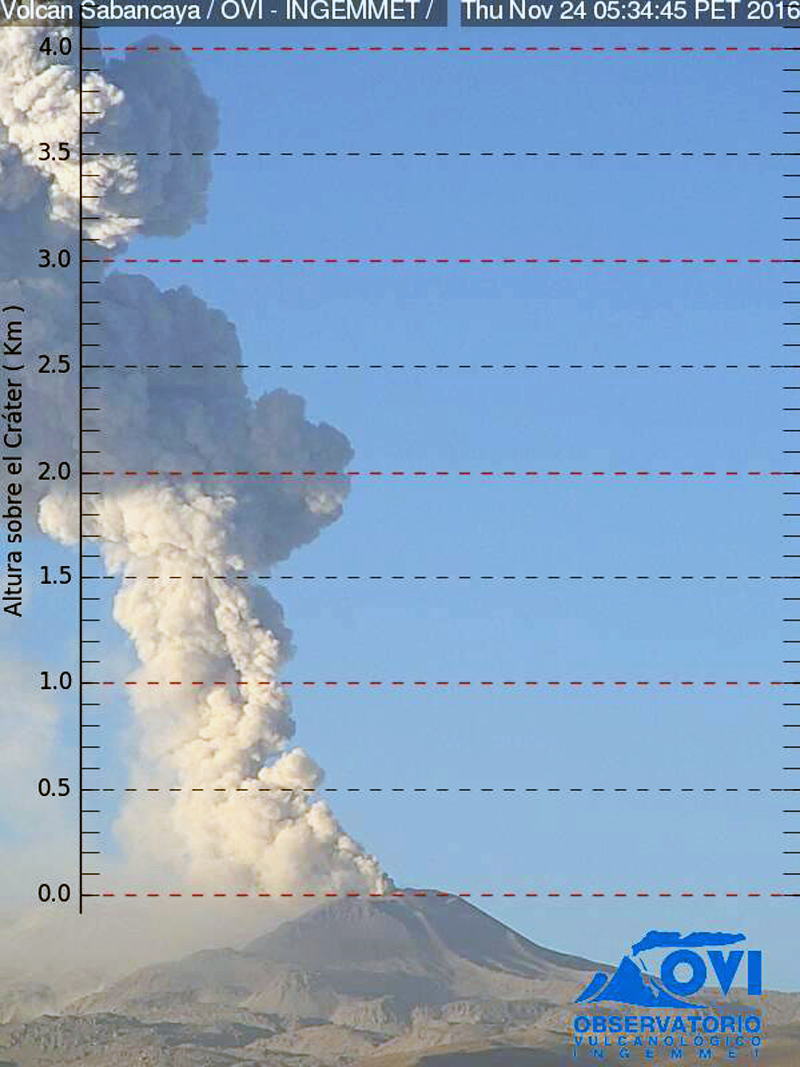 |
Figure 21. Ash plume rising over 4,000 m above the summit (5, 967 m elevation) at Sabancaya, 24 November 2016. Courtesy OVI-OVS (2016 Sabancaya Joint OVI-OVS Weekly Report 2, 21-27 November). |
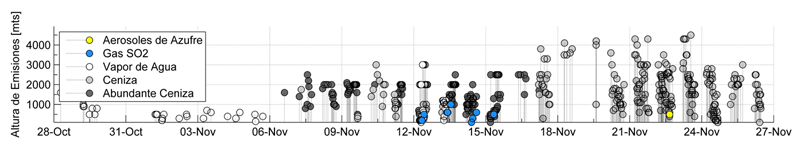 |
Figure 22. Plume heights and compositions at Sabancaya from 28 October through 27 November 2016. Ash emissions began on 6 November, and continued to increase in density and plume height throughout the month. White circles represent water vapor, light gray are ash, dark gray are abundant ash, blue are SO2 gas, and yellow are sulfur aerosols. Courtesy OVI-OVS (2016 Sabancaya Joint OVI-OVS Weekly Report 2, 21-27 November). |
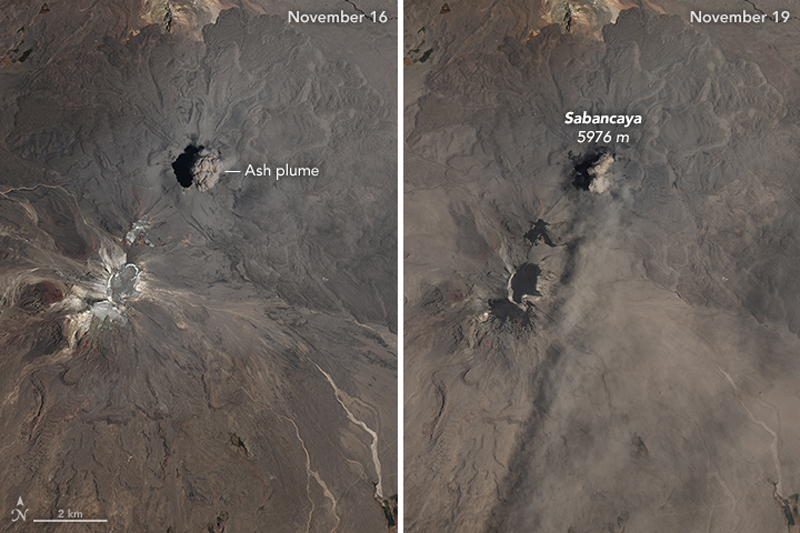 |
Figure 23. NASA Earth Observatory images of ash plumes from Sabancaya on 16 and 19 November 2016. The bright area to the SW in the 16 November image is snow near the peak of Mount Ampato, which is covered with ash in the 19 November image. The 16 November image was acquired by a multispectral imager on the European Space Agency's Sentinel 2 spacecraft. The Operational Land Imager (OLI) on Landsat 8 captured the November 19 image. Courtesy of NASA Earth Observatory. |
Ash emissions were continuous from the beginning of the eruption through mid-December, with heights up to 4.5 km (10.5 km altitude) above the crater, according to the Scientific-Technical Committee of government scientists monitoring the eruption. Ashfall several millimeters thick was recorded in areas as far as 40 km away. During the first weeks of the eruption ash fell mainly to the E and NE on the villages of Maca, Achoma, Yanque and Chivay (18-30 km NE). Later in December, ashfall was reported W and NW in the villages of Huambo (28 km W), Cabanaconde (22 km NW), and Pinchollo (18 km N). On 26 December, ashfall was again reported in the villages of Cabanaconde, Pinchollo, and Tapay (25 km NW) to the NW and N, and Lari and Madrigal (20 km NE), Maca, and areas of Achoma to the NE. The seismic energy released from tremors and explosive events continued to increase throughout November into December (figures 24 and 25).
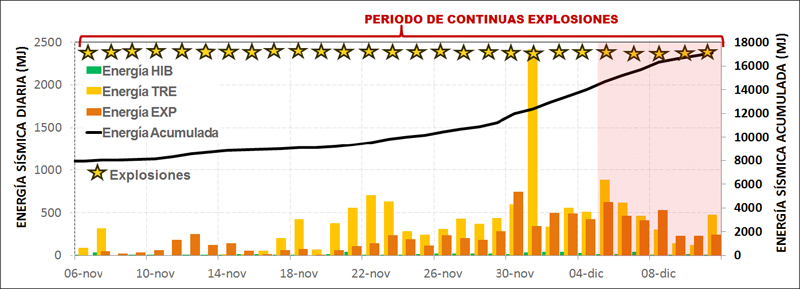 |
Figure 24. Seismic energy and types of seismic events at Sabancaya, 6 November-8 December 2016. HIB are hybrid-type seismic events, TRE are tremors, EXP are explosions. Black line represents cumulative energy in Megajoules (MJ). Y axis is daily seismic energy on the left and cumulative energy on the right. Stars represent the period of continuous explosions. Courtesy of OVI-OVS (2016 Sabancaya Joint OVI-OVS Weekly Report 4, 5-11 December). |
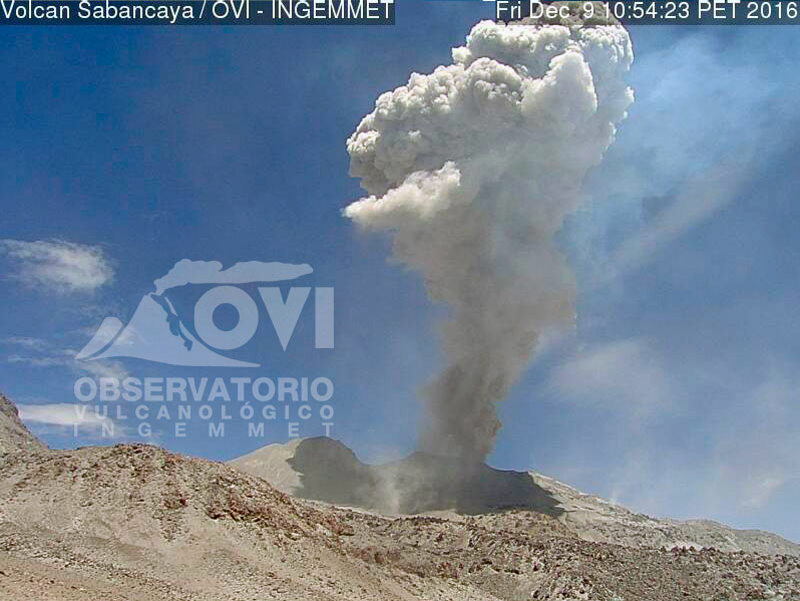 |
Figure 25. Web camera image of ash-and-steam plume at Sabancaya, 9 December 2016. Courtesy of OVI-OVS (2016 Sabancaya Joint OVI-OVS Weekly Report 4, 5-11 December). |
Beginning on 21 December there was a notable increase in seismicity (mainly of hybrid events), in the number (up to 52 per day) and height of plumes, and ash emissions. These changes led the Scientific-Technical Committee to raise the Volcanic Warning Level from Yellow to Orange (2 to 3 on a 4-level scale) on 28 December, warning people to remain more than 12 km from the crater (figures 26 and 27). A small lahar affected the area of Pinchollo (18 km N) on 3 January 2017.
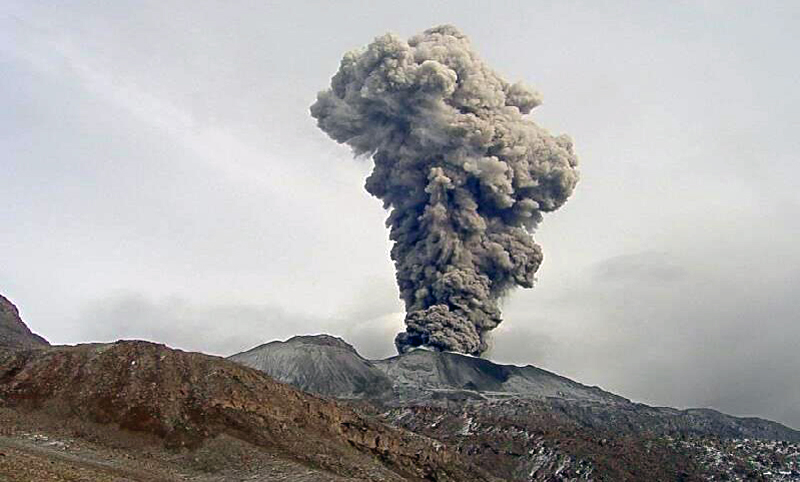 |
Figure 26. Dense ash cloud at Sabancaya, 26 December 2016. Increasing intensity of seismicity and number of explosions led to an increase in the Volcano Warning Level on 28 December. Courtesy of OVI-OVS (Informe Especial No. 01-2017). |
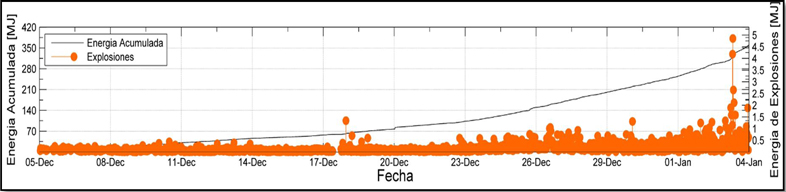 |
Figure 27. Seismic energy released by Sabancaya between 5 December 2016 and 4 January 2017. Note increasing energy of the explosions in early January. Courtesy of OVI-OVS (Informe Especial No. 01-2017). |
Seismicity remained high during January with long-period (LP), tremor, and hybrid-type events all continuing, and an average of 70-76 daily explosions. During the second week in January explosions peaked at an average of 84 per day. This number decreased during early February to around 20 per day but then rose back to over 40 by the end of the month. A significant number of hybrid seismic events occurred during the last week of February.
Gas-and-ash plumes rose to 4.5 km above the crater in early January, dropping back to 2-3 km for the rest of the month, before rising again to 3-4 km (9-10 km altitude) during February. In their Special Report in January 2017, the joint Scientific-Technical committee presented a map showing that ash dispersal had affected communities in nearly every direction 40 km from the summit (figure 28).
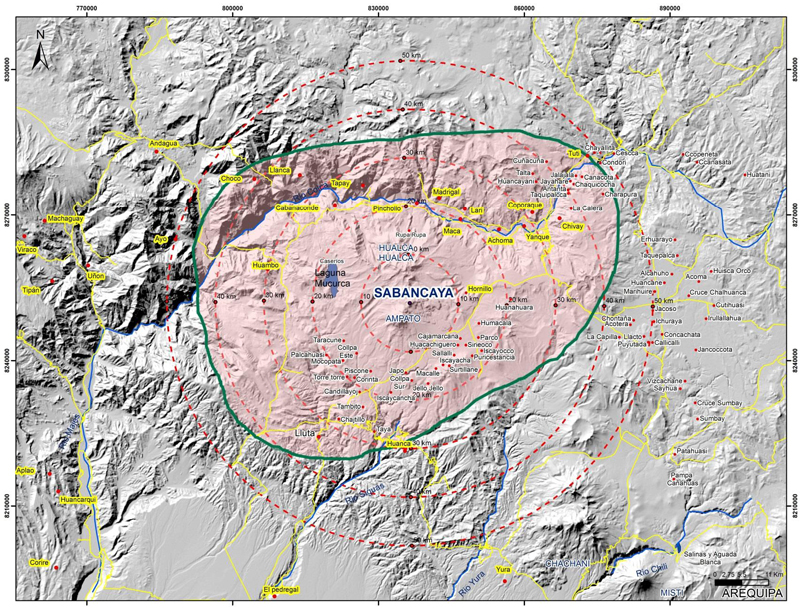 |
Figure 28. Area affected by ashfall (in pink) from Sabancaya as of mid-January 2017. Courtesy of OVI-OVS (Informe Especial No. 01-2017). |
Buenos Aires VAAC Reports, November 2016-February 2017. The Buenos Aires VAAC first noted minor amounts of volcanic ash in emissions visible from the volcano webcam on 7 November 2016 (UTC). Ash was not identified in satellite imagery until midday 8 November when it was reported at 7.6 km altitude (about 1.7 km above the summit). Observations of continuous emissions of steam and ash were reported daily, when not obscured by weather, from then through the end of February 2017. Plume heights were commonly 7.6-8.2 km altitude, about 1.7-2.3 km above the summit. Higher plumes were also recorded a number of times during this period, including 10.3 km altitude on 17 and 23 November. The plume was clearly visible in satellite imagery on 24 November, drifting SE at 10.9 km. Plumes on 3 December rose 10 km and drifted SW; they were partially hidden by weather clouds. Pulses of volcanic ash drifting over 35 km SE at 10.6 km altitude were visible on 11 and 12 December. For most of January 2017 the plumes were obscured by weather clouds, but were visible on 6 January at 9.1 km altitude. Higher plumes were more often recorded in February; they rose continuously over 10 km from 4 to 7 February. The highest plume during the period was on 26 February, at 11.9 km, drifting SW.
Thermal anomalies in satellite data. The MIROVA thermal anomaly plot of MODIS data provided independent satellite confirmation of the beginning of the eruption. The first thermal anomaly appeared on 2 November 2016, and values increased in frequency and intensity in the subsequent weeks. Energy values reached moderate levels in early February 2017 (figure 29). The first MODVOLC thermal alert pixel for Sabancaya appeared on 6 January 2017. There were seven MODVOLC alert pixels in January and six in February, suggesting a persistent source of heat during this time.
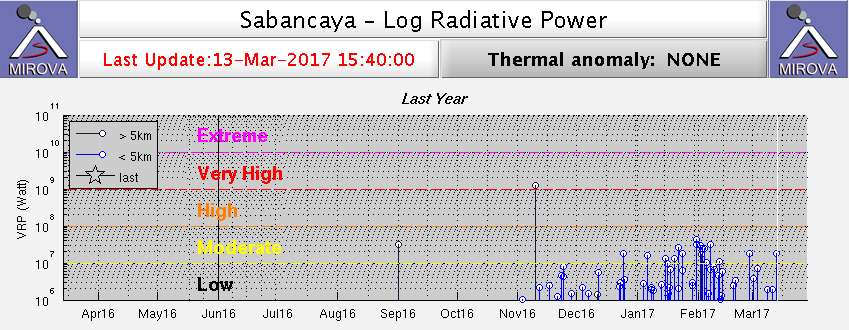 |
Figure 29. Log Radiative Power values for Sabancaya between 13 March 2016 and 13 March 2017. The first MIROVA-identified thermal anomaly was on 2 November 2016, and values increased in frequency and intensity after that. Courtesy of MIROVA. |
Sulfur dioxide data. Sulfur dioxide plumes from Sabancaya were captured numerous times by the OMI satellite instrument from NASA's Global Sulfur Dioxide Monitoring system between November 2016 and February 2017. They revealed significant SO2 plumes travelling in all directions away from the summit for distances up to 200 km (figure 30).
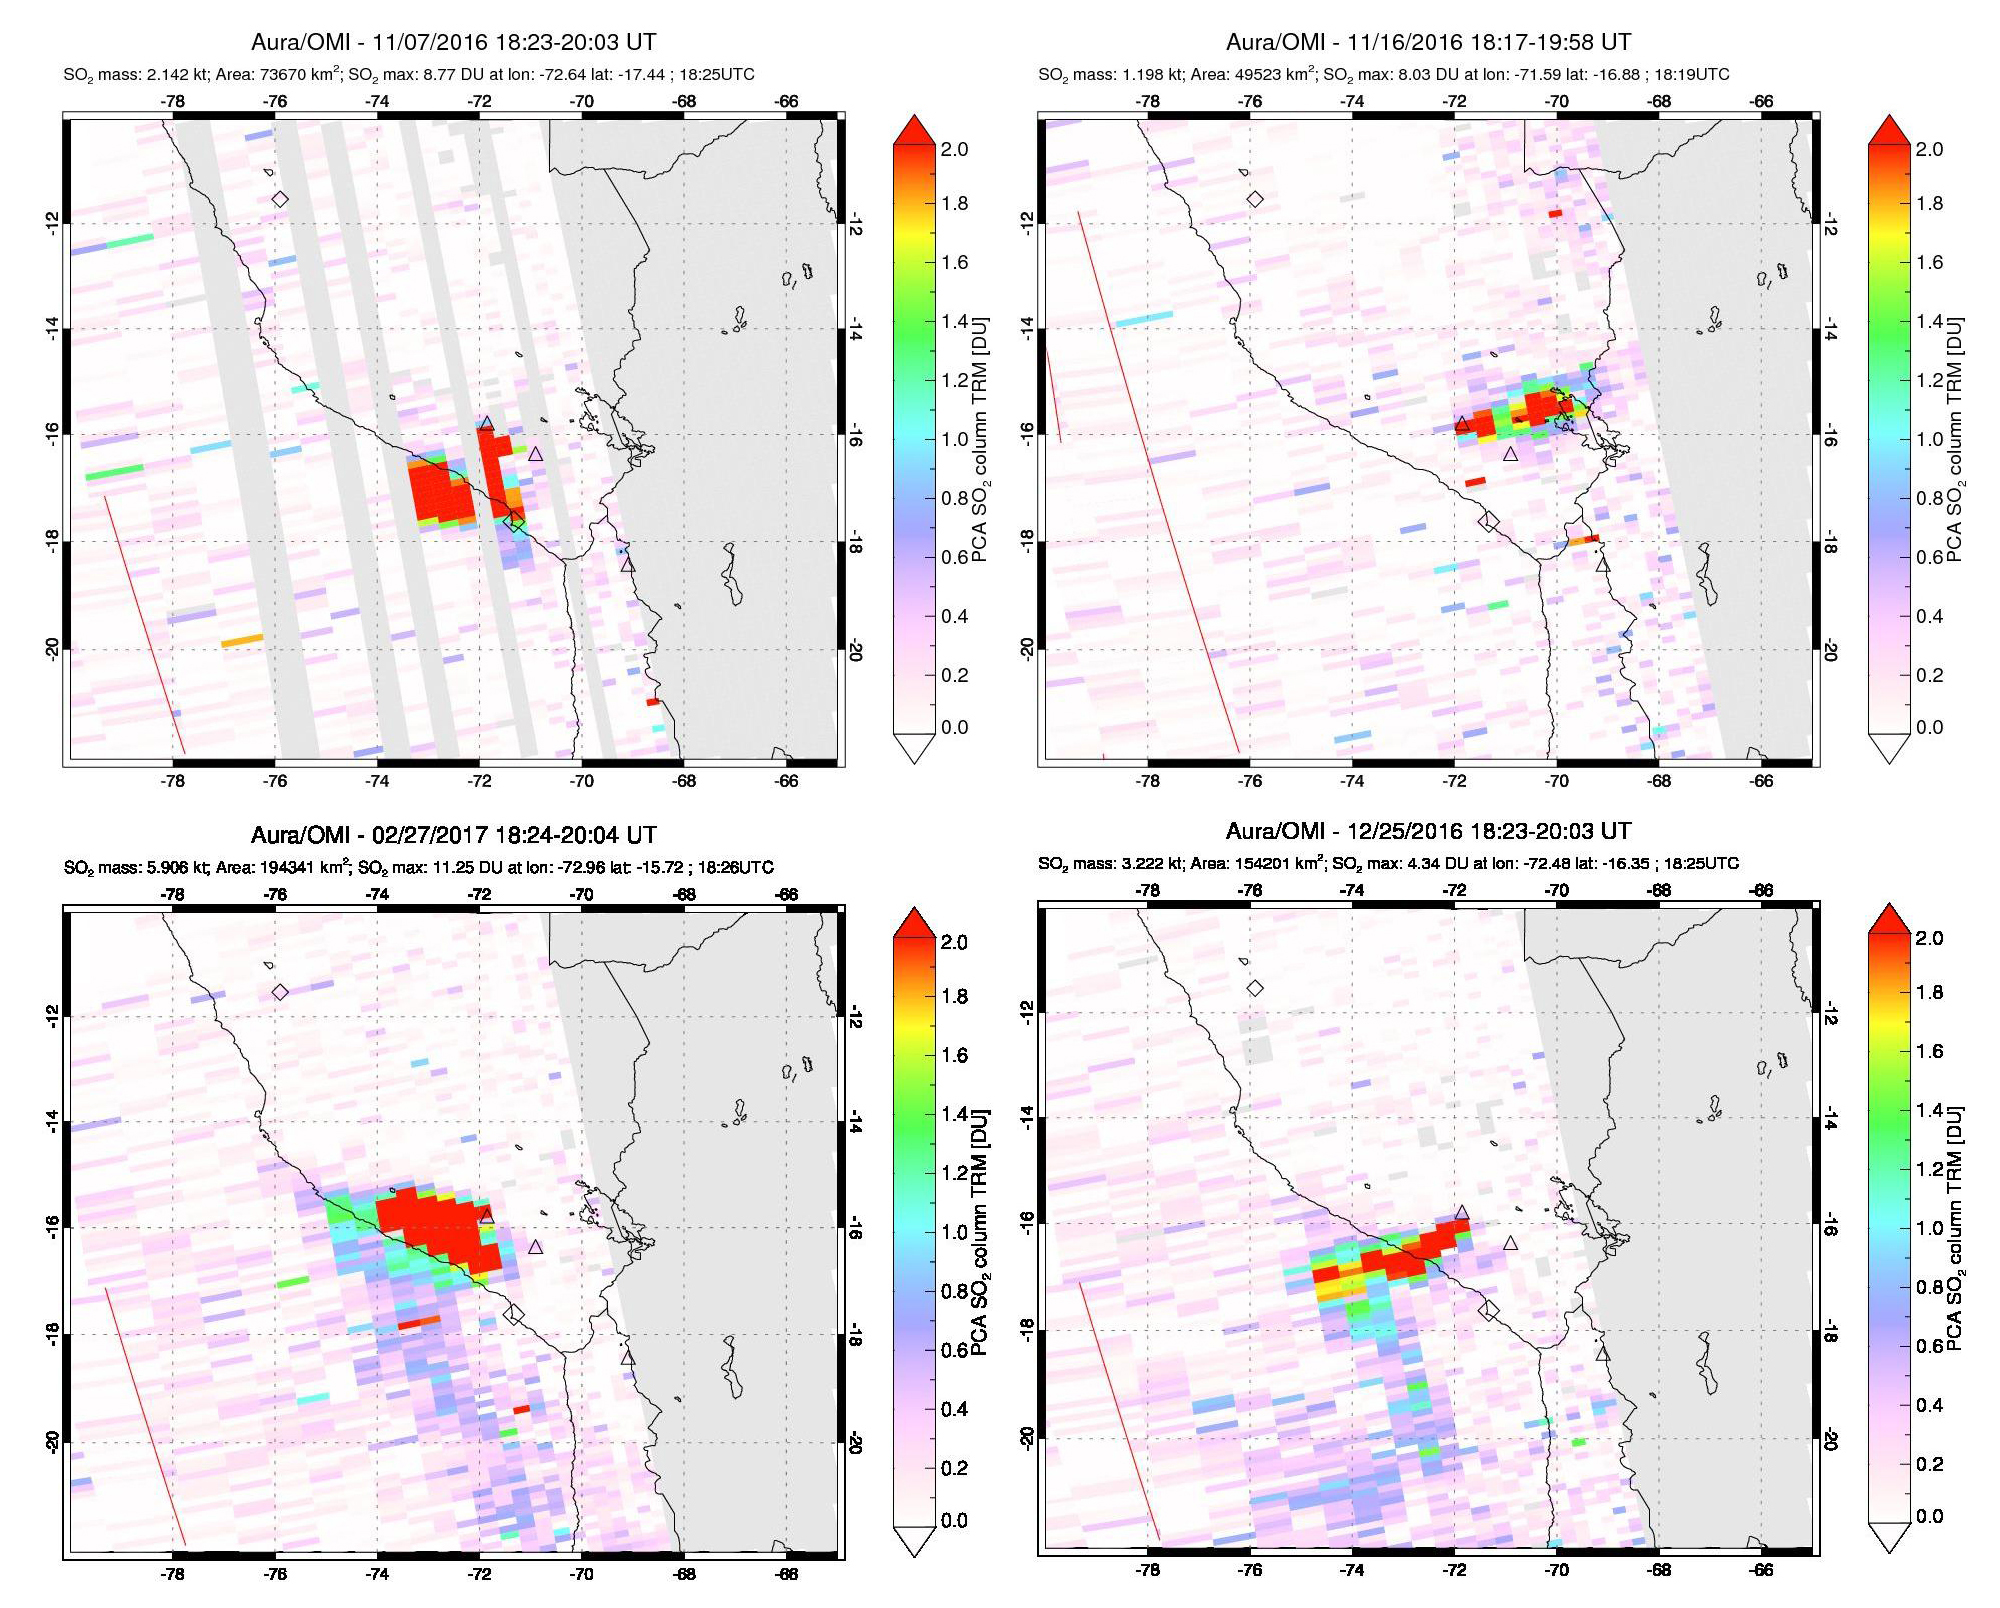 |
Figure 30. SO2 plumes drifting in different directions up to 200 km from Sabancaya captured by the OMI instrument on the Aura satellite. Clockwise from top left: 7 November 2016, first day of ash eruption, plume drifting SW and S towards Arequipa; 16 November 2016, plume drifting NE toward Lake Titicaca; 25 December 2016, plume drifting WSW over the Pacific Ocean; 27 February 2017, large plume drifting S and W, corresponding to an 11.9-km-altitude ash plume reported by Buenos Aires VAAC on 26 February. Courtesy of NASA GSFC. |
Geological Summary. Sabancaya, located in the saddle NE of Ampato and SE of Hualca Hualca volcanoes, is the youngest of these volcanic centers and the only one to have erupted in historical time. The oldest of the three, Nevado Hualca Hualca, is of probable late-Pliocene to early Pleistocene age. The name Sabancaya (meaning "tongue of fire" in the Quechua language) first appeared in records in 1595 CE, suggesting activity prior to that date. Holocene activity has consisted of Plinian eruptions followed by emission of voluminous andesitic and dacitic lava flows, which form an extensive apron around the volcano on all sides but the south. Records of observed eruptions date back to 1750 CE.
Information Contacts: Observatorio Volcanologico del INGEMMET, (Instituto Geológical Minero y Metalúrgico), Barrio Magisterial Nro. 2 B-16 Umacollo - Yanahuara Arequipa (URL: http://ovi.ingemmet.gob.pe); Instituto Geofisico del Peru, Observatoria Vulcanologico del Sur (IGP-OVS), Arequipa Regional Office, Urb La Marina B-19, Cayma, Arequipa, Peru (URL: http://ovs.igp.gob.pe/); NASA Earth Observatory, EOS Project Science Office, NASA Goddard Space Flight Center, Goddard, Maryland, USA (URL: http://earthobservatory.nasa.gov/); MIROVA (Middle InfraRed Observation of Volcanic Activity), a collaborative project between the Universities of Turin and Florence (Italy) supported by the Centre for Volcanic Risk of the Italian Civil Protection Department (URL: http://www.mirovaweb.it/); Hawai'i Institute of Geophysics and Planetology (HIGP), MODVOLC Thermal Alerts System, School of Ocean and Earth Science and Technology (SOEST), Univ. of Hawai'i, 2525 Correa Road, Honolulu, HI 96822, USA (URL: http://modis.higp.hawaii.edu/); NASA Goddard Space Flight Center (NASA/GSFC), Global Sulfur Dioxide Monitoring Page, Atmospheric Chemistry and Dynamics Laboratory, Goddard, Maryland, USA (URL: https://so2.gsfc.nasa.gov/).