Report on Kilauea (United States) — November 2017
Bulletin of the Global Volcanism Network, vol. 42, no. 11 (November 2017)
Managing Editor: Edward Venzke.
Edited by A. Elizabeth Crafford.
Kilauea (United States) Episode 61g lava flow continues with many breakouts; firehose enters the sea at Kamokuna ocean entry
Please cite this report as:
Global Volcanism Program, 2017. Report on Kilauea (United States) (Crafford, A.E., and Venzke, E., eds.). Bulletin of the Global Volcanism Network, 42:11. Smithsonian Institution. https://doi.org/10.5479/si.GVP.BGVN201711-332010
Kilauea
United States
19.421°N, 155.287°W; summit elev. 1222 m
All times are local (unless otherwise noted)
Hawaii's Kīlauea volcano continues the long-term eruptive activity that began in 1983 with lava flows from the East Rift Zone (ERZ) and a convecting lava lake inside Halema'uma'u crater. The US Geological Survey's (USGS) Hawaiian Volcano Observatory (HVO) has been monitoring and researching the volcano for over a century, since 1912. HVO quarterly reports of activity for January-June 2017, by HVO scientists Lil DeSmither, Tim Orr, and Matt Patrick, form the basis of this report. MODVOLC, MIROVA, and NASA Goddard Space Flight Center (GSFC) provided additional satellite information of thermal anomalies and SO2 plumes.
The lava lake level inside Halema'uma'u crater continued to rise and fall periodically during January-June 2017. The lava continued to circulate, and periodic rockfalls and veneer collapses caused small explosions within the lake. A few pieces of lapilli and minor ash landed at the Jagger Overlook. There were no major changes at the Pu'u 'O'o crater during the period; only minor fluctuations occurred in the lava pond lake level, and periodic rockfalls briefly disturbed the pond surface. There were, however, many surface breakouts along almost the entire length of the episode 61g lava flow from near the base of Pu'u 'O'o all the way to the Kamokuna ocean entry, about 12 km S. After the collapse of a large part of the delta at the Kamokuna ocean entry on 31 December 2016, lava continued to pour into the sea, and a new submarine delta began to grow. Instability of the sea cliff led to fractures and additional collapses during January and February. By the end of March, a small new delta was again visible above sea-level. It collapsed into the sea on 3 May, but another new delta quickly began to grow and reappeared by the end of the month. The "firehose" solidified and formed a ramp to the delta; surface flows caused thickening of the delta through the end of June.
Activity at Halema'uma'u. The lava lake inside 1-km-wide Halema'uma'u crater at Kīlauea's summit was relatively quiet during the first half of 2017. It is located within the 200-m-wide "Overlook crater" at the SE edge of Halema'uma'u. The lava lake level rose and fell in reaction to typical summit pressure changes, as reflected in numerous deflation-inflation (DI) events. The rise and fall of the lake level generally took place over the course of several hours to days. At its highest level, the lake was 9 m below the floor of Halema?uma?u crater on 4 January 2017. Two weeks later, the lake dropped to its lowest level measured, 52.5 m, on 17 January. It was at a very similar height again, 52 m below the rim, on 23 June. There were two unusually large, fast drops in the lava lake level during June. The first, from 13 to 14 June, was a drop of 24 m in 24 hours. The second was a drop of 30 m over two days (21 to 23 June), which was the greatest single drop in lava level since mid-January.
The circulation pattern of the lava lake surface remained consistent, upwelling from the north end of the lake and migrating to the southern edge (and the southeast sink) where the crust descended. Short-lived spatter sources around the lake, generally caused by a disruption of the lake surface (e.g., rock falls), would temporarily (and sometimes only locally) redirect the lake surface towards the spatter source. Seismic tremor levels fluctuated along with spattering intensity. During much of the second quarter of 2017, spattering in the southeast sink was located inside of a large grotto with stalactites hanging from the roof.
The rockfalls and veneer collapses from January through June were not large enough to trigger any significant explosions, but there were several smaller events. The first, observed on 9 January at approximately 1320, occurred during Kona winds (stormy, rain-bearing winds that blow over the islands from the SW or SSW, in the opposite direction of the normal trade winds). It did not produce an explosive deposit or excessive amounts of tephra in the collection buckets near the Halema?uma?u Overlook and parking lot (500 m S of active lava lake), but did send ash and at least one 2-3 mm lapillus to the Jaggar Overlook and parking lot (about 1.8 km NW of the lava lake), and generated a composite seismic event. Composite events were also triggered on 14 January (2250) when a large piece of veneer collapsed off the northern crater wall, and on 16 January (1524) after a small rockfall from the southern inner edge of the Overlook crater (the smaller crater inside Halema?uma?u that contains the lava lake). On 23 March at 0036, a slice of the Overlook crater's southern ledge collapsed into the lake, triggering brief spattering and another composite event. On 26 May at 1114 HST, a piece of the northern Overlook crater wall collapsed into the lake (figure 281). This triggered a composite seismic event, lake surface agitation and spattering, and produced a dusting of ash on the cars in the HVO parking lot (at the Jaggar Overlook). Other veneer, grotto, and ledge failures often triggered brief spattering, localized subsidence of the crust, and composite seismic events.
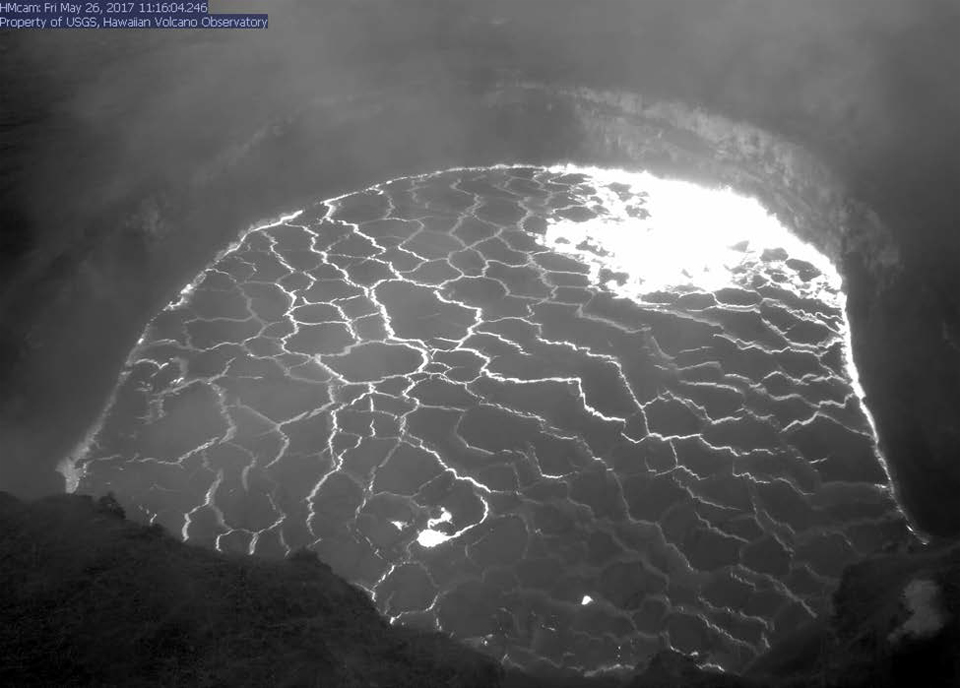 |
Figure 281. Webcam image from the HMcam on the rim of the Overlook crater at Kīlauea on 26 May 2017 at 1116 HST, less than two minutes after a collapse, showing the agitated lava lake surface. A large chunk from the northern crater wall, directly above the active spattering, fell into the lake, which triggered spattering and a composite seismic event. The area of the wall that collapsed is discernible above the spatter by the newly exposed wall rock that is lighter in color. Courtesy of HVO (Hawaiian Volcano Observatory Quarterly Report for April - June 2017). |
Activity at Pu'u 'O'o. There were no major changes in Pu'u 'O'o crater during the first half of 2017, and there was still an active lava pond in the West pit at the end of June (see figure 258, BGVN 41:08 for detailed crater map). The pond level appeared to be relatively steady, ranging from 19 to 21 m below the pit rim (849-851 m elevation), and the pond diameter ranged from 43 m in March to 47 m at the end of May. A time-lapse camera looking into the West pit lava pond, which was installed on 16 March, revealed a few rockfalls and collapses. The pond surface was completely disturbed on 18 April at 0809 HST and again on 20 May at 2304; overnight on 4-5 May a talus deposit appeared on the pit floor, suggesting rockfalls. On 31 May a ledge just above the West pit lava pond surface, representing the pond level from a few months prior, had a pile of rubble from a portion of the east wall collapsing.
Summary of episode 61g breakouts. Throughout the first half of 2017, there were many active surface breakouts along almost the entire length of the episode 61g flow field (figure 282). Near the 61g vent, a new breakout started on 22 January, which traveled along the southern margin of the flow field before it stopped on the morning of 9 February. The breakout that had started on 21 November 2016, also ended on 9 February, possibly because the system was starved of supply after a week and a half of deflation. A new breakout began on the upper part of Pulama Pali on 10 February that lasted through early April. Two breakouts appeared in the Royal Gardens subdivision on 15 February and 1 March, each lasting a few weeks. During the day of 5 March, a breakout began approximately 1.3 km downslope of the vent that remained weakly active on the upper flow field through the end of June. Two new breakouts started in mid-June that were also active through the end of the month.
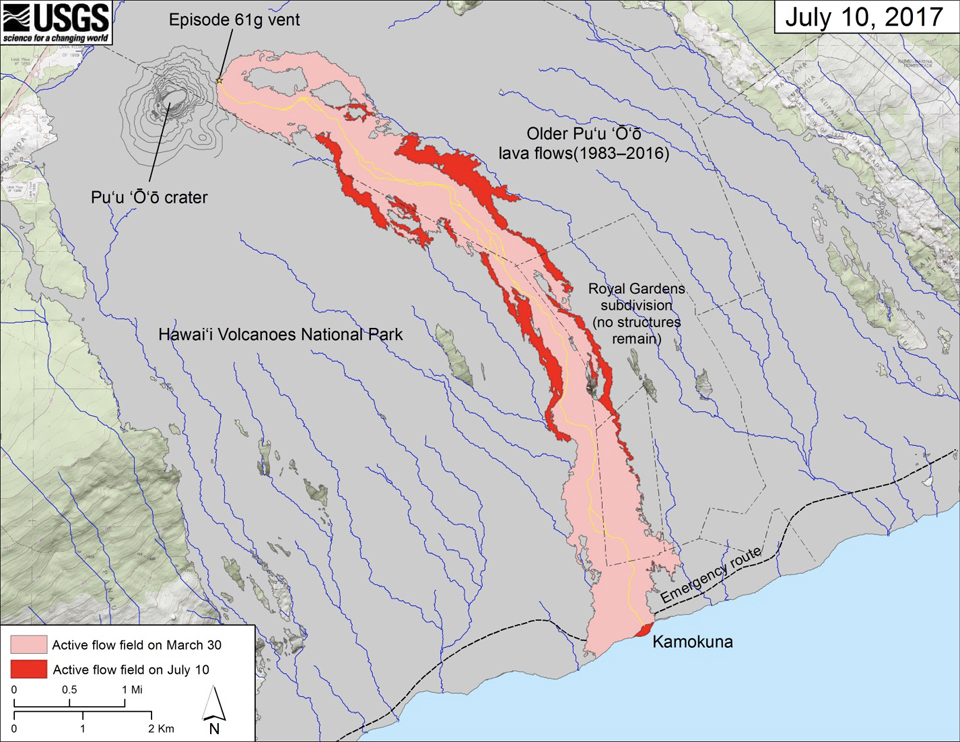 |
Figure 282. Map of the episode 61g flow field at Kīlauea produced on 10 July 2017, showing the flow margin expansion (red) since 30 March 2017. During this time, the flow field expanded an additional 183 hectares from the previous 846 hectares (as of March 30), to a total of 1,029 hectares, increasing the flow field area by 22 percent. Courtesy of HVO (Hawaiian Volcano Observatory Quarterly Report for April - June 2017). |
Details of episode 61g breakouts. On 10 February 2017 around 0710 a new breakout was reported on the steep part of Pulama Pali on the western flow field; by the next day pahoehoe surface flows were advancing across the coastal plain. Incandescence from the surface breakouts on the pali was only visible for the first few days, but the breakout continued to feed the surface flows on the coastal plain. By 14 February the flows had advanced approximately 2.3 km from the base of the pali (about 1.2 km from the coast), and by 25 February the flow was approximately 660 m from the ocean. These sluggish pahoehoe flows were largely outside the National Park boundary as they widened the eastern edge of the 61g flow margin. The flow advanced to within approximately 300 m of the road (500 m from the ocean) by 2 March. Breakouts then opened on the upper half of the coastal plain around 7 March, remaining weakly active through the end of March. On 8 April, tiny remnant surface flows from the breakout were found on the coastal plain. The spiny pahoehoe was 500 m out from the base of the pali and 2.8 km from the ocean, but the breakout was confirmed by thermal images to have ended by 10 April.
There were two breakouts that began near the top of Royal Gardens subdivision, on 15 February and 1 March 2017. The first started during the day, with glow visible in the R3cam at sundown. By 18 February the breakout was visible from the HPcam on the steep part of Pulama Pali, and remained active on the pali until the evening of 12 March. The 1 March breakout began higher upslope, with incandescence visible at sundown. This breakout slowly advanced and after a few days could not be seen from the webcam. Thermal images from 16 March indicated that the flow was no longer active.
During the day of 5 March 2017, a breakout began approximately 1.3 km downslope of the episode 61g vent (visible in the R3cam). By the middle of March, this was the most active breakout on the flow field, with surface activity expanding both sides of the flow field, and ranging between approximately 2 and 3.5 km from the vent. It was visible from the FEMA emergency road on 28 April on the upper pali. There was very little advancement over the next few weeks, until it reached the top of the steep part of the pali on 17 May. By 23 May, the sluggish pahoehoe flow front was approximately 400 m out from the base of the pali, and there were many small pahoehoe and aa channels on the steep pali face. Four days later (27 May), there were still breakouts on the pali, and the flow front had advanced another 100 m along the western margin of the 61g flow field. Satellite imagery from 2 June showed the breakout was still active, but by 13 June no activity was found on the coastal plain, and thermal imagery showed no active breakouts on 21 June. The 5 March breakout remained weakly active on the upper flow field (above the pali) through the end of June.
Two new breakouts started in June 2017, and remained active through the end of the month. The first started around 0600 HST on 13 June (figure 283), approximately 1.1 km from the episode 61g vent, located just upslope of the 5 March breakout point. These surface flows quickly became the most active along the 61g flow field. The second breakout originated from the upper pali (near the top of Royal Gardens subdivision) during the day of 26 June, and advanced down the pali east of the main flow field, reaching the base during the night of 4 July.
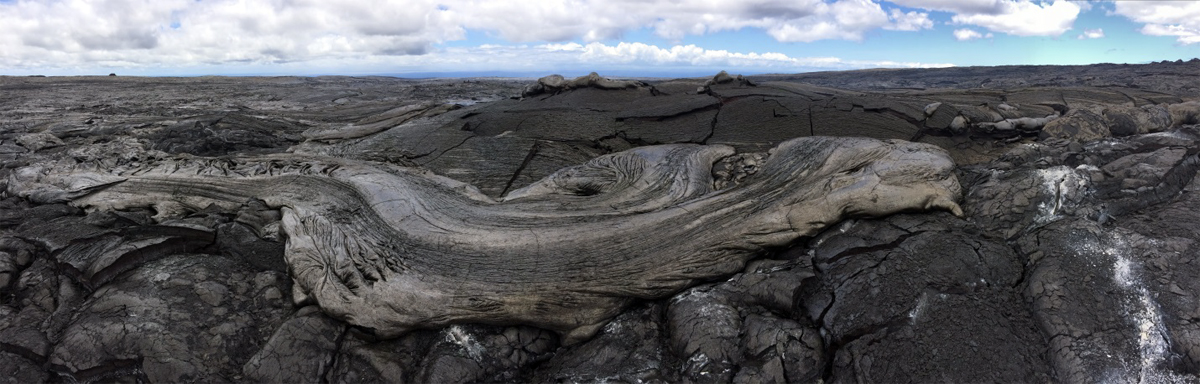 |
Figure 283. The 13 June breakout point approximately 1.1 km from the 61g vent, along the tube system at Kīlauea. The breakout uplifted (about 2 m) and cracked the older flow (center) as it pushed its way to the surface and oozed through the cracks in multiple locations around the central uplifted area. Photo by L. DeSmither on 21 June 2017. Courtesy of HVO (Hawaiian Volcano Observatory Quarterly Report for April - June 2017). |
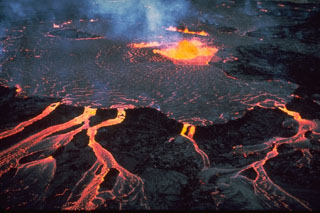
Activity at Kamokuna ocean entry. After the ten hectare (25 acre) delta and sea cliff collapse on 31 December 2016, the ocean entry consisted of a single vigorous lava stream (informally called "the firehose") entering directly into the ocean from the episode 61g lava tube; it was located 21 m above the water (figure 284). Interactions between the lava and sea water produced a single robust plume and sporadic littoral explosions that threw spatter up to roughly 30 m above the top of the sea cliff. Spatter from these explosions fell on the cliff adjacent to the ocean entry, and began to build a littoral cone that was first noticed on 28 January on the cliff's edge. The sea cliff in the immediate area and downwind of the ocean entry was blanketed in a layer of Pele's hair and Limu o Pele (Pele's seaweed) which fell from the plume and added to the ground cover as the firehose continued.
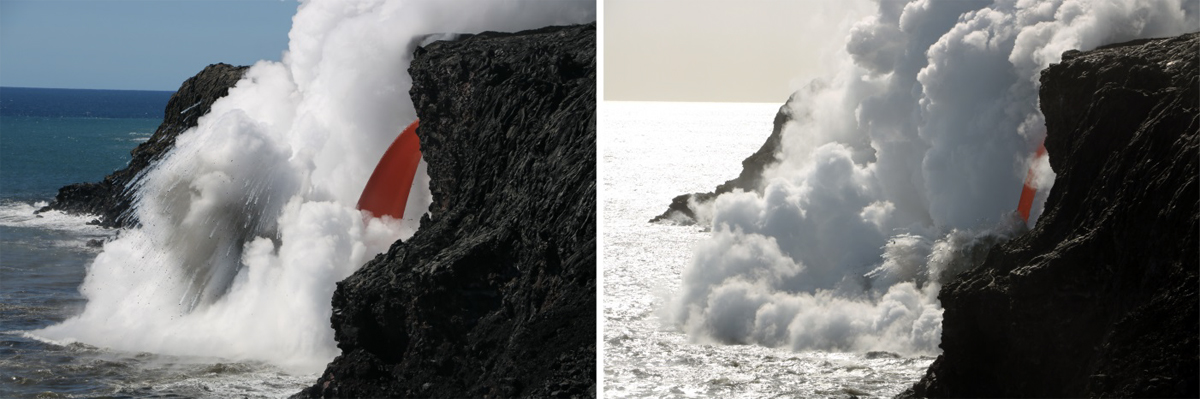 |
Figure 284. Lava pours into the ocean at the Kamokuna ocean entry at Kīlauea. Left: "The firehose" on 28 January 2017 exits the tube as a wide, thin sheet in this photo taken from the nearby observation point. Right: By 1 February, the lava stream changed to a cylindrical hose shape. Photos by M. Patrick, courtesy of HVO (Hawaiian Volcano Observatory Quarterly Report for January – March 2017). |
A discolored water plume was visible at the ocean entry flanking an area of darker water directly out from the entry point, on either side. Thermal images taken in mid-March 2017 indicated that the discolored area was also heated, with the anomalous area extending out about one kilometer (figure 285).
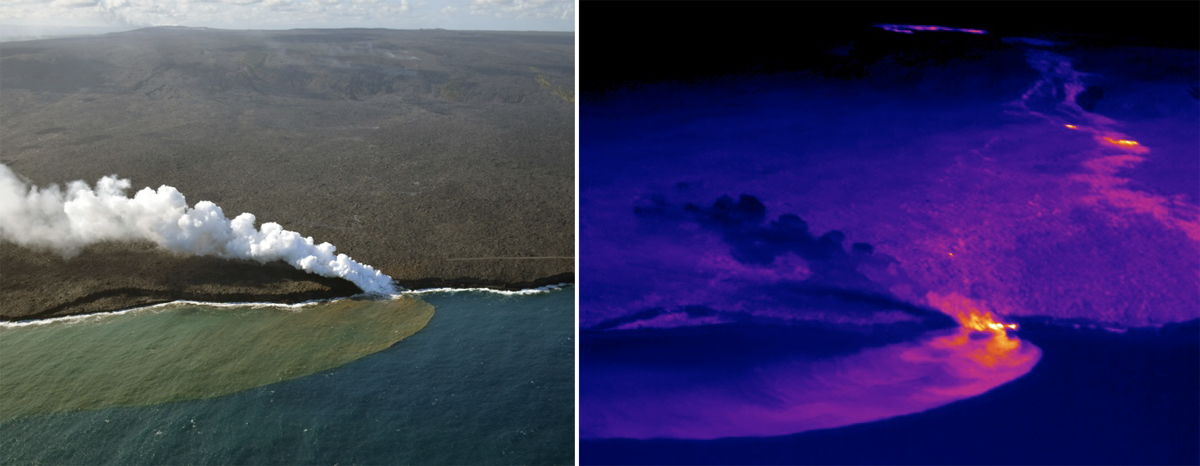 |
Figure 285. Photo and thermal images taken of the Kamokuna ocean entry at Kīlauea during a 30 March 2017 overflight. Left: Photo of the ocean entry and distinct plumes of steam and discolored water (photo by L. DeSmither). Right: A thermal image showing the heated water plume with the small area of cool water directly in front of the ocean entry. The hot material spread horizontally along the base of the sea cliff directly in front of the ocean entry, is the newly forming delta. On the 61g flow field (upper right), two small breakouts are visible on the coastal plain near the base of Pulama Pali, and the 5 March breakout (top-center), is discernable on the upper flow field near Pu'u 'O'o. Courtesy of HVO (Hawaiian Volcano Observatory Quarterly Report for January - March 2017). |
Many large ground cracks were noticed in the sea cliff inland from the entry after the 31 December 2016 Kamokuna delta collapse, including a set of en echelon cracks at the edge of the old sea cliff where over 1.6 hectares (about 4 acres) had collapsed. On a 25 January 2017 overflight, thermal images revealed a hot crack parallel to the sea cliff and a corresponding collapse pit on the trace of the lava tube, suggesting major instability. A few days later (28 January) the crack was measured at 30 cm wide, up to 220°C, was visibly very deep, and the seaward side of the crack was sloping slightly towards the ocean (figure 286). HVO scientists could also occasionally feel slow ground shaking at an observation point 240 m east of the ocean entry. When measured again (in the same spot) on 1 February, the crack was 75 cm wide. Upon further examination, grinding noises were coming from the crack and the seaward side of the crack was visibly swaying about 1 cm.
 |
Figure 286. Photos of the large ground crack near the Kamokuna ocean entry at Kīlauea, with yellow arrows pointing out two distinctive flow edges for comparison. Left: A photo taken on 28 January 2017 (by M. Patrick), when the crack was measured at 30 cm wide (just above the lower arrow). Right: Photo taken on 2 February, after a large portion of the sea cliff collapsed into the ocean, the crack measured 100 cm (photo by T. Orr). Courtesy of HVO (Hawaiian Volcano Observatory Quarterly Report for January - March 2017). |
On the morning of 1 February around 0735, a small collapse of the sea cliff was reported near the firehose. The next day, the firehose was no longer visible from the observation point (possibly due to erosion of the sea cliff), but sporadic littoral explosions were still occurring. HVO personnel returned to the crack (which had begun steaming) for observations and to record video of the cliff oscillating. At 1255, about 30 seconds after the camera began to record, the seaward slab of the crack began to fall away. After the collapse only a small piece of the slab remained, and the crack measured 100 cm in width, 25 cm more than the previous day, most of which occurred during the collapse and in the few minutes following (figure 286). By 8 February, the remaining slab of cliff was gone, one piece collapsed at 1507 on 2 February, and the rest collapsed sometime between 6 and 8 February. The littoral cone that had been building on the edge of the cliff fell in with the collapse, but by 8 February, another had formed on the new sea cliff edge above the ocean entry.
During January, the firehose exited the tube as a thin broad sheet, but by the end of the month had changed into a cylindrical stream (figure 284). The output amount slowly began to wane, and on 8 March the ocean entry plume shut off for about 30 minutes between 1616 and 1646 with only a little puff of steam visible in between. The plume shut off briefly again several times on 18, 19, and 20 March for periods up to about 90 minutes in length.
From January through March 2017, the firehose continued with no sign of a delta forming, which suggested steep bathymetry below the ocean entry. By 22 March, the firehose was no longer visible from the public viewing area but incandescence was visible near the water surface, suggesting that the firehose was becoming encased in lava and a small delta was finally beginning to form. On 24 March, there were few, if any, littoral explosions, and the thick plume at the ocean entry made it impossible to see any signs of a delta, but time-lapse images verified the formation of one. There were many floating, steaming blocks in the water offshore of the entry. An overflight on 30 March showed a thick haze that was obscuring the small delta at the base of the cliff, where only brief tiny spots of incandescence could be seen near the water's surface. Images from a thermal camera indicated hot material from the delta extending approximately 60 m east along the cliffs base at the ocean entry.
By the end of March 2017, the firehose flow activity was no longer visible and a tiny new delta began to form. On 8 April, the delta was estimated to be extending roughly 25 m out from the base of the sea cliff (using cliff height for scale). A sparse field of dense angular blocks were deposited on 25 March between 0803 and 0808 HST on the sea cliff near the ocean entry, which covered an area of approximately 70 x 70 m (the largest block observed was 50 cm across).
During the first half of April the small delta was mostly obscured by the ocean entry plume. By the end of the month, the delta size was estimated to be 1.2 hectares (roughly 3 acres, using time-lapse images). On 3 May, nearly the entire delta collapsed between 0955 and 1000 HST, following a large steam plume and weak spattering from one of the cracks on the delta, along with delta subsidence in the preceding 20 minutes before the collapse. Many small pieces of the remnant delta fell off over the next few hours.
The delta quickly began to rebuild after the collapse, and on 23 May coast-parallel cracks were apparent on the new delta. The tubed-over firehose created a ramp-like feature near the cliff face where the 61g tube exited the older sea cliff (figure 287). This ramp was narrow at the point where the tube exits the cliff, and flared out as it reached the surface of the delta, insulating the 61g lava on its way to the delta. Near the top of the ramp there was an area of concentrated degassing, and evident cracks in the ramp revealed incandescence. On 16 June, surface flows on the delta covered a large portion of the surface, including the coast-parallel cracks so they were no longer visible.
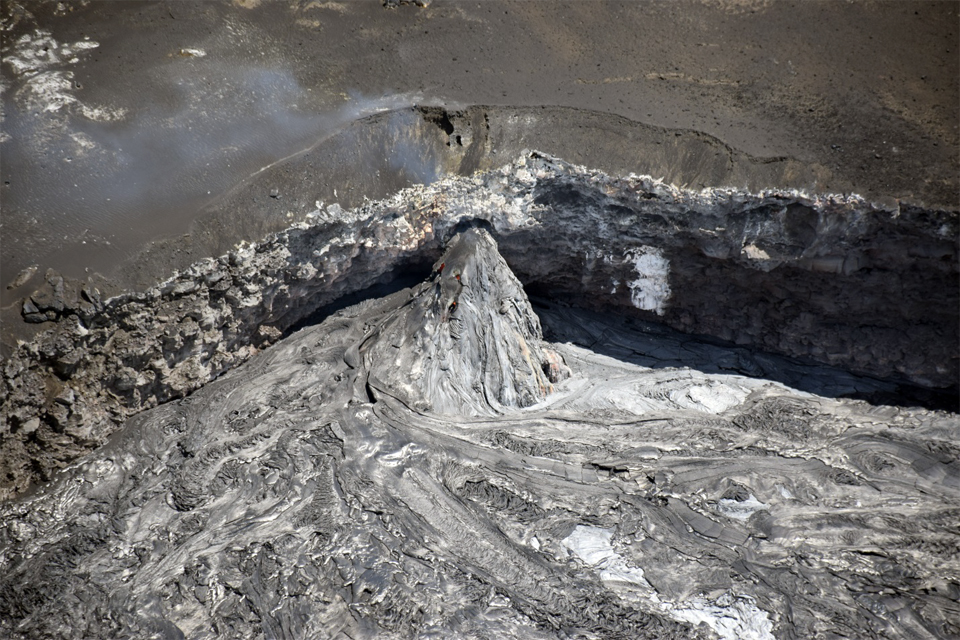 |
Figure 287. A view of the crusted over firehose ramp on 29 June 2017 at the Kamokuna ocean entry of Kīlauea where the 61g lava tube exits the sea cliff and feeds the ocean entry from an established tube on the delta. On the west (left) side of the ramp, there are cracks in the crusted surface where delta surface flows likely originated that show incandescence beneath. Photo by L. DeSmither, courtesy of HVO (Hawaiian Volcano Observatory Quarterly Report for April - June 2017). |
Time-lapse images from 25 June revealed that firehose activity returned briefly between 1139 and 1149 HST, and produced channelized surface flows that continued into the following day (when a skylight was visible on the delta). The delta had grown to approximately 2.4 hectares (6 acres) by 29 June (figure 288), and had also thickened significantly from the recent surface flows on the delta. Much of the delta surface was covered by the repeated surface flows, but there was still a coast-parallel crack visible on the western side.
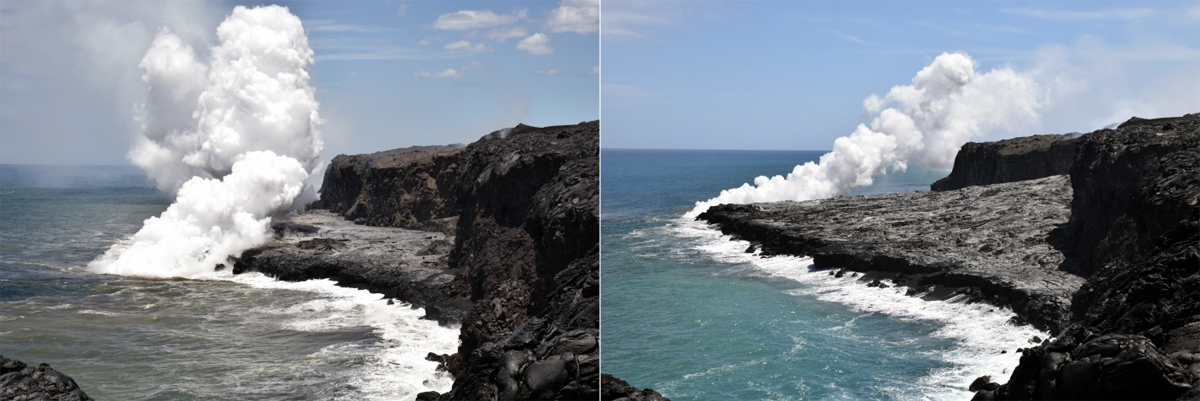 |
Figure 288. The lava delta at Kamokuna ocean entry at Kīlauea on 23 May 2017 (left) and 13 July 2017 (right) showing the thickening of the delta near the cliff face caused by repeated small surface flows. These flows appear to have doubled the thickness of the delta and created a distinctly sloped surface from the base of the cliff to the sea. Photos by L. DeSmither, courtesy of HVO (Hawaiian Volcano Observatory Quarterly Report for April - June 2017). |
Satellite thermal anomaly and SO2 data. Satellite thermal anomaly data for Kīlauea can be closely correlated with ground-based observations by HVO scientists, thus providing validation of remote-sensing data. The MODVOLC thermal alert system captured distinct anomalies during January-June 2017 from Halema?uma?u Crater, Pu'u 'O'o Cone, the episode 61g flow, and the Kamokuna ocean entry (figure 289). The changes from month to month in the locations of the hotspots, especially the locations of the breakouts of episode 61g flow, are readily apparent in the MODVOLC images, and match the descriptions of these events provided by HVO scientists.
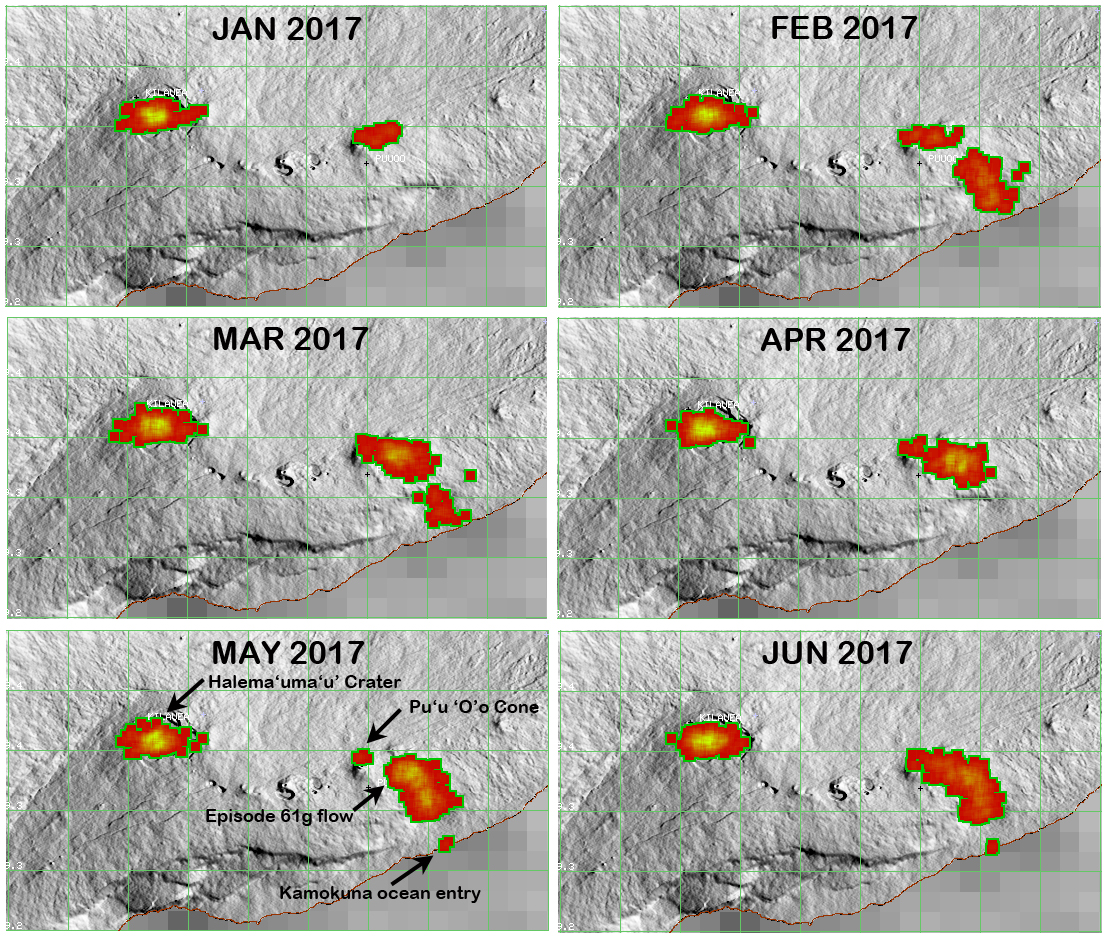 |
Figure 289. Thermal alerts identified by the MODVOLC system by month at Kīlauea, January-June 2017. The thermal anomaly signatures of the lava lakes at Halema'uma'u crater and Pu'u 'O'o crater persist throughout the period; while the changes in the locations of the thermal anomalies of the episode 61g flow and the Kamokuna ocean entry closely match ground observations by HVO staff, described in the text. Courtesy of HIGP - MODVOLC Thermal Alerts System . |
The MIROVA thermal anomaly information, which plots Middle InfraRed Radiation from the MODIS data, also shows the locations and movements of the sources of heat at Kīlauea over time (figure 290), and this information correlates closely with ground observations by HVO staff. Note that the MIROVA center point for relative distances described here is about 10.5 km (0.1°) E of the summit on the western Halema'uma'u crater rim. The anomaly locations at about 10 km distance correspond to both the lava pond at Pu'u 'O'o crater and the Halema'uma'u crater lava lake. Those about 20 km away correspond to the Kamokuna ocean entry. Anomalies that migrate over time between 10 and 20 km distance trace the movement of the episode 61g flow breakouts between Pu'u 'O'o and the Kamokuna ocean entry.
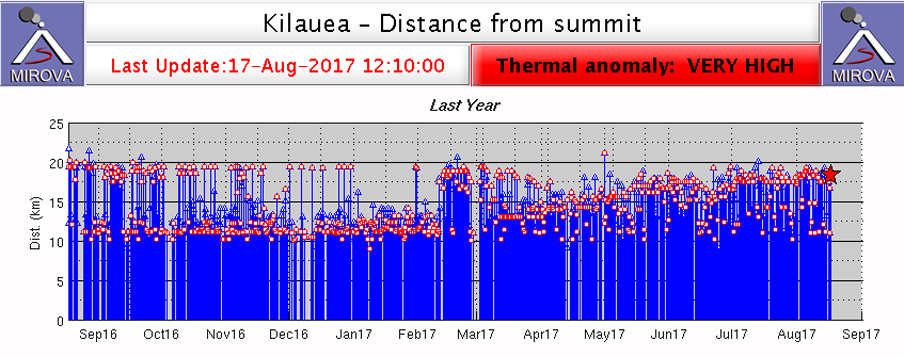 |
Figure 290. The MIROVA thermal anomaly data for Kīlauea tracks both radiative power and the distance of the radiative power from the assigned "summit" location (about 10.5 km E of the high point on the western Halema'uma'u crater rim). In this chart of the distance to the thermal anomalies during the year ending 17 August 2017, the variations in distance (y-axis) correspond closely to changes in the locations of the active lava flow sites. The Halema'uma'u and Pu'u 'O'o craters are located about 10 km away; the episode 61g flow field has anomalies that track between 10 and 20 km away; and the Kamokuna ocean entry is represented by the anomalies about 20 km distant. See additional discussion in the text. Courtesy of MIROVA. |
Plumes of SO2 emissions visible in satellite data are common at Kīlauea (figure 291). The normal trade winds send most emissions to the SW, but occasional "Kona" winds blow in the opposite direction and disperse SO2 to the NE from the summit. Large lava breakouts and activity at the summit crater can produce substantial SO2 plumes.
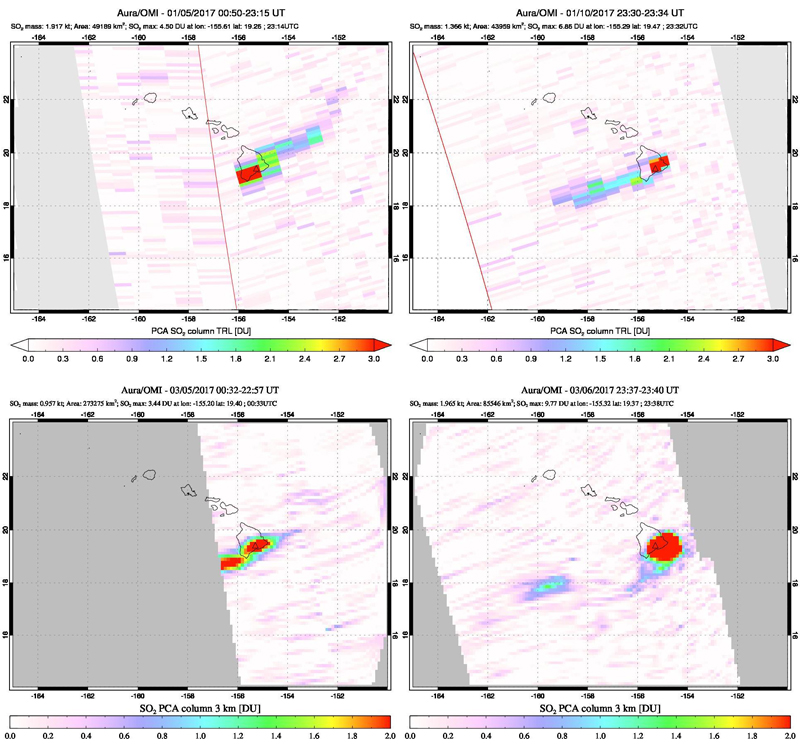 |
Figure 291. Sulfur dioxide emissions data from the OMI instrument on the Aura satellite for selected days at Kīlauea during January and March 2017. Top Left: uncommon "Kona winds" blowing from SW to NE over the island, opposite to the normal trade winds dispersed the SO2 plume to the NE on 5 January 2017. Top Right: The more common trade wind direction, to the SW, carried a typical size SO2 plume on 10 January 2017. Bottom: The significant breakout from episode 61g that began on 5 March likely produced the larger than normal SO2 plumes captured on 5 and 6 March 2017. Courtesy of NASA GSFC. |
Geological Summary. Kilauea overlaps the E flank of the massive Mauna Loa shield volcano in the island of Hawaii. Eruptions are prominent in Polynesian legends; written documentation since 1820 records frequent summit and flank lava flow eruptions interspersed with periods of long-term lava lake activity at Halemaumau crater in the summit caldera until 1924. The 3 x 5 km caldera was formed in several stages about 1,500 years ago and during the 18th century; eruptions have also originated from the lengthy East and Southwest rift zones, which extend to the ocean in both directions. About 90% of the surface of the basaltic shield volcano is formed of lava flows less than about 1,100 years old; 70% of the surface is younger than 600 years. The long-term eruption from the East rift zone between 1983 and 2018 produced lava flows covering more than 100 km2, destroyed hundreds of houses, and added new coastline.
Information Contacts: Hawaiian Volcano Observatory (HVO), U.S. Geological Survey, PO Box 51, Hawai'i National Park, HI 96718, USA (URL: https://volcanoes.usgs.gov/observatories/hvo/); Hawai'i Institute of Geophysics and Planetology (HIGP) - MODVOLC Thermal Alerts System, School of Ocean and Earth Science and Technology (SOEST), Univ. of Hawai'i, 2525 Correa Road, Honolulu, HI 96822, USA (URL: http://modis.higp.hawaii.edu/); MIROVA (Middle InfraRed Observation of Volcanic Activity), a collaborative project between the Universities of Turin and Florence (Italy) supported by the Centre for Volcanic Risk of the Italian Civil Protection Department (URL: http://www.mirovaweb.it/); NASA Goddard Space Flight Center (NASA/GSFC), Global Sulfur Dioxide Monitoring Page, Atmospheric Chemistry and Dynamics Laboratory, 8800 Greenbelt Road, Goddard, Maryland, USA (URL: http://so2.gsfc.nasa.gov/index.html).