Report on Reventador (Ecuador) — January 2018
Bulletin of the Global Volcanism Network, vol. 43, no. 1 (January 2018)
Managing Editor: Edward Venzke.
Edited by A. Elizabeth Crafford.
Reventador (Ecuador) Large pyroclastic and lava flows during late June and late August 2017; continuing ash emissions and block avalanches throughout January-September 2017
Please cite this report as:
Global Volcanism Program, 2018. Report on Reventador (Ecuador) (Crafford, A.E., and Venzke, E., eds.). Bulletin of the Global Volcanism Network, 43:1. Smithsonian Institution. https://doi.org/10.5479/si.GVP.BGVN201801-352010
Reventador
Ecuador
0.077°S, 77.656°W; summit elev. 3562 m
All times are local (unless otherwise noted)
Reventador has exhibited historical eruptions with numerous lava flows and explosive events since the 16th century. Eruptive activity has been continuous since 2008. Persistent ash emissions and incandescent block avalanches characterized activity during 2016; occasional pyroclastic and lava flows were also reported (BGVN 42:11). Similar activity continued during January-September 2017; information for this period is provided primarily by the Instituto Geofisico-Escuela Politecnicia Nacional (IG-EPN) of Ecuador and also from satellite-based MODIS infrared data.
Summary of activity, January-September 2017. Activity remained high at Reventador during January-September 2017. The strongest (4 km long) pyroclastic flow since 2002 occurred in late June along with a large lava flow that traveled over 2.5 km, the longest since 2008. Visual observations of ash emissions and block avalanches were often difficult due to weather conditions that obscured views of the summit certain times of the year (figure 60, table 9). Thermal alerts and anomalies recorded by satellite instruments complemented the visual information reported by IG-EPN (figure 61) and showed near-continuous activity as well. Variation in the frequency of the different types of seismic events fluctuated throughout the period (figure 62) and generally corresponded to variations in the surface activity.
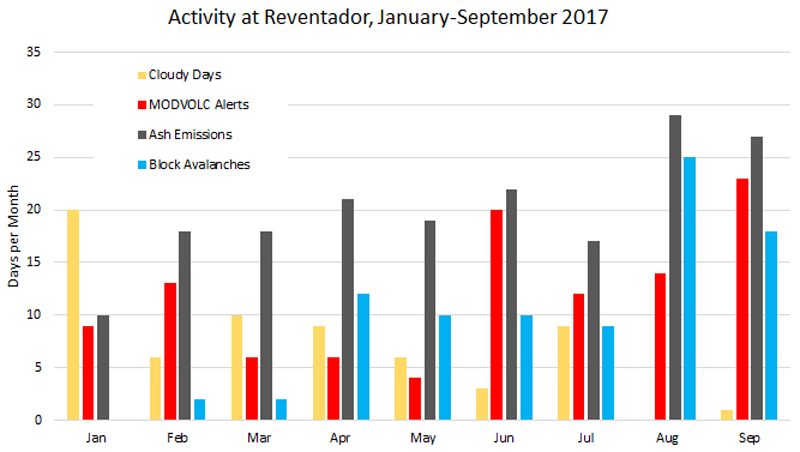 |
Figure 60. Activity at Reventador during January-September 2017 included MODVOLC alerts (red), ash emissions (gray) and block avalanches (blue) reported many times each month. The number of cloudy days (yellow) affected the number of observed events during most months. Data courtesy of IG-EPN, compiled from daily reports. |
Table 9. High levels of activity at Reventador during January-September 2017 were evident from the numbers of MODVOLC thermal alerts, and days with reported ash emissions and block avalanches. Cloudy weather impacted observations of activity during most months. Compiled from IG-EPN daily reports, VAAC reports, and MODVOLC data.
| Date | MODVOLC alerts | Cloudy days | Days with ash emissions | Plume heights above summit (m) | Days with block avalanches | Block avalanche runout distances (m) |
| Jan 2017 | 9 | 20 | 10 | 700-3,000 | 0 | -- |
| Feb 2017 | 13 | 6 | 18 | 900-2000 | 2 | 1,000-1,500 |
| Mar 2017 | 6 | 10 | 18 | 500-2,000 | 2 | 1,000 |
| Apr 2017 | 6 | 9 | 21 | 200-2,000 | 12 | 600-1,800 |
| May 2017 | 4 | 6 | 19 | 300-over 800 | 10 | 500-800 |
| Jun 2017 | 20 | 3 | 22 | Less than 200–2,000 | 10 | 200-800 |
| Jul 2017 | 12 | 9 | 17 | 200-800 | 9 | 200-800 |
| Aug 2017 | 14 | 0 | 29 | 300-over 1,000 | 25 | 200-1,000 |
| Sep 2017 | 23 | 1 | 27 | 400-over 1,200 | 18 | 500-1,500 |
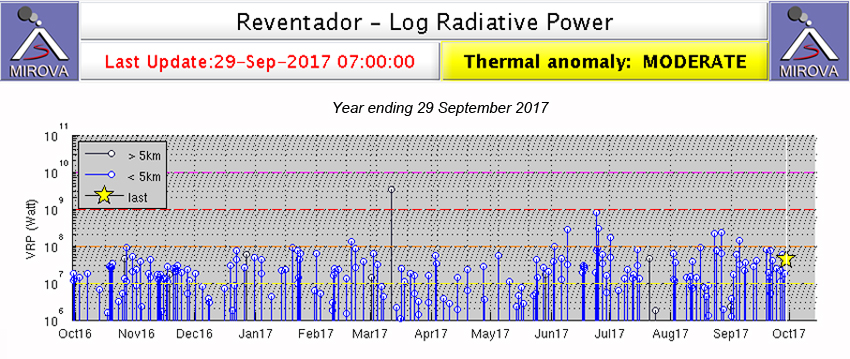 |
Figure 61. MIROVA thermal anomalies for Reventador for the year ending 29 September 2017 show a persistent record of heat flow from the volcano. Significant cloudiness during certain times of the year affected the completeness of the MODIS infrared satellite data on which this is based. Courtesy of MIROVA. |
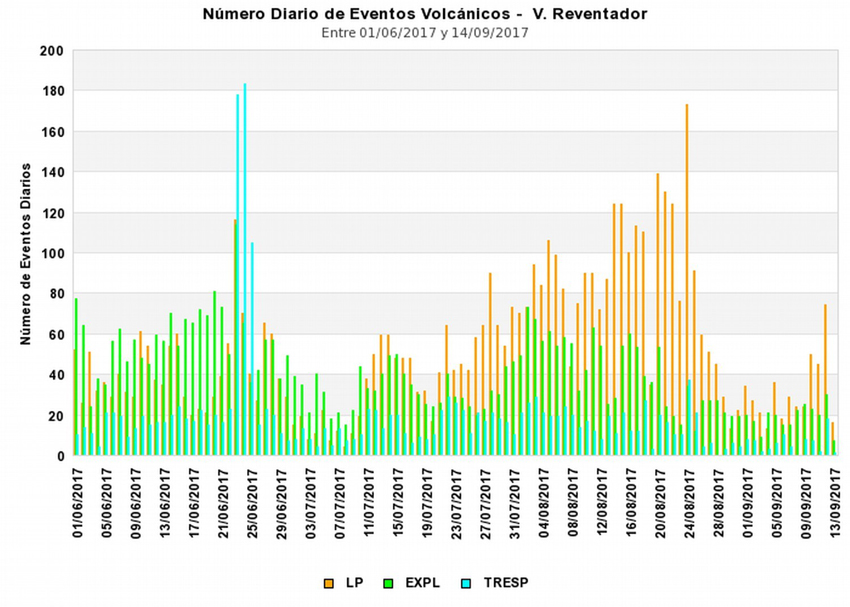 |
Figure 62. Frequency of daily seismic events at Reventador between 6 January and 14 September 2017. LP: Long Period, EXPL: Explosions, TRESP: Tremors. A significant tremor event took place during the lava flow event of late June, and LP seismic events peaked during the eruptive activity of late August. Courtesy of IG-EPN (Informe Especial del Volcán El Reventador, 2017, N° 4, Continúa la erupción, alternancia de actividad efusiva y explosive, 14 de septiembre del 2017). |
Ash emissions occurred many times each month, with the highest plumes exceeding 3,000 m above the summit of the pyroclastic cone inside the caldera. The number of block avalanches reported each month increased steadily throughout the period, with blocks falling hundreds of meters from the summit on all flanks numerous times. Pyroclastic flows were reported a few times most months; the largest event in June sent flows nearly 4 km. Four lava flow events were recorded during the period; on 3 April, a flow traveled 1,600 m down the SW flank, a small flow in early June travelled 200 m down the NE flank, the large flow of 23 June-1 July traveled over 2.5 km down the NE flank, and multiple flows overflowed the summit crater and traveled in five different directions on 24 August 2017.
Activity during January-May 2017. Steam, gas, and ash emissions were reported during 10 of the 12 clear days of January 2017 when observations could be made. The plume heights varied up to 3,000 m above the 3,600-m-altitude summit. Ashfall was reported in El Chaco (30 km SW) on 18 January; nine MODVOLC thermal alerts were reported during the month.
Clearer skies during February 2017 resulted in observations of gas, steam, and ash emissions during 18 days of the month. The plume heights ranged from 900-2,000 m above the summit crater. On 7-8 February, in addition to steam and ash emissions rising 1,500 m and drifting W, block avalanches were observed traveling 1,000-1,500 m down all the flanks. A pyroclastic flow also traveled 800 m down the S flank. On 13 February at 0806 local time, the pilot of a plane from Aerogal observed a vertical plume that reached 2,000 m above the summit; nearby lookouts reported explosion sounds, and slight ashfall was observed in Gonzalo Pizarro in the Sucumbíos province (about 40 km NE). Incandescence appeared at the summit six times in February, triggering 13 MODVOLC thermal alerts.
Ash plume heights in March 2017 ranged from 500-2,000 m during the 18 days they were observed. Although incandescence was seen at the summit seven times, block avalanches were observed on the flanks only twice, on 11 and 23 March, traveling 1,000 m down the flanks each time. A pyroclastic flow traveled 500 m from the summit on 16 March.
Activity increased significantly during April 2017; ash emissions, ranging from 200-2,000 m high were recorded on 21 days, and block avalanches were observed 12 days, traveling 600-1,500 m down the SE flank most of the time. The largest event, on 20 April, sent large blocks 1,800 m down all the flanks. A lava flow moved 1,600 m down the SW flank on 3 April. On 10 April, multiple emissions of steam and gas with moderate ash content reached 2,000 m above the summit crater. On 24 April, a 1,300-m-high ash plume was witnessed during a flyover.
Block avalanches continued at a high rate during May 2017, traveling 500-800 m down all the flanks on at least 10 days of the month. Ash emissions persisted and were observed on 18 of the 25 clear days, rising from 300 to over 800 m. In the early hours of 26 May, a cloud of material was observed on the S flank, likely from a pyroclastic flow.
Activity during June 2017. The technical staff of IG-EPN visited the NE flank of Reventador to monitor activity during 29 May-1 June 2017. They observed a small lava flow on the NE flank, several explosions and emissions associated with both the N and S vents at the summit, pyroclastic flows, 'chugging' (audible, closely spaced intermittent gas emissions), and the projection of ballistic material.
The new lava flow was located on the upper NE flank; the only movement they detected was collapsing of the front of the flow, which sent blocks down to the base of the cone. Explosions with ash emissions from the two vents generally occurred every 15-30 minutes. Gas and ash emissions generally rose 1-2 km high, and the larger explosions produced pyroclastic flows. The sounds of the explosions were audible 5-8 km from the volcano. The researchers used a thermal camera to record a small pyroclastic flow that lasted for about 1 minute and 16 seconds and reached 800 m in length. They also observed avalanche blocks from the S vent that rolled 1,200 m down the flank. The thermal camera measured temperatures as high as 521°C.
During a flyover on 7 June 2017, scientists observed recent pyroclastic flows around all the flanks, the largest ones, on the N and S flanks, reached 1.2 km. Volcanic bombs were visible around the periphery of the crater rim. The lava flow observed a few days earlier by the ground crew extended 200 m down the NNE flank, and did not appear to be associated with either of the summit vents. Several explosions were witnessed from the two vents at the summit crater (figure 63).
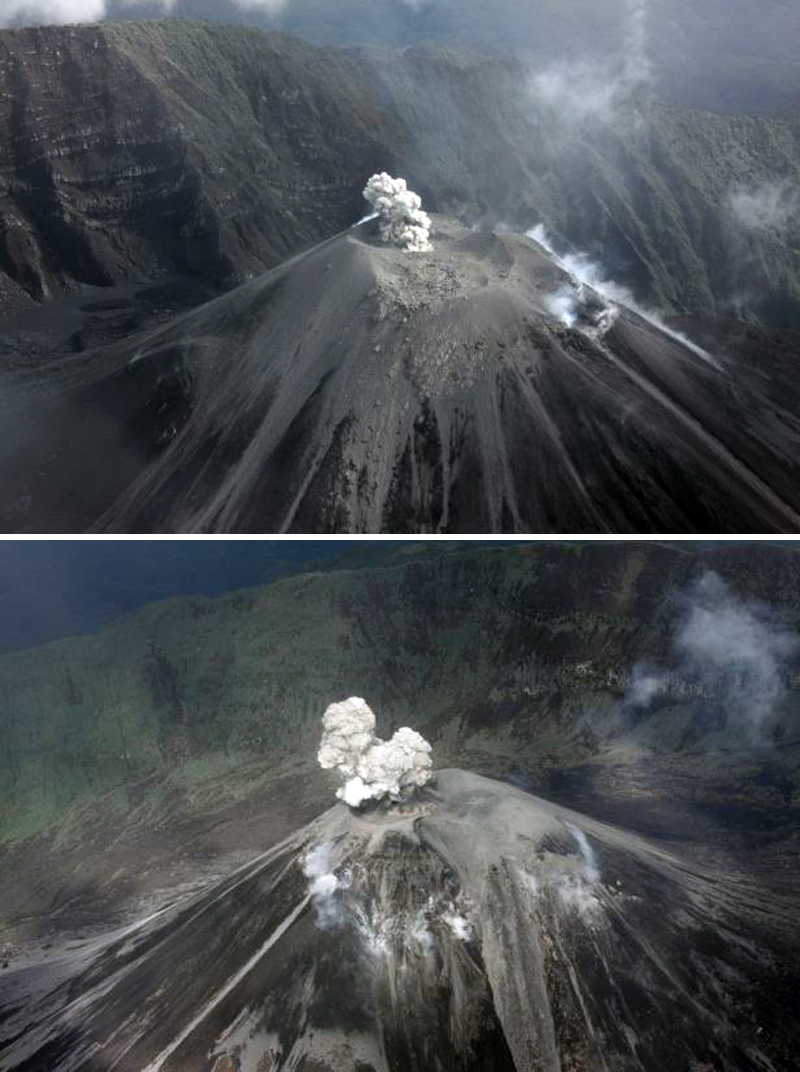 |
Figure 63. Two active vents were visible at the summit crater of the central cone at Reventador on 7 June 2017. Top: Steam and ash emerged from the N vent at the summit crater, and fumarolic activity rose from the NE flank in this view to the NE. Bottom: A lava flow created a pale scar on the NE flank (foreground), while ash and steam emissions rose from the summit crater in this view looking SW. Photos by P Ramón, courtesy of IG-EPN (Informe Especial No. 2-Volcan El Reventador, Observaciones entre 29 de mayo -01 junio y 7 de junio 2017, 26 junio 2017). |
Thermal imagery taken during the 7 June overflight revealed three emission centers at the summit; the two vents inside the crater that produced explosions with ash, larger bombs, and pyroclastic flows, and a fissure on the NE flank about 70 m below the summit that produced the lava flow (figure 64). The highest temperatures were measured in the N vent (Vento Norte).
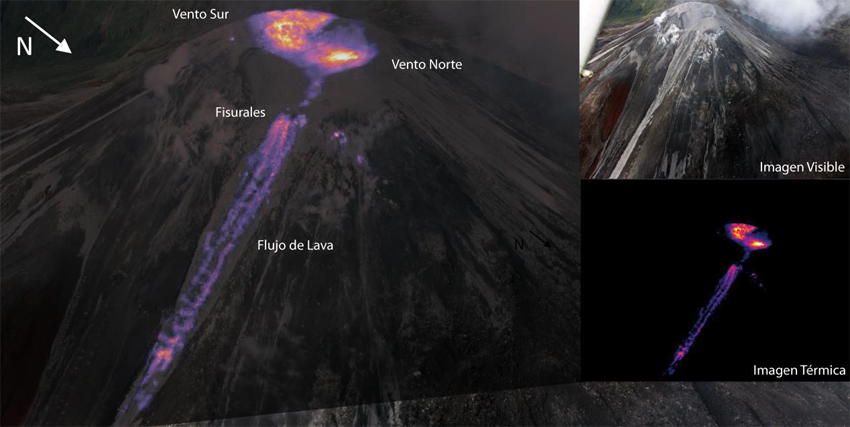 |
Figure 64. Thermal imagery taken during the overflight of Reventador on 7 June 2017 revealed three emission centers at the summit; the two vents inside the crater (Vento Sur, Vento Norte) produced explosions with ash, larger bombs and pyroclastic flows, and a fissure on the NE flank (fisurales) that produced a small lava flow (flujo de lava). Inset photos show visible image (top right) and thermal image (bottom right) of summit. Courtesy of IG-EPN (Informe Especial No. 2-Volcan El Reventador, Observaciones entre 29 de mayo -01 junio y 7 de junio 2017, 26 junio 2017). |
In a special report on 23 June 2017, IG-EPN noted that Reventador had averaged about 50 daily explosions in recent months, as well as a similar number of LP earthquakes. During 22-24 June, a continuous seismic tremor was recorded (figure 62), along with more episodic tremors that included small explosions. Surface activity included pyroclastic flows down all the flanks, and ash plumes that rose about 2.5 km and drifted W. The pyroclastic flows sent material as far as 4 km to the E of the cone, into the headwaters of the El Reventador River (figure 65). IG-EPN reported that the pyroclastic flows generated during this event were the strongest since 2002.
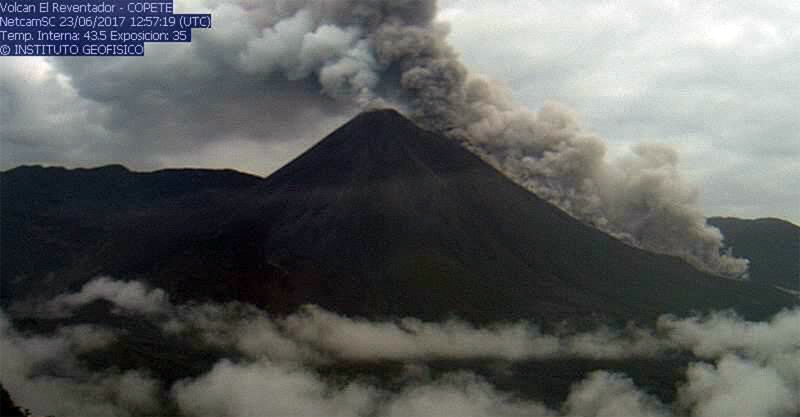 |
Figure 65. A large pyroclastic flow on 23 June 2017 traveled down the NE flank of Reventador at 0757 local time, as viewed from the Copete webcam on the SE edge of the caldera. Courtesy of IG-EPN (Informe Especial No. 1-Volcan El Reventador, Cambio en la actividad eruptive, 23 junio 2017). |
The tremors were associated with a new emission of lava that advanced rapidly down the NE flank of the cone and was active until 1 July. It traveled about 2.65 km before stopping, and was nearly 250 m wide near the base (figure 66). IG-EPN reported that the lava flow was the longest since 2008 and covered and area of just under 0.5 km2. In addition to pyroclastic flows and a lava flow, a significant SO2 plume was released on 24 June 2017 (figure 67). Ash emissions were reported on 22 days during June. Plume heights ranged substantially from less than 200 m to over 2,000 m. Block avalanches traveling up to 800 m down the flanks were reported on ten days, and 20 MODVOLC thermal alerts were issued.
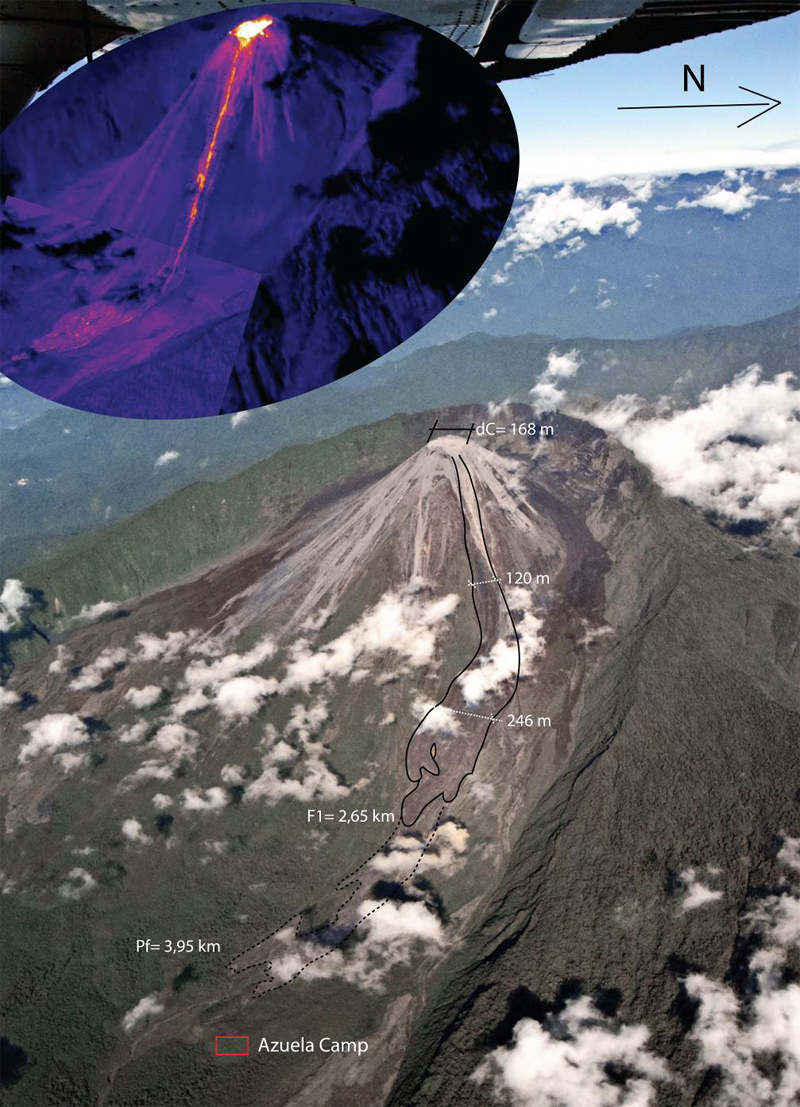 |
Figure 66. The lava flow and pyroclastic flows of 23 June-1 July 2017 at Reventador were measured in an overflight on 21 July by IG-EPN. dC is the diameter of the summit crater (168 m). The width of the flow was about 120 m partway down the flank, and 246 m at its widest point. It traveled a distance of 2.65 km (F1) from the summit. The pyroclastic flow was measured at 3.95 km (Pf) from the summit. Inset thermal image shows lava flow during the same overflight. Photo by St. Almeida, courtesy of IG-EPN (Erupción de junio de 2017 del volcán El Reventador, Reporte de erupción, volcán El Reventador, 2017-01, Publicado el 19 de septiembre de 2017). |
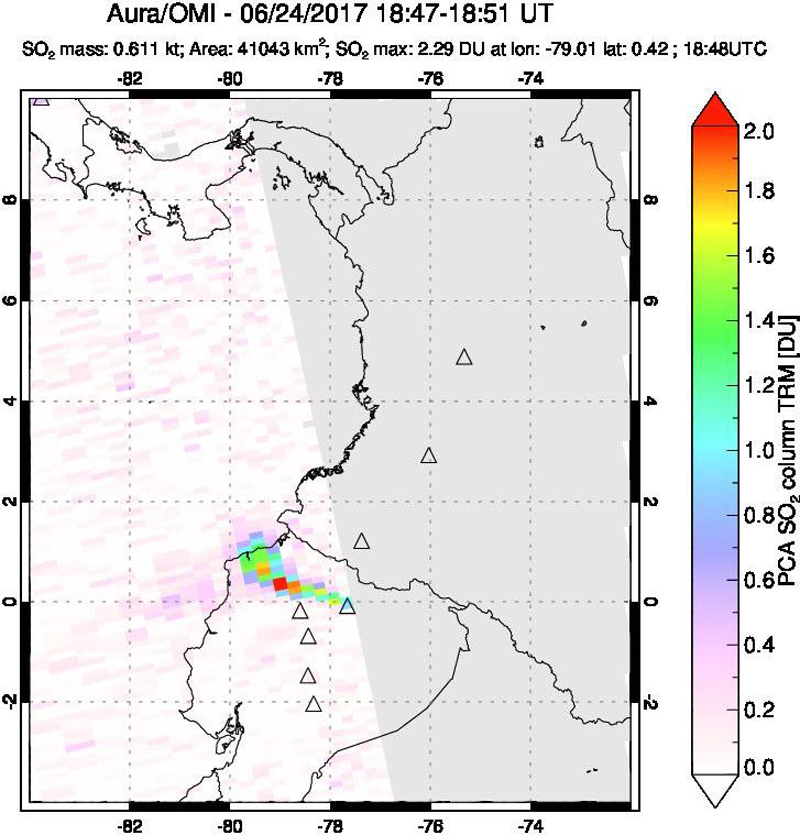 |
Figure 67. An SO2 plume captured by the OMI instrument on the Aura satellite on 24 June 2017 drifted WNW from Reventador. It coincided in time with an eruptive episode that also produced several pyroclastic flows and a 2.65-km-long lava flow. Courtesy of NASA Goddard Space Flight Center. |
Activity during July-September 2017. There were fewer observations of ash emissions during July, on only 17 days, with plume heights ranging from 200-1,500 m (figure 68). Twelve MODVOLC thermal alerts were issued and block avalanches were reported on nine different days moving 200-800 m down all the flanks. A pyroclastic flow reported on 6 July traveled 800 m down the E flank. By the time of the 21 July overflight by IG-EPN, the two summit vents had merged, block avalanches surrounded the rim, and the still-warm flow was visible on the NE flank (figure 69). A visit by IG-EPN scientists on 1 August confirmed the continuing audible explosions, as well as the cooling of the late June lava flow (figure 70).
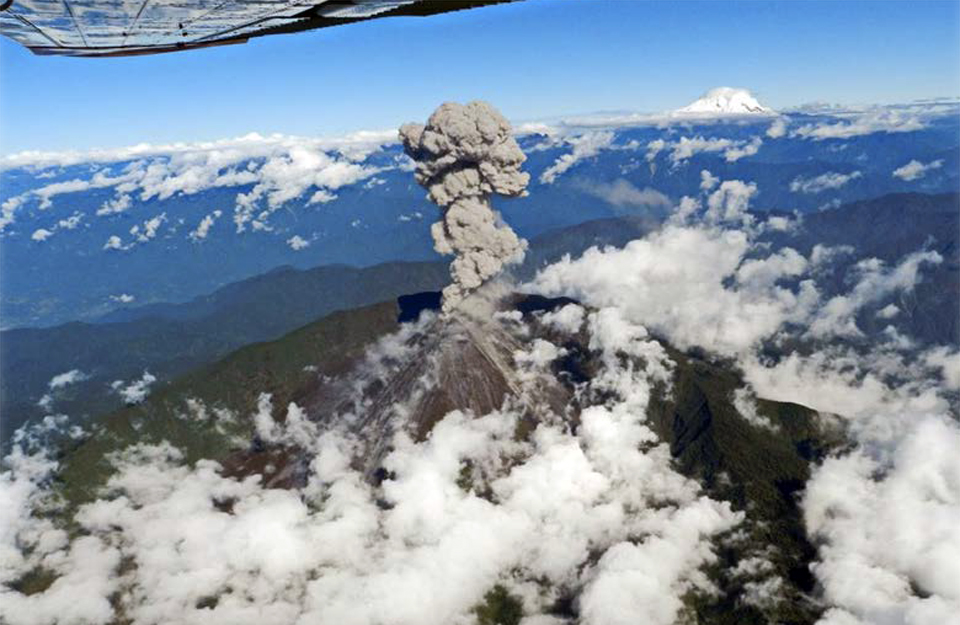 |
Figure 68. A dense ash plume rose 1.5 km above the summit crater and drifted N at Reventador during a flyover by IG-EPN on 21 July 2017. Glacier-covered Volcán Cayambe appears in the distance to the NW (right of the ash plume). Courtesy of IG-EPN (Erupción de junio de 2017 del volcán El Reventador, Reporte de erupción, volcán El Reventador, 2017-01, Publicado el 19 de septiembre de 2017). |
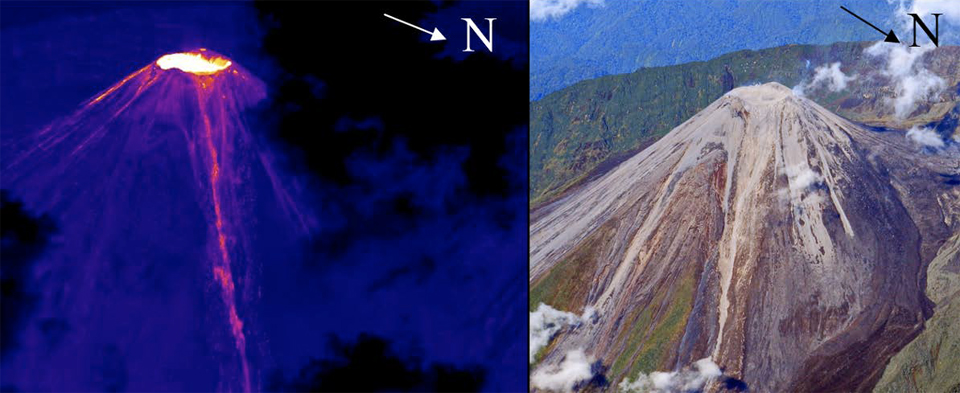 |
Figure 69. Thermal and visible images of Reventador on 21 July 2017 reveal a single strong thermal anomaly at the summit, block avalanches and bombs around the rim, and a still warm lava flow on the NE flank, dark brown in the visible image on the right. Photo by Almeida, courtesy of IG-EPN (Erupción de junio de 2017 del volcán El Reventador, 2017-01, Publicado el 19 de septiembre de 2017). |
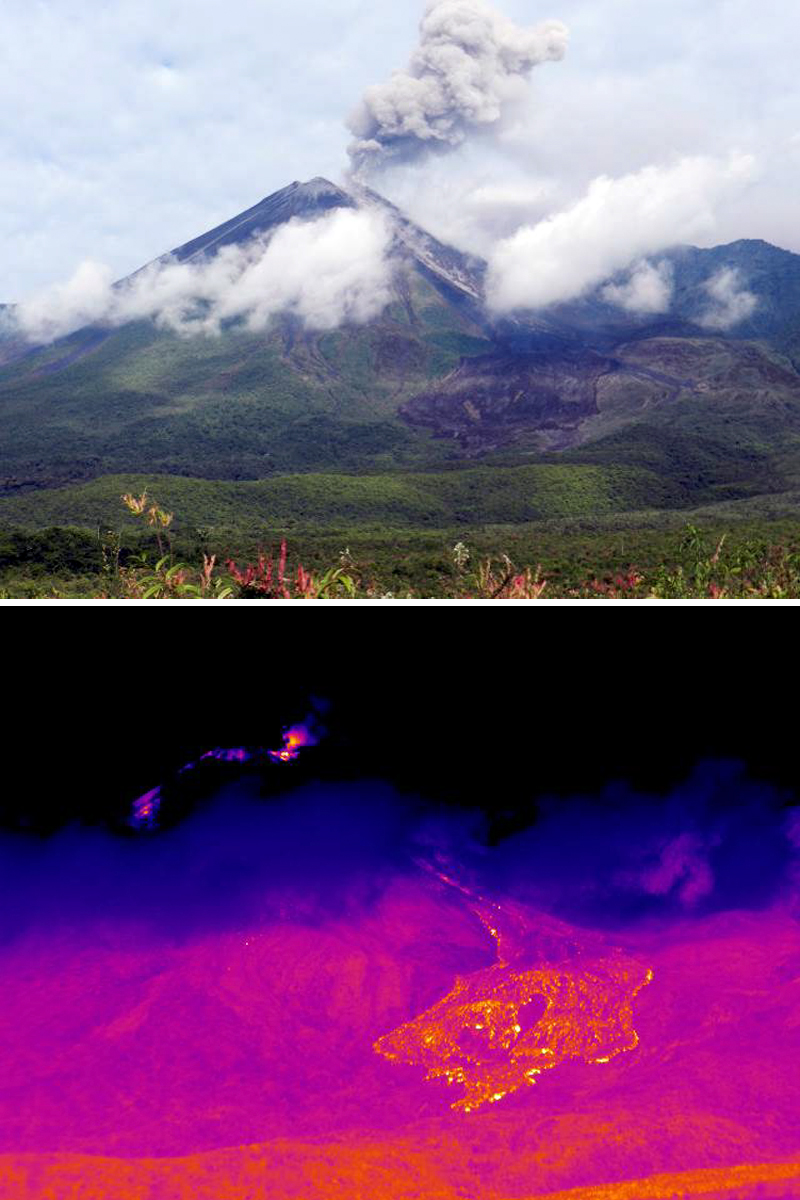 |
Figure 70. Ash emissions and the cooling lava flow on the NE flank of Reventador on 1 August 2017. Top: An ash-laden emission rose from the summit of the cone; the fresh dark brown lava flow is visible on the lower flank. Bottom: The same image from the thermal camera showed the residual heat from the lava flow (lower right), active heat from the ash emission, and a warm area on the upper flank (upper left), likely from block avalanches or a smaller flow. Photo and Image by M. Almeida, courtesy of IG-EPN (Erupción de junio de 2017 del volcán El Reventador, Reporte de erupción, volcán El Reventador, 2017-01, Publicado el 19 de septiembre de 2017). |
The frequency of eruptive activity increased substantially during August 2017. Ash emissions were reported on 29 days of the month most rising over 500 m; block avalanches occurred on at least 25 days sending debris as far as 1,000 m down all the flanks. Pyroclastic flows were reported twice, during 11-12 and 23-24 August (figure 71). Lava flows descended multiple flanks simultaneously on 23 August (figure 72).
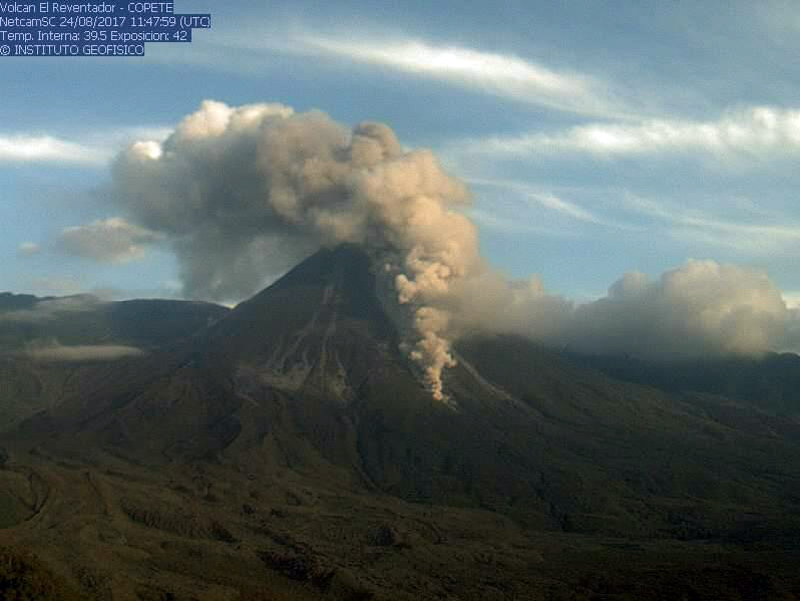 |
Figure 71. A pyroclastic flow descended the SE flank of Reventador during the early morning of 24 August 2017 in this image taken by the IG Copete webcam. Courtesy IG-EPN (Informe del estado del Volcan Reventador No. 236, Jueves, 24 de agosto de 2017). |
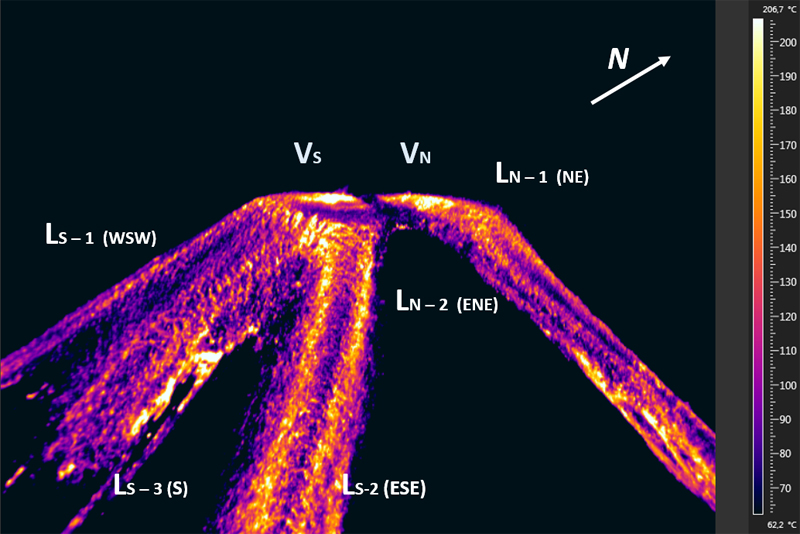 |
Figure 72. Lava flows descended multiple flanks of Reventador simultaneously on 23 August 2017 in this infrared image. Five lava flows emerged from both the N and S vents at the summit of the central cone. Ln-1 flowed NE from the N vent and Ln-2 flowed ENE from the N vent. Three flows emerged from the S vent, Ls-1 flowed WSW, Ls-2 flowed ESE, and Ls-3 flowed S. Image by M. Almeida, processing by M.-F. Naranjo, courtesy of IG-EPN (Informe Especial del Volcán El Reventador, 2017, N° 4, Continúa la erupción, alternancia de actividad efusiva y explosive, 14 de septiembre del 2017). |
The Washington VAAC issued 114 aviation alerts during August 2017 and 123 during September, indicating a continued level of high eruptive activity; plume heights were reported as high as 3,500 m above the summit, and block avalanches covered most of the upper cone down to 900 m a number of times during both months (figure 73).
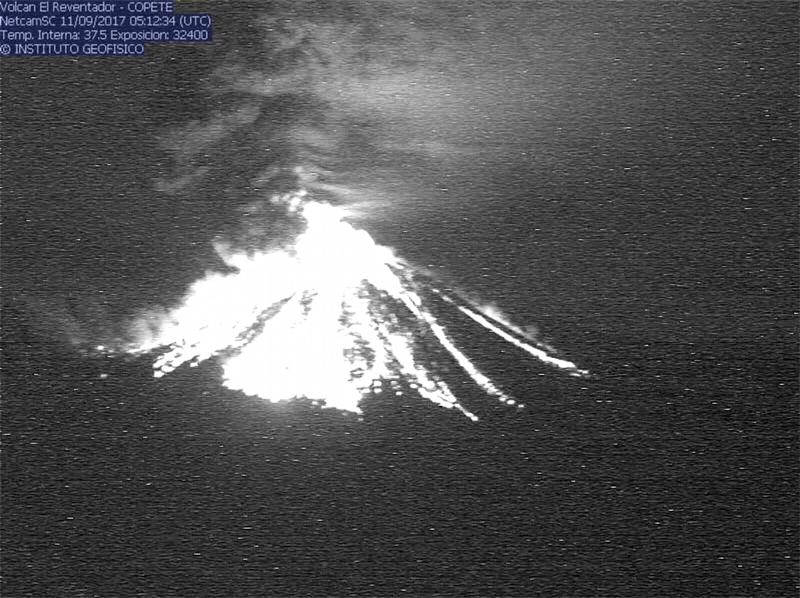 |
Figure 73. Explosions with rolling incandescent blocks descend 900 m on all sides of Reventador on 11 September 2017 in this image from the Copete webcam. Courtesy of IG-EPN (Informe Especial del Volcán El Reventador, 2017, N° 4, Continúa la erupción, alternancia de actividad efusiva y explosive, 14 de septiembre del 2017). |
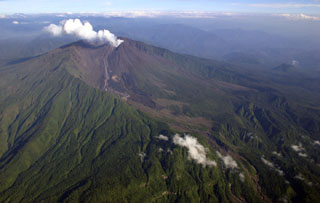
Geological Summary. Volcán El Reventador is the most frequently active of a chain of Ecuadorian volcanoes in the Cordillera Real, well east of the principal volcanic axis. The forested, dominantly andesitic stratovolcano has 4-km-wide avalanche scarp open to the E formed by edifice collapse. A young, unvegetated, cone rises from the amphitheater floor to a height comparable to the rim. It has been the source of numerous lava flows as well as explosive eruptions visible from Quito, about 90 km ESE. Frequent lahars in this region of heavy rainfall have left extensive deposits on the scarp slope. The largest recorded eruption took place in 2002, producing a 17-km-high eruption column, pyroclastic flows that traveled up to 8 km, and lava flows from summit and flank vents.
Information Contacts: Instituto Geofísico (IG), Escuela Politécnica Nacional, Casilla 17-01-2759, Quito, Ecuador (URL: http://www.igepn.edu.ec/); Washington Volcanic Ash Advisory Center (VAAC), Satellite Analysis Branch (SAB), NOAA/NESDIS OSPO, NOAA Science Center Room 401, 5200 Auth Rd, Camp Springs, MD 20746, USA (URL: www.ospo.noaa.gov/Products/atmosphere/vaac, archive at: http://www.ssd.noaa.gov/VAAC/archive.html); MIROVA (Middle InfraRed Observation of Volcanic Activity), a collaborative project between the Universities of Turin and Florence (Italy) supported by the Centre for Volcanic Risk of the Italian Civil Protection Department (URL: http://www.mirovaweb.it/); Hawai'i Institute of Geophysics and Planetology (HIGP), MODVOLC Thermal Alerts System, School of Ocean and Earth Science and Technology (SOEST), Univ. of Hawai'i, 2525 Correa Road, Honolulu, HI 96822, USA (URL: http://modis.higp.hawaii.edu/); NASA Goddard Space Flight Center (NASA/GSFC), Global Sulfur Dioxide Monitoring Page, Atmospheric Chemistry and Dynamics Laboratory, 8800 Greenbelt Road, Goddard, Maryland, USA (URL: https://so2.gsfc.nasa.gov/).