Tungurahua
Ecuador
1.467°S, 78.442°W; summit elev. 5023 m
All times are local (unless otherwise noted)
Episodic eruptive activity at Ecuador's Tungurahua has persisted since November 2011. Periods of activity over several weeks that included ash plumes, Strombolian activity, pyroclastic flows, and lava flows were often followed by quiescence for a similar time span. This type of activity continued throughout 2015 (BGVN 42:08, 42:12); Strombolian activity, significant ash emissions, and SO2 plumes in mid-November 2015 marked the last significant activity for that year. The next episode began in late February 2016 and is discussed below with information provided by the Observatorio del Volcán Tungurahua (OVT) of the Instituto Geofísico (IG-EPN) of Ecuador, aviation alerts from the Washington Volcanic Ash Advisory Center (VAAC), and other sources of satellite data.
The latest eruptive episode at Tungurahua lasted from 26 February-16 March 2016. Multiple explosions with ash plumes that rose 3-8 km were frequent. Incandescent blocks were ejected up to 1,500 m down most flanks. Pyroclastic flows affected many of the ravines, although no communities reported damage. Significant SO2 emissions were recorded by satellite data between 27 February-8 March. An inflationary trend was recorded from early March through late September 2016, after which a period of deflation began. Tungurahua had occasional seismic swarms after the eruption, but no reported surface activity for the remainder of 2016 and 2017.
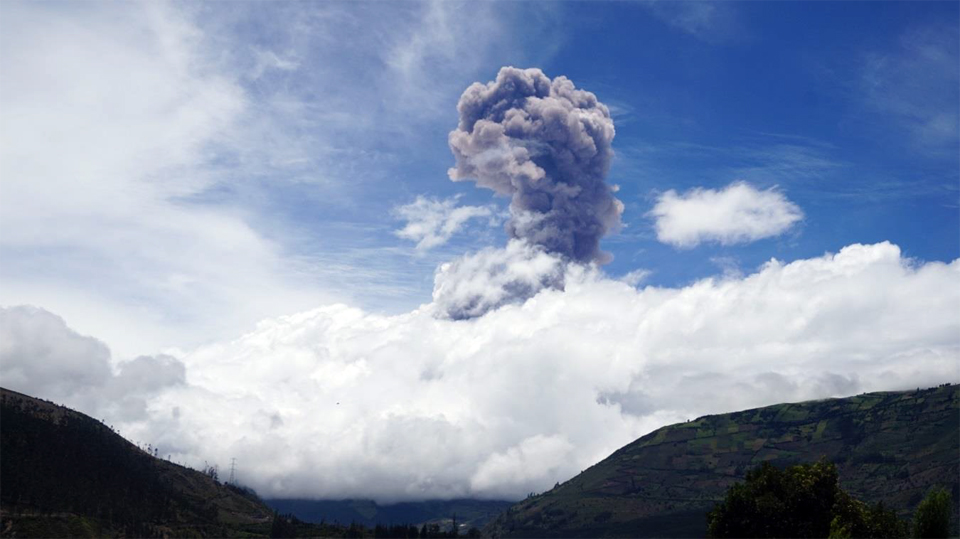
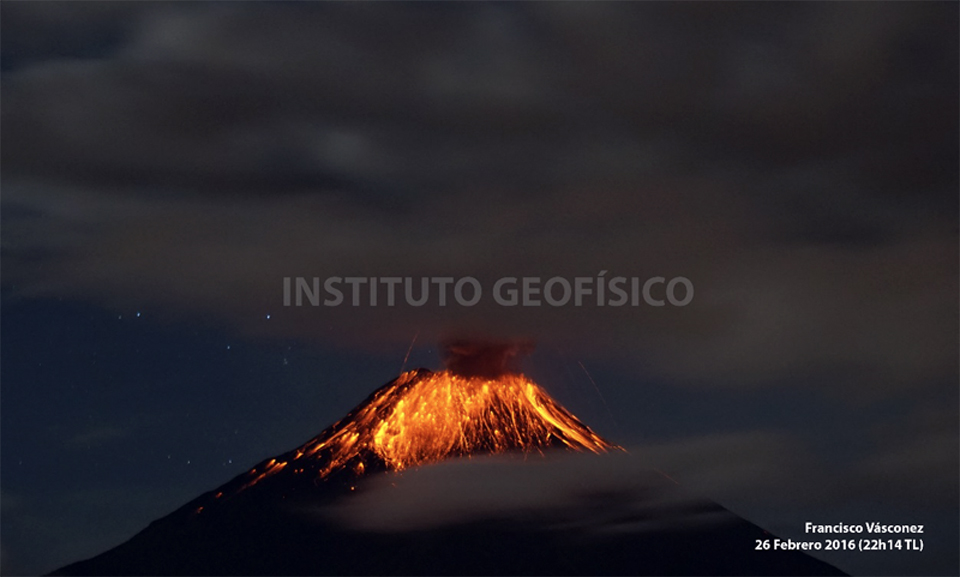
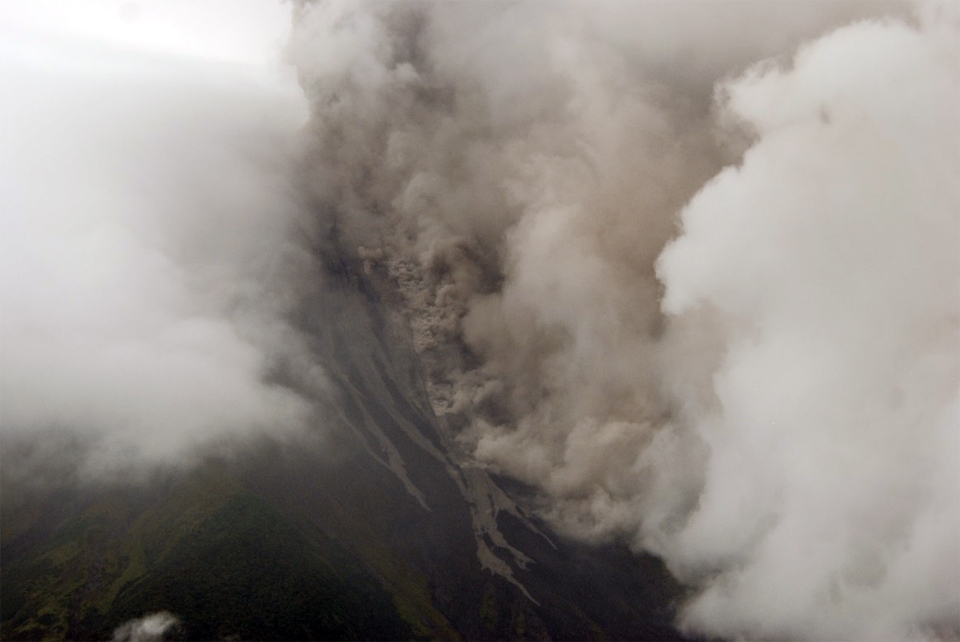
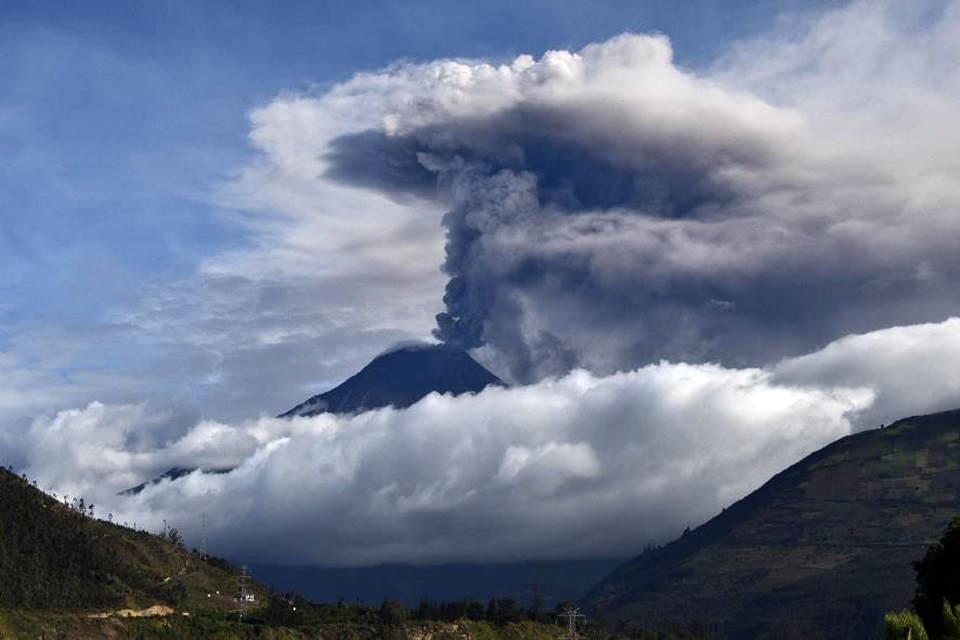
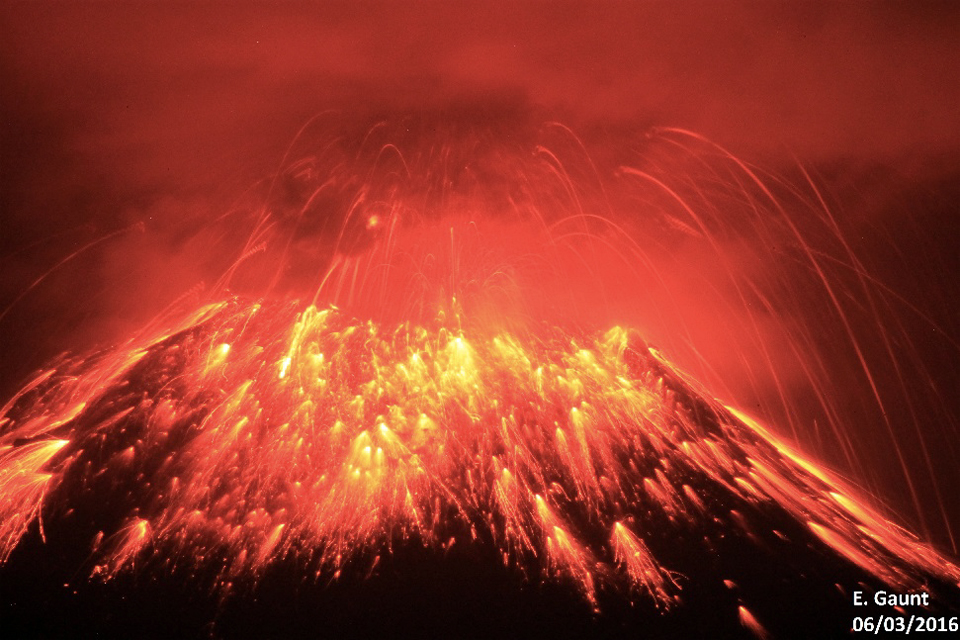
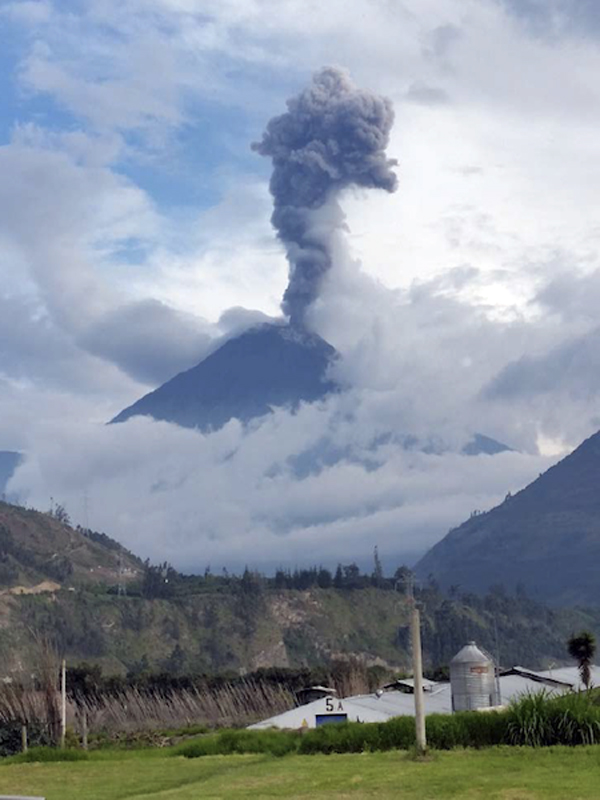
IG reported an ash emission on 5 January 2016 that rose 2 km above the crater and drifted NE, causing minor ashfall in the Pondoa and Bilbao sectors. Otherwise, no volcanic activity was reported until a new episode began on 26 February 2016 with a seismic swarm followed by a series of explosions and ash plumes that rose 3-8 km above the crater (figures 96 and 97). Incandescent blocks were ejected up to a kilometer down the NW, W, and SW flanks (figure 98). Pyroclastic flows were also generated that descended through the gorges of Juive, La Hacienda, Mandur and Cusúa, reaching distances of 500-1,500 m (figure 99).
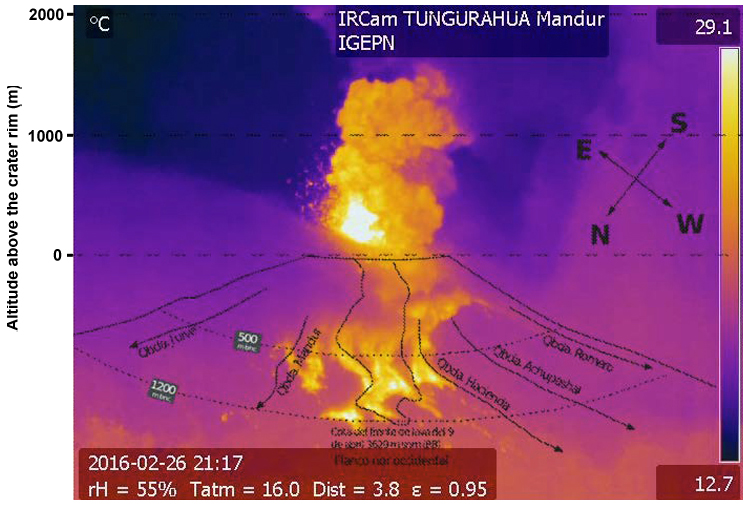
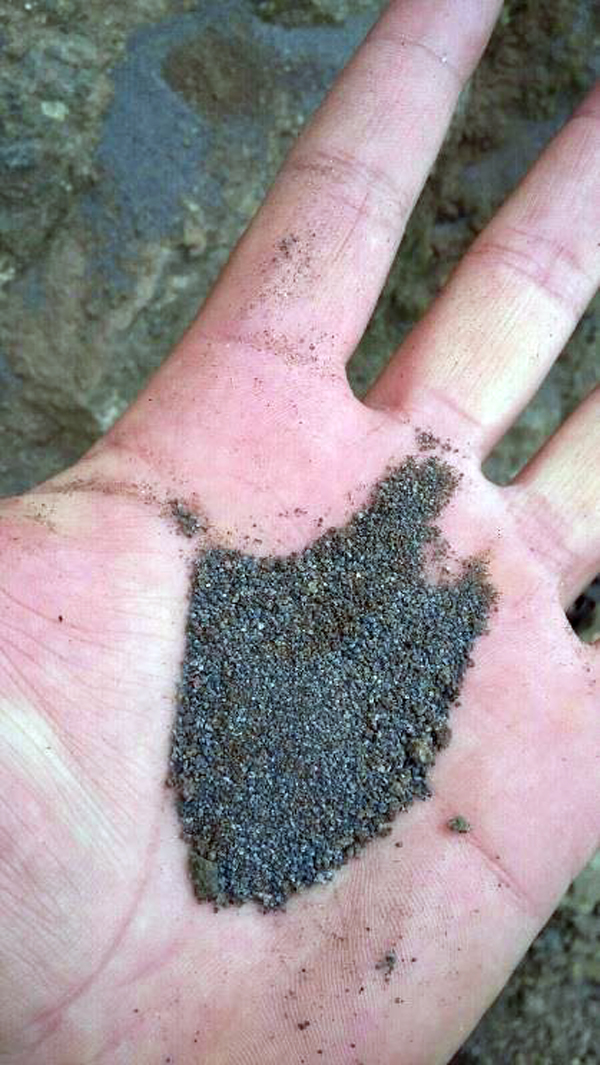
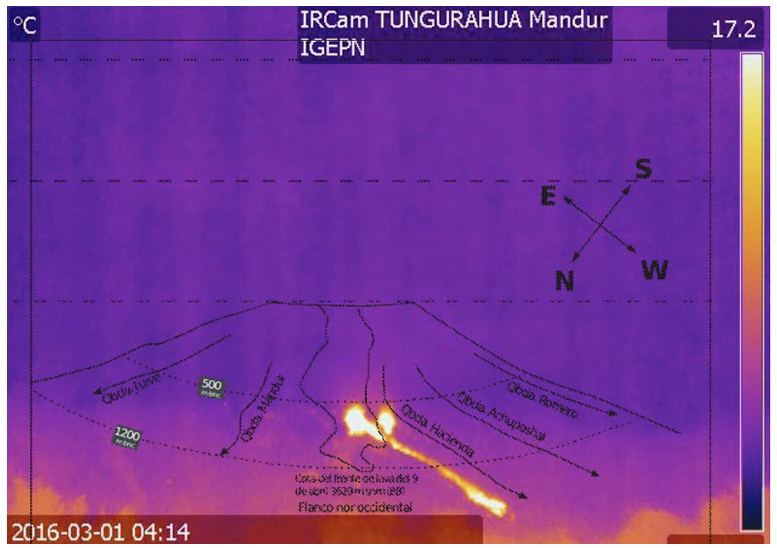
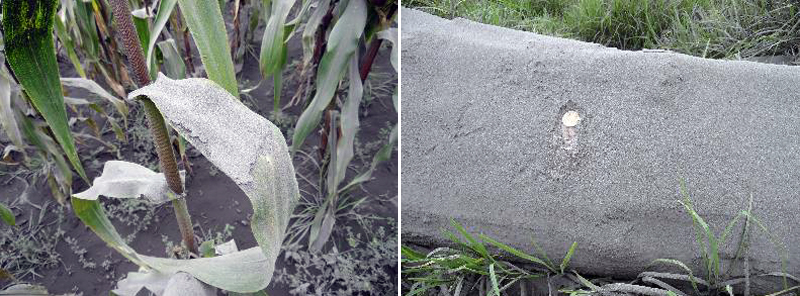
Continuous emissions with low to moderate ash content drifted W and SW on 27 February. The communities most affected by ashfall were Choglontus, Cotaló, El Manzano, Palitahua, Bilbao, Pillate, Juive, Ambato, Tisaleo, Riobamba, and Quero. The ash was mostly fine-grained, except in the area near Pillate and Choglontus, where the grain size reached up to 3 mm and consisted of reddish, black, gray, and beige fragments (figure 100). On the morning of 1 March 2015, several pyroclastic flows were observed descending through the Juive, Mandur, Achupashal, La Hacienda, and Romero ravines; they traveled 1.5-1.7 km (figure 101).
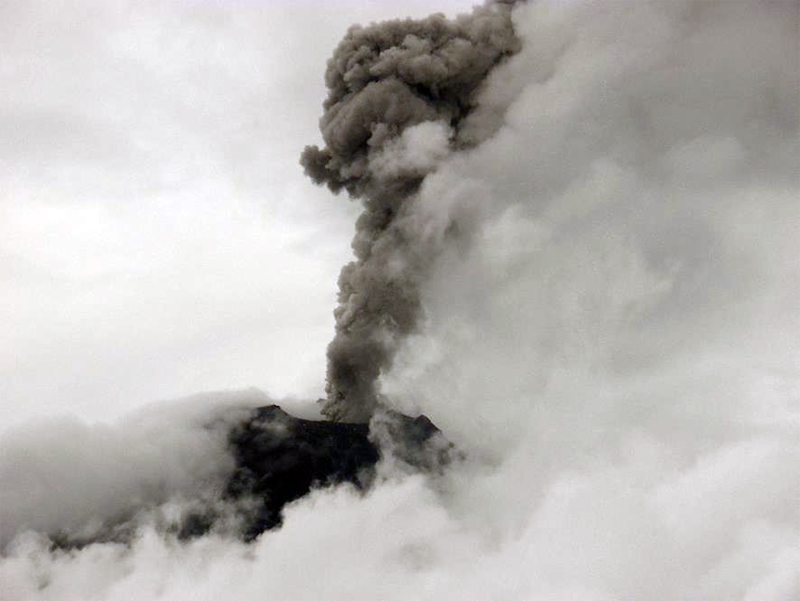
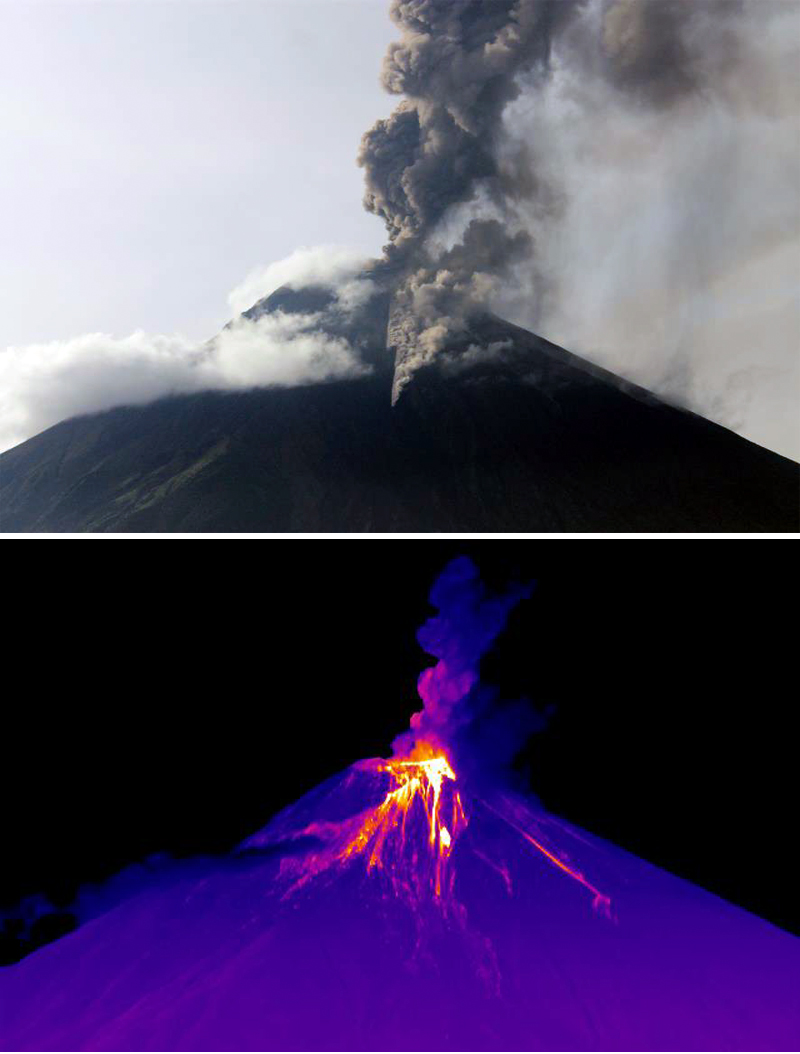
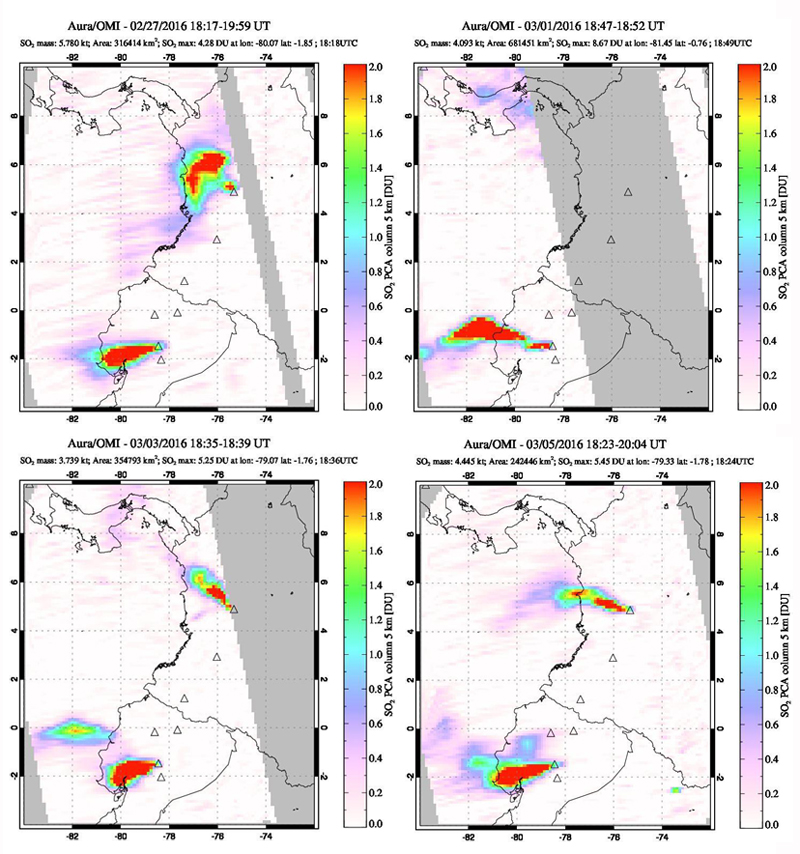
Ash emissions were constant throughout the first week in March (figures 102 and 103). During 1-5 March they drifted NW, SW and E, with ashfall reported in the towns of Pillate, Manzano, Choglontus, Palictahua and El Altar (figure 104). Incandescent blocks descended most of the flanks (figure 105). Beginning on 6 March, plumes drifted SW and S, with variable ash content. Pyroclastic flows along the W and NW flanks descended the Cusua, Juive, Mandur, Ashupashal, Romero, and Rhea drainages (figure 106), the farthest traveled went 2.2 km down the Ashupashal on 7 March. In addition to ash and other explosive debris, daily sulfur dioxide emissions were identified from 27 February-8 March 2016 by the OMI instrument on the Aura satellite (figure 107).
Beginning on 28 February, a strong inflationary trend (almost 3 cm) was observed in the GPS data at the Mazón (SW flank) station. Three inclinometers on the NW flank also indicated inflation during 28 February-4 March.
Episodic explosions on 8 March 2016 produced plumes with high ash contents that rose 6 km. Small pyroclastic flows descended the NW flank in the Mandur, Rea, Achupashal, and La Hacienda ravines. Sporadic emissions continued for most of the second week of March, with varying ash contents, reaching between 1.5 and 4 km above the crater and drifting to the SSW. Reports of ashfall were received in the sectors of Choglontús, Manzano, Pillate, El Altar, and Palitahua, and minor ashfall in Juive and Cusúa. Several ash plumes (figure 108) and a small pyroclastic flow were observed on 13 March 2016. The Manzano lookout reported loud noises on 14 March, and ashfall in the afternoon, but weather obscured views of emissions. Rainy weather on 16 March also obscured views, but Manzano, Chacauco, Cusúa, and Juive lookouts reported ashfall and explosions. There were no further reports from the observatory of ash emissions, ashfall, or explosions; only minor steam plumes were observed on clear days after 16 March 2016.
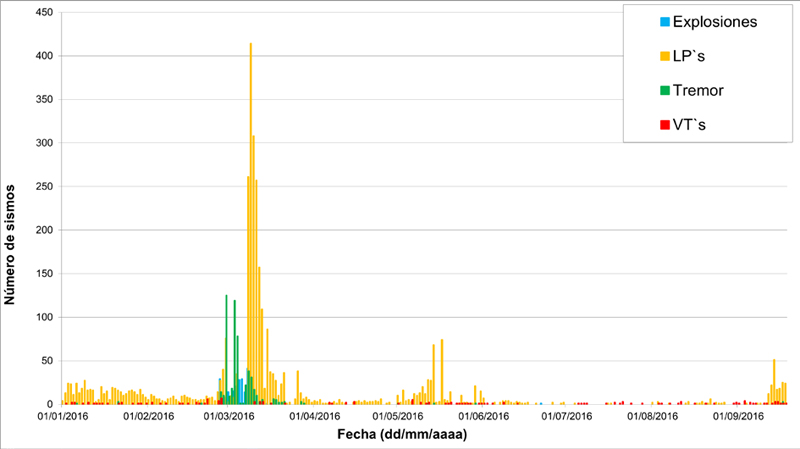
The Washington VAAC reported possible ash emissions on 31 March 2016, but information from OVT indicated no surface activity. Intense rain on 28 March generated a small lahar that descended through the La Pampa ravine. Significant rainfall on 2 April caused lahars to affect Vazcun, Juive, Pondoa, Bilbao, Achupashal, Chontapamba and Malpayacu drainages. Seismicity continued to decrease throughout April 2016. A small swarm of Long Period seismic events (LP's) occurred between 1 and 20 May that were associated with fluid movements. The Washington VAAC reported ash emissions on 3, 8, and 13 May, but OVT reported no surface activity during the entire month (figure 109).
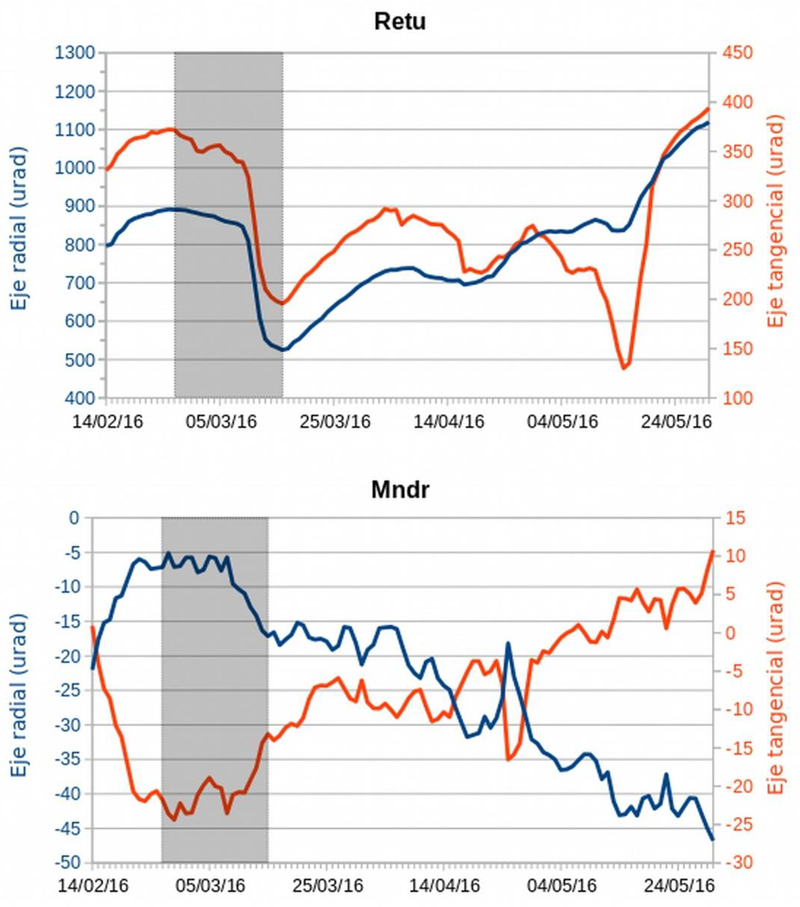
In a Special Report released on 2 June 2016, IG-EPN noted a clear inflationary trend in data collected from two stations at Tungurahua since the end of the eruption in mid-March. The Retu inclinometer, located N of the crater, showed inflation on the radial axis of about 600 μrad (microradians), and about 200 μrad on the tangential axis. The same axis at the Mandur inclinometer (on the NW flank) had a smaller but distinct (~30 μrad) inflationary signal (figure 110).
A Washington VAAC report on 1 June 2016 noted that the Guayaquil Meteorological Weather Office (MWO) reported an ash plume at Tungurahua, but OVT confirmed no surface activity. A very small lahar was recorded in the La Pampa ravine on 2 June. Although there were rains of varying intensity many days during June, they did not generate significant lahars, except one of medium size that occurred on 21 June in the Achupashal ravine. The Washington VAAC noted a report from the Guayaquil MWO of an ash emission on 5 July, but it was not detected in satellite imagery, and the OVT reported no surface activity. There was no surface activity reported by OVT from July to mid-September (figure 111), and internal seismicity remained very low. Occasional rainy periods generated muddy water in the ravines, but no significant lahars were reported.
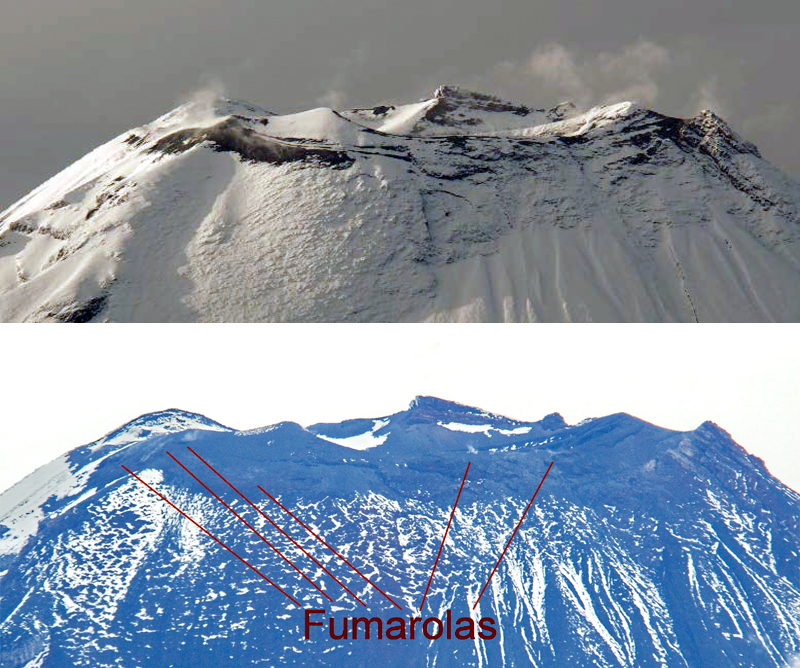
A significant increase in the number of LP seismic events began on 12 September 2016, and a small seismic swarm was recorded on 18 September (figure 112). Small fumaroles were visible at the edges of the crater on 15 and 16 September (figure 113). At this same time, the inflationary trend that had been ongoing since the eruption earlier in the year switched to deflation as measured at the Retu inclinometer.
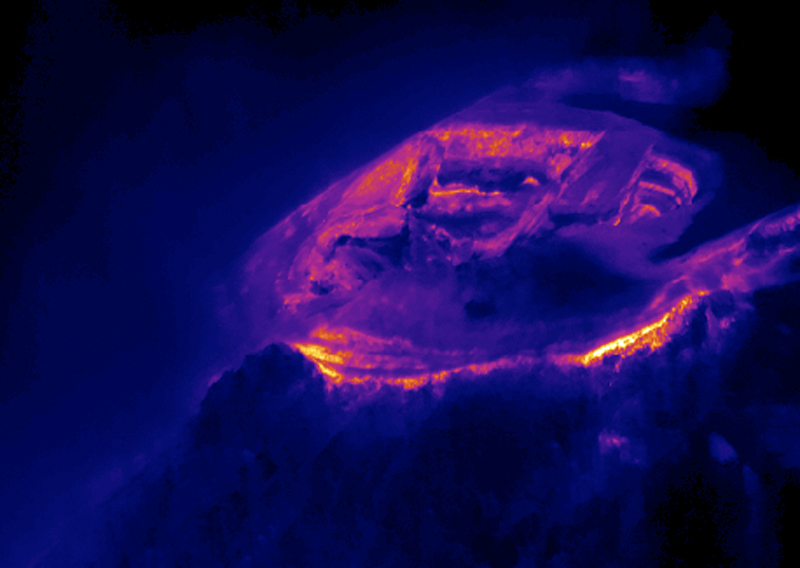
Another increase in LP seismicity and tremors occurred on 24 September, but there were no reports of surface activity other than minor steam fumaroles. Seismicity remained elevated through early October; a one-hour tremor event was reported on 1 October. Seismicity decreased gradually over the following two weeks. Low-energy steam and gas emissions from fumaroles located on the S and SW flanks were observed during a flyover on 7 October 2016. This corresponded to the warmest areas revealed in the thermal image of the summit (figure 114). with a TMA (maximum apparent temperature) of 47.9°C and 36.5°C.
Re-suspended ash from high winds in mid-November 2016 caused several VAAC notices to be issued, but no new emissions were reported by OVT through the end of 2016.
Tungurahua remained quiet throughout 2017. A 90-minute seismic swarm on 8 January 2017 and a minor increase in seismicity in the second half of March were the only seismic events above background levels. There were no emissions except for occasional minor fumarolic activity around the crater rim. Periods of heavy rainfall occasionally produced muddy water in the ravines; the only lahars were reported during 5-6 January, late April and 15 November.
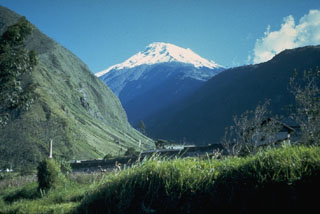
Geological Summary. Tungurahua, a steep-sided andesitic-dacitic stratovolcano that towers more than 3 km above its northern base, is one of Ecuador's most active volcanoes. Three major edifices have been sequentially constructed since the mid-Pleistocene over a basement of metamorphic rocks. Tungurahua II was built within the past 14,000 years following the collapse of the initial edifice. Tungurahua II collapsed about 3,000 years ago and produced a large debris-avalanche deposit to the west. The modern glacier-capped stratovolcano (Tungurahua III) was constructed within the landslide scarp. Historical eruptions have all originated from the summit crater, accompanied by strong explosions and sometimes by pyroclastic flows and lava flows that reached populated areas at the volcano's base. Prior to a long-term eruption beginning in 1999 that caused the temporary evacuation of the city of Baños at the foot of the volcano, the last major eruption had occurred from 1916 to 1918, although minor activity continued until 1925.
Information Contacts: Instituto Geofísico (IG), Escuela Politécnica Nacional, Casilla 17-01-2759, Quito, Ecuador (URL: http://www.igepn.edu.ec ); NASA Goddard Space Flight Center (NASA/GSFC), Global Sulfur Dioxide Monitoring Page, Atmospheric Chemistry and Dynamics Laboratory, 8800 Greenbelt Road, Goddard, Maryland, USA (URL: https://so2.gsfc.nasa.gov/); Washington Volcanic Ash Advisory Center (VAAC), Satellite Analysis Branch (SAB), NOAA/NESDIS OSPO, NOAA Science Center Room 401, 5200 Auth Rd, Camp Springs, MD 20746, USA (URL: www.ospo.noaa.gov/Products/atmosphere/vaac, archive at: http://www.ssd.noaa.gov/VAAC/archive.html).