Report on Erta Ale (Ethiopia) — April 2018
Bulletin of the Global Volcanism Network, vol. 43, no. 4 (April 2018)
Managing Editor: Edward Venzke.
Edited by A. Elizabeth Crafford.
Erta Ale (Ethiopia) New eruptive event forms lava lake and multiple large flow fields 3 km S of South Pit Crater, January 2017-March 2018
Please cite this report as:
Global Volcanism Program, 2018. Report on Erta Ale (Ethiopia) (Crafford, A.E., and Venzke, E., eds.). Bulletin of the Global Volcanism Network, 43:4. Smithsonian Institution. https://doi.org/10.5479/si.GVP.BGVN201804-221080
Erta Ale
Ethiopia
13.601°N, 40.666°E; summit elev. 585 m
All times are local (unless otherwise noted)
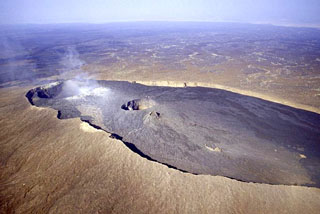
Ethiopia's Erta Ale basaltic shield volcano has had at least one active lava lake since the mid-1960s, and possibly much earlier. Two active craters (North Pit and South Pit) within the larger oval-shaped Summit Caldera have exhibited periodic lava fountaining and lava lake overflows over the years. A new eruptive event located about 3 km SE of the Summit Crater appeared on 21 January 2017. Activity at the eruption site increased during subsequent months, sending lava flows several kilometers NE and SW from a newly formed lava lake. This report discusses activity from February 2017 through March 2018 as the flows traveled as far as 16 km from the main vent. Information comes from satellite thermal and visual imagery, and photographs and reports from ground-based expeditions that periodically visit the site.
Summary of activity, February 2017-March 2018. The 21 January 2017 activity at Erta Ale was the first time a vent outside of the Summit Caldera has been observed (figure 50). The initial vent or vents created multiple lava flows that traveled generally NE and SW from their sources, creating at least one lava lake that persisted for about a year (figure 51). The flows began inside an older caldera at a location about 3 km SE of the South Pit Crater, but eventually overflowed the caldera rim in multiple directions. As the flow fields enlarged, thermal imagery captured hot-spots along the flows that were likely produced by breakouts, skylights into lava tunnels, and hornitos, as well as multiple surges of flows across the growing fields (figure 52). The imagery also showed the locations of the advancing flow fronts which had reached over 5 km SW of the source by August 2017 and over 16 km NE of the source by March 2018, eventually reaching the alluvial plain NE of Erta Ale. Thermal anomaly data indicated that the maximum thermal energy output happened in April 2017, gradually decreasing through March 2018. The far NE front of the northeast flow field was still active at end of March 2018.
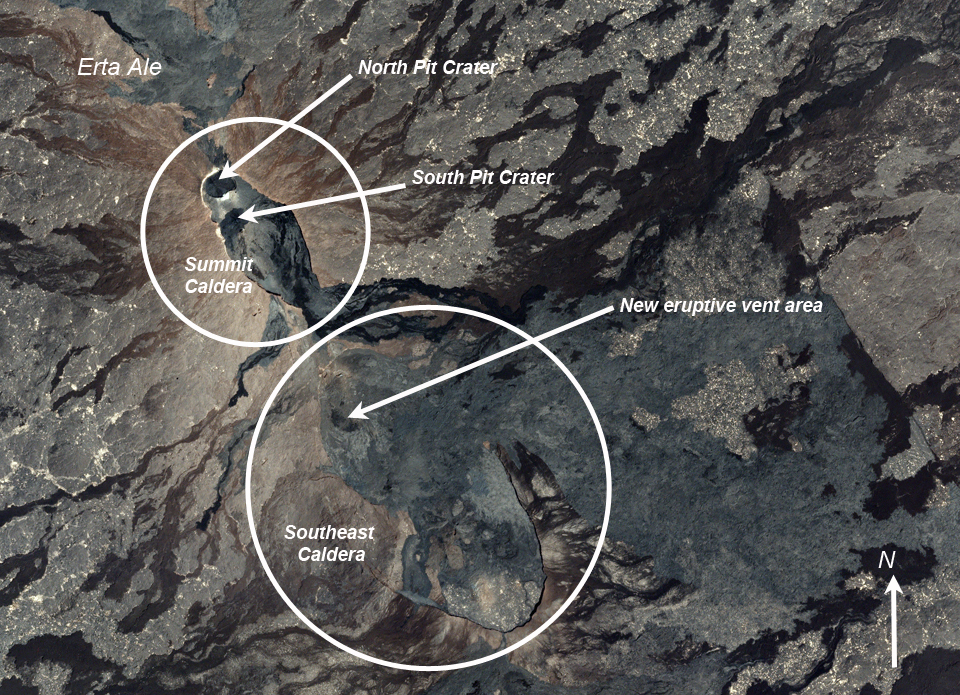 |
Figure 50. The summit of Erta Ale has two oblong NW-trending calderas. The northern Summit Caldera contains the North Pit Crater and the South Pit Crater. The North Pit Crater has had a solidified lava lake with a large hornito emitting magmatic gases and incandescence at night, and the South Pit Crater has had an active lava lake for many years that last overflowed its rim during mid-January 2017. The new eruption began at vents located about 3 km SE of the South Pit Crater near the northern rim of a second caldera referred to here as the Southeast Caldera, on 21 January 2017. The new eruption had not yet begun in this 16 January 2017 image. See figure 46 (BGVN 42:07) for additional images the following week that show the first flows from the new vents. Images copyright by Planet Labs Inc., 3 m per pixel resolution, and used with permission under a Creative Commons license (CC BY-SA 4.0), annotated by GVP. |
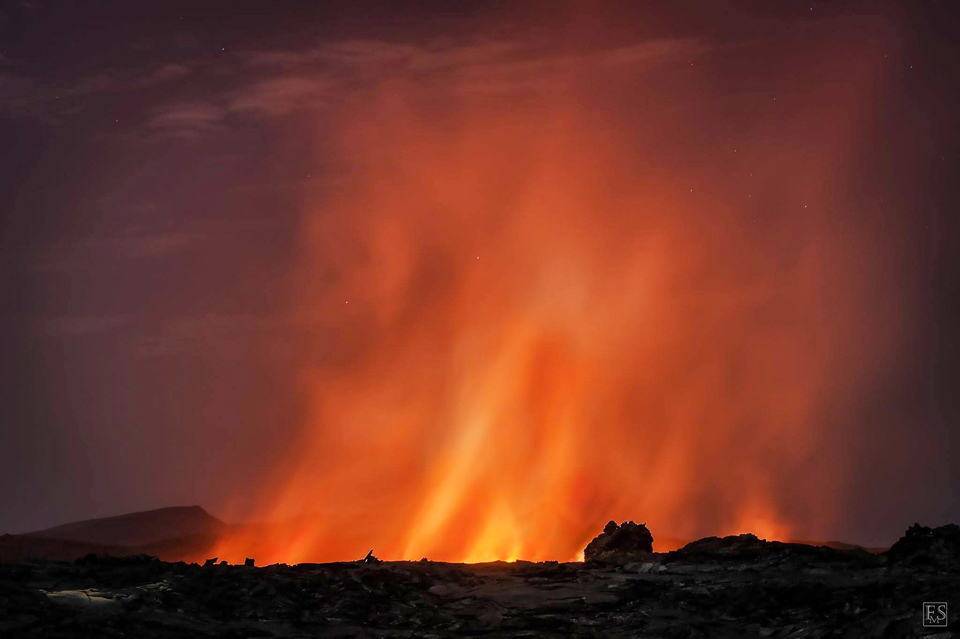 |
Figure 51. A new lava lake formed during late January 2017 at the new eruption site about 3 km SE of the South Pit Crater at Erta Ale, inside the Southeast Caldera. This view is likely from the rim of the Southeast Caldera, looking SE or E, taken in February 2017. Visitors were not able to get closer to the vent due to the active flows for several months. Copyrighted photo by Stefan Tommasini, used with permission. |
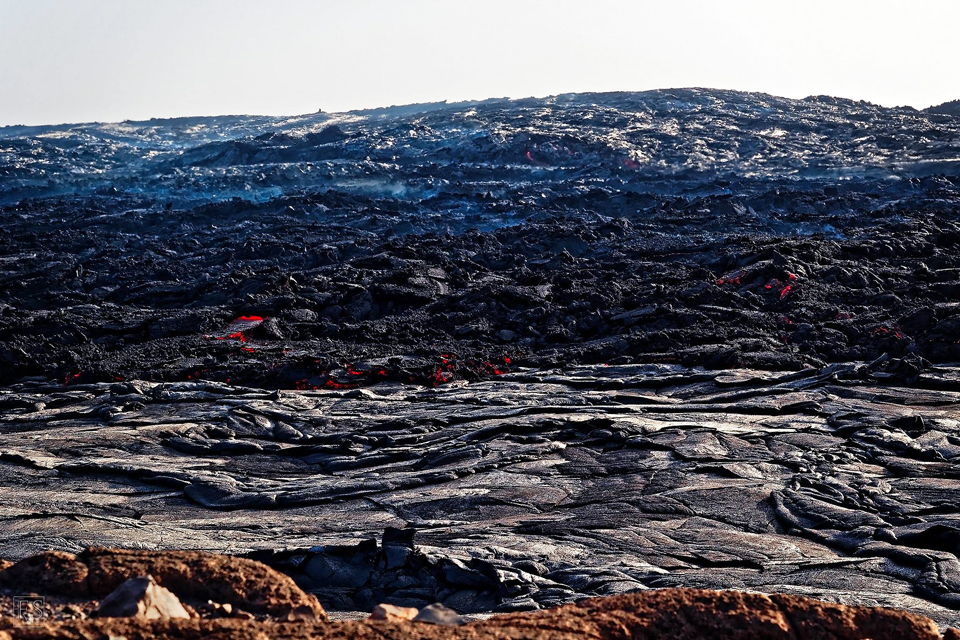 |
Figure 52. An active new pahoehoe lava field flowed over older lava flows inside the Southeast Caldera at Erta Ale during February 2017. This photo was likely taken from the northern or western rim of the Southeast Caldera. Copyrighted photo by Stefan Tommasini, used with permission. |
When the new eruptive episode began, the lava lake at the South Pit Crater drained rapidly to around 80-100 m below the rim, according to visitors to the site a few weeks later. The crater was emitting a strong thermal signal by early March 2017 as the lake level rose again. Visitors in April witnessed a fluctuating lake level rising and falling by up to 20 m every 30 minutes over several days. The thermal signal remained strong at the South Pit Crater through March 2018. Due to significant political instability in the area, ground visits are intermittent, but high-quality photographs were taken in February 2017, December 2017, and January 2018 that show the new lava lake and parts of the new flow fields.
Activity during late January-March 2017. The new eruptive event at Erta Ale began in late January 2017 at the northern end of the Southeast Caldera located; the first lava flows observed were locatedabout 3 km SE from the main Summit Caldera (figure 45 (BGVN 42:07) and figure 50). Two separate vent areas appeared active initially. The northern vent sent lava flows to the NE for several kilometers and to the SW a much shorter distance. The southern vent sent a stream of lava to the S. By the end of January 2017 the North and South Pit Craters at the Summit Caldera were still thermally active, but the signals were much stronger from the new vent areas in the Southeast Caldera (figure 53). A faint thermal signal from about 5 km E of the northern vent suggested the extent of the new flows in that direction.
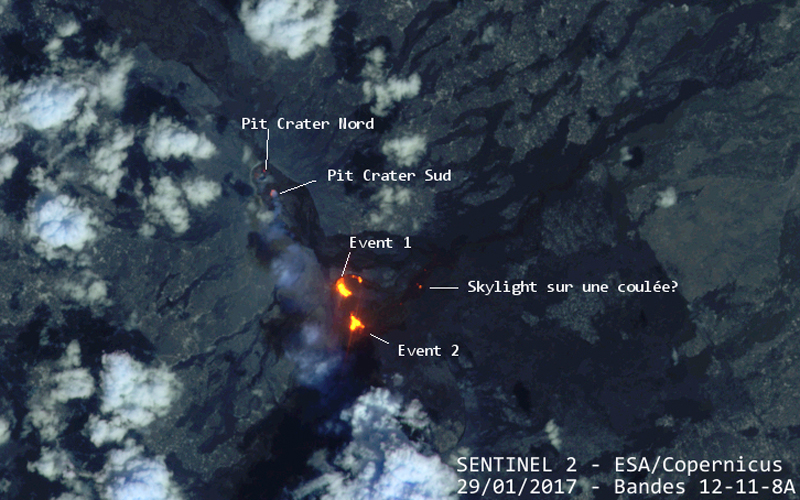 |
Figure 53. A Sentinel-2 image from 29 January 2017 shows the initial activity at the new Southeast Caldera vents of Erta Ale (labelled Event 1 and Event 2). Weak thermal signals are apparent from the North and South Pit Craters (Pit Crater Nord, Pit Crater Sud) within the Summit Caldera, and much stronger thermal signals are evident from two areas inside the Southeast Caldera. A faint signal from about 5 km E of the new vents indicates possible flow activity breaking out of lava tubes in that region (Skylight). Courtesy of ESA/Copernicus with annotations provided by Culture Volcan (Le point sur l'activité des volcans Etna, Erta Ale, Fuego, Piton de la Fournaise et Bogoslof, 3 février 2017). |
A small group of travelers led by Ethiopian geologist Enku Mulugeta visited Erta Ale during the first half of February 2017. They reported that within the main Summit Caldera, the hornito in the North Pit Crater had collapsed and the lava lake in the South Pit Crater was about 80-100 m below the caldera floor level. The eruption in the Southeast Caldera was still very active, and they photographed the sizable new lava field which contained numerous pahoehoe flows, actively spattering hornitos, and a large lava lake (figures 51, 52, and 54). During the following months activity remained high both at the new eruption site and at the Summit Caldera where the lava lake in the South Pit Crater gradually rose back up to about 50 m below the caldera floor. Culture Volcan annotated a series of Sentinel-2 satellite thermal images which show the progression of the lava flows through the following year.
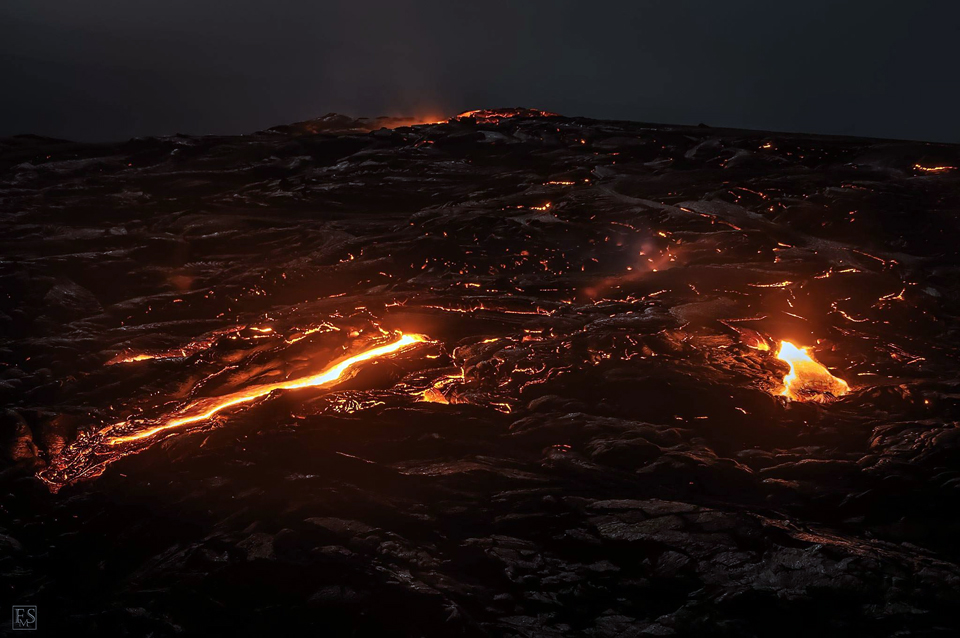 |
Figure 54. A large new lava field quickly formed inside the Southeast Caldera at Erta Ale after the beginning of the new eruptive event in late January 2017. When photographed here in February 2017, pahoehoe flows had spread outward from a central vent area (glow at top center) for over a kilometer in multiple directions. View is likely to the E from the W rim of the Southeast Caldera. Copyrighted photo by Stefan Tommasini, used with permission. |
By 10 March 2017 only the southern vent area was active inside the Southeast Caldera. It continued to feed the lava field; lava was actively flowing S from the vent towards the W rim of the Southeast Crater, and NE, breaking out from lava tubes which blocked the thermal signal until about 2.6 km NE of the vent (figure 55). Thermal signals from both the North and South Pit Craters were distinct and stronger than in late January.
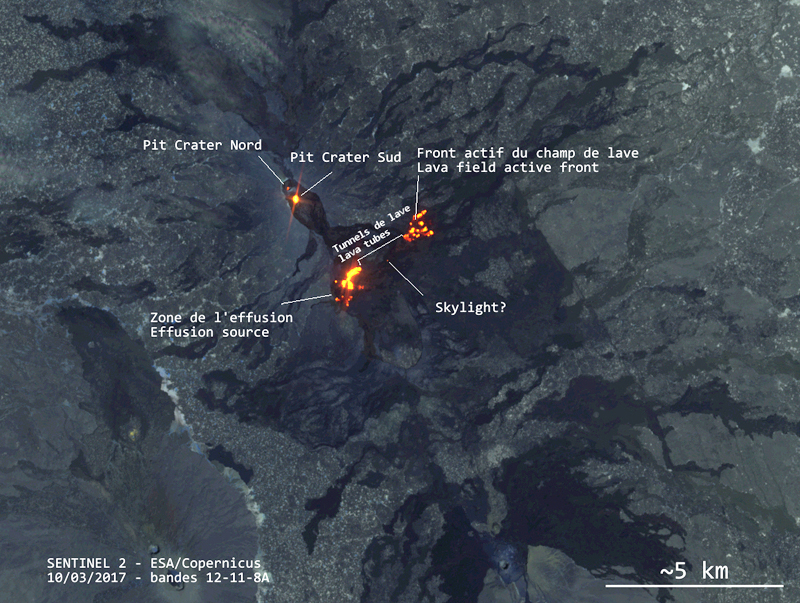 |
Figure 55. The thermal signals at both the North and South Pit Craters at Erta Ale were stronger in this 10 March 2017 image than in late January. Only one main source of lava is apparent at the Southeast Caldera. Lava flows directly from the primary vent SW towards the W rim of the caldera, and also surfaces from tunnels about two kilometers NE in an actively moving lava front. Courtesy of ESA/Copernicus with annotations provided by Culture Volcan (Un point sur l'activité des volcans Etna et Erta Ale, 13 mars 2017). |
A site visit to the South Pit Crater on 20 March 2017 demonstrated that the lake level had risen significantly since its drop in early February, and was once again actively convecting (figure 56). By the end of March 2017, satellite thermal imagery made clear the increasing thermal signal at the South Pit Crater, and in the Southeast Caldera, the major increase in effusion to the NE from the main vent. The width of the flow field had increased to about 1,400 m, and the farthest front was about 3,400 m NE from the vent (figure 57). The lava at the source measured about 180 x 75 m in size, suggesting a lava lake; a smaller overflow to the SW appeared to have reached the W rim of the Southeast Caldera by 30 March 2017 near the area where a new flow had first appeared in a 23 January 2017 satellite image (see figure 46, BGVN 42:07).
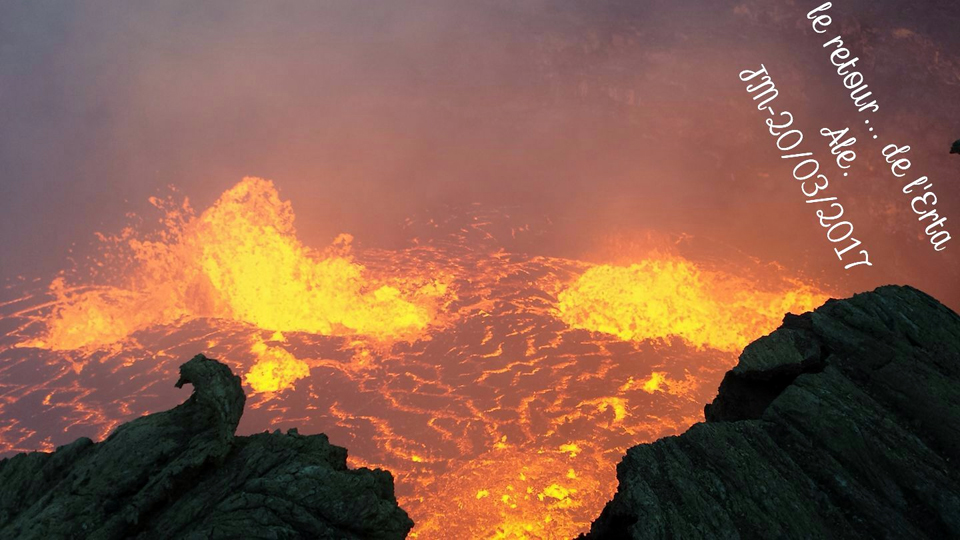 |
Figure 56. The South Pit Crater of Erta Ale on 20 March 2017 had risen significantly from its drop in February and was actively convecting. Photo by Jean-Michel Escarpit, courtesy of Cultur Volcan (Un point sur l'activité des volcans Fuego, Manam et Erta Ale, 22 mars 2017). |
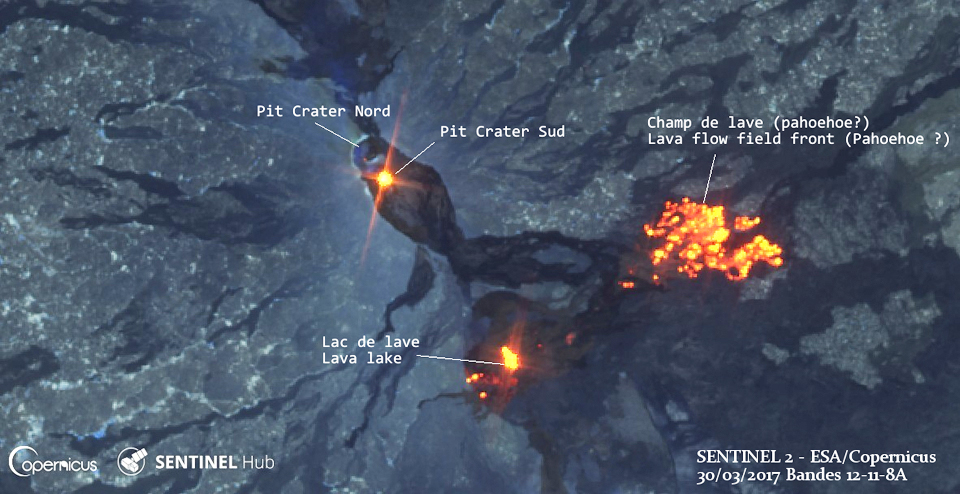 |
Figure 57. The thermal signal at the South Pit Crater continued to increase in this 30 March 2017 satellite image of Erta Ale. The main vent in the Southeast Caldera had dimensions of about 180 x 75 m, suggesting a lake had formed. A large increase in the thermally active area to the NE indicated that the flow field was expanding significantly in that direction, with a few small thermal anomalies between the lake and lava field suggesting a number of small flows or lava tube breakouts. Flow activity also continued to the SW reaching the W rim of the Southeast Crater where lava had flowed past the crater rim in late January (see figure 46, BGNV 42:07). Courtesy of ESA/Copernicus with annotations provided by Culture Volcan (Un point sur l'activité des volcans Klyuchevskoy et Erta Ale, 31 mars 2017). |
Activity during April-May 2017. In the next Sentinel-2 satellite image from 9 April (figure 58), the distance to the farthest front of the lava flow had increased to about 4,600 m from the lava lake, and a new flow had appeared a few hundred meters east of the lake that extended about 1,100 m ENE from its source. Lava also flowed SW from the source to the SW rim of the Southeast Crater, appearing to pond against and flow slightly beyond the rim.
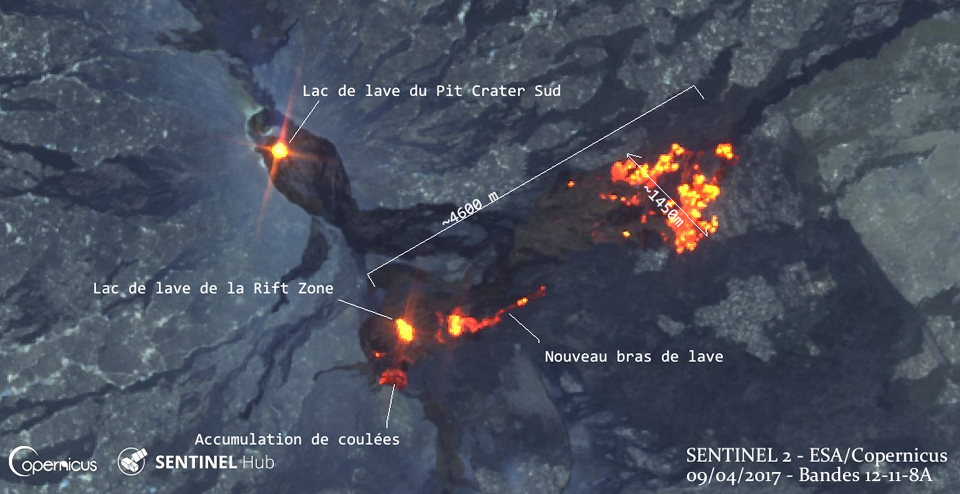 |
Figure 58. The lava flows continued to extend NE from their source inside the Southeast Crater at Erta Ale in this Sentinel-2 satellite image from 9 April 2017. The farthest edge of the northeast flow front was about 4,600 m from the lake. A new arm of lava flowed more than a kilometer ENE from its source close to the lake. Another thermal signature SW of the lake indicated an accumulation of lava near or slightly spilling over the SW rim of the Southeast Crater. Courtesy of ESA/Copernicus with annotations provided by Culture Volcan (Le point sur l'activité des volcans Erta Ale et Bogoslof, 16 avril 2017). |
A group visited Erta Ale during 11-15 April 2017 in collaboration with Addis Ababa University geologist Enku Mulugeta. They noted that fluctuating lava lake levels at the South Pit Crater were cycling every 30 minutes or so between 40 and 50 m below the caldera floor (figures 59 and 60). Lava tubes from the walls of the crater would feed the lake with fresh lava after it drained. Two coalesced hornitos, about 7 m high, were present in the NE part of the crater, emitting SO2 gas and occasional lava. At the North Crater Pit, noisy degassing of SO2 from several hornitos at the center of the solidified crust was apparent. Observers at the Southeast Caldera could see the lava lake with the top about 10 m below its crater rim, and minor fountaining during the night, but they were not able to get closer than about 700 m due to the active flows.
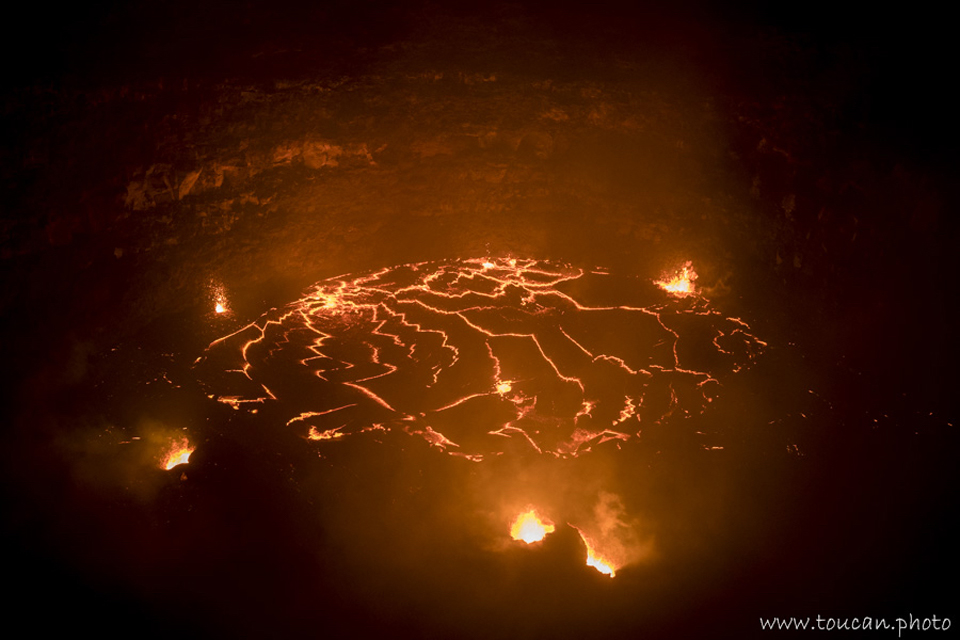 |
Figure 59. The lava lake level at the South Pit Crater at Erta Ale during April 2017 was fluctuating by 10-20 m every 30 minutes or so. The high-stand of the lava is shown here. Courtesy of Toucan Photo. |
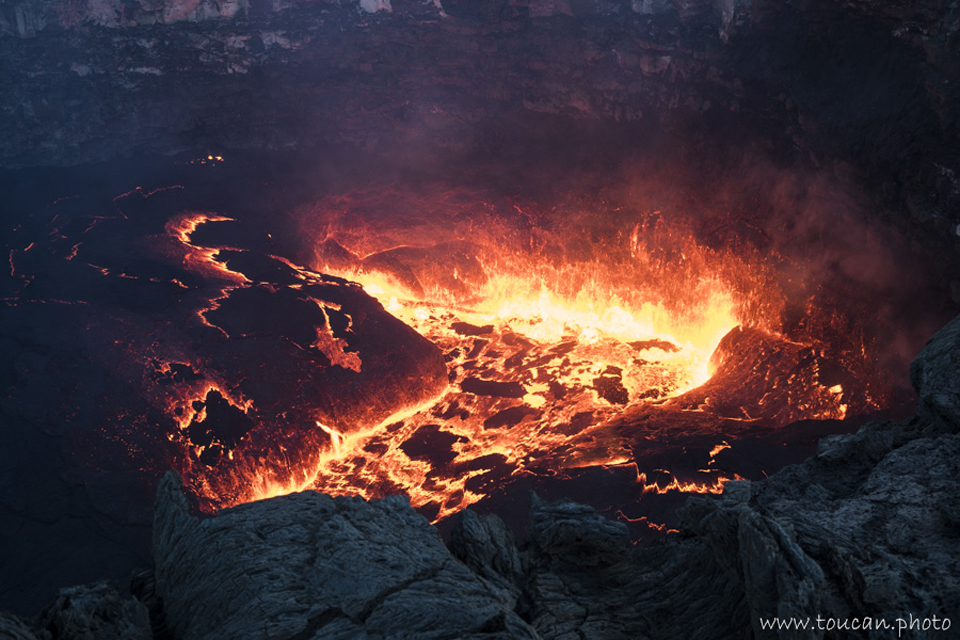 |
Figure 60. The lava lake level at the South Pit Crater at Erta Ale during April 2017 was fluctuating by 10-20 m every 30 minutes or so. The low stand of the lava is shown here as the lava drains away. Courtesy of Toucan Photo. |
By the end of April 2017 satellite thermal imagery indicated that the northeast flow field at the Southeast Caldera extended more than 7 km NE from the lake and was curving towards the E (figure 61). The lava lake was still thermally active, as was the South Pit Crater to the NW.
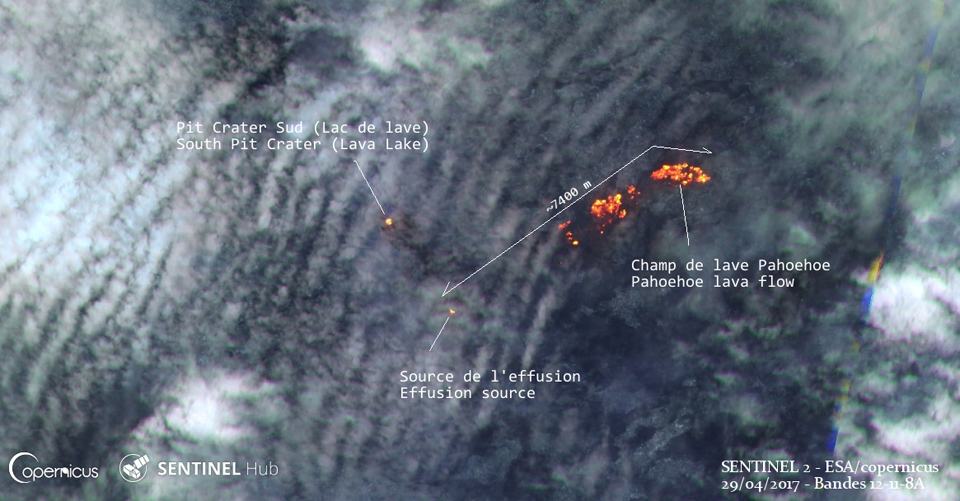 |
Figure 61. Sentinel-2 satellite imagery of Erta Ale on 29 April 2017 shows the growth of the northeast lava field from earlier in the month to more than 7 kilometers from its source. The South Pit Crater was still active, as was the source of the northeast lava field. Courtesy of ESA/Copernicus with annotations provided by Culture Volcan (L'activité effusive reste soutenue à l'Erta Ale, 3 mai 2017). |
Eleven days later, activity was quite different in the Southeast Caldera. Satellite imagery from 9 May 2017 (figure 62) showed a new, relatively narrow but bright lava flow moving NE for 2-3 km originating in a location slightly NE of the original lava lake; activity farther NE had diminished from the previous image. A subsequent image on 18 May looked similar, but by 19 May the narrow flow had been replaced by a much broader area of thermal anomaly in the region immediately E of the source. By 29 May 2017, the source of the lava appeared to have shifted several hundred meters SE of the earlier location, and a strong thermal signal once again extended NE across the northeast flow field from the new source for about two kilometers (figure 63).
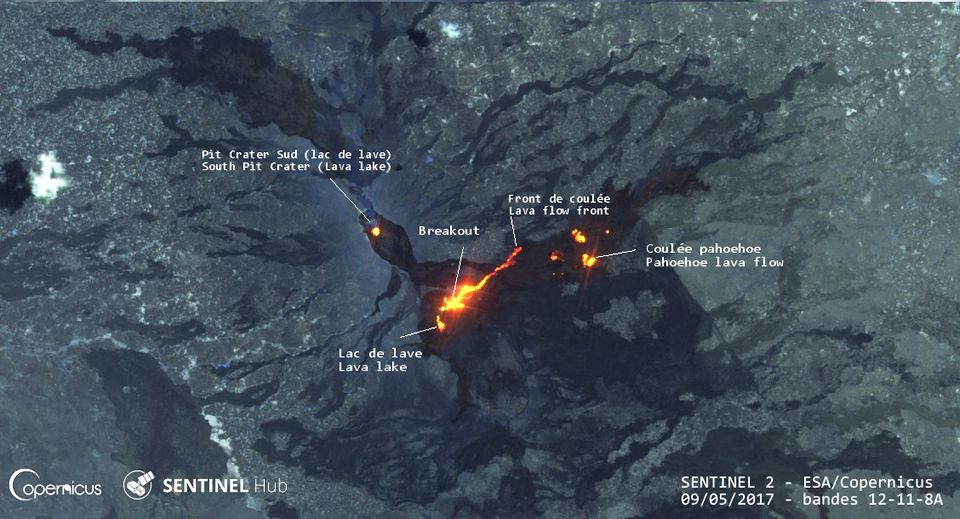 |
Figure 62. A Sentinel-2 satellite image of Erta Ale on 9 May 2017 showed a shift to the NE in the location of the source of the active flows. A new narrow flow had traveled 2-3 km NE from a source located NE of the lava lake. The more distant northeast flow field had a much smaller thermal signature than on 29 April. Courtesy of ESA/Copernicus with annotations provided by Culture Volcan (Breakout sur le volcan Erta Ale, 11 mai 2017). |
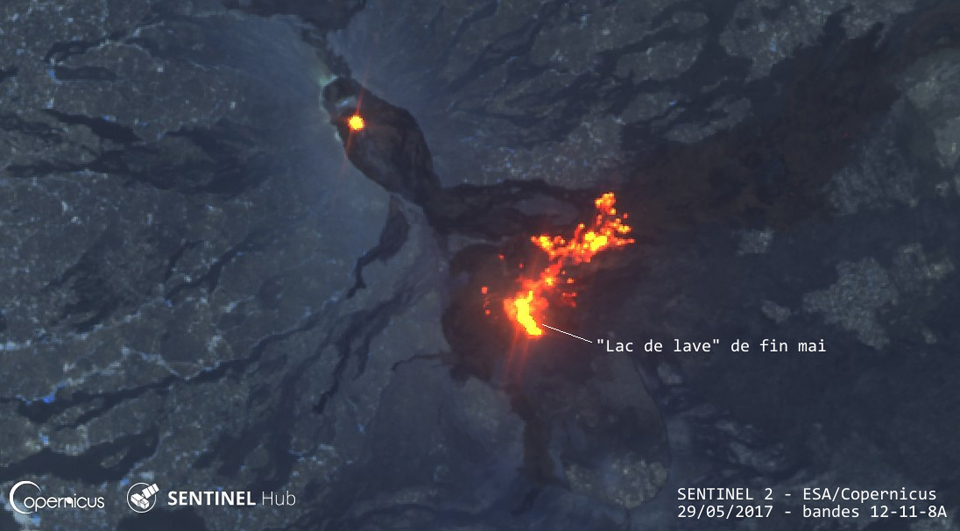 |
Figure 63. A significant shift to the SE in the location of the lava source from a few weeks earlier is apparent in this Sentinel-2 satellite image of Erta Ale captured on 29 May 2017. A strong thermal anomaly trended NE across the northeast flow field for about two kilometers. Courtesy of ESA/Copernicus with annotations provided by Culture Volcan (Erta Ale: une éruption vraiment exceptionnelle, 11 juin 2017). |
Activity during June-August 2017. The rapidly changing flow field was significantly different again less than two weeks later in satellite imagery captured on 8 June 2017. Lava was flowing N, SE, and S across the northeast lava field, extending beyond the rim of the Southeast Caldera to the N and E. Another very strong thermal signal emerged from the SW corner of the Southeast Caldera where lava was flowing W and S outside the caldera rim forming a new southwest lava field (figure 64).
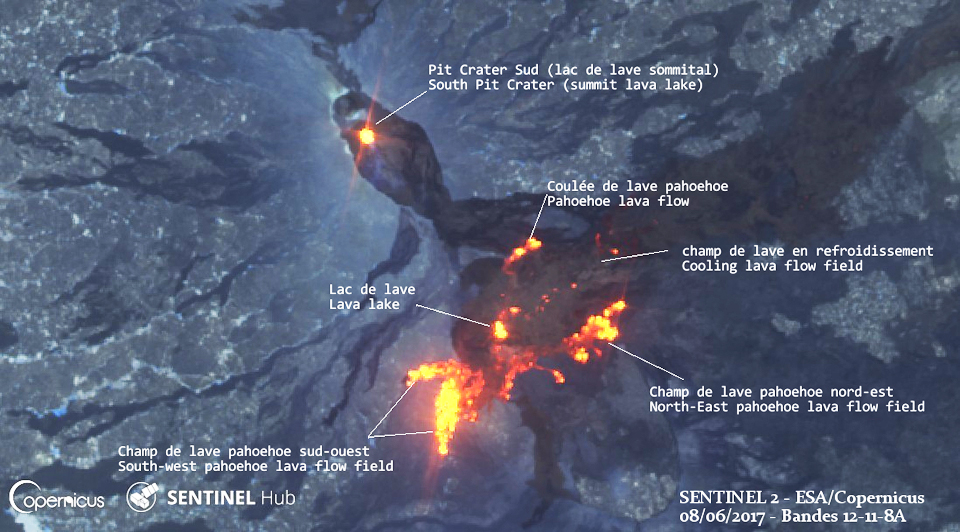 |
Figure 64. A Sentinel-2 satellite image of Erta Ale on 8 June 2017 shows significant changes in the location of the active flow fields from less than two weeks earlier. The South Pit Crater in the Summit Caldera still had a strong thermal signal suggesting an active lake in the crater. Flows in the Southeast Caldera appeared to be moving N, E, and S across the northeast lava field, and a new area with flows moving S and W from the SW rim of the Southeast Caldera formed the new Southwest lava field. Courtesy of ESA/Copernicus with annotations provided by Culture Volcan (Erta Ale: une éruption vraiment exceptionnelle, 11 juin 2017). |
During June 2017, the most aggressive flow activity contributed to significant growth of the southwest lava field. By 28 June, infrared imaging detected flow fronts 4,500 m SW of the vent; they had extended to about 5,100 m, nearing the base of the SW flank of Erta Ale, by 5 July (figure 65). Flow activity also persisted in the northeast flow field with activity concentrated about 1.5 km NE of the vent on 28 June. Movement increased at the northeast flow field beginning in late June and it had extended to about 3.5 km NE of the lava lake by 5 July 2017.
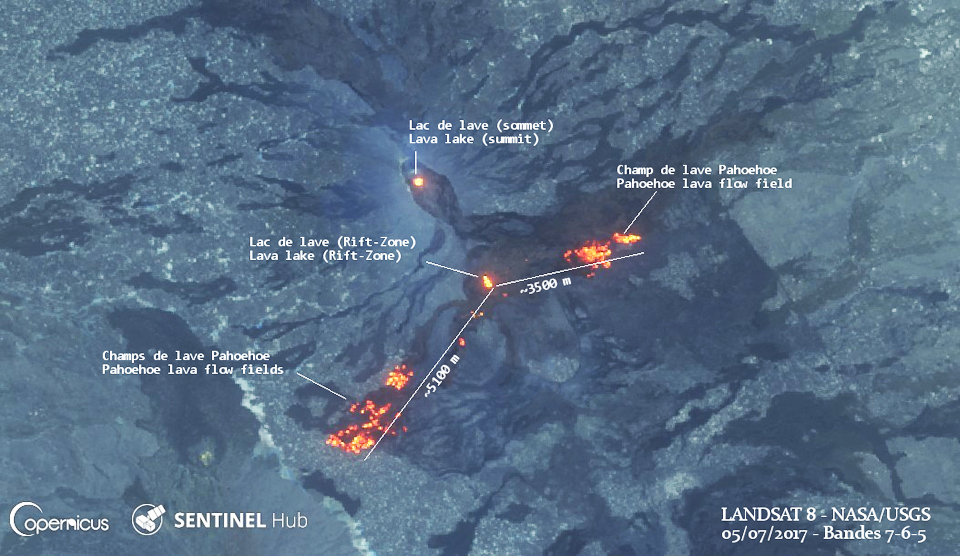 |
Figure 65. Lava flow activity at the Southeast Caldera of Erta Ale during June 2017 was concentrated in the growing southwest flow field which had extended about 5,100 m from its lava lake source by 5 July 2017 in this Landsat 8 satellite image. The northeast flow field began extending farther NE during the first week of July, reaching 3,500 m from the lake by 5 July. Courtesy of ESA/Copernicus and NASA/USGS with annotations provided by Culture Volcan (Un point sur l'activité des volcans Copahue et Erta Ale, 8 juillet 2017). |
Significant movement to the NE in the northeast flow field was apparent in satellite images beginning on 21 July 2017; the head of the flow had reached about 9.5 km from the lava lake by 28 July 2017, mostly focused in a narrow channel (figure 66). Activity decreased in the southwest flow field during July; the lava front had advanced only a few hundred meters by the end of July from its position on 5 July.
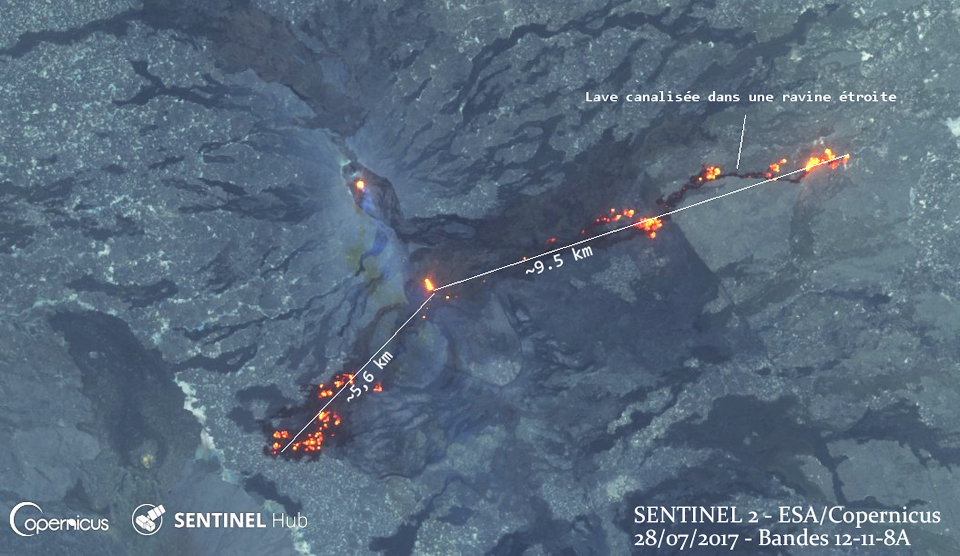 |
Figure 66. The northeast flow field at Erta Ale lengthened significantly during July 2017; the leading edge was about 9.5 km NE of the lava lake by 28 July 2017, as captured in this Sentinel-2 satellite image. The southwest flow field had extended just a few hundred meters SW from its location on 5 July. The distance between the South Pit Crater and the Southeast Caldera lava lake is about 2.7 km. Courtesy of ESA/Copernicus with annotations provided by Culture Volcan (Les actus du jour: Katla en alerte jaune et quelques changements à l'Erta Ale, 29 juillet 2017). |
During August 2017, lava continued to flow from the Southeast Caldera lava lake in two directions. The northeast flow front extended to 12 km from the vent by 17 August and had reached over 14 km by 7 September. The southwest flow field, while it remained in roughly the same area, had a decreased but still significant thermal signature in early September, suggesting continued but diminished activity throughout the period (figures 67).
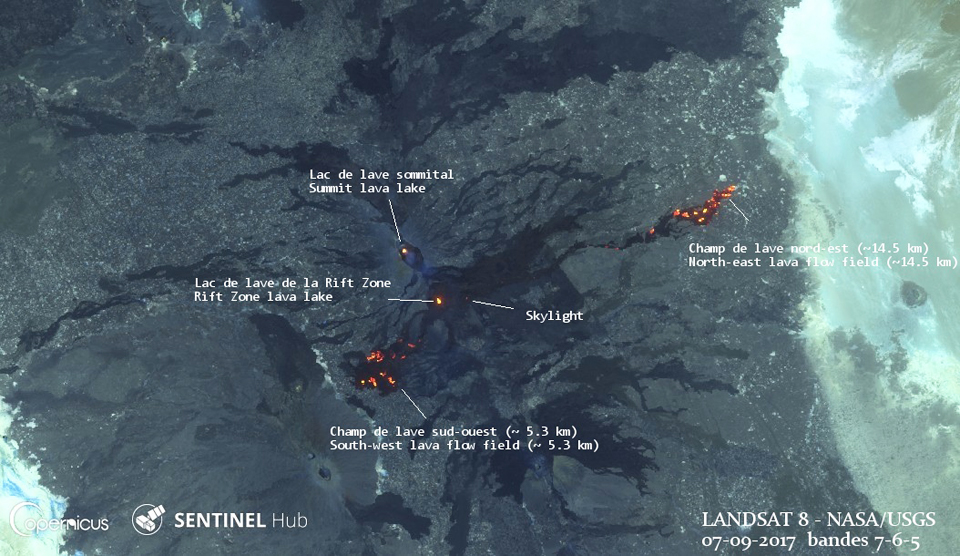 |
Figure 67. During August 2017, lava continued to flow in two directions from the Southeast Caldera lava lake at Erta Ale. The northeast flow field had reached over 14 km from the lake by 7 September 2017 when this Landsat 8 satellite image was taken. The Southwest flow field, while it remained in roughly the same area, still had a significant thermal signature suggesting continued activity. Courtesy of ESA/Copernicus and NASA/USGS with annotations provided by Culture Volcan (volcan Erta Ale: ça continue; Fernandina: c'est moins sûr, 12 septembre 2017). |
Activity during September-December 2017. In a Sentinel-2 satellite image from 26 September 2017, it was clear that the South Crater Pit was still thermally active, and that the southwest flow field had largely cooled with only a small area on its NW edge still producing a thermal anomaly (figure 68). In contrast, the northeast flow field had advanced about 1 km in the previous three weeks and was less than a kilometer from the edge of the valley alluvium. It finally reached the edge of the older lava field and began to advance across the alluvium NE of the volcano, more than 16 km from the lava lake, on 16 October 2017 (figure 69). Based on satellite imagery, Cultur Volcan interpreted that activity slowed significantly during November 2017, and while the thermal signal remained strong near the head of the flow, it did not advance significantly across the alluvium.
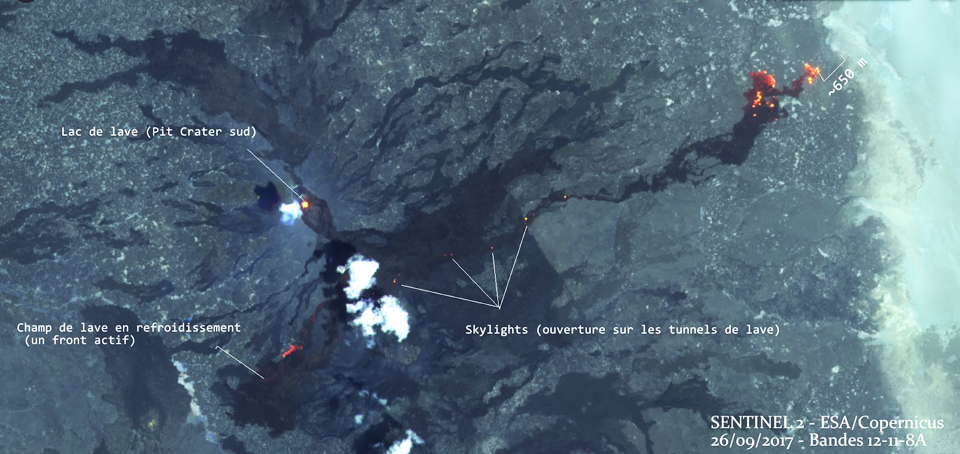 |
Figure 68. The South Pit Crater at Erta Ale still had an active lava lake on 26 September 2017 in this Sentinel-2 satellite image. The southwest lava field had largely cooled, with only a small thermal anomaly along it NW edge. The northeast lava field continued to be active; it had advanced about 1 km NE in about three weeks and was about 650 m from the edge of the alluvium. A significant number of hotspots along the northeast lava flow suggest that several skylights existed into lava tubes or there were small breakouts. Courtesy of ESA/Copernicus with annotations provided by Culture Volcan (Les actus du jour: Heard Island, Erta Ale, Pacaya, Fuego, Sangay, Ol Doynio Lengai, 5 octobre 2017). |
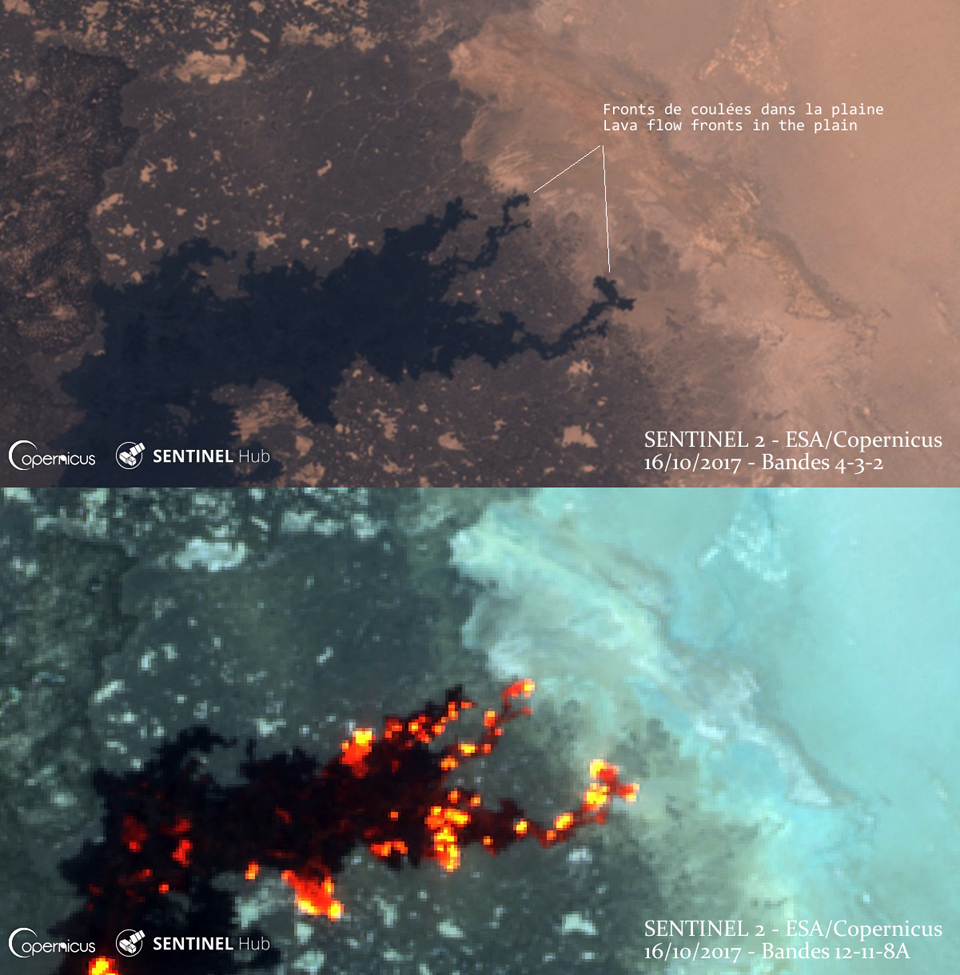 |
Figure 69. Erta Ale's northeast flow field reached the alluvium about 16 km E of the Southeast Caldera lava lake by 16 October 2017, as recorded in this Sentinel-2 satellite image. The distance between the ends of the two easternmost tongues of lava is about 1 km. Courtesy of ESA/Copernicus with annotations provided by Culture Volcan (Erta Ale: ça y est, le champ de lave entre dans la plaine!, 18 octobre 2017). |
Visitors to the South Pit Crater in mid-December 2017 reported that its lava lake continued to be active and its level was about 60 m below the rim. They were also able to visit the Southeast Caldera lava lake, 2.7 km SE of the South Pit Crater, and take photographs from its rim; it was about 200 m long and 100 m wide and filled with slowly convecting lava (figures 70, 71). Satellite imagery from 25 December 2017 showed the active lake at the South Pit Crater, the active lake at the Southeast Caldera, and numerous skylights and overflows along the 16-km-long northeast flow field (figure 72).
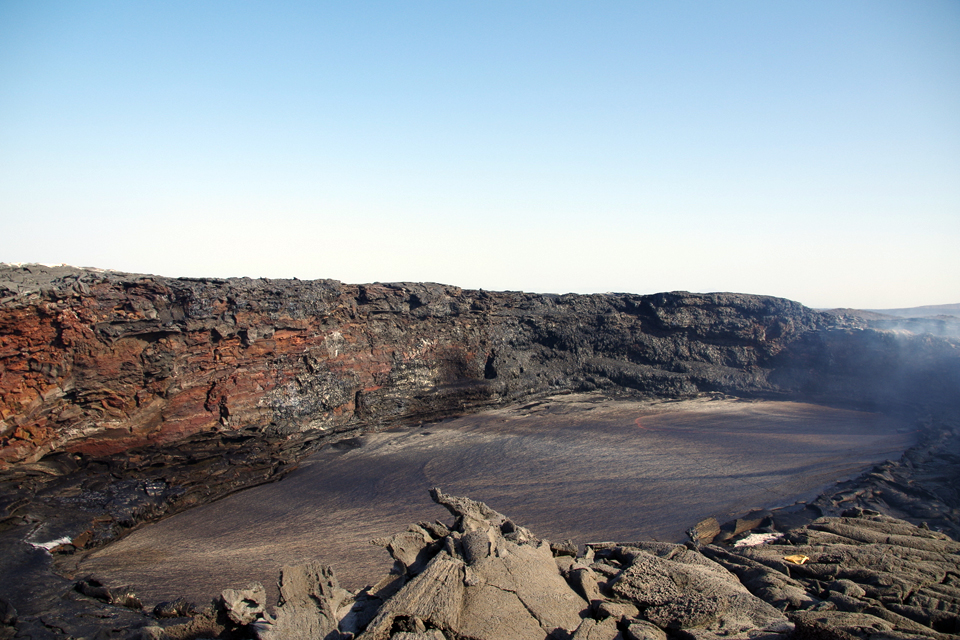 |
Figure 70. The Southeast caldera lava lake at Erta Ale, its surface crusted over with slightly cooled lava, with dimensions of about 200 x 100 m in mid-December 2017. Photograph by FB88, courtesy of Culture Volcan (Un point sur l'activité à l'Erta Ale, 31 décembre 2017). |
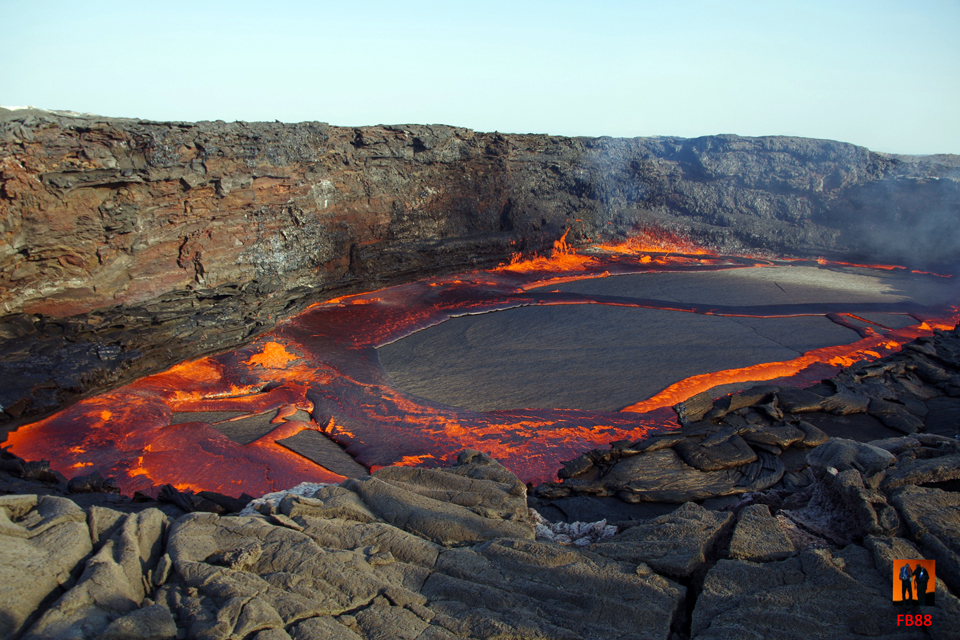 |
Figure 71. The Southeast Caldera lava lake at Erta Ale was slowly convecting during mid-December 2017. Photographed by FB88, courtesy of Culture Volcan (Un point sur l'activité à l'Erta Ale, 31 décembre 2017). |
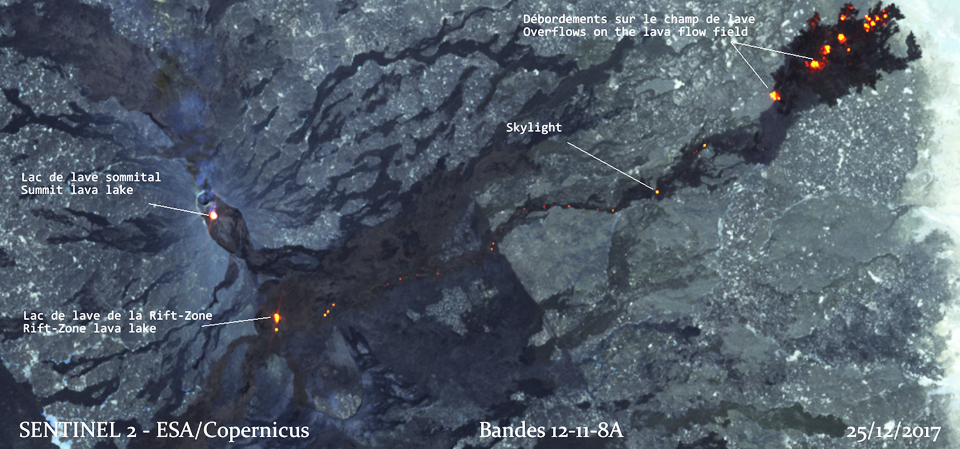 |
Figure 72. Sentinel-2 satellite imagery from 25 December 2017 of Erta Ale showed the active lake at the South Pit Crater (Summit lava lake), the active lake at the Southeast Caldera (Rift-Zone lava lake), and numerous skylights and overflows along the 16-km-long northeast flow field. Courtesy of ESA/Copernicus with annotations provided by Culture Volcan (Un point sur l'activité à l'Erta Ale, 31 décembre 2017). |
Activity during January-March 2018. By mid-January 2018 thermal activity was concentrated a few kilometers back from the front of the northeast flow, about 12 km from the lava lake (figure 73). A Volcano Discovery tour group visited during 13-26 January 2018 and was able to access and photograph both the North and South Pit Craters and the new lake and flow fields around the Southeast Caldera with ground-based and aerial drone photography (figures 74-84).
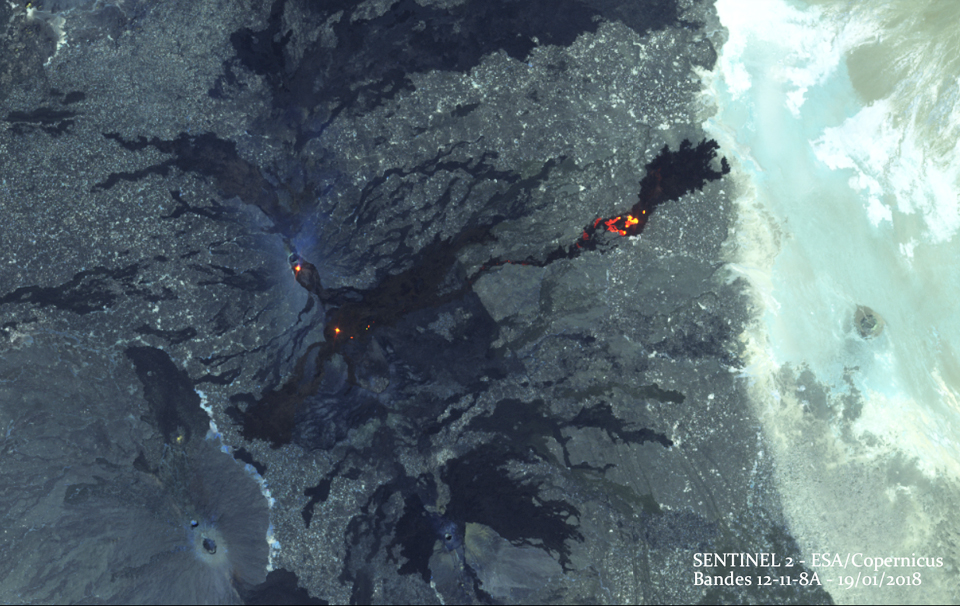 |
Figure 73. By 19 January 2018, thermal activity at Erta Ale's northeast flow field was concentrated a few kilometers back from the front of the flow, about 12 km from the Southeast Caldera lava lake. The South Pit Crater and Southeast Caldera lava lakes are visible on the left. Small hot-spots near the Southeast Caldera lava lake could be hornitos or skylights into lava tubes. Courtesy of ESA/Copernicus with annotations provided by Culture Volcan (Le point sur l'activité des volcans Erta Ale, Kadovar (Mis à jour) et Nevados de Chillan, 21 janvier 2018). |
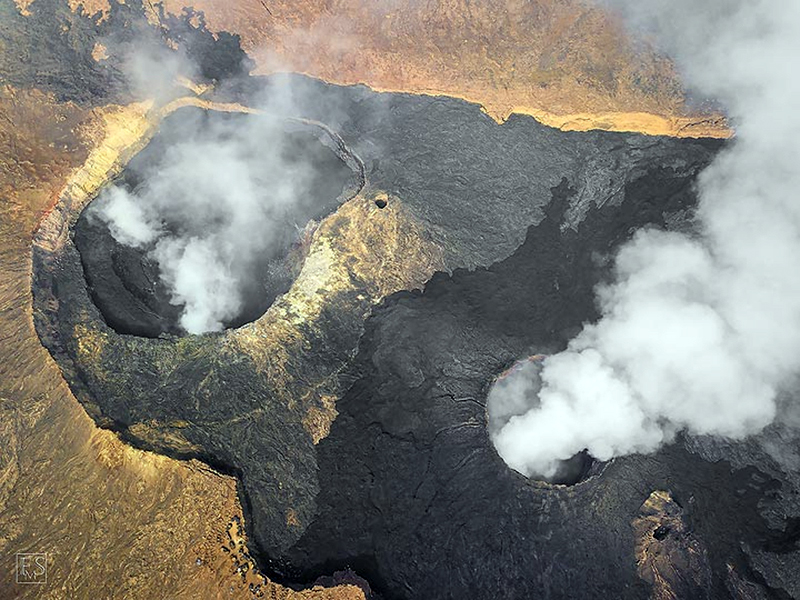 |
Figure 74. In this aerial view taken during 13-26 January 2018 by a drone of the central part of Erta Ale's Summit Caldera, steam plumes rose from the North Pit Crater (left) and South Pit Crater (right). The fresh black lava around the South Pit Crater overflowed onto the caldera floor in January 2017 shortly before the beginning of the eruptive events in the Southeast Caldera a few kilometers to the south. Copyrighted photo by Stefan Tommasini, used with permission. |
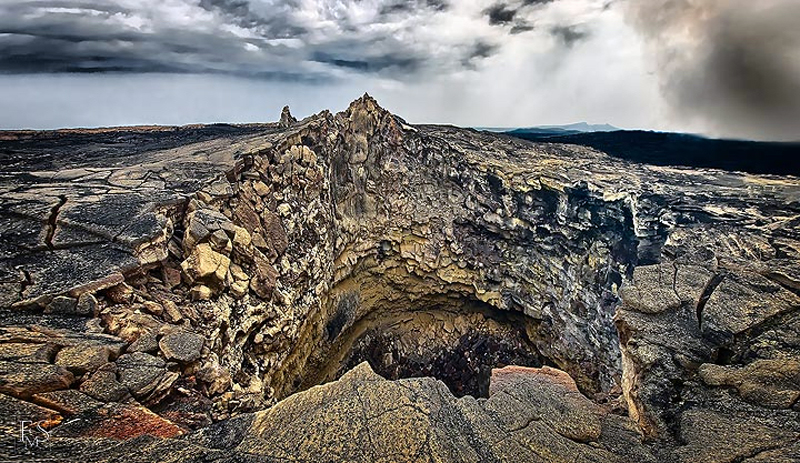 |
Figure 75. The North Pit Crater inside the Summit Caldera at Erta Ale contained a large collapsed vent in January 2018 that formed after the magma drained away from the crater in January 2017. Photo taken during 13-26 January 2018. Copyrighted photo by Stefan Tommasini, used with permission. |
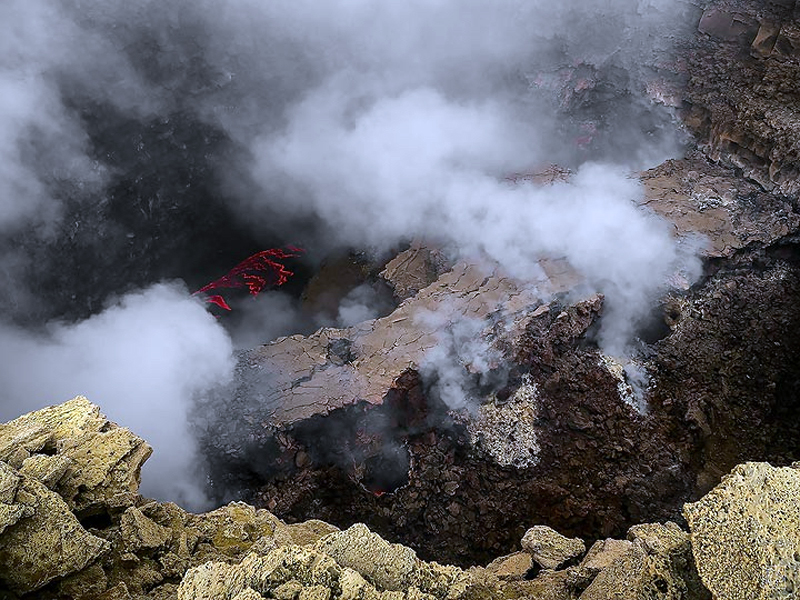 |
Figure 76. The lava lake in the South Pit Crater of Erta Ale's Summit Caldera was tens of meters below the rim in January 2018. Magma drained away and parts of the crater walls collapsed in January 2017, followed by repeated filling and draining of the lava lake during 2017. Photo taken during 13-26 January 2018. Copyrighted photo by Stefan Tommasini, used with permission. |
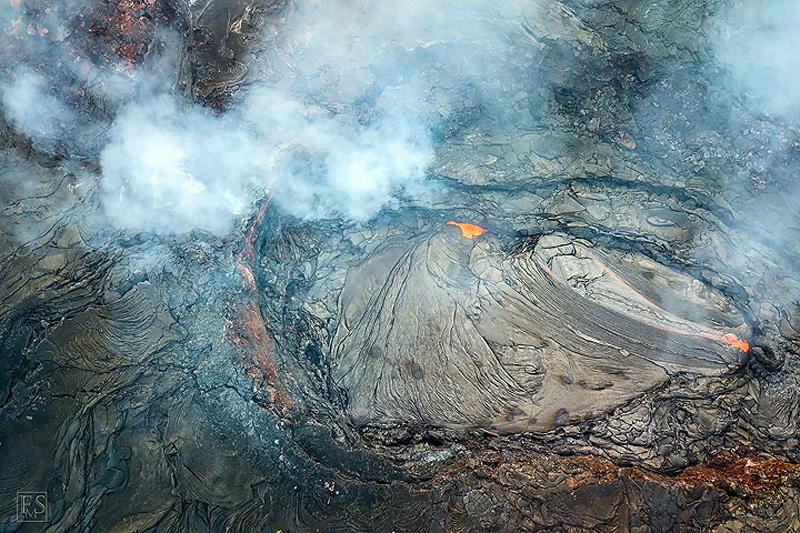 |
Figure 77. This aerial view by drone shows the large lava lake that formed at Erta Ale's Southeast Caldera during 2017; it was still slowly convecting in January 2018. The lake dimensions were about 100 x 200 m. Photo taken during 13-26 January 2018. Copyrighted photo by Stefan Tommasini, used with permission. |
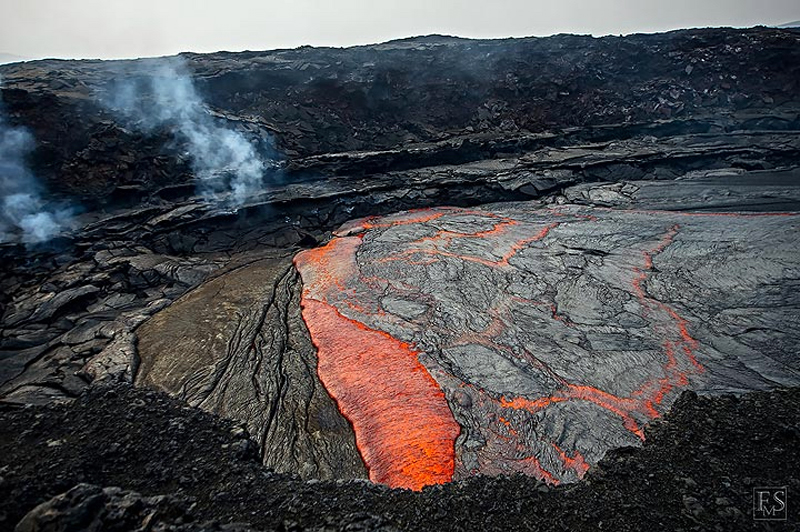 |
Figure 78. Recently cooled black crust is overrun and consumed by molten lava that quickly cools and crusts over in Erta Ale's Southeast Caldera lava lake in January 2018. Photo taken during 13-26 January 2018. Copyrighted photo by Stefan Tommasini, used with permission. |
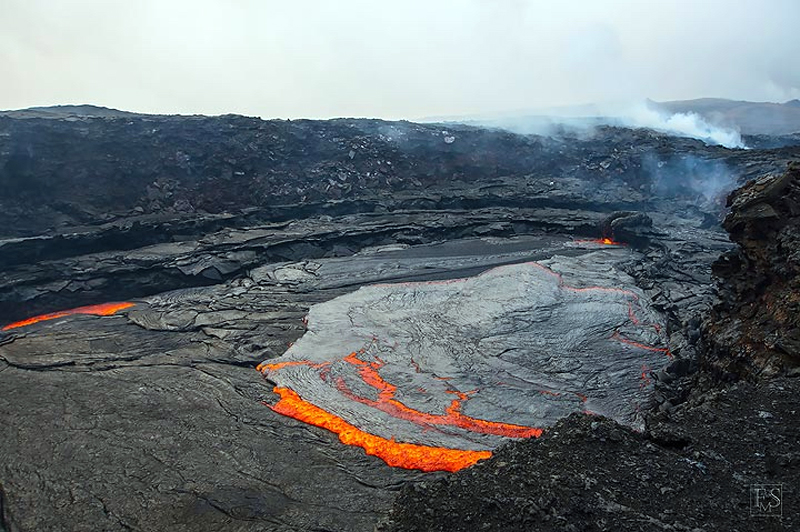 |
Figure 79. Lava appears to flow into the Southeast Caldera lava lake at Erta Ale from a vent at the far edge and slowly spread across the lake during January 2018. Photo taken during 13-26 January 2018. Copyrighted photo by Stefan Tommasini, used with permission. |
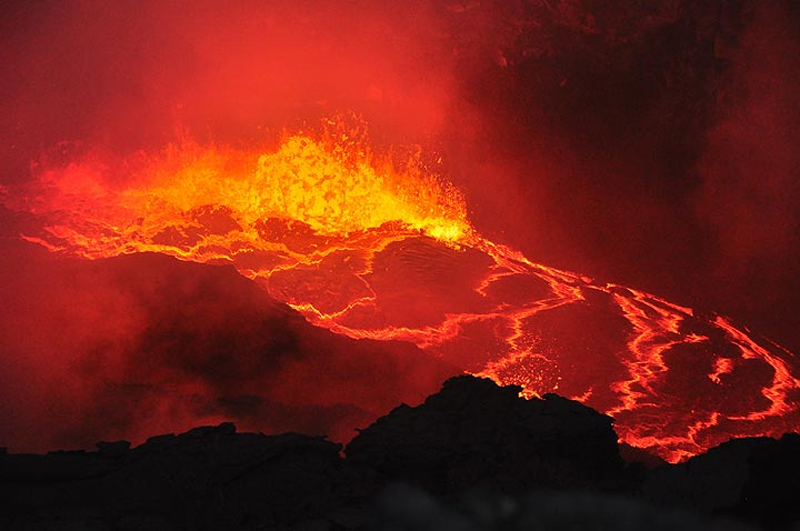 |
Figure 80. Lava splashes as it flows into the Southeast Caldera lava lake at Erta Ale in January 2018. Photograph by Anastasia Ganuschenko taken during 13-26 January 2018, courtesy of Volcano Discovery. |
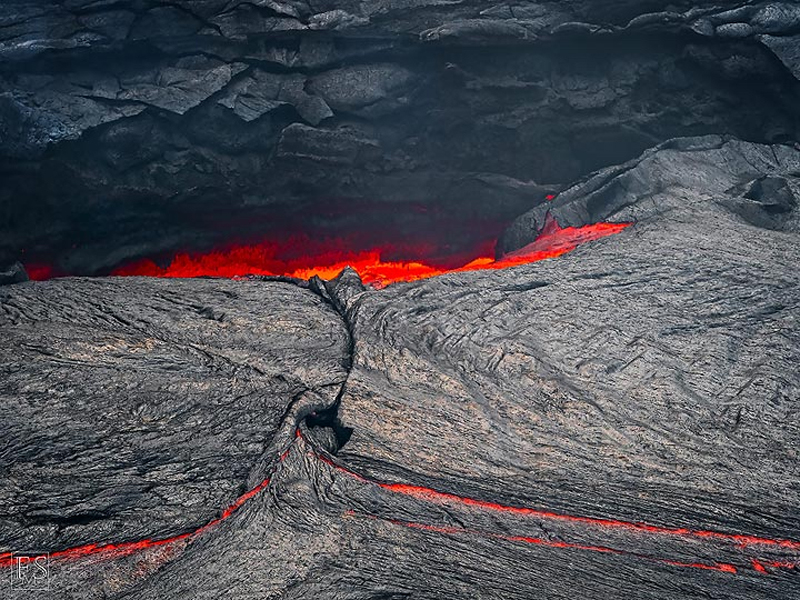 |
Figure 81. Downwelling consumes lava inside the Southeast Caldera lava lake at Erta Ale in January 2018. Photo taken during 13-26 January 2018. Copyrighted photo by Stefan Tommasini, used with permission. |
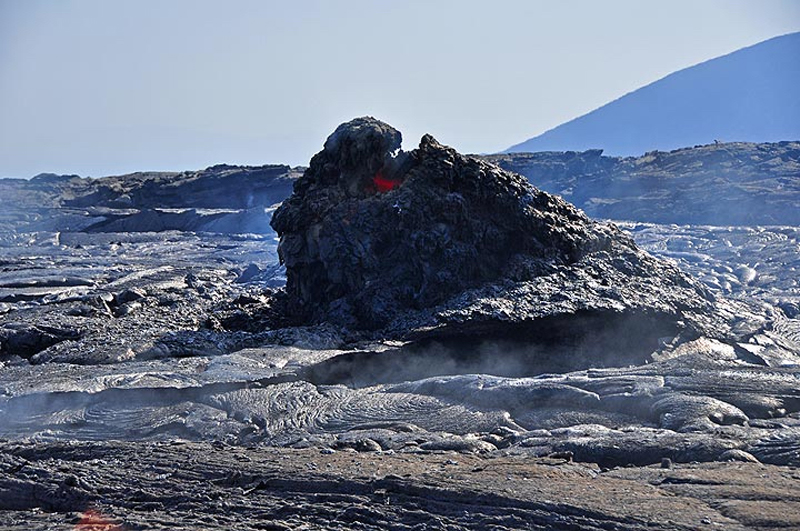 |
Figure 82. Incandescence is visible inside a hornito that formed through lava spattering along the new flows in the Southeast Caldera at Erta Ale in January 2018. Photograph by Anastasia Ganuschenko taken during 13-26 January 2018, courtesy of Volcano Discovery. |
 |
Figure 83. Many layers of fresh Pahoehoe lava flows were cool enough to walk on in some areas of the Southeast Caldera lava fields in January 2018. Photo taken during 13-26 January 2018. Copyrighted photo by Stefan Tommasini, used with permission. |
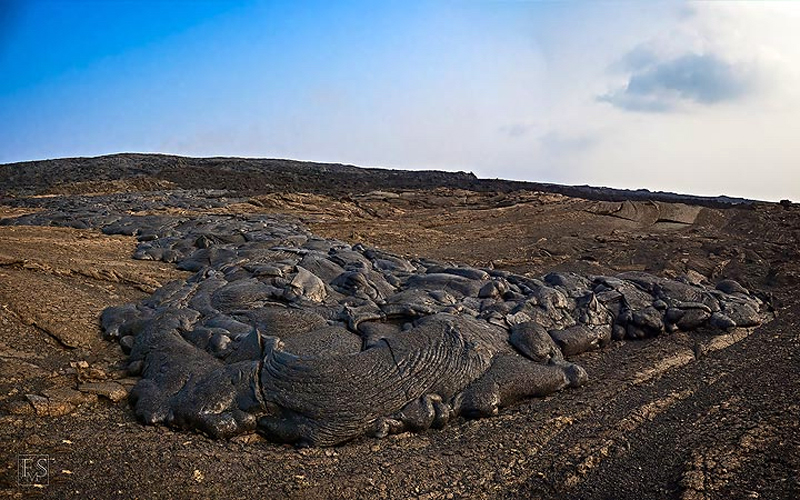 |
Figure 84. Fresh lava flows were easily distinguished from older ones by their silver hue and dark black crust at Erta Ale's Southeast Caldera lava fields in January 2018. Photo taken during 13-26 January 2018. Copyrighted photo by Stefan Tommasini, used with permission. |
By late March 2018 no thermal signal appeared in satellite imagery at the site of the Southeast Caldera lava lake, although the South Pit Crater was still visible. A large increase in the area of fresh flows and multiple thermal anomalies were present at the flow front of the northeast lava field 14-16 km from the former lava lake (figure 85). During the second half of March, the flow progressed several hundred meters out into the alluvial plain.
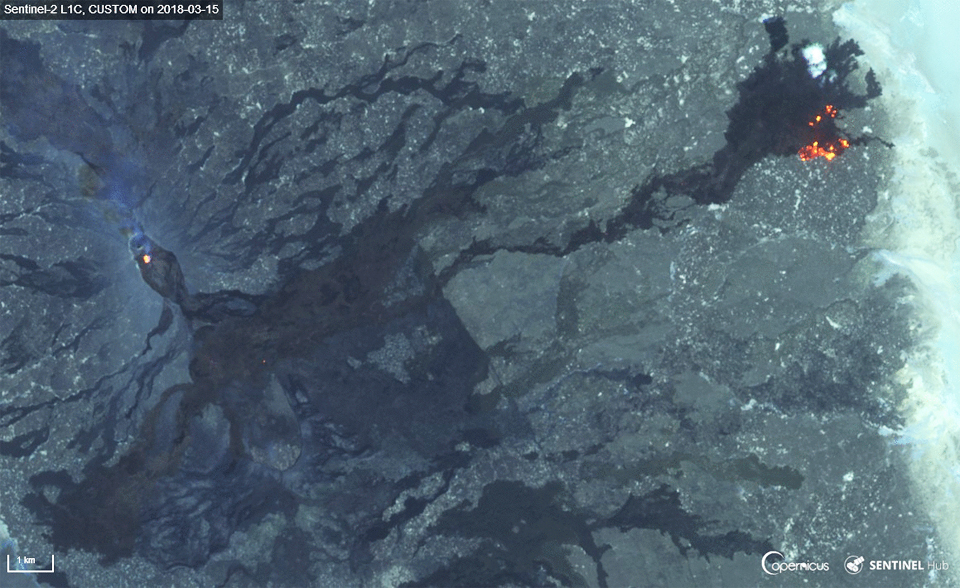 |
Figure 85. Sentinel-2 satellite imagery captured on 15 March 2018 showed a large increase in the area of fresh lava flows at the NE front of the northeast lava field at Erta Ale when compared with an image from 19 January 2018. Over the next ten days, images showed the narrow finger of lava that just touches the alluvium in this image creep about a kilometer out into the alluvial plain. Courtesy of Courtesy of ESA/Copernicus, published by Cultur Volcan (Les actus volcaniques du jour: Erta Ale, Maly-Semiachik, Suwanose-Jima et Ebeko, 28 mars 2018). |
MIROVA thermal anomaly data. The MIROVA thermal anomaly data captures information about the distance of the anomalies from the summit as well as the radiative power released from Erta Ale. Both sets of information agree well with observations from the Sentinel-2 and Landsat satellite data. The plot of distance from the summit (figure 86) shows that during August 2016-mid-January 2017 the thermal anomalies were located very close to the summit point, representing heat flow from both the South and North Pit Craters within the Summit Caldera. Beginning on 21 January 2017, the jump in location of the anomalies corresponded with the beginning of the eruption in the Southeast Caldera. The MIROVA thermal anomalies progressed farther from the summit point during March and April 2017, when the northeast flow field was lengthening to the NE. The thermal signal jumps back closer to the summit point in early May corresponding to when new breakouts were spotted near the Southeast Caldera lava lake; the flows again traveled away from the lake during June and July 2017. Active lava flows from mid-August 2017 through March 2018 were visible in satellite imagery 12-16 km from the lava lake, which is reflected in the MIROVA data (figure 86).
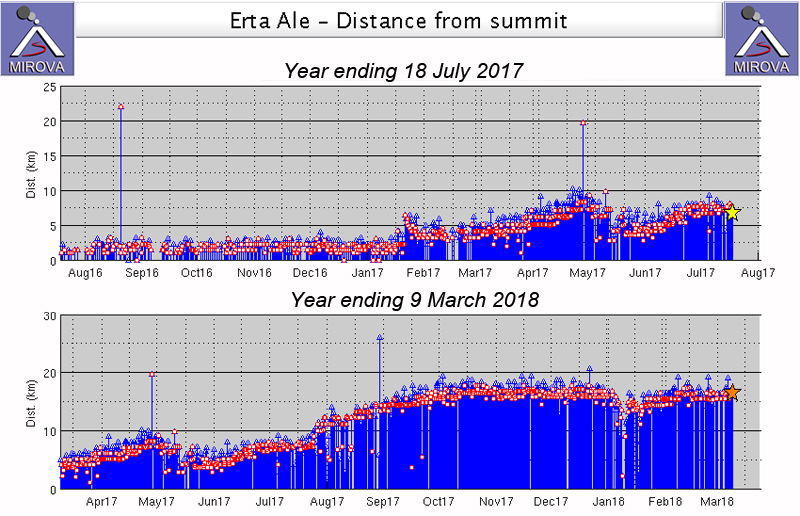 |
Figure 86. MIROVA data showing the distance from the summit point of thermal anomalies at Erta Ale. Upper graph is the year ending 18 July 2017. Lower graph is the year ending 9 March 2018. They correspond well with locations of thermal anomalies that appear in numerous satellite images during that time. Note the distance scale change. See text and earlier figures for details. Courtesy of MIROVA. |
The MIROVA data for the radiative power released from Erta Ale during August 2016-March 2018 also corresponds well with satellite and ground observations (figure 87). The levels of radiative power were moderate and constant during August 2016 to mid-January 2017 when only the lava lake and hornitos at the South and North Pit Craters were active (see also figure 47, BGVN 42:07). A moderate spike in the radiative power corresponds to the overflow of the South Pit Crater during 16-20 January 2017, followed by a large spike in radiative power on 21 January when the eruption started in the Southeast Caldera. This was followed by an extended period of increased radiative power as extensive flow fields formed in the Southeast Caldera. The graph is also able to distinguish the movement of the flows from near the Southeast Caldera lava lake to farther away and then near again during March-June 2017. The radiative power graph from 10 March 2017-9 March 2018 clearly shows a gradual decrease in the amount of radiative power over the period, suggesting a decline in flow activity, which corresponds well to satellite observations.
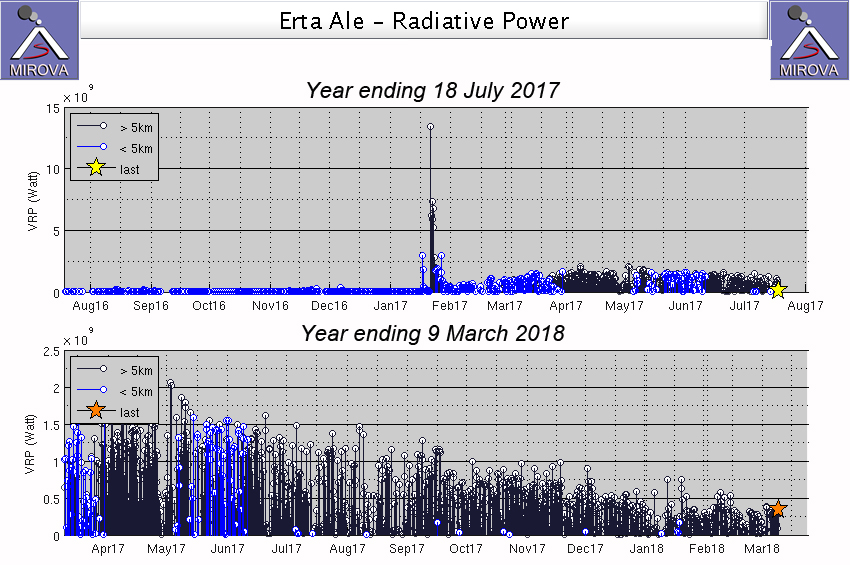 |
Figure 87. MIROVA plots of radiative power at Erta Ale for 18 July 2016-18 July 2017 (upper) and 9 March 2017-9 March 2018 (lower). Note the different y-axis scales for VRP due to the large spike on 21 January 2017 at the beginning of the Southeast Caldera eruptive episode. The plots record both the movement of the flow fields away from and closer to the summit point during March-June 2017, and then the gradual decrease in radiative energy from May 2017 through early March 2018. Courtesy of MIROVA. |
Geological Summary. The Erta Ale basaltic shield volcano in Ethiopia has a 50-km-wide edifice that rises more than 600 m from below sea level in the Danakil depression. The volcano includes a 0.7 x 1.6 km summit crater hosting steep-sided pit craters. Another larger 1.8 x 3.1 km wide depression elongated parallel to the trend of the Erta Ale range is located SE of the summit and is bounded by curvilinear fault scarps on the SE side. Basaltic lava flows from these fissures have poured into the caldera and locally overflowed its rim. The summit caldera usually also holds at least one long-term lava lake that has been active since at least 1967, and possibly since 1906. Recent fissure eruptions have occurred on the N flank.
Information Contacts: European Space Agency (ESA), Copernicus (URL: http://www.esa.int/Our_Activities/Observing_the_Earth/Copernicus; Robert Simon, Sr., Data Visualization Engineer, Planet Labs Inc. (URL: http://www.planet.com/) [Images used under https://creativecommons.org/licenses/by-sa/4.0/]; Cultur Volcan, Journal d'un volcanophile (URL: https://laculturevolcan.blogspot.com); Toucan Photo (URL: http://www.toucan.photo/); Tom Pfeiffer, Volcano Discovery (URL: http://www.volcanodiscovery.com/); MIROVA (Middle InfraRed Observation of Volcanic Activity), a collaborative project between the Universities of Turin and Florence (Italy) supported by the Centre for Volcanic Risk of the Italian Civil Protection Department (URL: http://www.mirovaweb.it/); Stefan Tommasini (URL: http://vulkane-und-natur.de/).