Report on Sabancaya (Peru) — December 2018
Bulletin of the Global Volcanism Network, vol. 43, no. 12 (December 2018)
Managing Editor: Edward Venzke.
Edited by Janine B. Krippner.
Sabancaya (Peru) Frequent ash plumes continued during June-November 2018
Please cite this report as:
Global Volcanism Program, 2018. Report on Sabancaya (Peru) (Krippner, J.B., and Venzke, E., eds.). Bulletin of the Global Volcanism Network, 43:12. Smithsonian Institution. https://doi.org/10.5479/si.GVP.BGVN201812-354006
Sabancaya
Peru
15.787°S, 71.857°W; summit elev. 5960 m
All times are local (unless otherwise noted)
Sabancaya has been continuously active in recent years after renewed unrest began in February 2013 following almost 10 years of quiescence. After an increase in seismicity and an increase in the volume and frequency of fumarole emissions, the first explosion of the current eruption occurred in November 2016. Since then, activity has largely consisted of ash plumes and fumarolic activity.
This report summarizes activity during June-November 2018 (table 3) and is based on reports by the Observatorio Vulcanológico division of El Instituto Geológico, Minero y Metalúrgico (OVI-INGEMMET) and Instituto Geofísico del Perú (IGP), and satellite data. During this time the average daily number of explosions was 22, and ranged from 13 to 30. Maximum ash plume heights varied between 1.3 to 4.5 km above the crater, with the maximum plume heights each month usually between 2.5 and 3.7 km. SO2 emissions were variable and reached a maximum of 14,859 tons per day and the drift directions were wind dependent (figure 51).
Table 3. Summary of eruptive activity at Sabancaya during June-November 2018 based on OVI-INGEMMET weekly reports and the HIGP MODVOLC hotspot monitoring algorithm.
| Month | Avg. Daily Explosions by week | Max Plume Heights (m above crater) | Plume Drift | MODVOLC Alerts | Max SO2 tons/day |
| Jun 2018 | 24, 19, 29, 24 | 1,300-2,500 | 20-30 km, E, S, SE | 19 | 3,000-5,600 |
| Jul 2018 | 22, 23, 25, 24 | 1,300-2,500 | 20-30 km, S, SE, E | 12 | 4,715-14,859 |
| Aug 2018 | 19, 23, 27, 25, 25 | 2,600-4,500 | 30-50 km, N, NE, S, SE | 27 | 2,230-5,000 |
| Sep 2018 | 17, 13, 16, 21 | 2,500-3,700 | 30-50 km, N, NE, S, SE, NW | 28 | 1,600-3,970 |
| Oct 2018 | 24, 17, 23, 30 | 2,500-3,500 | 30-50 km, N, NE, SE, S, SW, W | 21 | 2,200-5,027 |
| Nov 2018 | 30, 18, 20, 20, 21 | 2,500-3,700 | 30-40 km, N, E, SE, S, SW, W, NW | 35 | 2,300-4,600 |
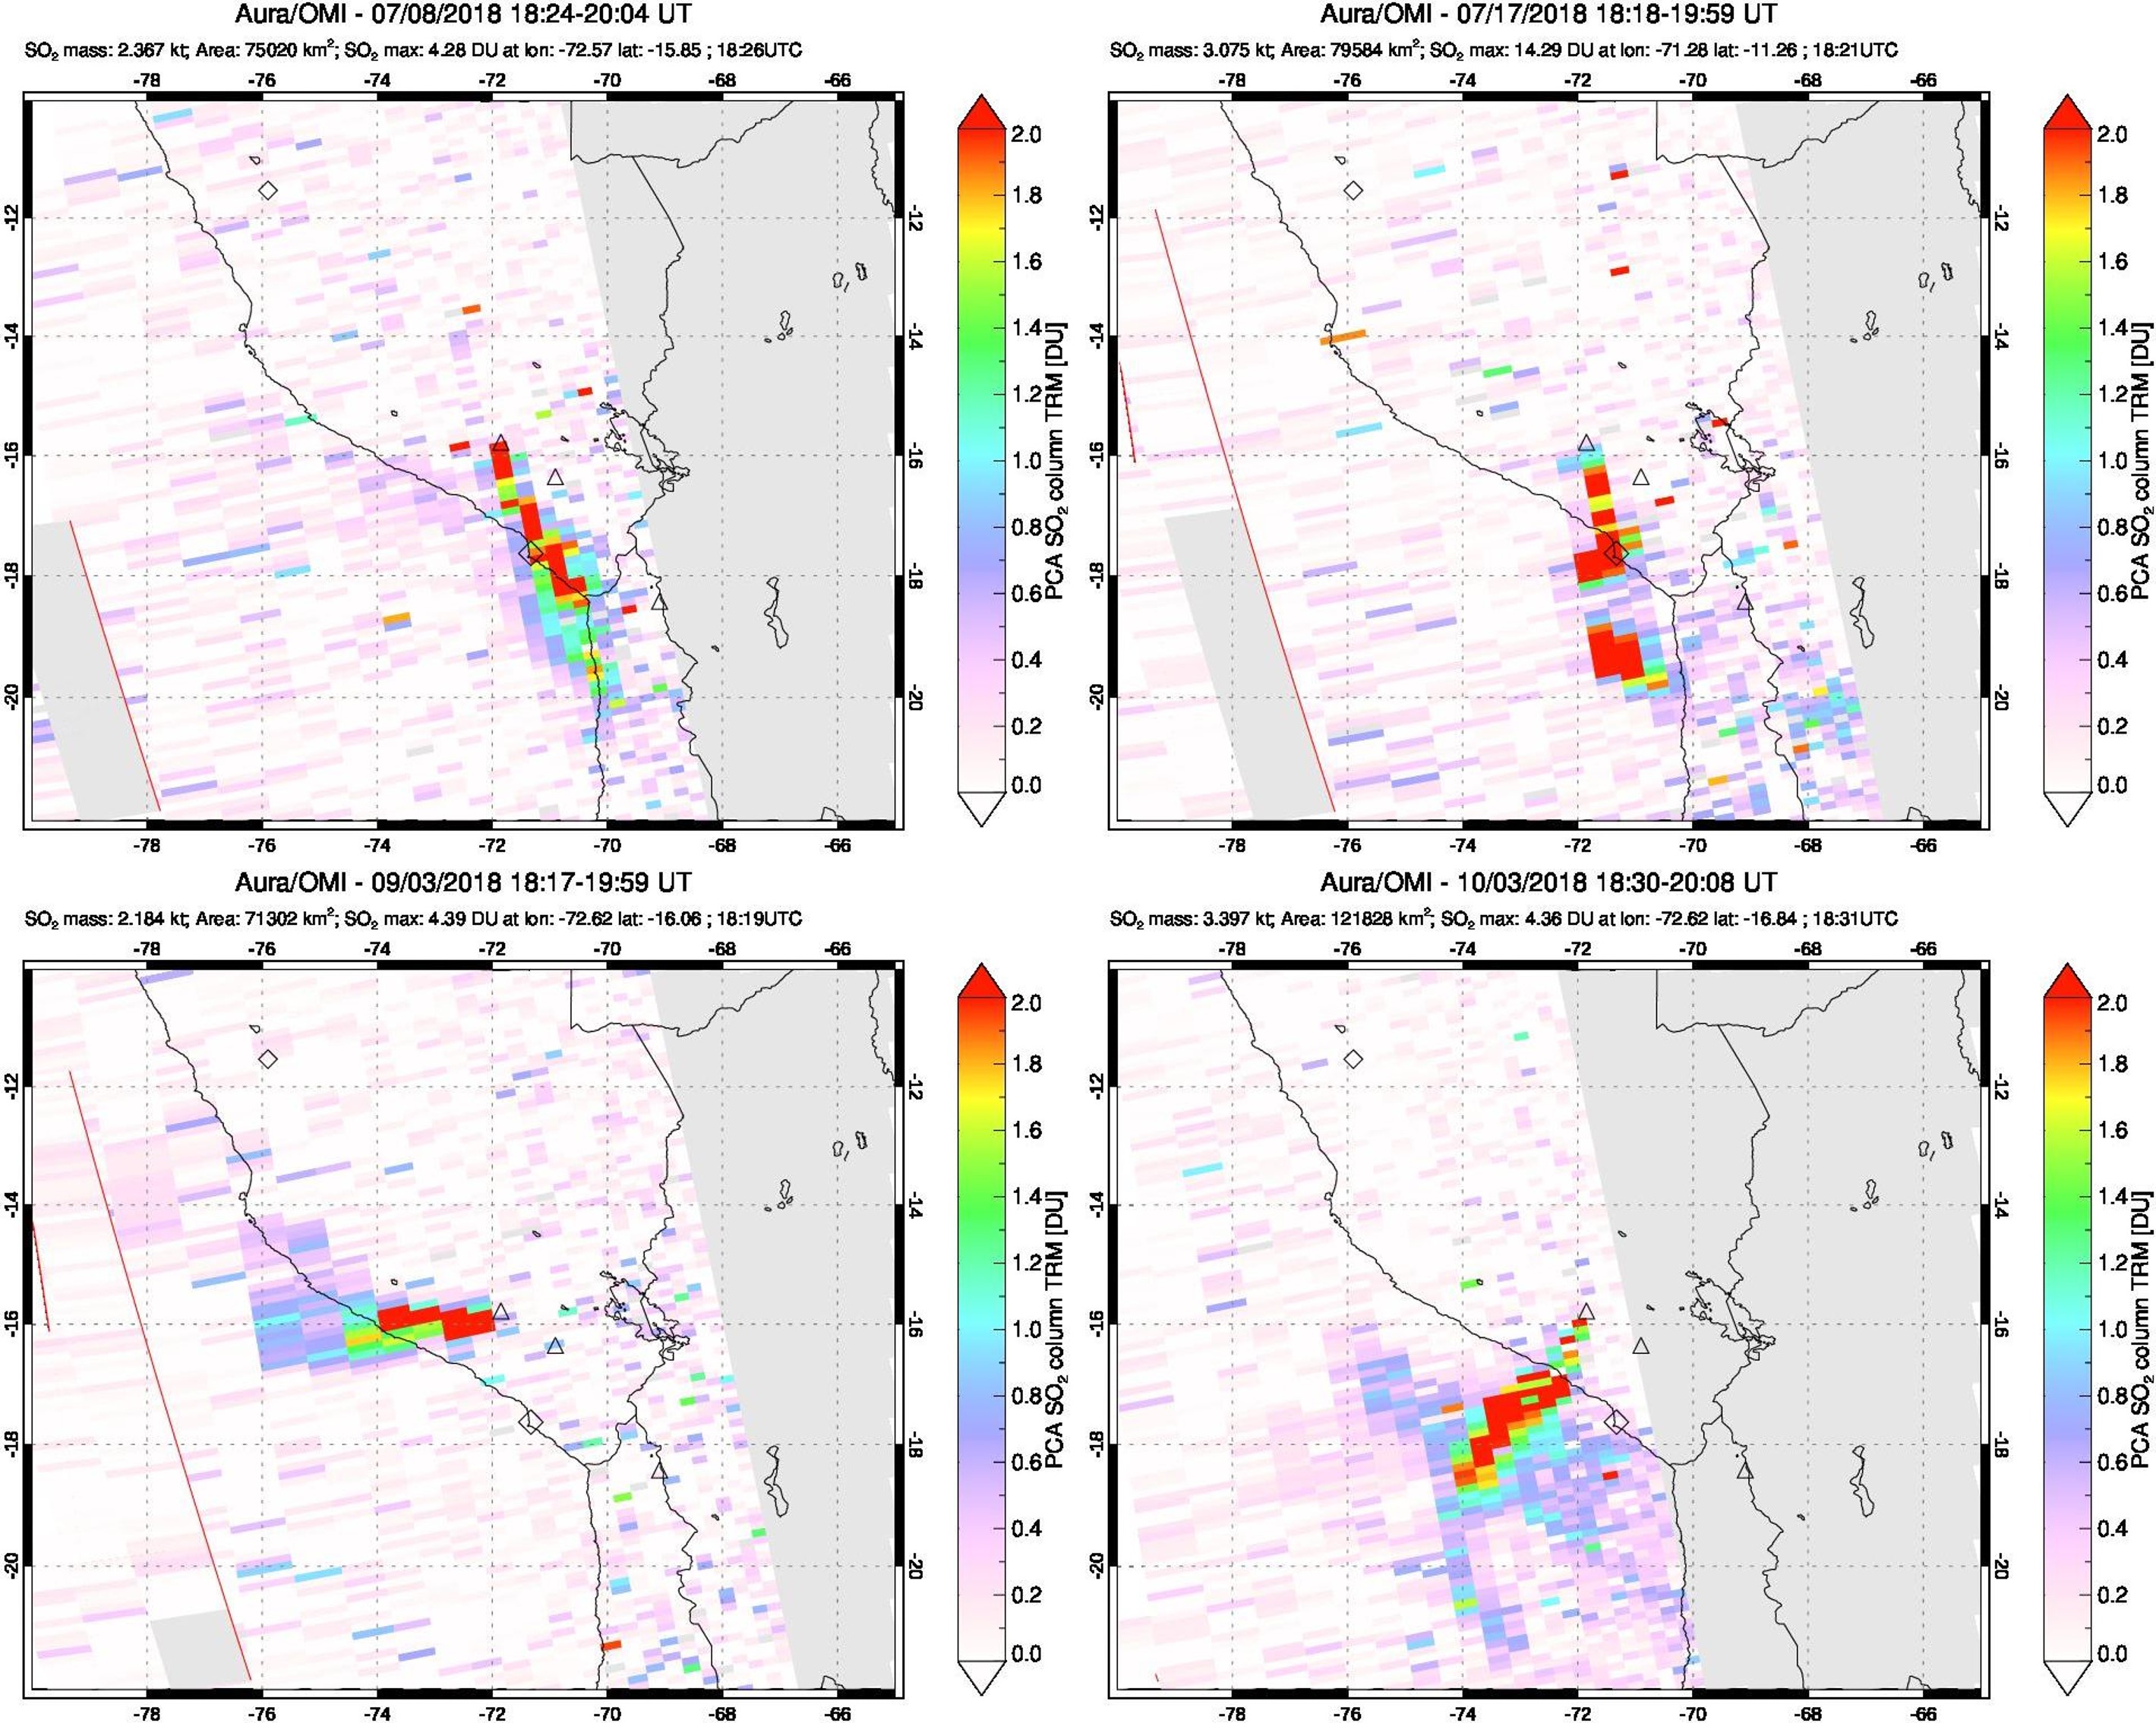 |
Figure 51. Examples of SO2 plumes from Sabancaya detected by the NASA Ozone Monitoring Instrument (OMI) in July, September, and October 2018 (dates, times, and SO2 max values are given in the header of each image). Courtesy of NASA Goddard Flight Center. |
During June, Sabancaya produced 19-29 explosions per day that ejected ash plumes up to heights of 1.3-2.5 km above the crater (figure 52). These ash plumes extended to 20-30 km away from the volcano. The maximum emissions of SO2 throughout the month ranged from 3,500 to 5,600 tons per day. There was a total of 19 MIROVA thermal anomalies.
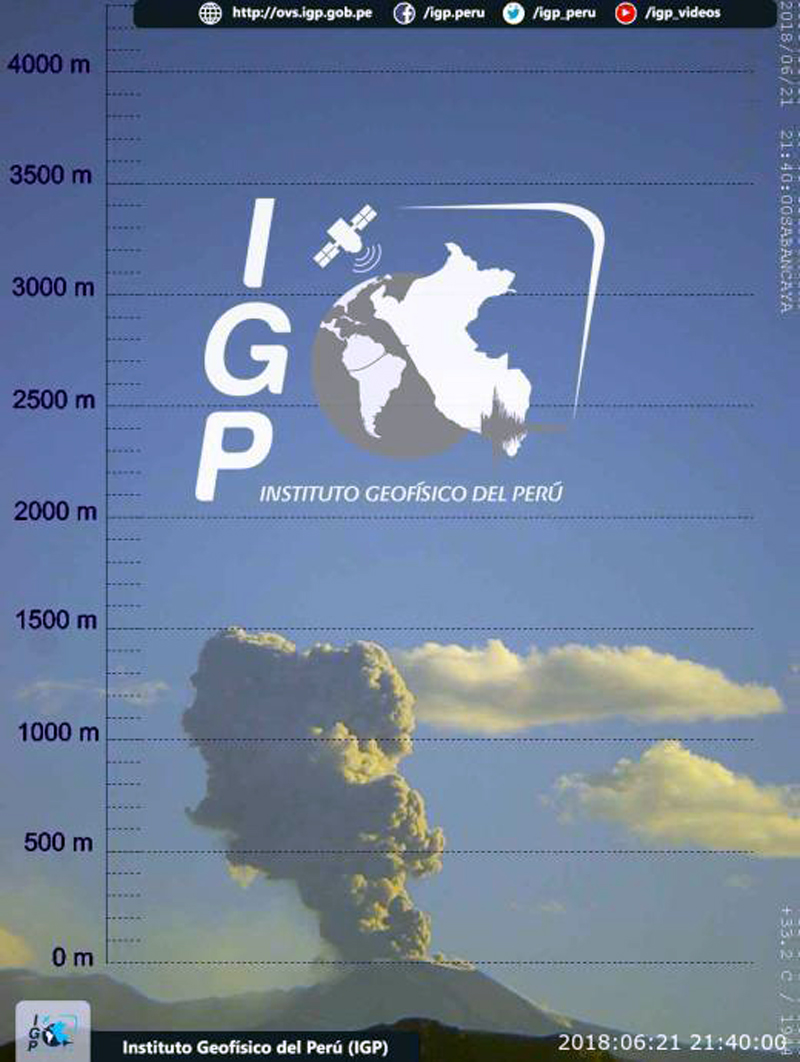 |
Figure 52. An IGP webcam recorded an ash plume at Sabancaya that reached 1,500 m above the crater on 21 June 2018. Courtesy of IGP via OVI-INGEMMET (RSSAB-25-2018 18-24 June 2018 report). |
Throughout July there were on average 22-25 explosions per day. Ash plumes reached heights of 1.3-2.5 km above the crater, and drifted 20-30 km to the S, SE, and E (figure 53). On 23 July, Sabancaya produced a continuous ash plume that traveled over 100 km to the SE (figure 54). SO2 emissions were higher this month, with maximum emissions reaching 14,859 tons per day. Twelve MODVOLC thermal alerts were issued.
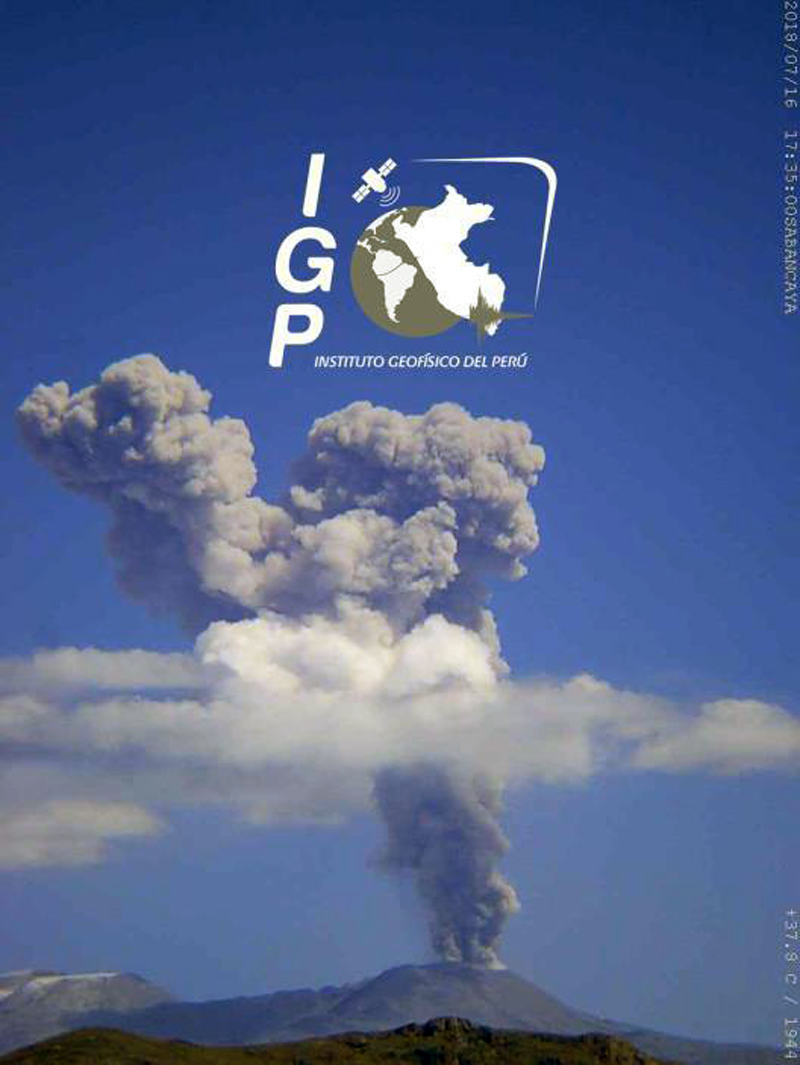 |
Figure 53. An ash plume rising through meteorological clouds at Sabancaya on 16 July 2018. Courtesy of IGP via OVI-INGEMMET (RSSAB-29-2018 16-22 July 2018 report). |
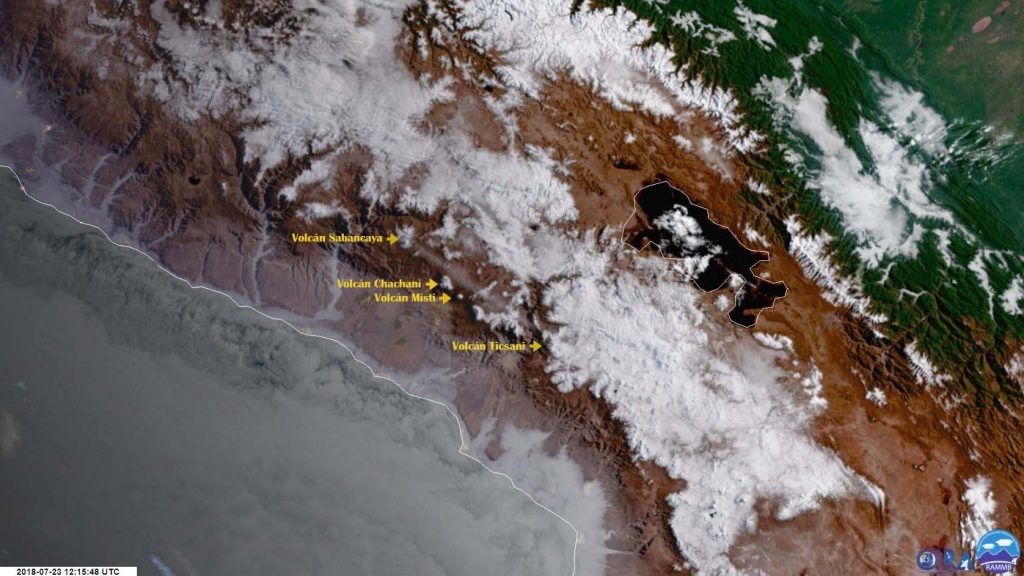 |
Figure 54. The ash plume at Sabancaya on 23 July 2018 traveled over Chachani, Misti, and Ubinas volcanoes, and the Quinistaquillas, Carumas, and Calacoa districts. Courtesy of OVI-INGEMMET (13 August 2018 report). |
There were an average of 19-27 explosions per day throughout August (figure 55). Ash plumes reached maximum heights of 2.6-4.5 km, and drifted 30-50 km away in various directions. Activity generated two ash plumes on 24 August, one to 4 km above the crater at 0800 and the other to 4.5 km at 0945 (figure 56). The ash was dispersed to the NE, N, and E for 30 km over the towns of Chivay, Yanque, Coporaque, Ichupampa, Achoma, Maca and Pinchollo. On the 25th, an explosion at 1020 produced an ash plume to over 3 km above the crater that resulted in ashfall in the towns of Achoma, Maca and Pinchollo. There were 28 MODVOLC thermal alerts throughout the month. The maximum SO2 emissions reached 2,230-5,000 tons per day.
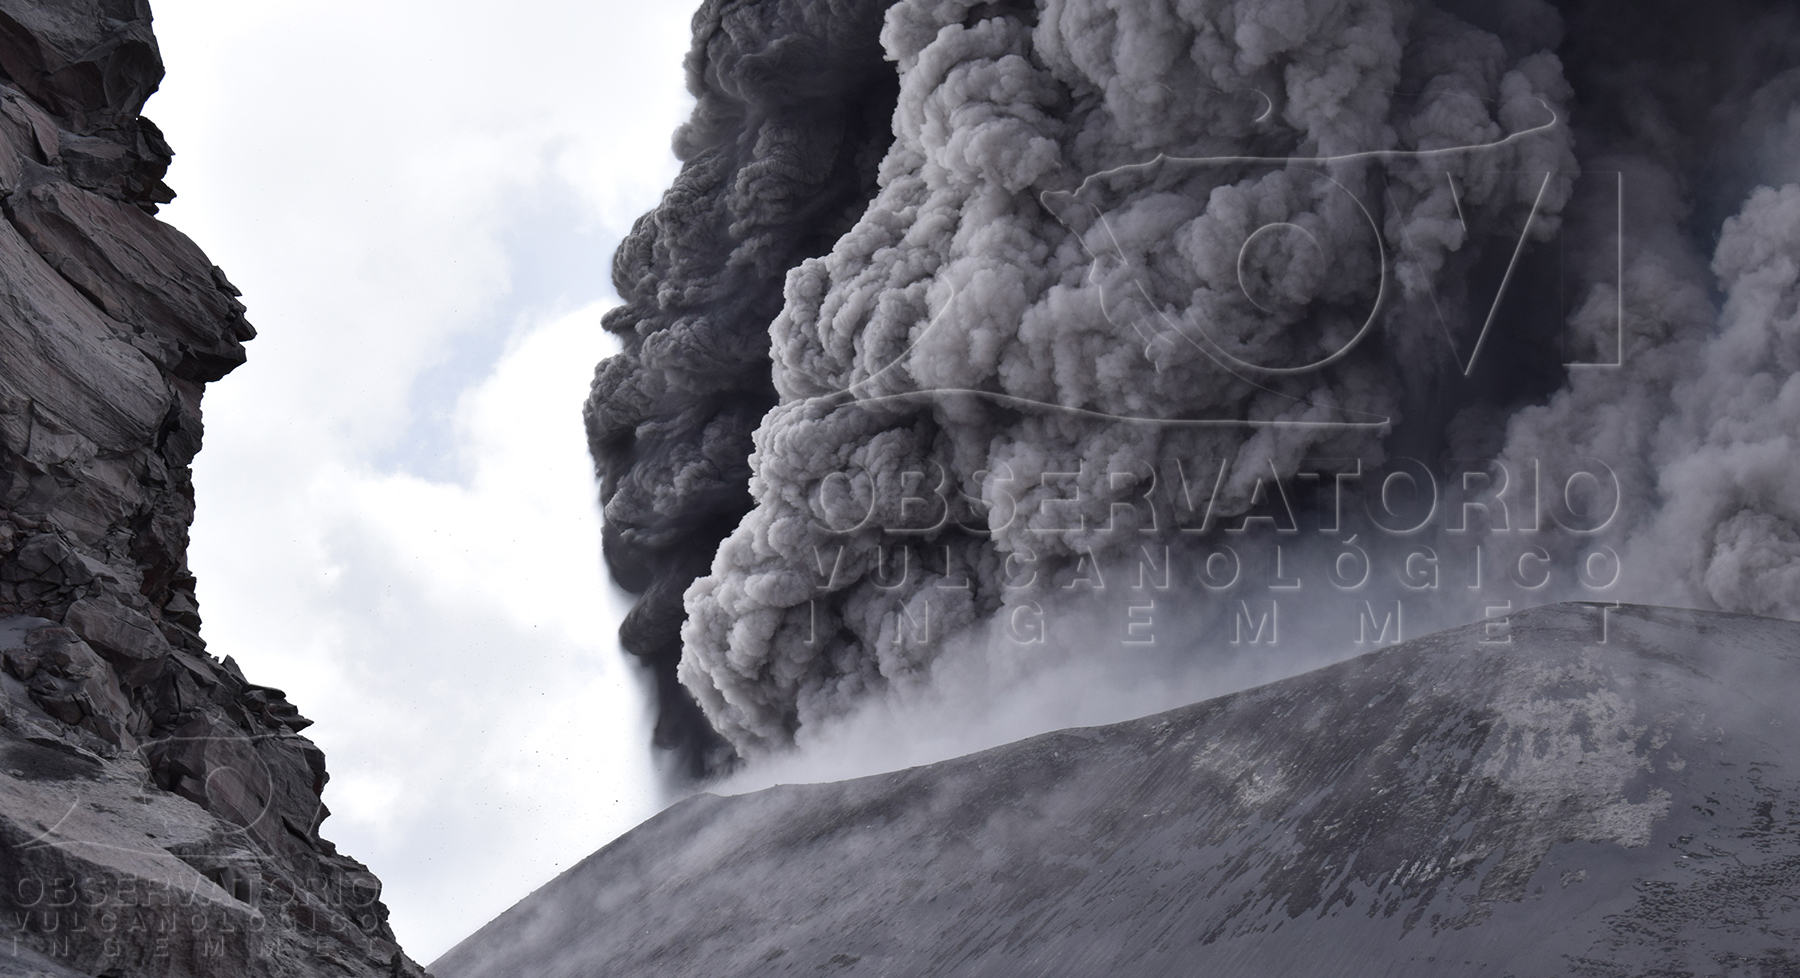 |
Figure 55. Photograph of an explosion producing an ash plume at Sabancaya in early August 2018, taken while OVI-INGEMMET installed monitoring equipment. Courtesy of OVI-INGEMMET (10 August 2018 report). |
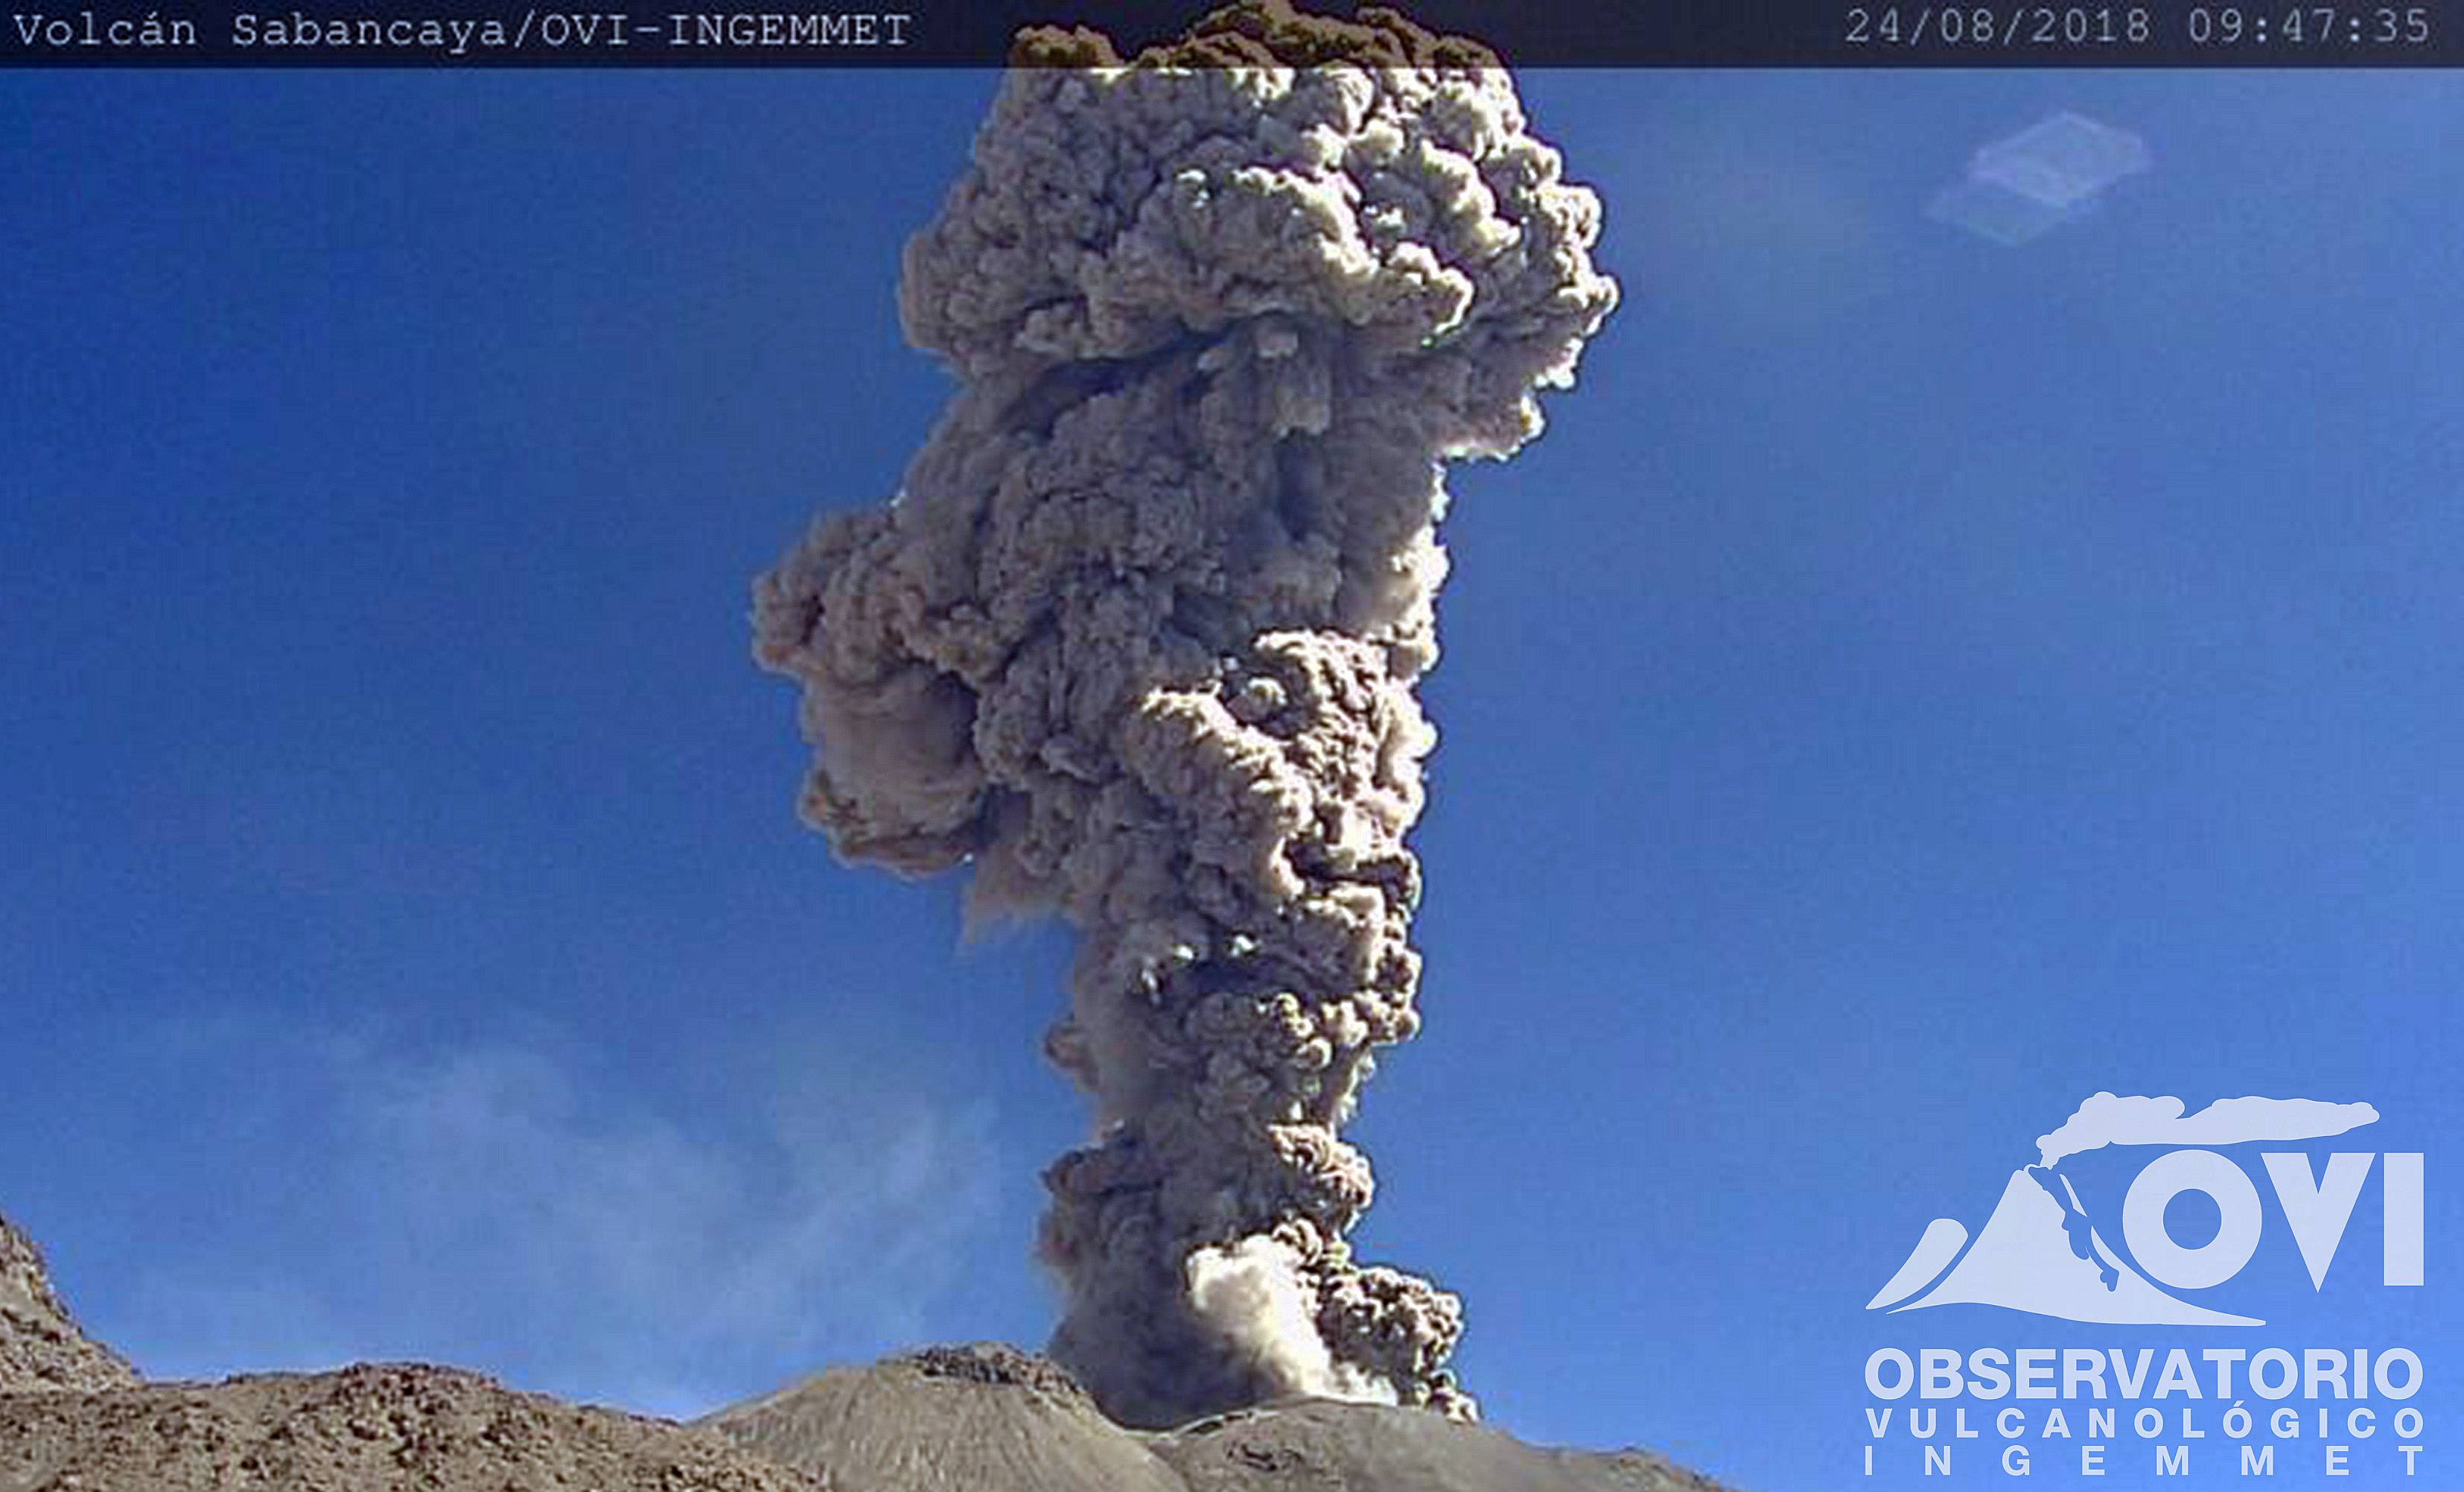 |
Figure 56. An ash plume at Sabancaya on 24 August 2018 at 0947 that reached a 4.5 km above the crater. The ash was dispersed 30 km to the NE, N, and E, and impacted the towns of Chivay, Yanque, Coporaque, Ichupampa, Achoma, Maca, and Pinchollo. Courtesy of OVI-INGEMMET (27 August 2018 report). |
There was an average of 13-21 explosions per day during September, with ash plumes reaching 2.5-3.5 km above the crater. The ash traveled 30-50 km away in different directions (figure 57). There were 28 MODVOLC thermal alerts issued throughout the month, consistent with elevated thermal activity that is visible in Sentinel-2 satellite images (figure 58). The maximum measured SO2 emissions were 1,600-3,970 tons per day. A drone overflight by the IGP and the Pontifical Catholic University of Peru (PUCP) in the third week of September gave the first view of the crater since the eruption began in 2016 (figure 59), revealing lava in the crater and at least six ash emission points.
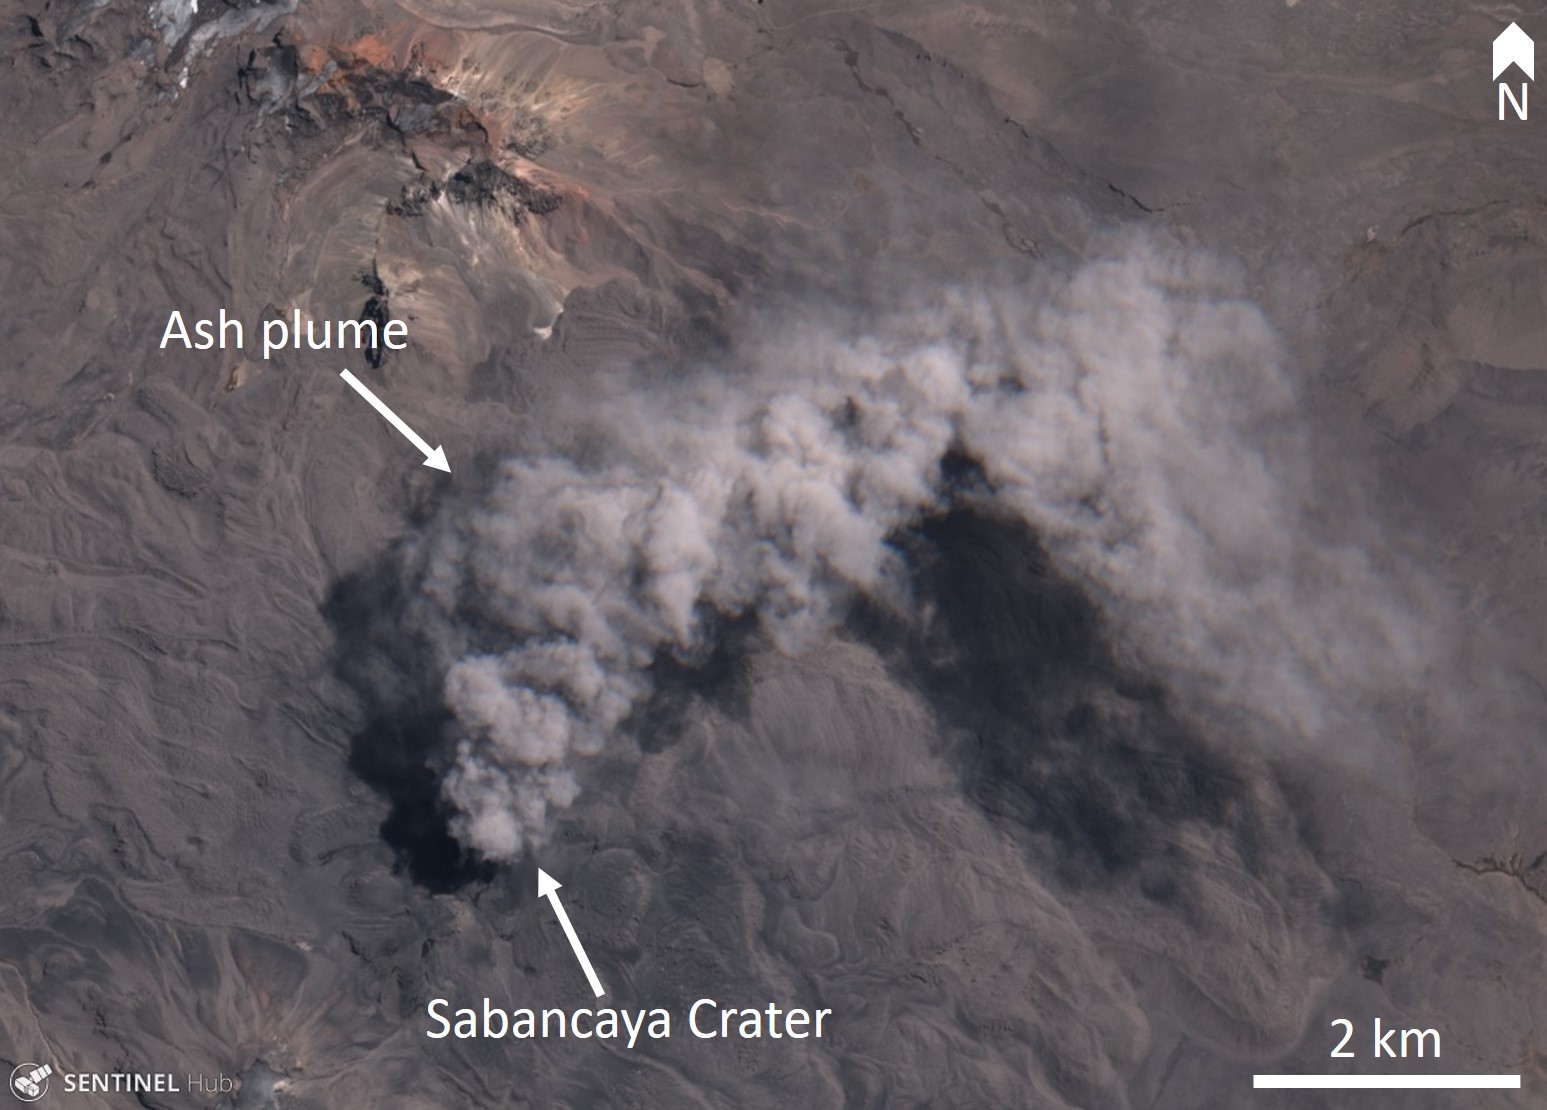 |
Figure 57. Sentinel-2 satellite image of an ash plume at Sabancaya on 17 September 2018. The ash plume was directed towards the NE, then the SE. Natural color (bands 4, 3, 2) image courtesy of Sentinel Hub Playground. |
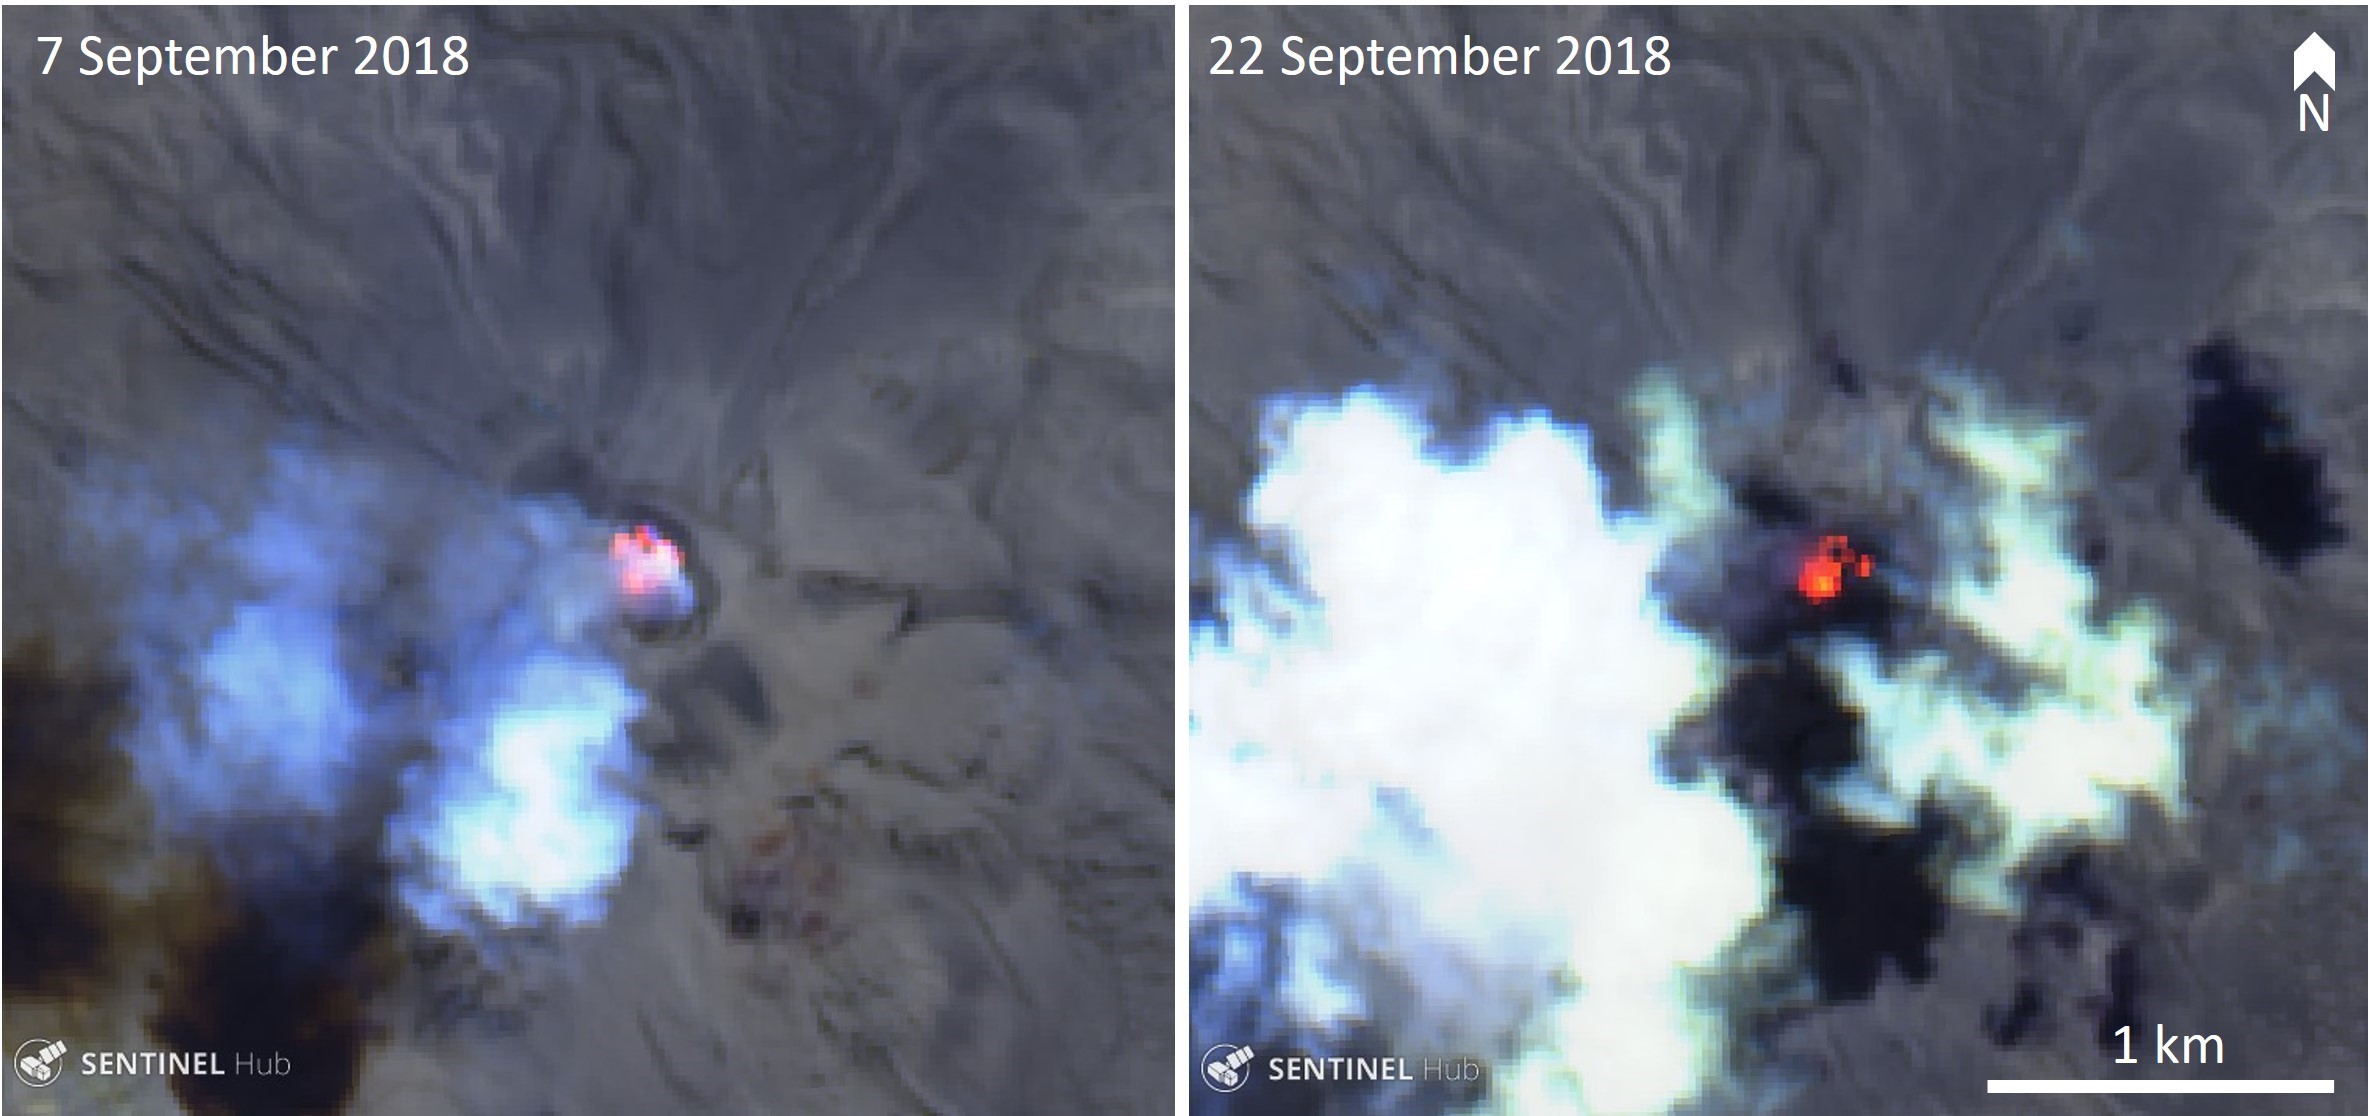 |
Figure 58. Sentinel-2 satellite images showing elevated thermal activity (bright orange-red) in the Sabancaya crater on the 7 and 22 September 2018. False color (urban) images (bands 12, 11, 4) courtesy of Sentinel Hub Playground. |
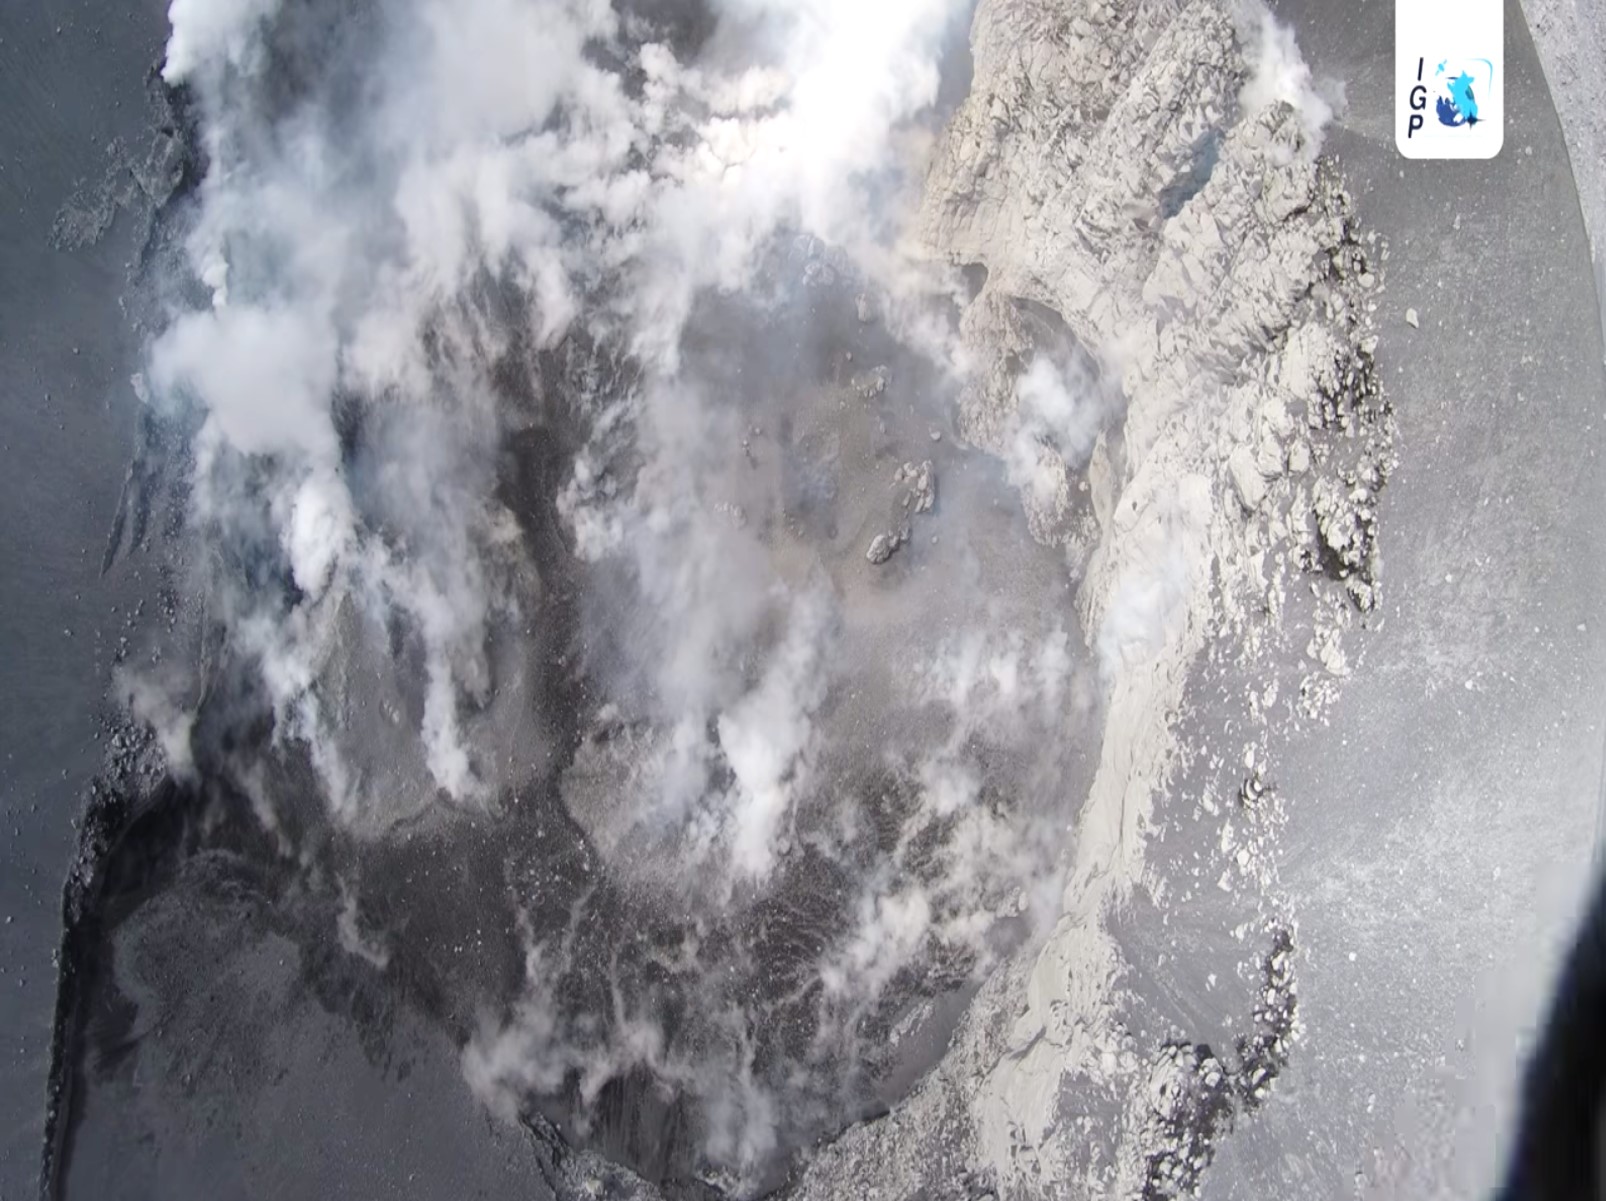 |
Figure 59. Drone video of the Sabancaya crater was taken in September 2018 showed lava on the crater floor and ash emissions from six locations. This image is a screenshot taken from video collected during the collaborative overflight by IGP and the Pontifical Catholic University of Peru. Courtesy of IGP (24 September 2018 report). |
Similar activity continued through October, with an average of 17-30 reported explosions per day. Ash plumes reached maximum heights of 2.5-3.5 km and dispersed 30-50 km in various directions (figure 60). Ashfall was reported in the Huanca area during the week of 1-7 October. Maximum SO2 emissions were 2,200-5,027 tons per day. There were 21 MODVOLC thermal alerts issued for the month.
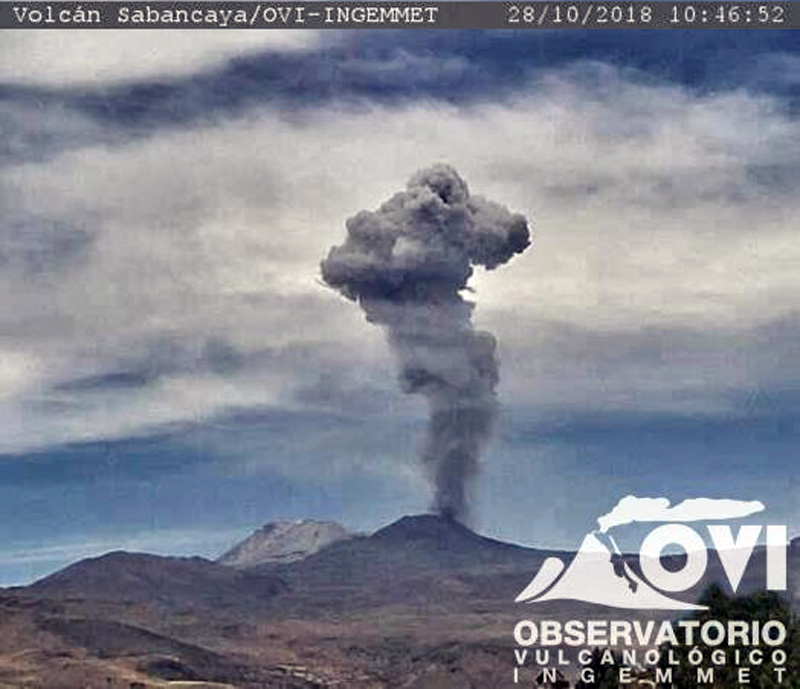 |
Figure 60. An example of an ash plume at Sabancaya on 28 October 2018. Courtesy of OVI-INGEMMET (RSSAB-43-2018 22-28 October weekly report). |
November 2018 marked two years of uninterrupted activity at Sabancaya (figure 61). Between November 2016 and November 2017 there were 14,000 registered explosions with an average of 39 per day. From November 2017 to November 2018 there were more than 9,800 explosions recorded with an average of 27 per day. During the month there was an average of 18-30 explosions per day, with ash plumes reaching maximum heights of 2.5-3.7 km above the crater and dispersing 30-40 km in all directions. This month saw the highest number of MODVOLC thermal alerts with a total of 35. The maximum detected SO2 emissions were 2,300-4,600 tons per day.
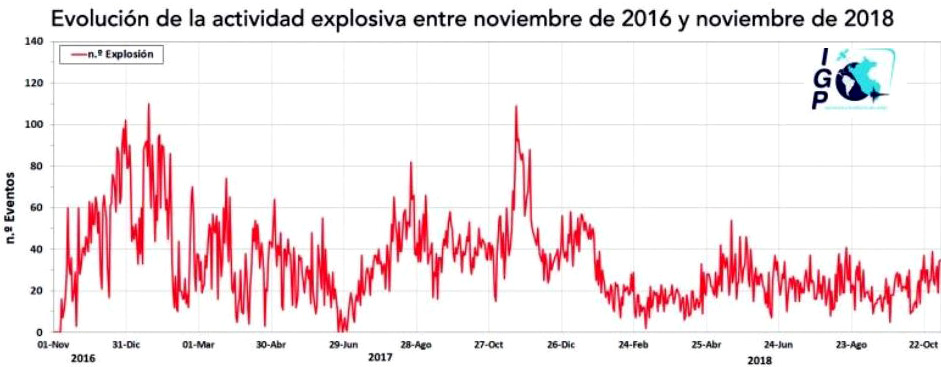 |
Figure 61. Graph showing the number of explosions per day at Sabancaya from November 2017 through to November 2018. Courtesy of IGP (6 November 2018 report). |
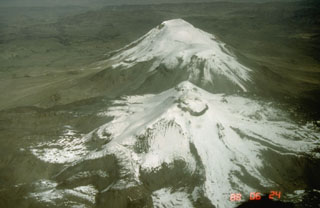
Geological Summary. Sabancaya, located in the saddle NE of Ampato and SE of Hualca Hualca volcanoes, is the youngest of these volcanic centers and the only one to have erupted in historical time. The oldest of the three, Nevado Hualca Hualca, is of probable late-Pliocene to early Pleistocene age. The name Sabancaya (meaning "tongue of fire" in the Quechua language) first appeared in records in 1595 CE, suggesting activity prior to that date. Holocene activity has consisted of Plinian eruptions followed by emission of voluminous andesitic and dacitic lava flows, which form an extensive apron around the volcano on all sides but the south. Records of observed eruptions date back to 1750 CE.
Information Contacts: Observatorio Volcanologico del INGEMMET, (Instituto Geológical Minero y Metalúrgico), Barrio Magisterial Nro. 2 B-16 Umacollo - Yanahuara Arequipa, Peru (URL: http://ovi.ingemmet.gob.pe; video URL: https://www.youtube.com/watch?v=CpLhruMwuxQ); Instituto Geofisico del Peru, Observatoria Vulcanologico del Sur (IGP-OVS), Arequipa Regional Office, Urb La Marina B-19, Cayma, Arequipa, Peru (URL: http://ovs.igp.gob.pe/); NASA Goddard Space Flight Center (NASA/GSFC), Global Sulfur Dioxide Monitoring Page, Atmospheric Chemistry and Dynamics Laboratory, 8800 Greenbelt Road, Goddard, Maryland, USA (URL: https://so2.gsfc.nasa.gov/); Sentinel Hub Playground (URL: https://www.sentinel-hub.com/explore/sentinel-playground).