Report on Planchon-Peteroa (Chile) — June 2019
Bulletin of the Global Volcanism Network, vol. 44, no. 6 (June 2019)
Managing Editor: Edward Venzke.
Edited by Janine B. Krippner.
Planchon-Peteroa (Chile) Frequent ash plumes during March-April; last ash deposit seen in early May 2019
Please cite this report as:
Global Volcanism Program, 2019. Report on Planchon-Peteroa (Chile) (Krippner, J.B., and Venzke, E., eds.). Bulletin of the Global Volcanism Network, 44:6. Smithsonian Institution. https://doi.org/10.5479/si.GVP.BGVN201906-357040
Planchon-Peteroa
Chile
35.223°S, 70.568°W; summit elev. 3977 m
All times are local (unless otherwise noted)
Planchón-Peteroa is located along the Chile-Argentina border and is the northernmost volcano of the Maule region. Eruptions have been intermittent in recent times and have consisted largely of gas-and-steam and ash plumes, with the most recent eruption phase beginning in November 2018. This report covers March through May 2019; the last evidence for ash emissions was during 6-8 May, after which the activity consisted of only gas-and-steam plumes. This report summarizes activity reports by Servicio Nacional de Geología y Minería (SERNAGEOMIN) and Oficina Nacional de Emergencia - Ministerio del Interior (ONEMI), and various satellite data.
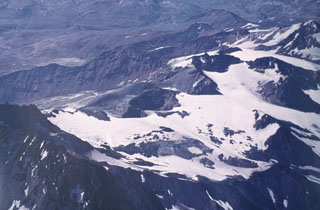
During 1-15 March ash plumes reached 2 km above the crater, with an increase in maximum plume heights after the 7th. Elevated sulfur dioxide (SO2) emissions were detected on 8 and 12 March. From 12 to 31 March ash plumes reached maximum heights of 1.6 km above the crater. An ash plume on 26 March reached 1.2 km (figure 21). Ash plumes were frequently imaged by the Sentinel-2 satellite, with the wind dispersing the ash plumes primarily to the SE (figure 22). Degassing was continuous throughout March, and SO2 emissions were detected by the TROPOspheric Monitoring Instrument (TROPOMI, figure 23). Sentinel-2 data showed one thermal anomaly for this period, on 12 March.
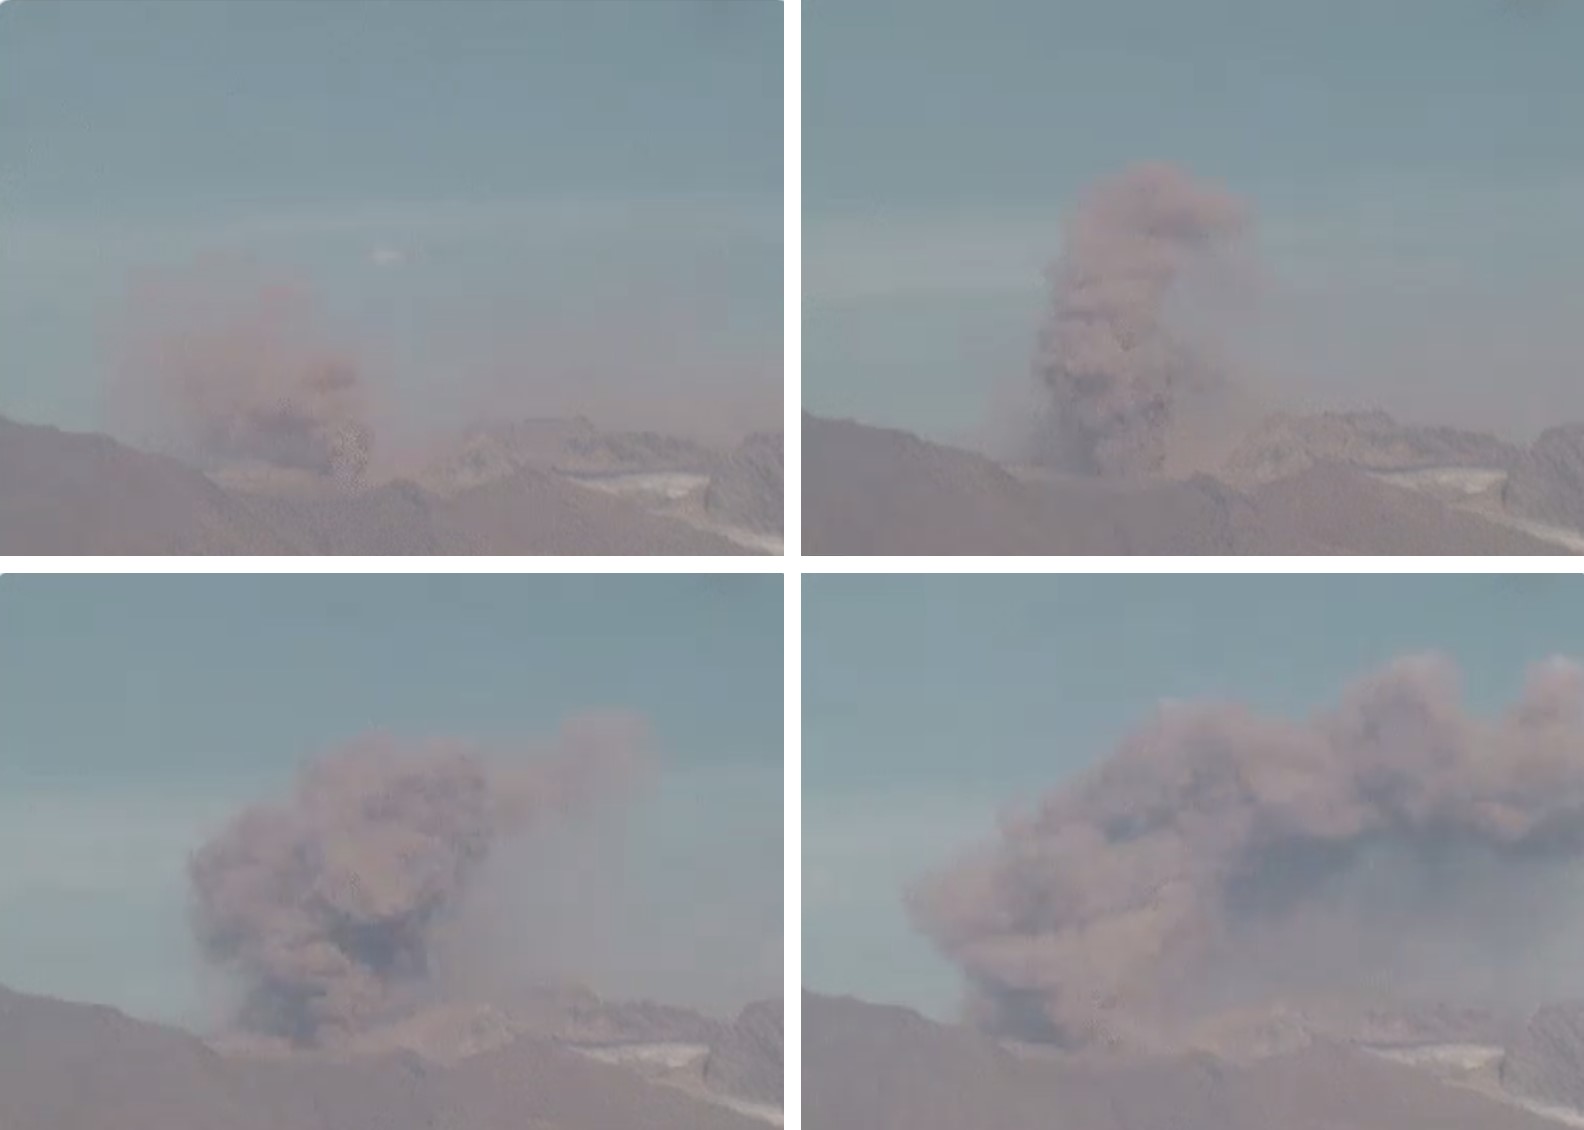 |
Figure 21. Screenshots of footage shared by SERNAGEOMIN showing an ash plume reaching 1.2 km above the crater at 1650 on 26 March 2019. Webcam images courtesy of SERNAGEOMIN. |
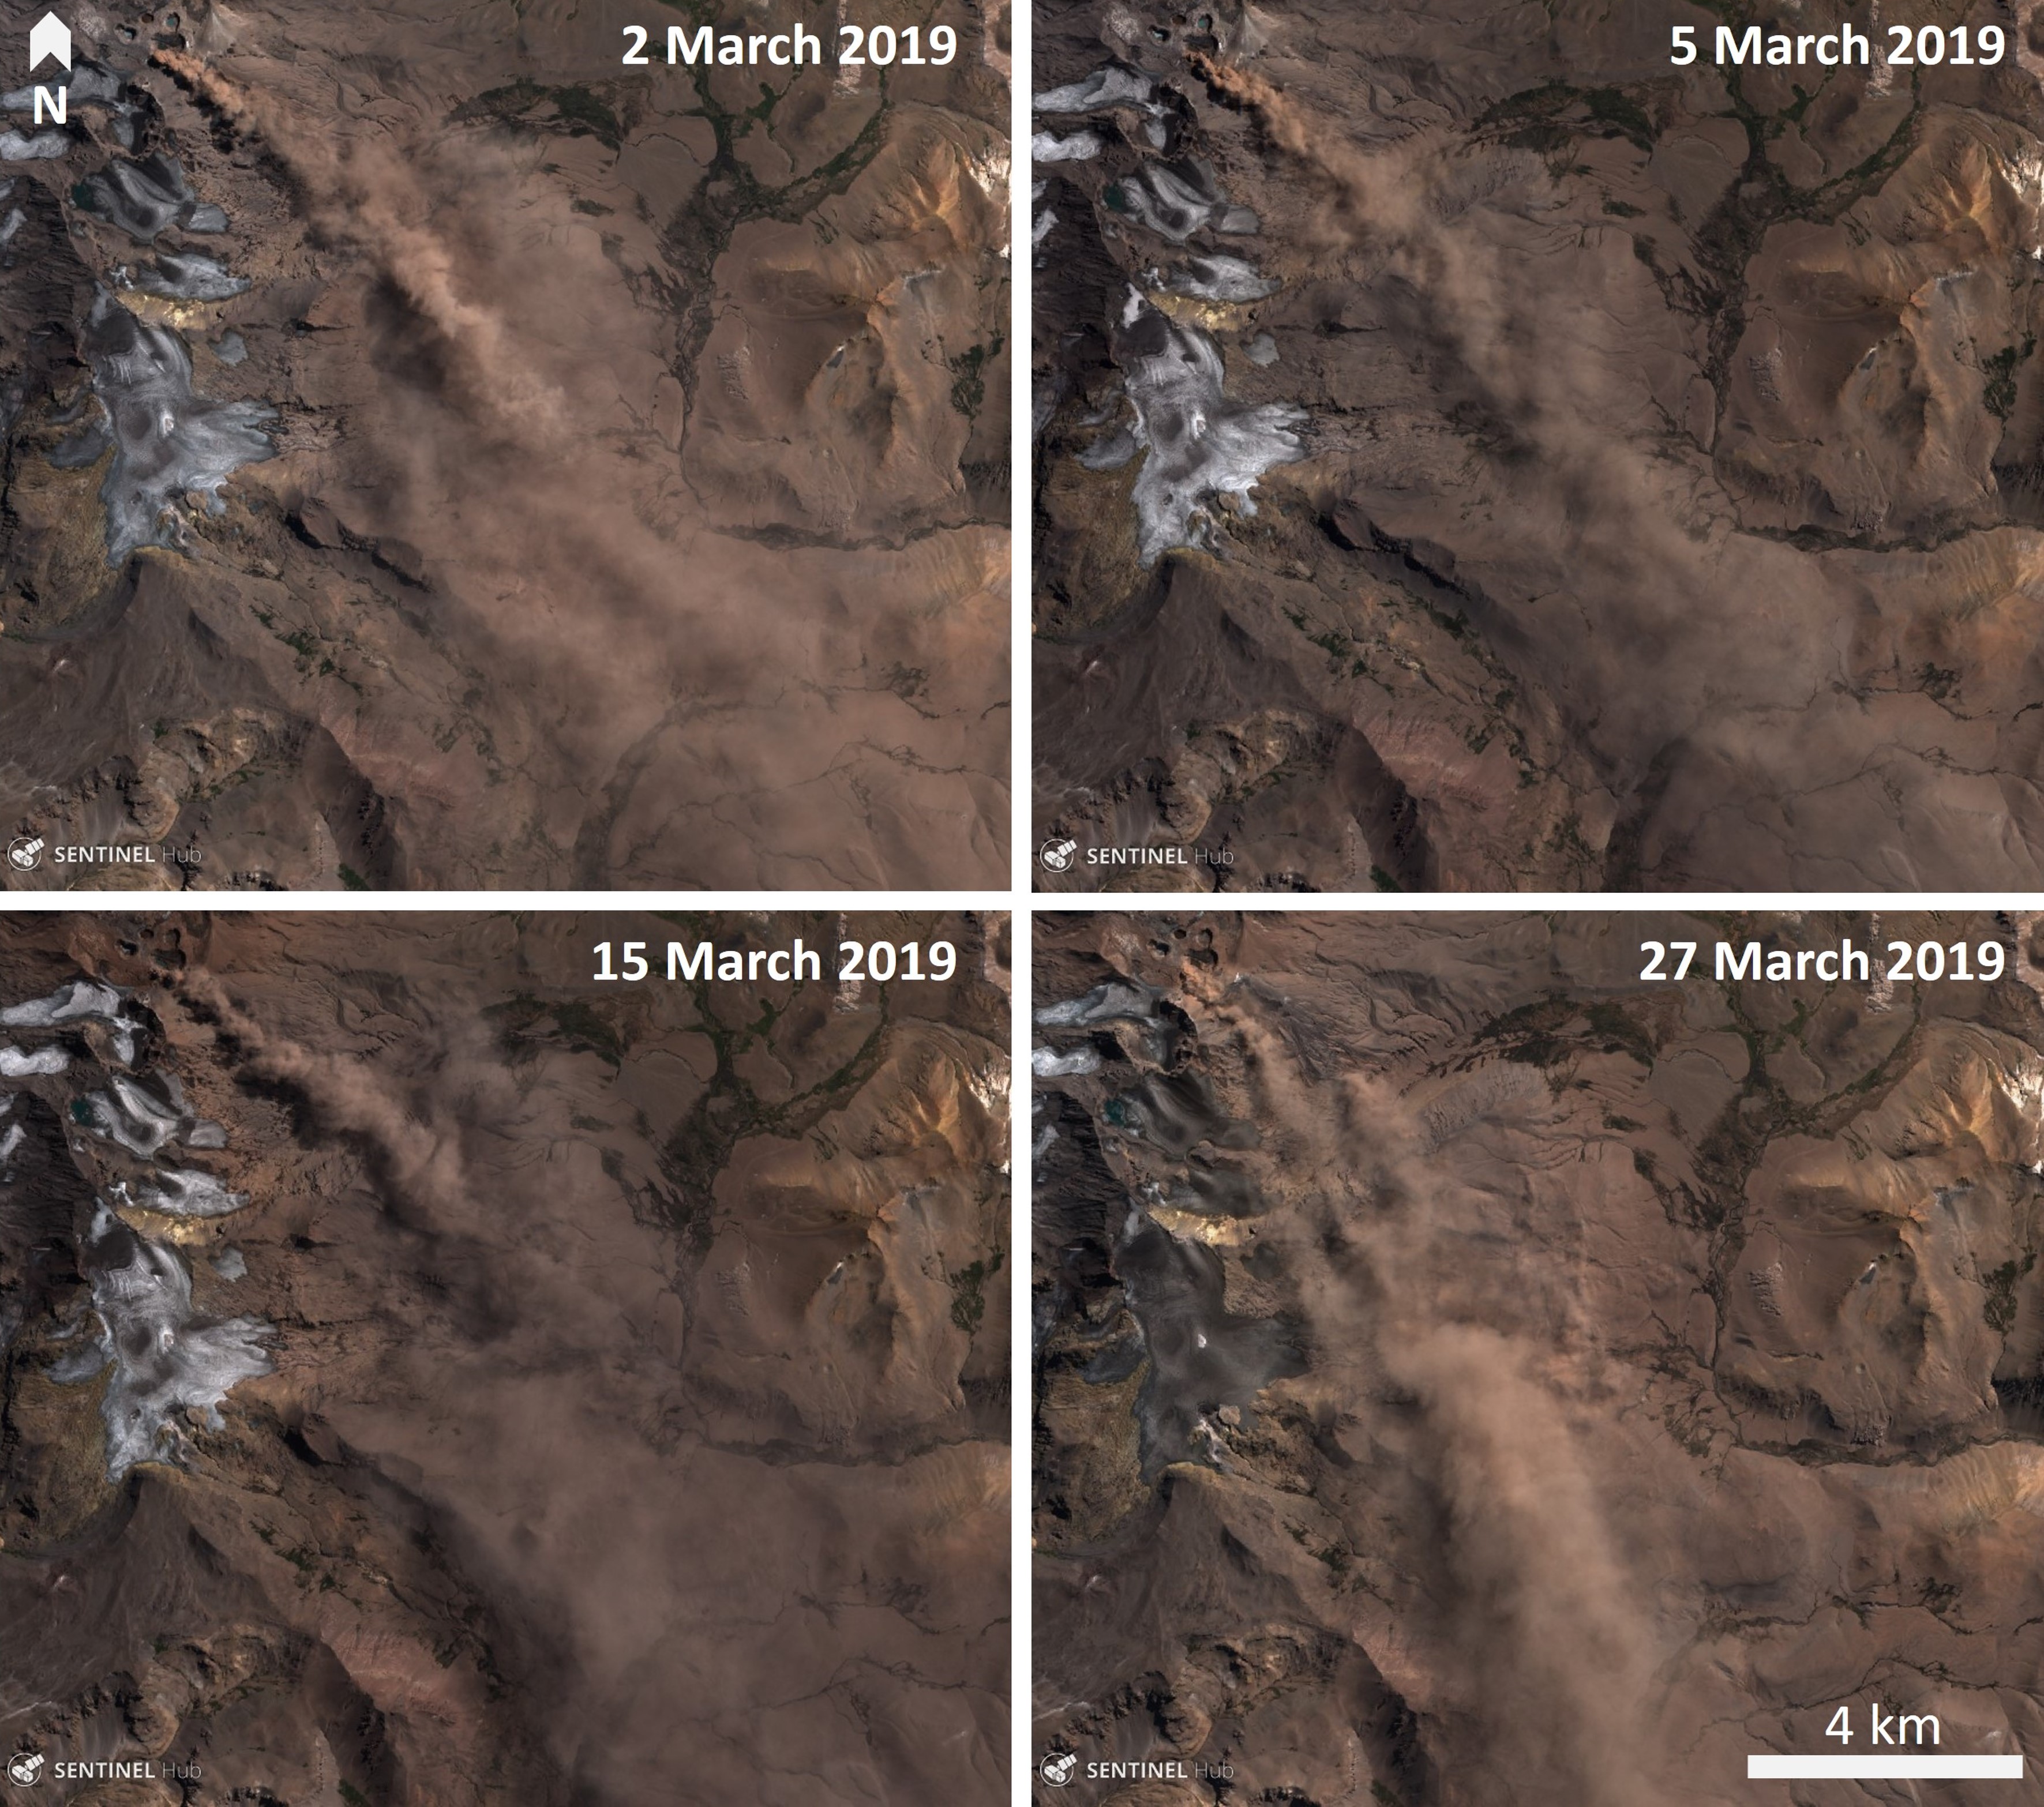 |
Figure 22. Examples of ash plumes from Planchón-Peteroa during March 2019. The brown plumes are all being blown to the SE. Sentinel-2 natural color (bands 4, 3, 2) satellite images courtesy of Sentinel Hub Playground. |
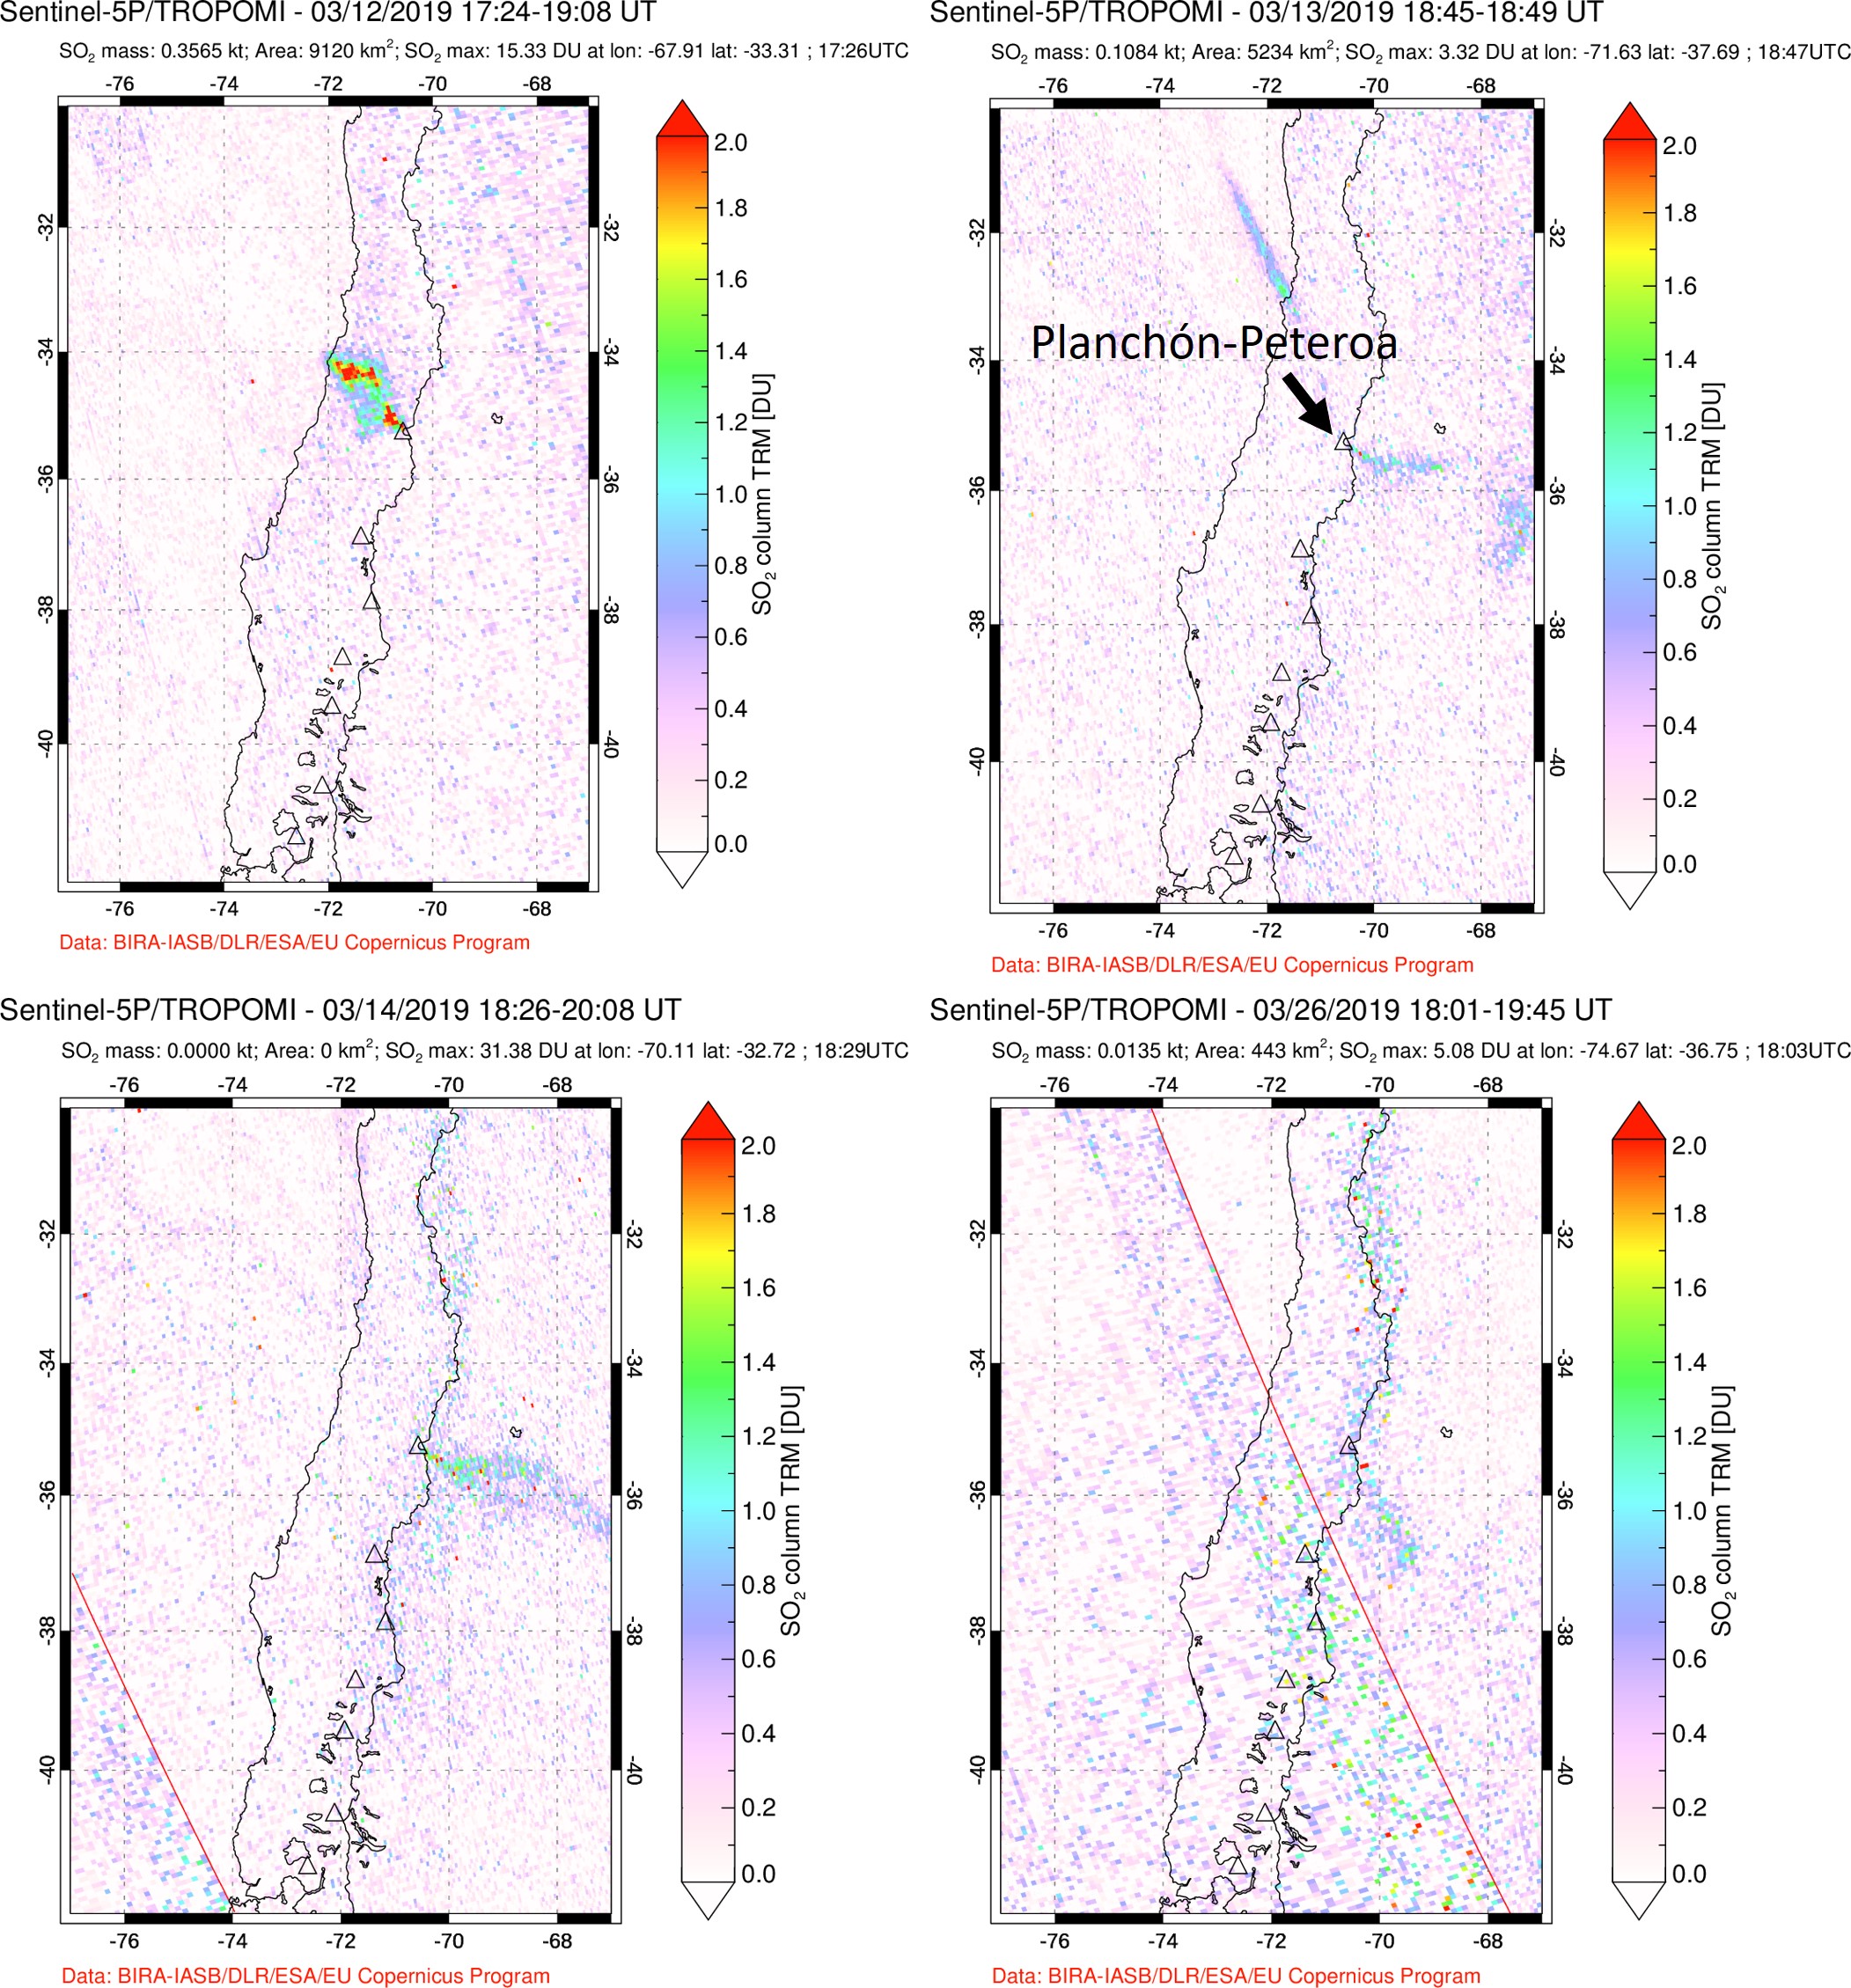 |
Figure 23. Examples of SO2 emissions at Planchón-Peteroa during March 2019 as measured by Sentinel-5P/TROPOMI. The location of the volcano is indicated in the top-right image. Courtesy of NASA Goddard Space Flight Center. |
Ash plumes continued through April but were less frequently observed in Sentinel-2 satellite data. SERNAGEOMIN reported a reduction in plume height, with a maximum height of 1.5 km above the crater through to the 7th, and a maximum plume height of 400-600 m from the 8th through to the end of the month. Early in the month analysis of the ash showed around 5% juvenile material. SO2 emissions were measured on 3 and 5 April, with values of 320 ± 25 tons per day (t/d) and 634 ± 131 t/d, respectively. Degassing was continuous throughout April and May.
An ash plume was imaged on 1 May in Sentinel-2 imagery, but then cloud cover obscured satellite views through 4 May. A partially-obscured view in a 5 May Suomi NPP / VIIRS image (in NASA Worldview) showed what appeared to be an ash deposit on fresh snow to the SE of the crater. This ash deposit is visible through diffuse clouds in a Sentinel-2 image acquired on 6 May, and additional deposits are visible on 8 May (figure 24). During the rest of May the plumes were largely white with little to no volcanic ash content (figure 25).
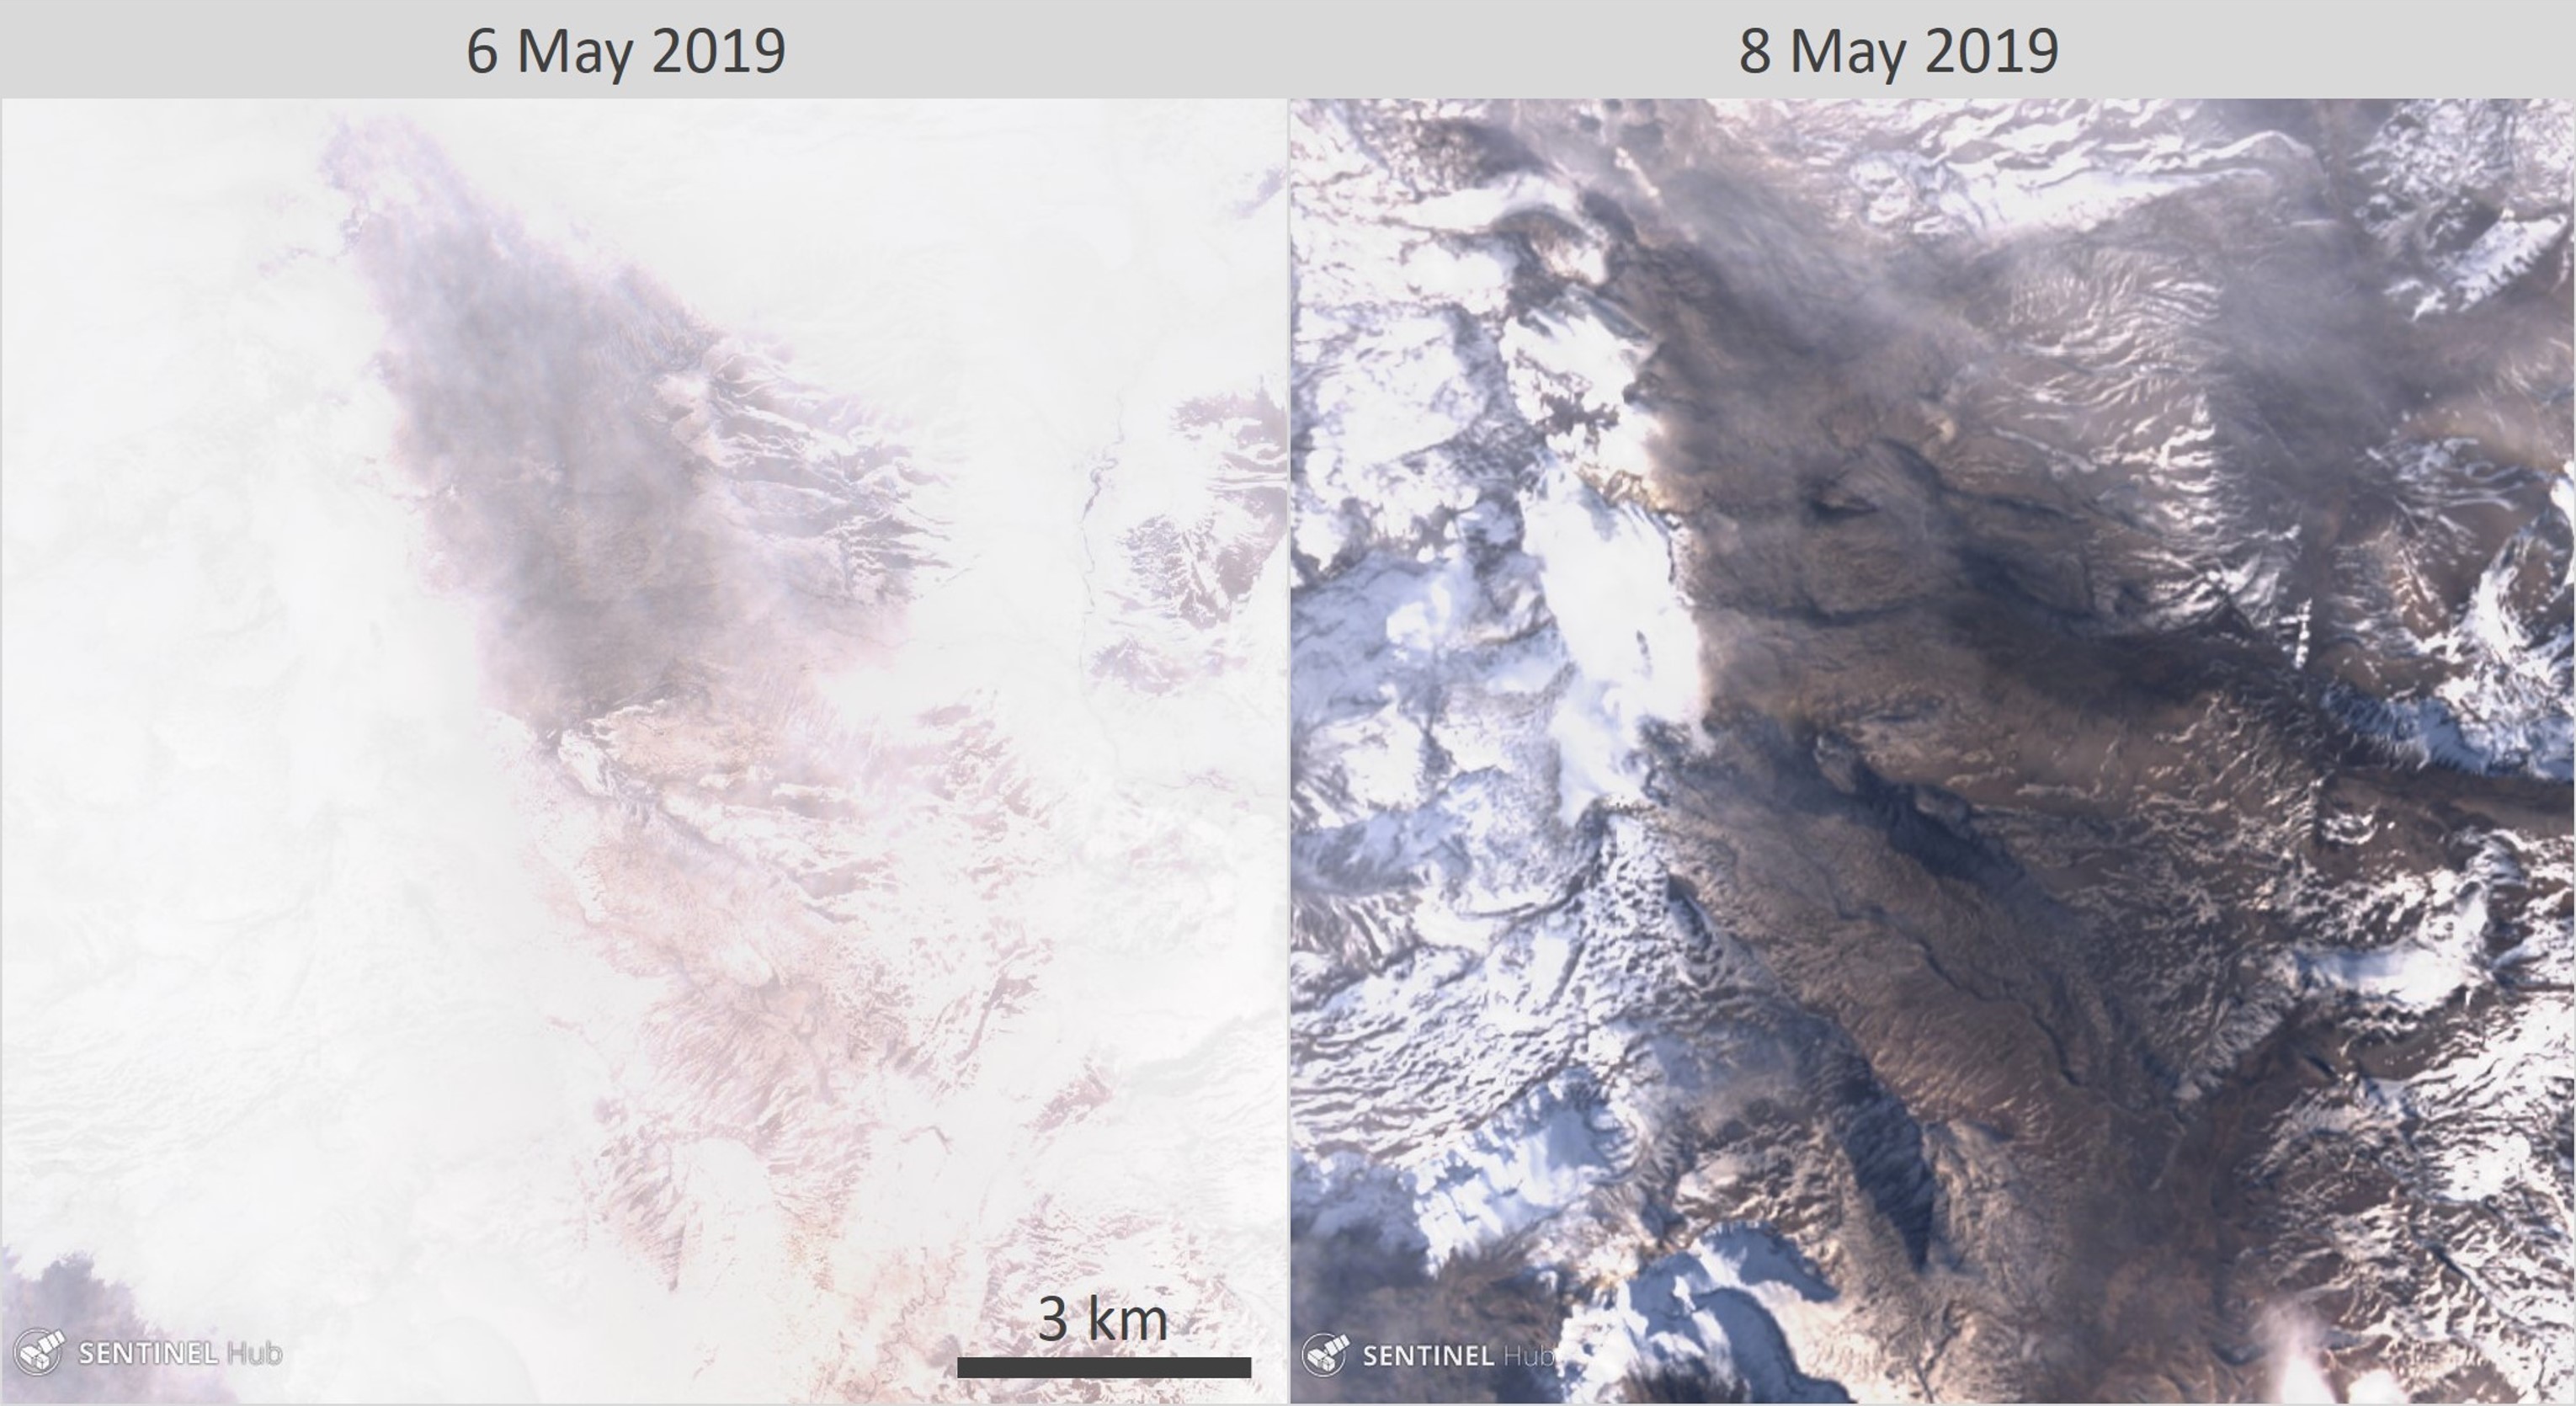 |
Figure 24. Ash deposited on snow to the SE of the active Planchón-Peteroa crater through light cloud cover, visible in a Sentinel-2 image (left) acquired on 6 May 2019, and a Landsat 8 image (right) acquired on 8 May. Sentinel-2 natural color (bands 4, 3, 2) and Landsat 8 true color (bands 4, 3, 2) satellite images courtesy of Sentinel Hub Playground. |
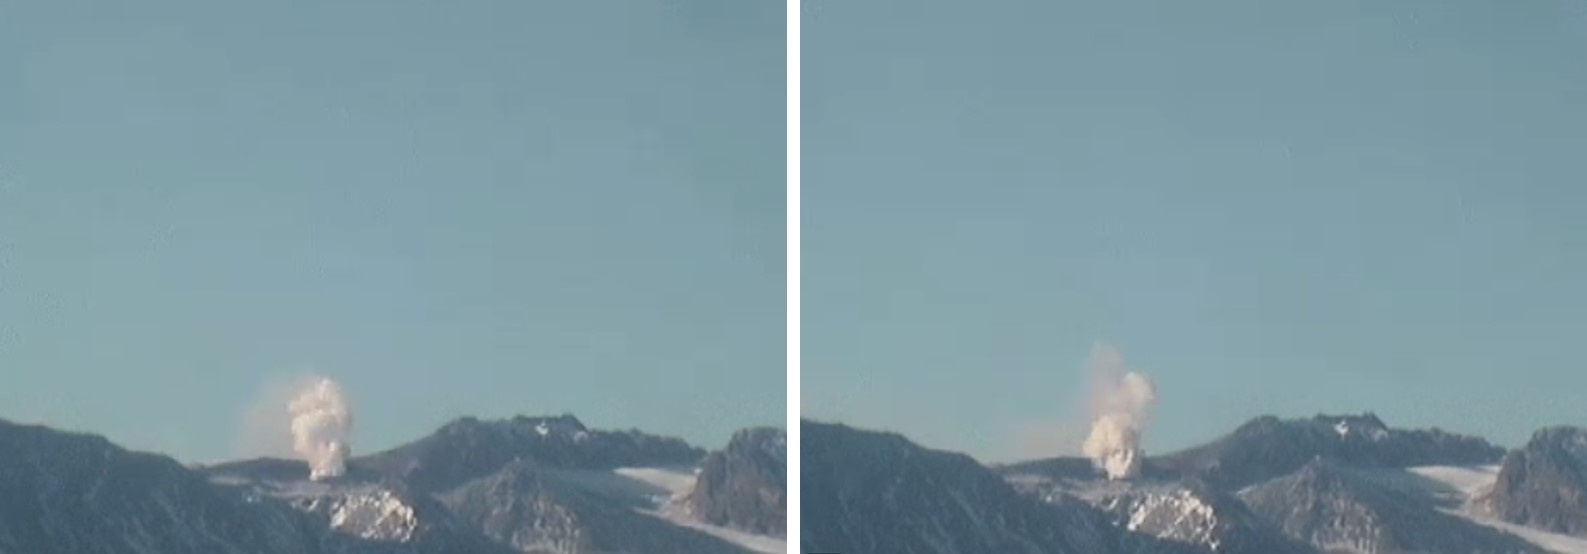 |
Figure 25. Continuous degassing at Planchón-Peteroa on 10 May producing a plume composed mainly of water vapor rises to 600 m above the crater. Webcam images courtesy of SERNAGEOMIN. |
Geological Summary. Planchón-Peteroa is an elongated complex volcano along the Chile-Argentina border with several overlapping calderas. Activity began in the Pleistocene with construction of the basaltic andesite to dacitic Volcán Azufre, followed by formation of the basaltic and basaltic andesite Volcán Planchón, 6 km N. About 11,500 years ago much of Azufre and part of Planchón collapsed, forming the massive Río Teno debris avalanche, which traveled 95 km to reach Chile's Central Valley. Subsequently, Volcán Planchón II was formed. The youngest volcano, andesitic and basaltic andesite Volcán Peteroa, consists of scattered vents between Azufre and Planchón, and and contains a small steaming crater lake. Reported eruptions from the complex have been dominantly explosive, although lava flows were emplaced in 1837 and 1937.
Information Contacts: Servicio Nacional de Geología y Minería (SERNAGEOMIN), Observatorio Volcanológico de Los Andes del Sur (OVDAS), Avda Sta María No. 0104, Santiago, Chile (URL: http://www.sernageomin.cl/); Oficina Nacional de Emergencia - Ministerio del Interior (ONEMI), Beaucheff 1637/1671, Santiago, Chile (URL: http://www.onemi.cl/); Global Sulfur Dioxide Monitoring Page, Atmospheric Chemistry and Dynamics Laboratory, NASA Goddard Space Flight Center (NASA/GSFC), 8800 Greenbelt Road, Goddard, Maryland, USA (URL: https://so2.gsfc.nasa.gov/); Sentinel Hub Playground (URL: https://www.sentinel-hub.com/explore/sentinel-playground); NASA Worldview (URL: https://worldview.earthdata.nasa.gov/).