Report on Reventador (Ecuador) — August 2019
Bulletin of the Global Volcanism Network, vol. 44, no. 8 (August 2019)
Managing Editor: Edward Venzke.
Edited by A. Elizabeth Crafford.
Reventador (Ecuador) Daily ash emissions and incandescent block avalanches continue, February-July 2019
Please cite this report as:
Global Volcanism Program, 2019. Report on Reventador (Ecuador) (Crafford, A.E., and Venzke, E., eds.). Bulletin of the Global Volcanism Network, 44:8. Smithsonian Institution. https://doi.org/10.5479/si.GVP.BGVN201908-352010
Reventador
Ecuador
0.077°S, 77.656°W; summit elev. 3562 m
All times are local (unless otherwise noted)
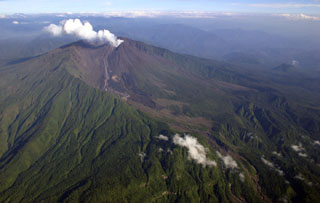
The andesitic Volcán El Reventador lies east of the main volcanic axis of the Cordillera Real in Ecuador and has historical eruptions with numerous lava flows and explosive events going back to the 16th century. An eruption in November 2002 generated a 17-km-high eruption cloud, pyroclastic flows that traveled 8 km, and several lava flows. Eruptive activity has been continuous since 2008. Daily explosions with ash emissions and ejecta of incandescent blocks rolling hundreds of meters down the flanks have been typical for many years. Alameida et al. (2019) provide an excellent summary of recent activity (2016-2018) and monitoring. Activity continued during February-July 2019, the period covered in this report, with information provided by Ecuador's Instituto Geofisico (IG-EPN), the Washington Volcano Ash Advisory Center (VAAC), and infrared satellite data.
Persistent thermal activity accompanied daily ash emissions and incandescent block avalanches during February-July 2019 (figure 111). Ash plumes generally rose 600-1,200 m above the summit crater and drifted W or NW; incandescent blocks descended up to 800 m down all the flanks. On 25 February an ash plume reached 9.1 km altitude and drifted SE, causing ashfall in nearby communities. Pyroclastic flows were reported on 18 April and 19 May traveling 500 m down the flanks. Small but distinct SO2 emissions were detectible by satellite instruments a few times during the period (figure 112).
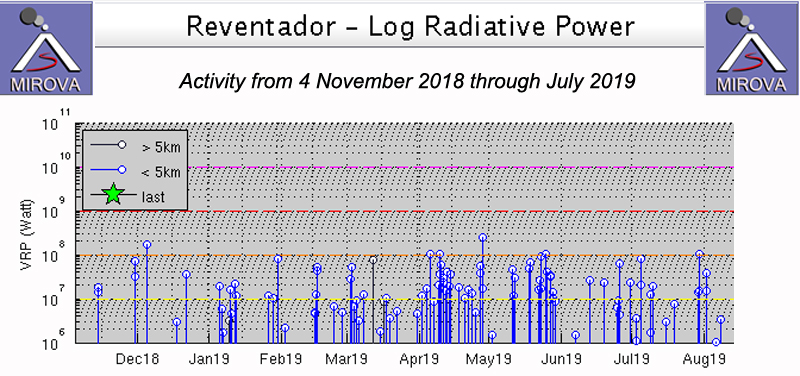 |
Figure 111. The thermal energy at Reventador persisted throughout 4 November 2018 through July 2019, but was highest in April and May. Courtesy of MIROVA. |
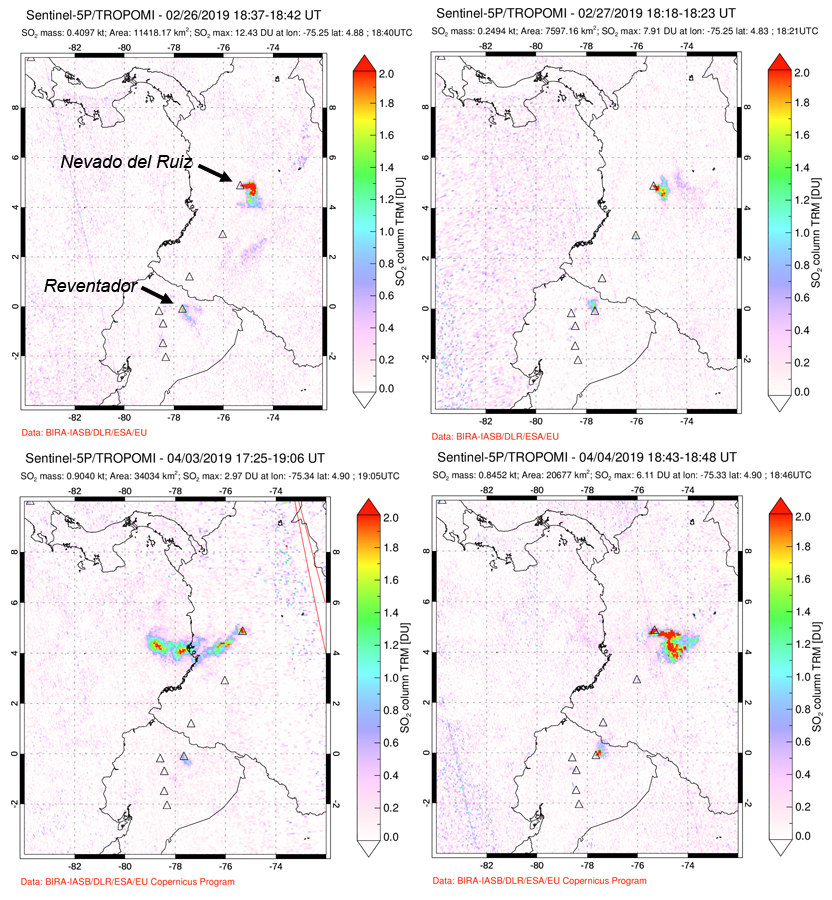 |
Figure 112. Small SO2 plumes were released from Reventador and detected by satellite instruments only a few times during February-July 2019. Columbia's Nevado del Ruiz produced a much larger SO2 signal during each of the days shown here as well. Top left: 26 February; top right: 27 February; bottom left: 3 April; bottom right: 4 April. Courtesy of NASA Goddard Space Flight Center. |
The Washington VAAC issued multiple daily ash advisories on all but two days during February 2019. IGEPN reported daily ash emissions rising from 400 to over 1,000 m above the summit crater. Incandescent block avalanches rolled 400-800 m down the flanks on most nights (figure 113). Late on 8 February the Washington VAAC reported an ash plume moving W at 5.8 km altitude extending 10 km from the summit. Plumes rising more than 1,000 m above the summit were reported on 9, 13, 16, 18, 19, and 25 February. On 25 February the Washington VAAC reported an ash plume visible in satellite imagery drifting SE from the summit at 9.1 km altitude that dissipated quickly, and drifted SSE. It was followed by new ash clouds at 7.6 km altitude that drifted S. Ashfall was reported in San Luis in the Parish of Gonzalo Díaz de Pineda by UMEVA Orellana and the Chaco Fire Department.
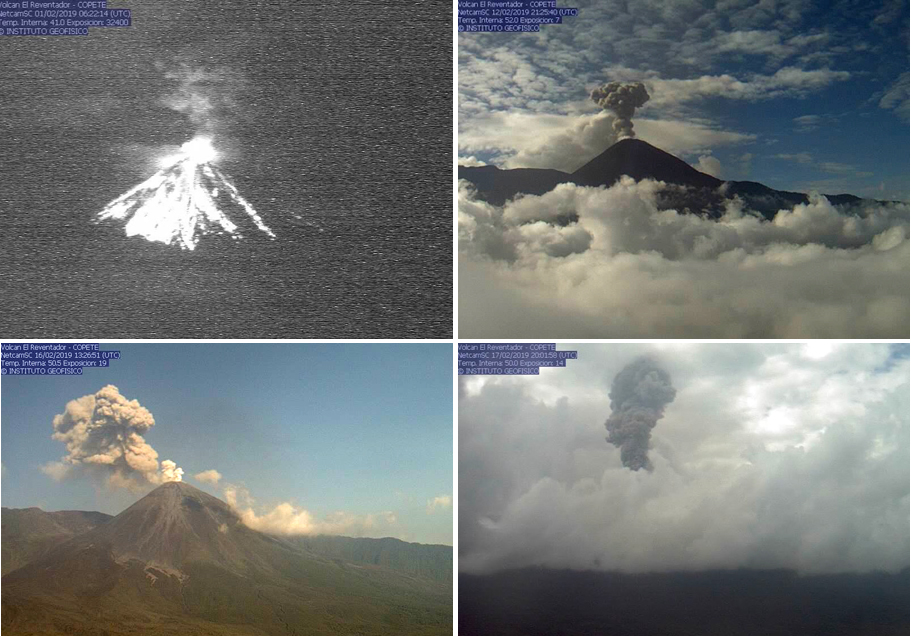 |
Figure 113. Emission of ash from Reventador and incandescent blocks rolling down the cone occurred daily during February 2019, and were captured by the COPETE webcam located on the S rim of the caldera. On 1 February (top left) incandescent blocks rolled 600 m down the flanks. On 13 February (top right) ash plumes rose 800 m and drifted W. On 16 February (bottom left) ash rose to 1,000 m and drifted W. On 18 February (bottom right) the highest emission exceeded 1,000 m above the crater and was clearly visible in spite of meteoric clouds obscuring the volcano. Courtesy of IGEPN (Daily reports 2019-32, 44, 47, and 49). |
Ash plumes exceeded 1,000 m in height above the summit almost every day during March 2019 and generally drifted W or NW. The Washington VAAC reported an ash plume visible above the cloud deck at 6.7 km altitude extending 25 km NW early on 3 March; there were no reports of ashfall nearby. Incandescent block avalanches rolled 800 m down all the flanks the previous night; they were visible moving 300-800 m down the flanks most nights throughout the month (figure 114).
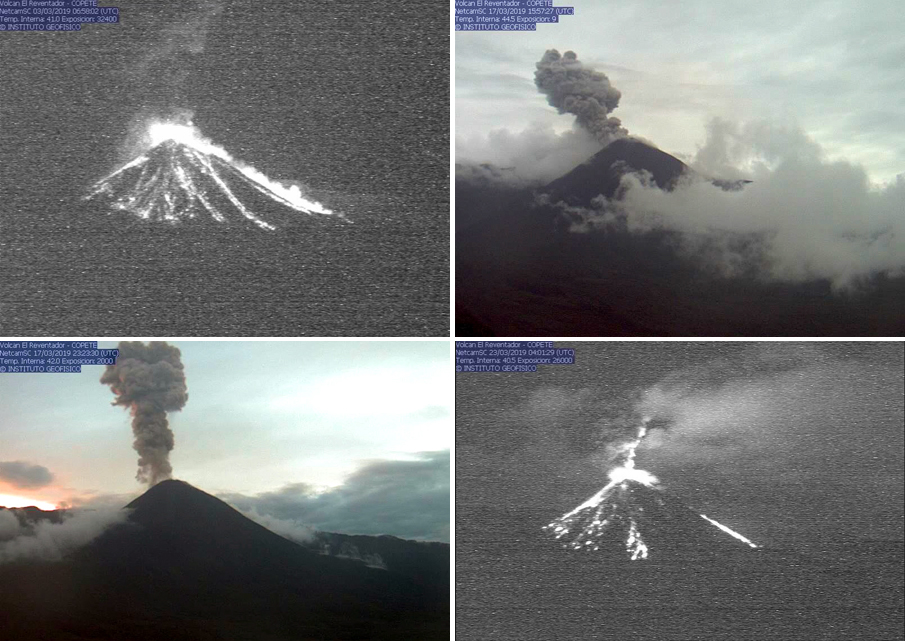 |
Figure 114. Ash plumes and incandescent block avalanches occurred daily at Reventador during March 2019 and were captured by the COPETE webcam on the S rim of the caldera. On 3 March (top left) a possible pyroclastic flow traveled down the E flank in the early morning. Ash plumes on 17 and 18 March (top right, bottom left) rose 900-1,000 m above the summit and drifted W. On 23 March (bottom right) ash plumes rose to 1,000 m and drifted N while incandescent blocks rolled 600 m down the flanks. Courtesy of IGEPN (Daily reports 2019 62, 76, 77, and 82). |
During April 2019 ash plume heights ranged from 600 to over 1,000 m above the summit each day, drifting either W or NW. Incandescent avalanche blocks rolled down all the flanks for hundreds of meters daily; the largest explosions sent blocks 800 m from the summit (figure 115). On 18 April IGEPN reported that a pyroclastic flow the previous afternoon had traveled 500 m down the NE flank.
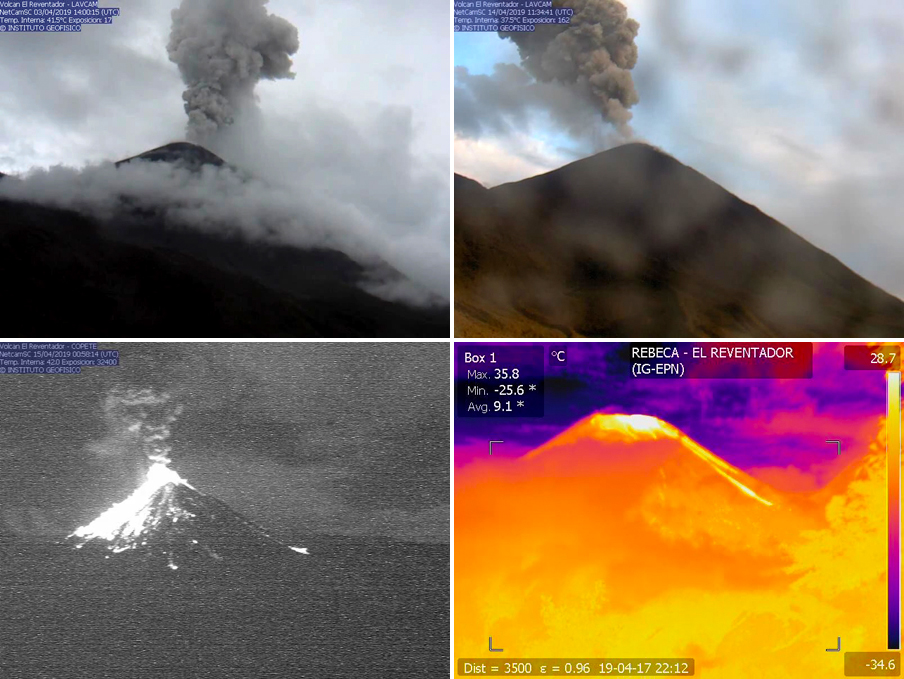 |
Figure 115. Ash plumes and incandescent block avalanches occurred daily at Reventador during April 2019. On 3 April, ash emissions were reported drifting W and NW at 1,000 m above the summit (top left). On 14 April ash plumes rose over 600 m above the summit crater (top right). The 3 and 14 April images were taken from the LAVCAM webcam on the SE flank. Incandescent block avalanches descended 800 m down all the flanks on 15 April along with ash plumes rising over 1,000 m above the summit (bottom left), both visible in this image from the COPETE webcam on the S rim of the caldera. A pyroclastic flow descended 500 m down the NE flank on 17 April and was captured in the thermal REBECA webcam (bottom right) located on the N rim of the caldera. Courtesy of IGEPN (Daily reports 2019-93, 104, 105, and 108). |
On most days during May 2019, incandescent block avalanches were observed traveling 700-800 m down all the flanks. Ash plume heights ranged from 600 to 1,200 m above the crater each day of the month (figure 116) they were visible. A pyroclastic flow was reported during the afternoon of 19 May that moved 500 m down the N flank.
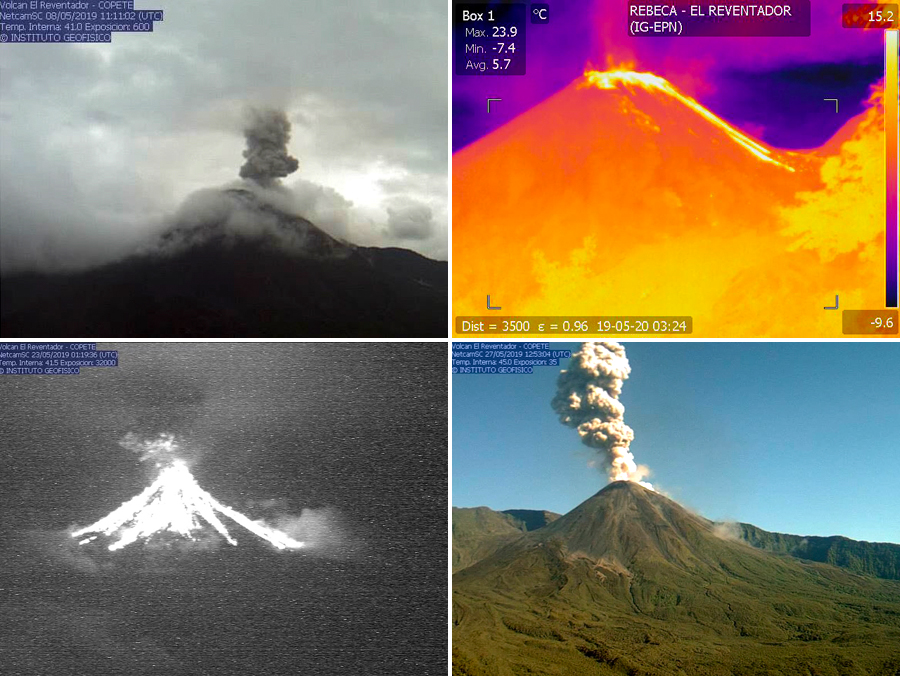 |
Figure 116. Even on days with thick meteoric clouds, ash plumes can be observed at Reventador. The ash plumes reached 1,000 m above the crater on 8 May 2019 (top left). The infrared webcam REBECA on the N rim of the caldera captured a pyroclastic flow on the N flank on the afternoon of 19 May (top right). Strong explosions on 23 May sent incandescent blocks and possible pyroclastic flows at least 800 m down all the flanks (bottom left). Ash plumes reached 1,000 m above the summit on 27 May and drifted W (bottom right). Images on 8, 23, and 27 May taken from the COPETE webcam on the S rim of the caldera. Courtesy of IGEPN (Daily Reports 2019-128, 140, 143, and 147). |
Activity diminished somewhat during June 2019. Ash plumes reached 1,200 m above the summit early in June but decreased to 600 m or less for the second half of the month. Meteoric clouds prevented observation for most of the third week of June; VAAC reports indicated ash emissions rose to 5.2 km altitude on 19 June and again on 26 June (about 2 km above the crater). Incandescent blocks were reported traveling down all of the flanks, generally 500-800 m, during about half of the days the mountain was visible (figure 117). Multiple VAAC reports were also issued daily during July 2019. Ash plumes were reported by IGEPN rising over 600 m above the crater every day it was visible and incandescent blocks traveled 400-800 m down the flanks (figure 118). The Darwin VAAC reported an ash emission on 9 July that rose to 4.9 km altitude as multiple puffs that drifted W, extending about 35 km from the summit.
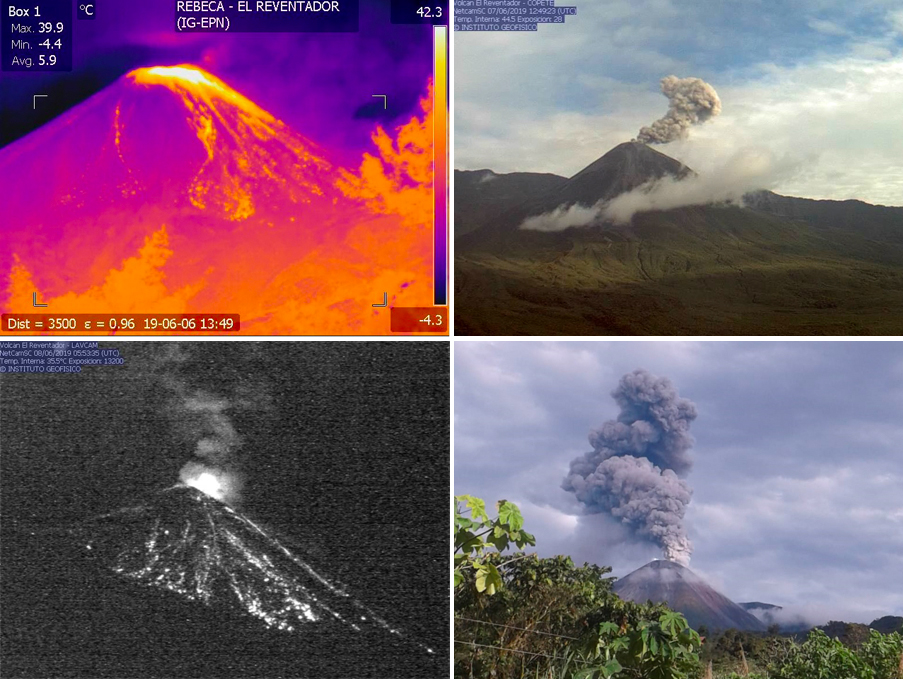 |
Figure 117. Activity diminished slightly at Reventador during June 2019. Incandescent material was visible on the N flank from infrared webcam REBECA on the N rim of the caldera on 6 June (top left). On 7 June ash rose over 1,000 m above the summit and drifted N and W (top right) as seen from the COPETE webcam on the S rim of the caldera. Incandescent block avalanches rolled 600 m down all the flanks on 8 June (bottom left) and were photographed by the LAVCAM webcam located on the SE flank. An ash plume rose to 1,000 m on 25 June and was photographed from the San Rafael waterfall (bottom right). Courtesy of IGEPN (Daily Reports 2019-157, 158, 159, and 176). |
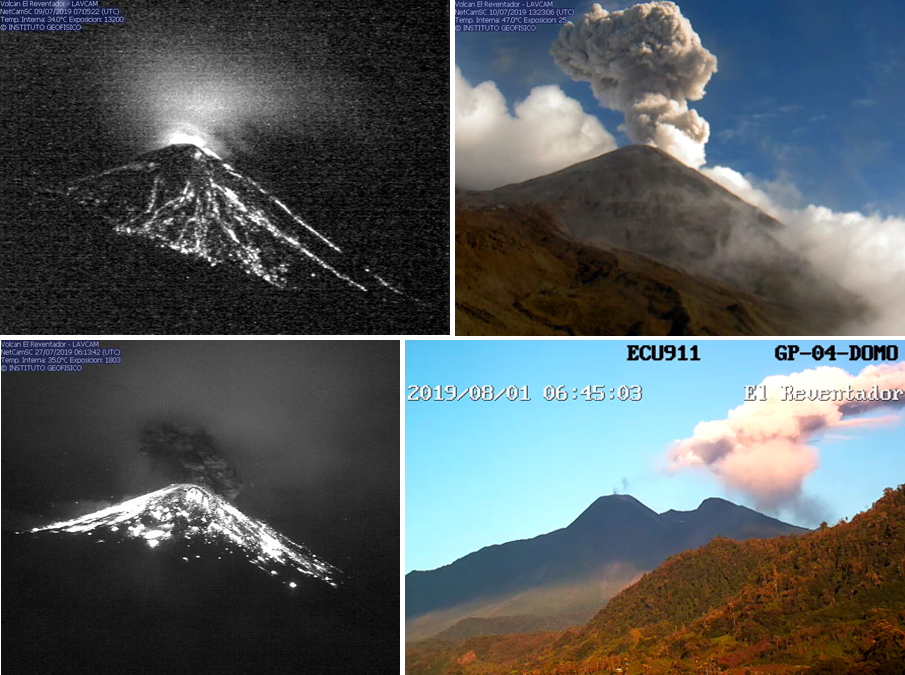 |
Figure 118. Daily explosive activity was reported at Reventador during July 2019. On 9 and 10 July ash plumes rose over 600 m and drifted W and incandescent blocks descended 800 m down all the flanks (top row), as seen from the LAVCAM webcam on the SE flank. On 27 July many of the large incandescent blocks appeared to be several m in diameter as they descended the flanks (bottom left, LAVCAM). On 1 August, a small steam plume was visible on a clear morning from the CORTESIA webcam located N of the volcano. Courtesy of IGEPN Daily reports (2019-190, 191, 208, and 213). |
References: Almeida M, Gaunt H E, and Ramón P, 2019, Ecuador's El Reventador volcano continually remakes itself, Eos, 100, https://doi.org/10.1029/2019EO117105. Published on 18 March 2019.
Geological Summary. Volcán El Reventador is the most frequently active of a chain of Ecuadorian volcanoes in the Cordillera Real, well east of the principal volcanic axis. The forested, dominantly andesitic stratovolcano has 4-km-wide avalanche scarp open to the E formed by edifice collapse. A young, unvegetated, cone rises from the amphitheater floor to a height comparable to the rim. It has been the source of numerous lava flows as well as explosive eruptions visible from Quito, about 90 km ESE. Frequent lahars in this region of heavy rainfall have left extensive deposits on the scarp slope. The largest recorded eruption took place in 2002, producing a 17-km-high eruption column, pyroclastic flows that traveled up to 8 km, and lava flows from summit and flank vents.
Information Contacts: Instituto Geofísico (IG-EPN), Escuela Politécnica Nacional, Casilla 17-01-2759, Quito, Ecuador (URL: http://www.igepn.edu.ec ); MIROVA (Middle InfraRed Observation of Volcanic Activity), a collaborative project between the Universities of Turin and Florence (Italy) supported by the Centre for Volcanic Risk of the Italian Civil Protection Department (URL: http://www.mirovaweb.it/); Global Sulfur Dioxide Monitoring Page, Atmospheric Chemistry and Dynamics Laboratory, NASA Goddard Space Flight Center (NASA/GSFC), 8800 Greenbelt Road, Goddard, Maryland, USA (URL: https://so2.gsfc.nasa.gov/).