Report on Kadovar (Papua New Guinea) — January 2020
Bulletin of the Global Volcanism Network, vol. 45, no. 1 (January 2020)
Managing Editor: Edward Venzke.
Edited by Janine B. Krippner.
Kadovar (Papua New Guinea) Frequent gas and some ash emissions during May-December 2019 with some hot avalanches
Please cite this report as:
Global Volcanism Program, 2020. Report on Kadovar (Papua New Guinea) (Krippner, J.B., and Venzke, E., eds.). Bulletin of the Global Volcanism Network, 45:1. Smithsonian Institution. https://doi.org/10.5479/si.GVP.BGVN202001-251002
Kadovar
Papua New Guinea
3.608°S, 144.588°E; summit elev. 365 m
All times are local (unless otherwise noted)
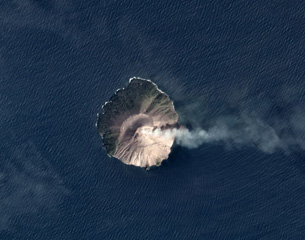
Kadovar is an island volcano north of Papua New Guinea and northwest of Manam. The first confirmed historical activity began in January 2018 and resulted in the evacuation of residents from the island. Eruptive activity through 2018 changed the morphology of the SE side of the island and activity continued through 2019 (figure 36). This report summarizes activity from May through December 2019 and is based largely on various satellite data, tourist reports, and Darwin Volcanic Ash Advisory Center (VAAC) reports.
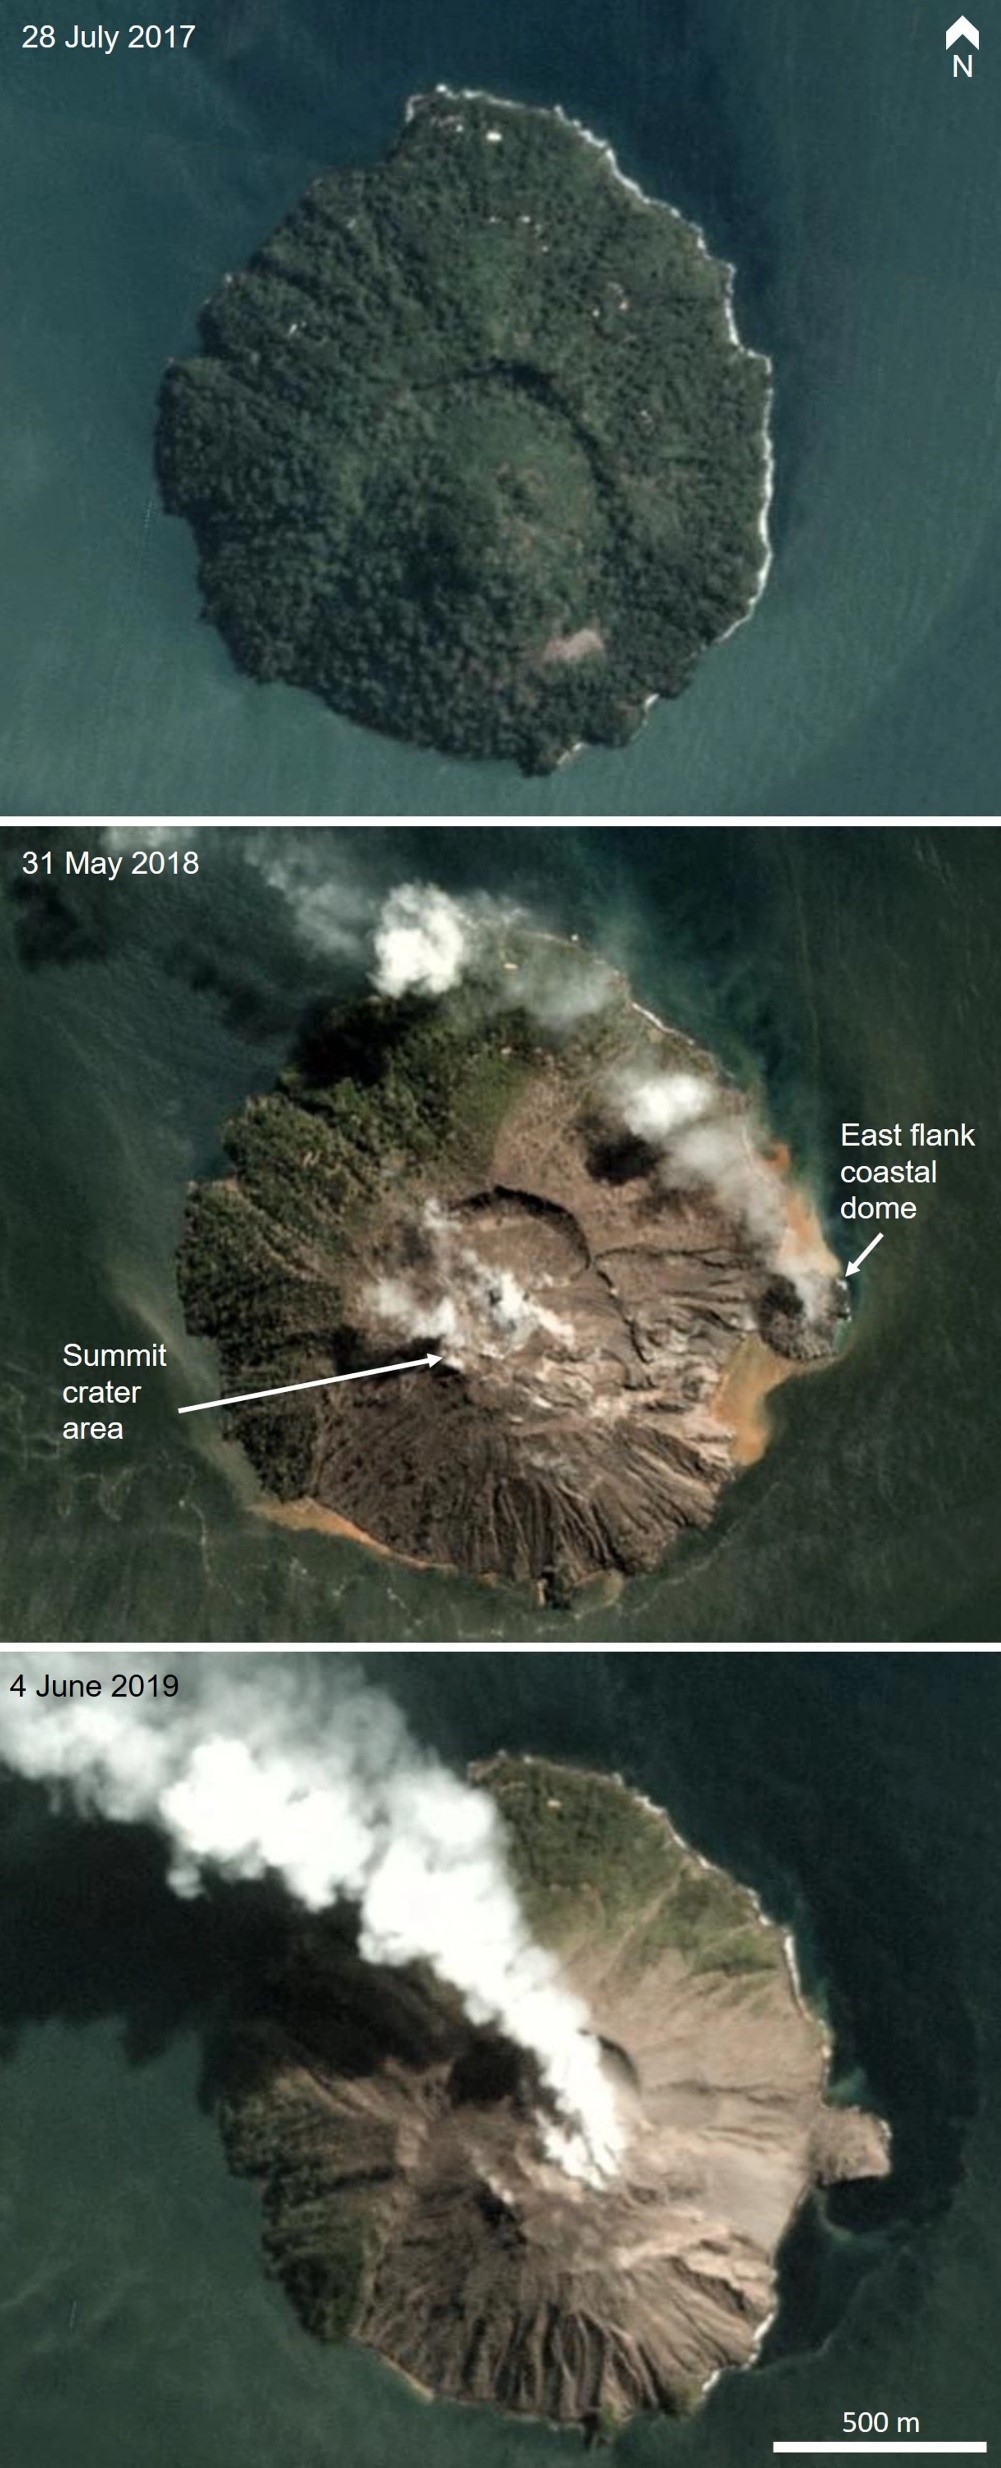 |
Figure 36. The morphological changes to Kadovar from 2017 to June 2019. Top: the vegetated island has a horseshoe-shaped crater that opens towards the SE; the population of the island was around 600 people at this time. Middle: by May 2018 the eruption was well underway with an active summit crater and an active dome off the east flank. Much of the vegetation has been killed and ashfall covers a lot of the island. Bottom: the bay below the SE flank has filled in with volcanic debris. The E-flank coastal dome is no longer active, but activity continues at the summit. PlanetScope satellite images copyright Planet Labs 2019. |
Since this eruptive episode began a large part of the island has been deforested and has undergone erosion (figure 37). Activity in early 2019 included regular gas and steam emissions, ash plumes, and thermal anomalies at the summit (BGVN 44:05). On 15 May an ash plume originated from two vents at the summit area and dispersed to the east. A MODVOLC thermal alert was also issued on this day, and again on 17 May. Elevated temperatures were detected in Sentinel-2 thermal satellite data on 20, 21, and 30 May (figure 38), with accompanying gas-and-steam plumes dispersing to the NNW and NW. On 30 May the area of elevated temperature extended to the SE shoreline, indicating an avalanche of hot material reaching the water.
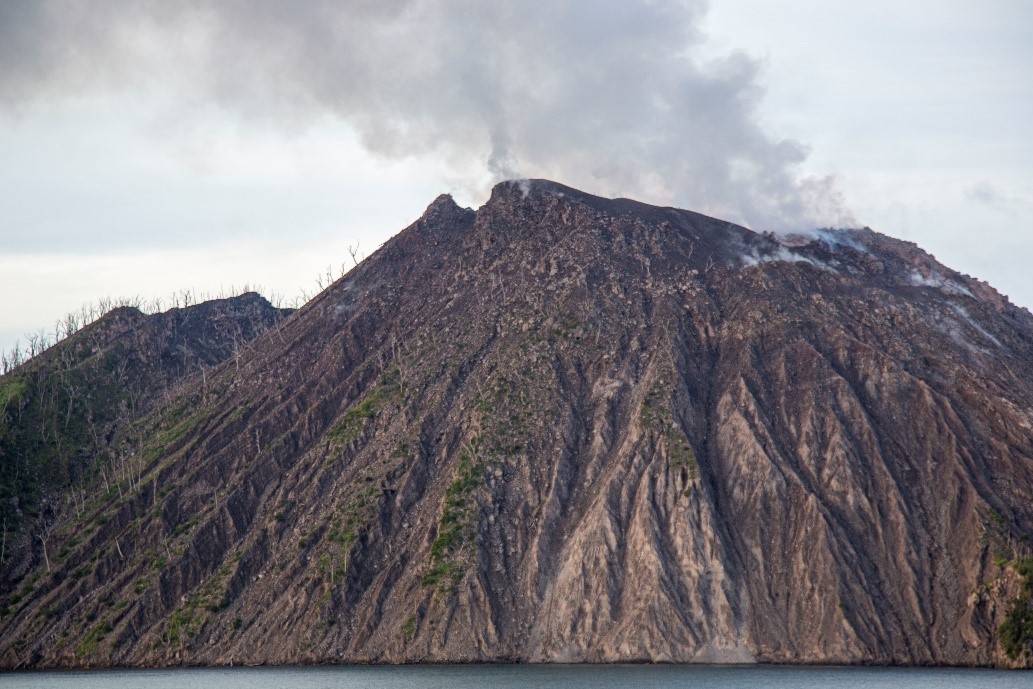 |
Figure 37. The southern flank of Kadovar seen here on 13 November 2019 had been deforested by eruptive activity and erosion had produced gullies down the flanks. Copyrighted photo by Chrissie Goldrick, used with permission. |
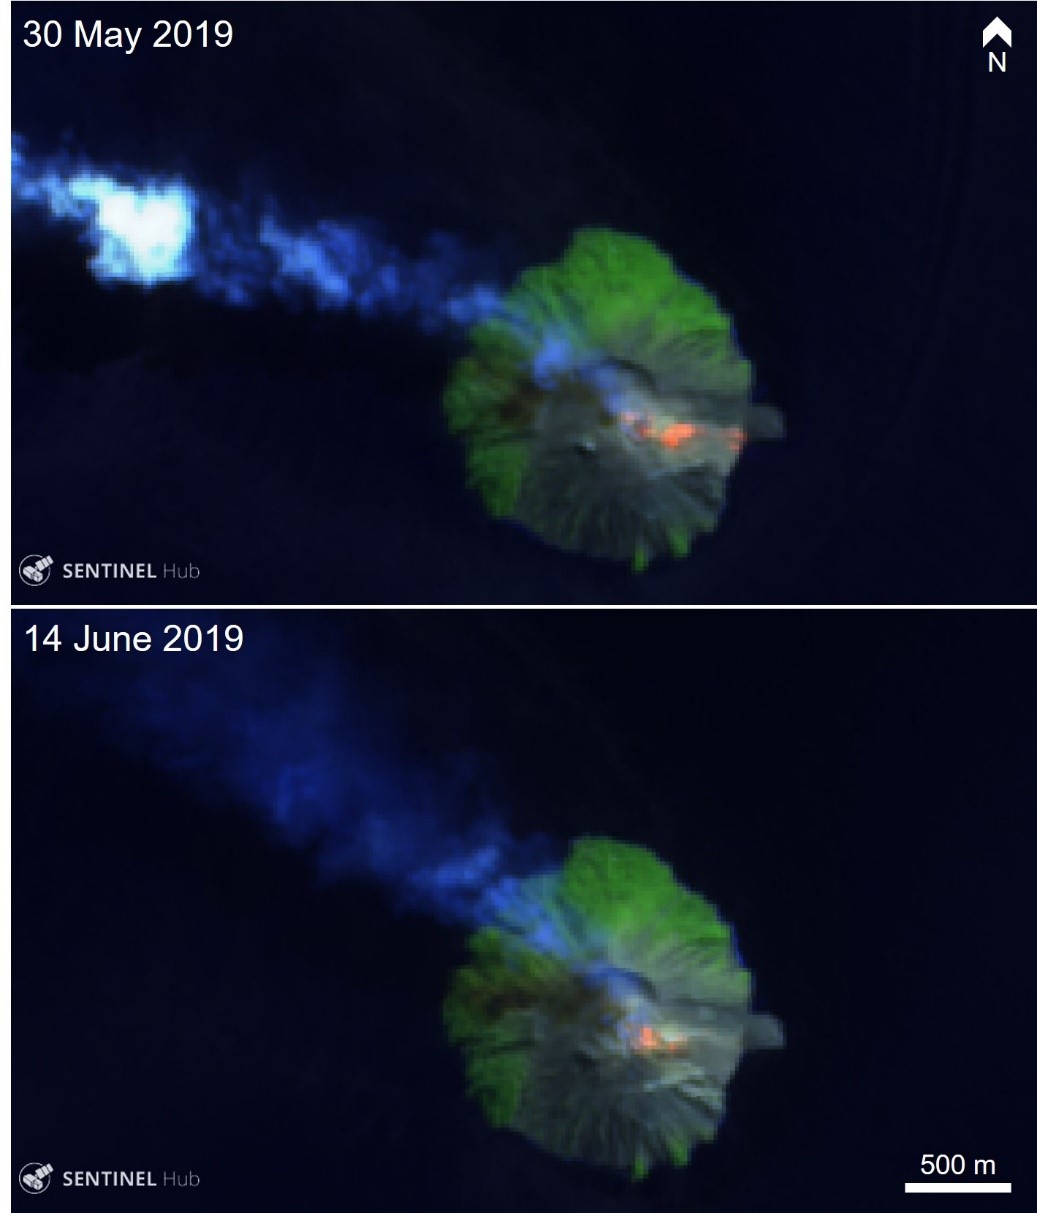 |
Figure 38. Sentinel-2 thermal satellite images show elevated temperatures at the summit area, and down to the coast in the top image. Gas-and-steam plumes are visible dispersing towards the NW. Sentinel-2 false color (urban) satellite image (bands 12, 11, 4) courtesy of Sentinel-Hub Playground. |
Throughout June cloud-free Sentinel-2 thermal satellite images showed elevated temperatures at the summit area and extending down the upper SE flank (figure 38). Gas-and-steam plumes were persistent in every Sentinel-2 and NASA Suomi NPP / VIIRS (Visible Infrared Imaging Radiometer Suite) image. MODVOLC thermal alerts were issued on 4 and 9 June. Similar activity continued through July with gas-and-steam emissions visible in every cloud-free satellite image. Thermal anomalies appeared weaker in late-July but remained at the summit area. An ash plume was imaged on 17 July by Landsat 8 with a gas-and-ash plume dispersing to the west (figure 39). Thermal anomalies continued through August with a MODVOLC thermal alert issued on the 14th. Gas emissions also continued and a Volcano Observatory Notice for Aviation (VONA) was issued on the 19th reporting an ash plume to an altitude of 1.5 km and drifting NW.
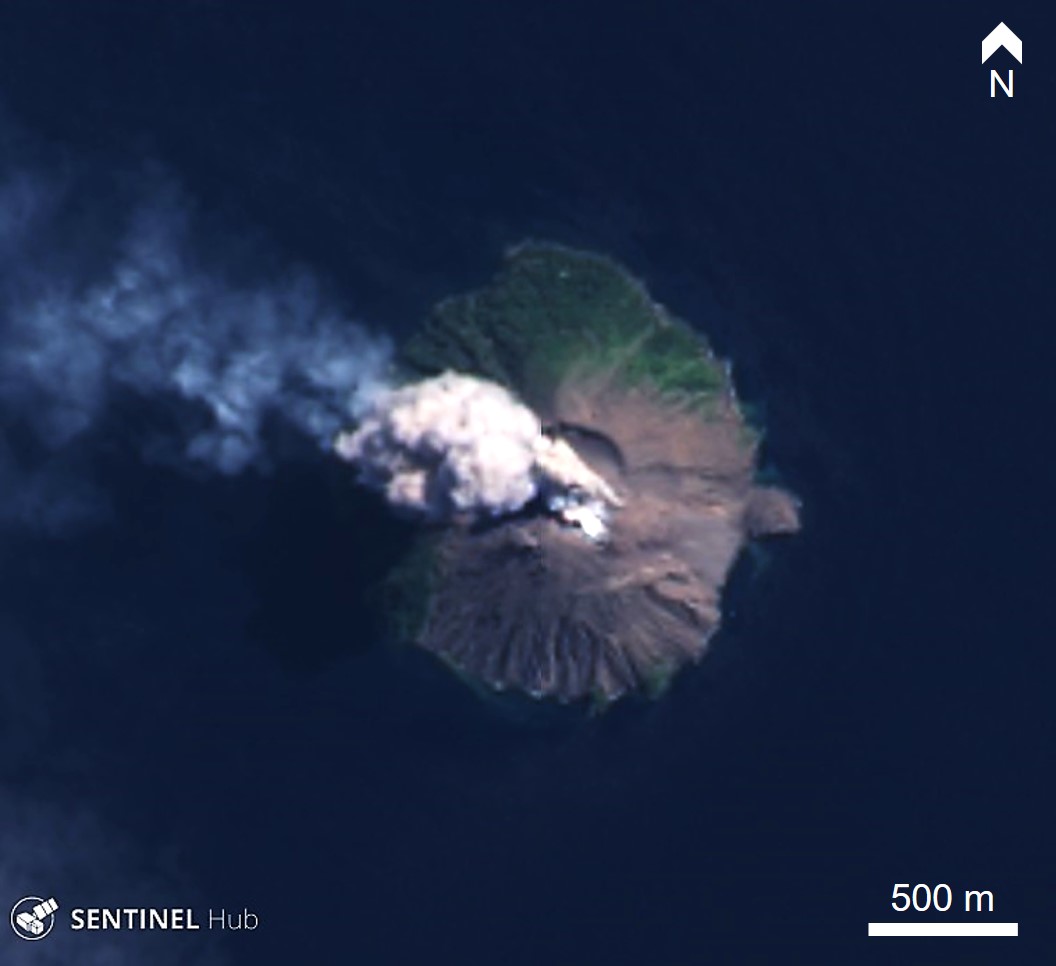 |
Figure 39. An ash plume rising above Kadovar and a gas plume dispersing to the NW on 17 July 2019. Truecolor pansharpened Landsat 8 satellite image courtesy of Sentinel Hub Playground. |
An elongate area extending from the summit area to the E-flank coastal dome appears lighter in color in a 7 September Sentinel-2 natural color satellite image, and as a higher temperature area in the correlating thermal bands, indicating a hot avalanche deposit. These observations along with the previous avalanche, persistent elevated summit temperatures, and persistent gas and steam emissions from varying vent locations (figure 40) suggests that the summit dome has remained active through 2019.
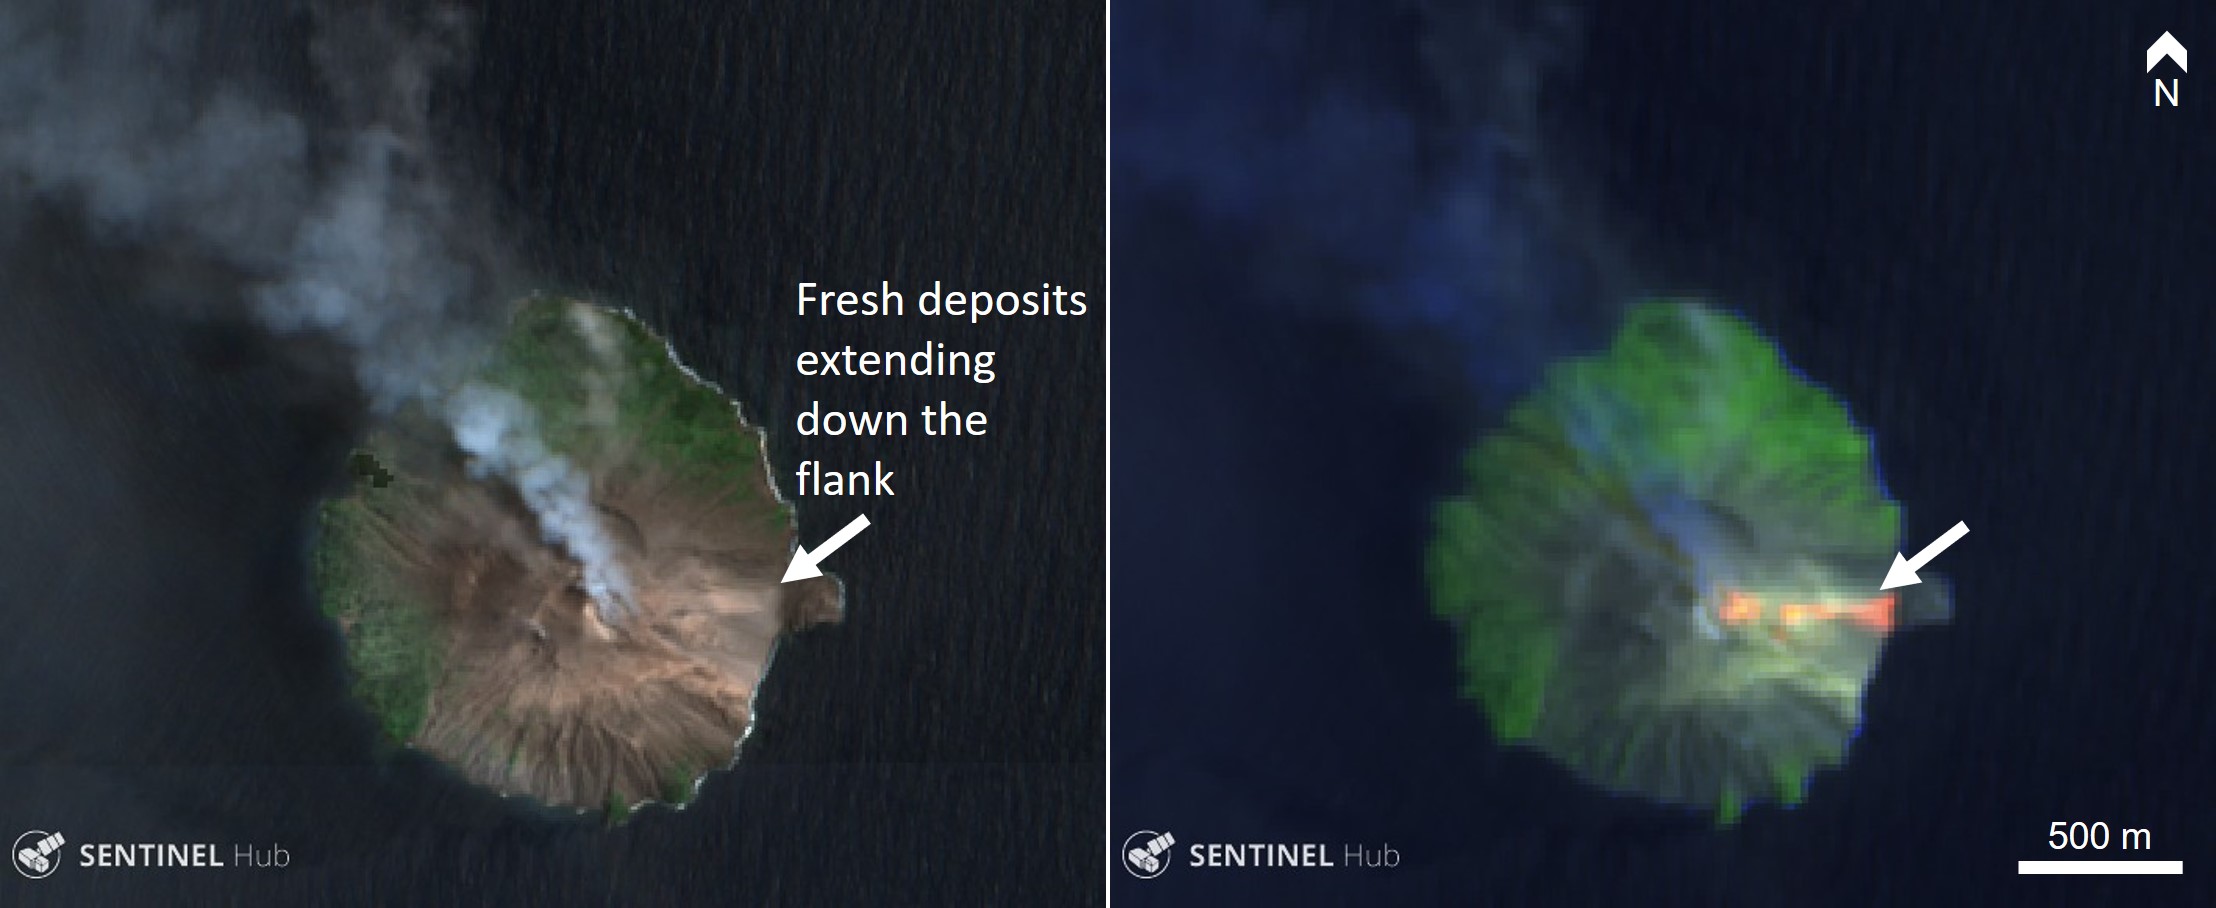 |
Figure 40. Sentinel-2 visible and thermal satellite images acquired on 7 September 2019 show fresh deposits down the east flank of Kadovar. They appear as a lighter colored area in visible, and show as a hot area (orange) in thermal data. Sentinel-2 natural color (bands 4, 3, 2) and false color (urban) satellite image (bands 12, 11, 4) courtesy of Sentinel-Hub Playground. |
Thermal anomalies and emissions continued through to the end of 2019 (figure 41). A tour group witnessed an explosion producing an ash plume at around 1800 on 13 November (figure 42). While the ash plume erupted near-vertically above the island, a more diffuse gas plume rose from multiple vents on the summit dome and dispersed at a lower altitude.
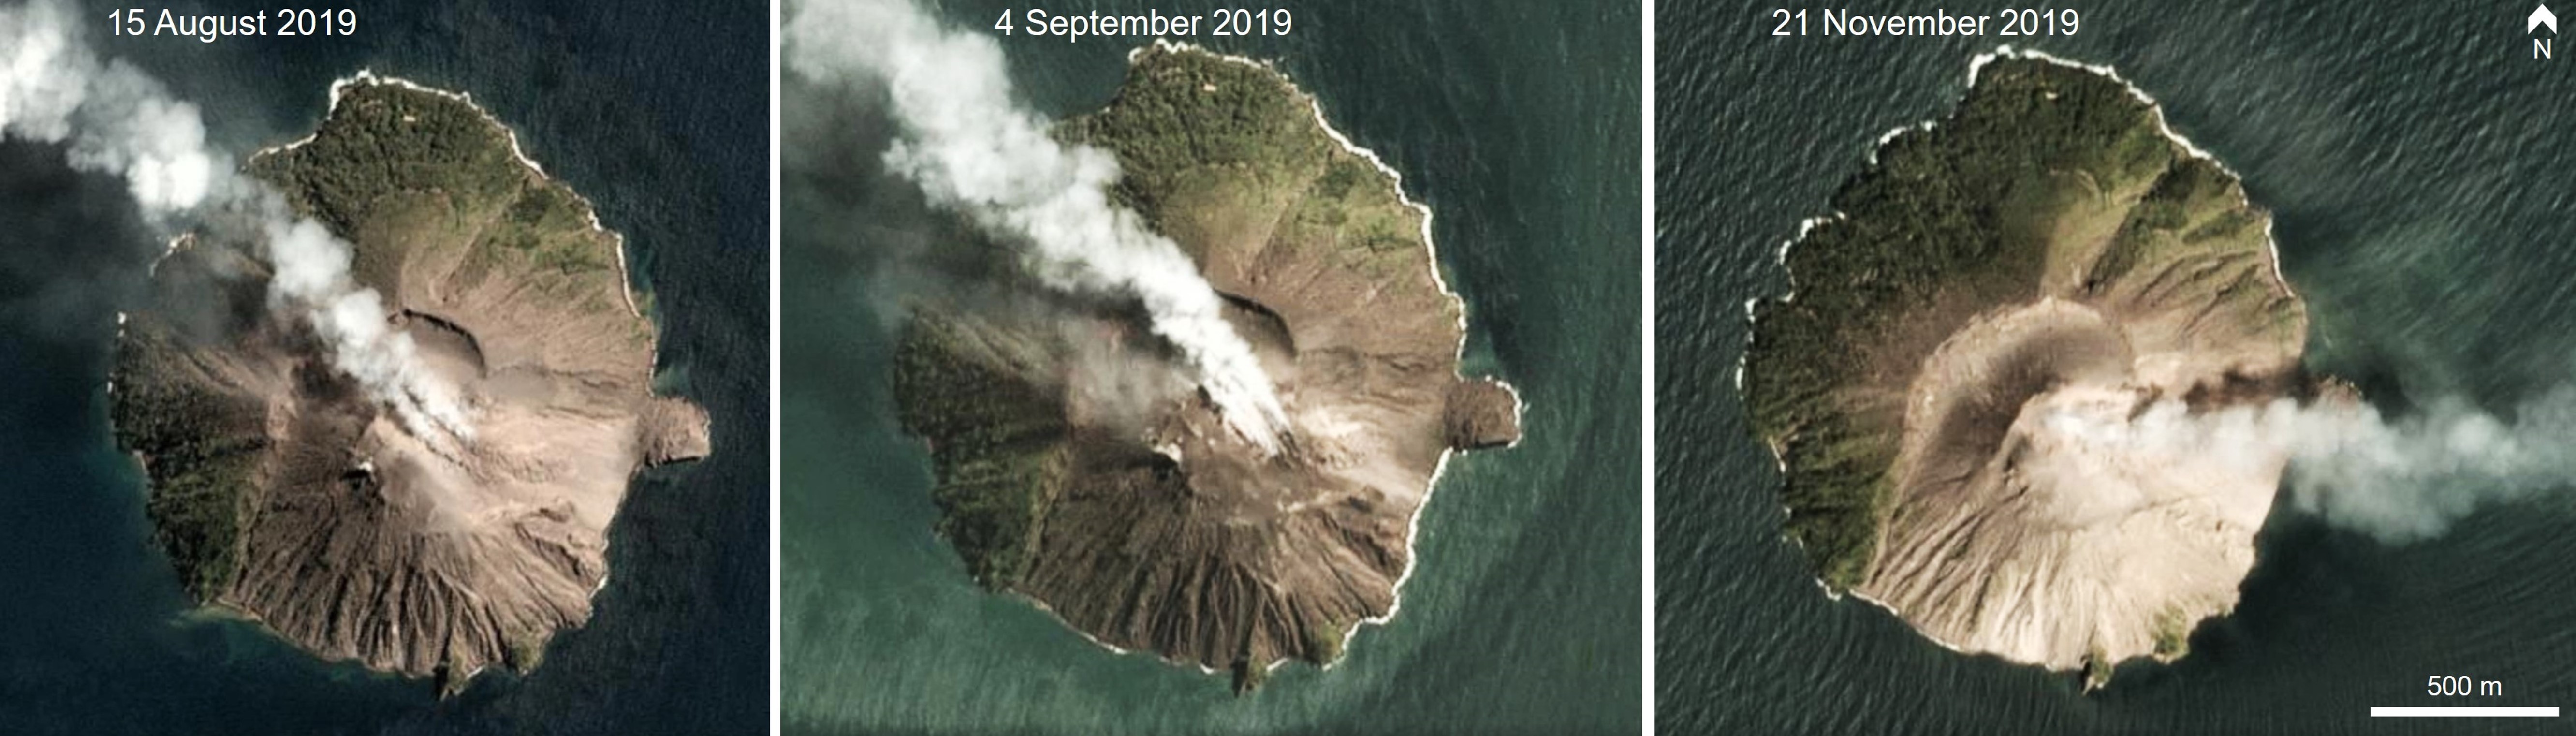 |
Figure 41. The summit area of Kadovar emitting gas-and-steam plumes in August, September, and November 2019. The plumes are persistent in satellite images throughout May through December and there is variation in the number and locations of the source vents. PlanetScope satellite images copyright Planet Labs 2019. |
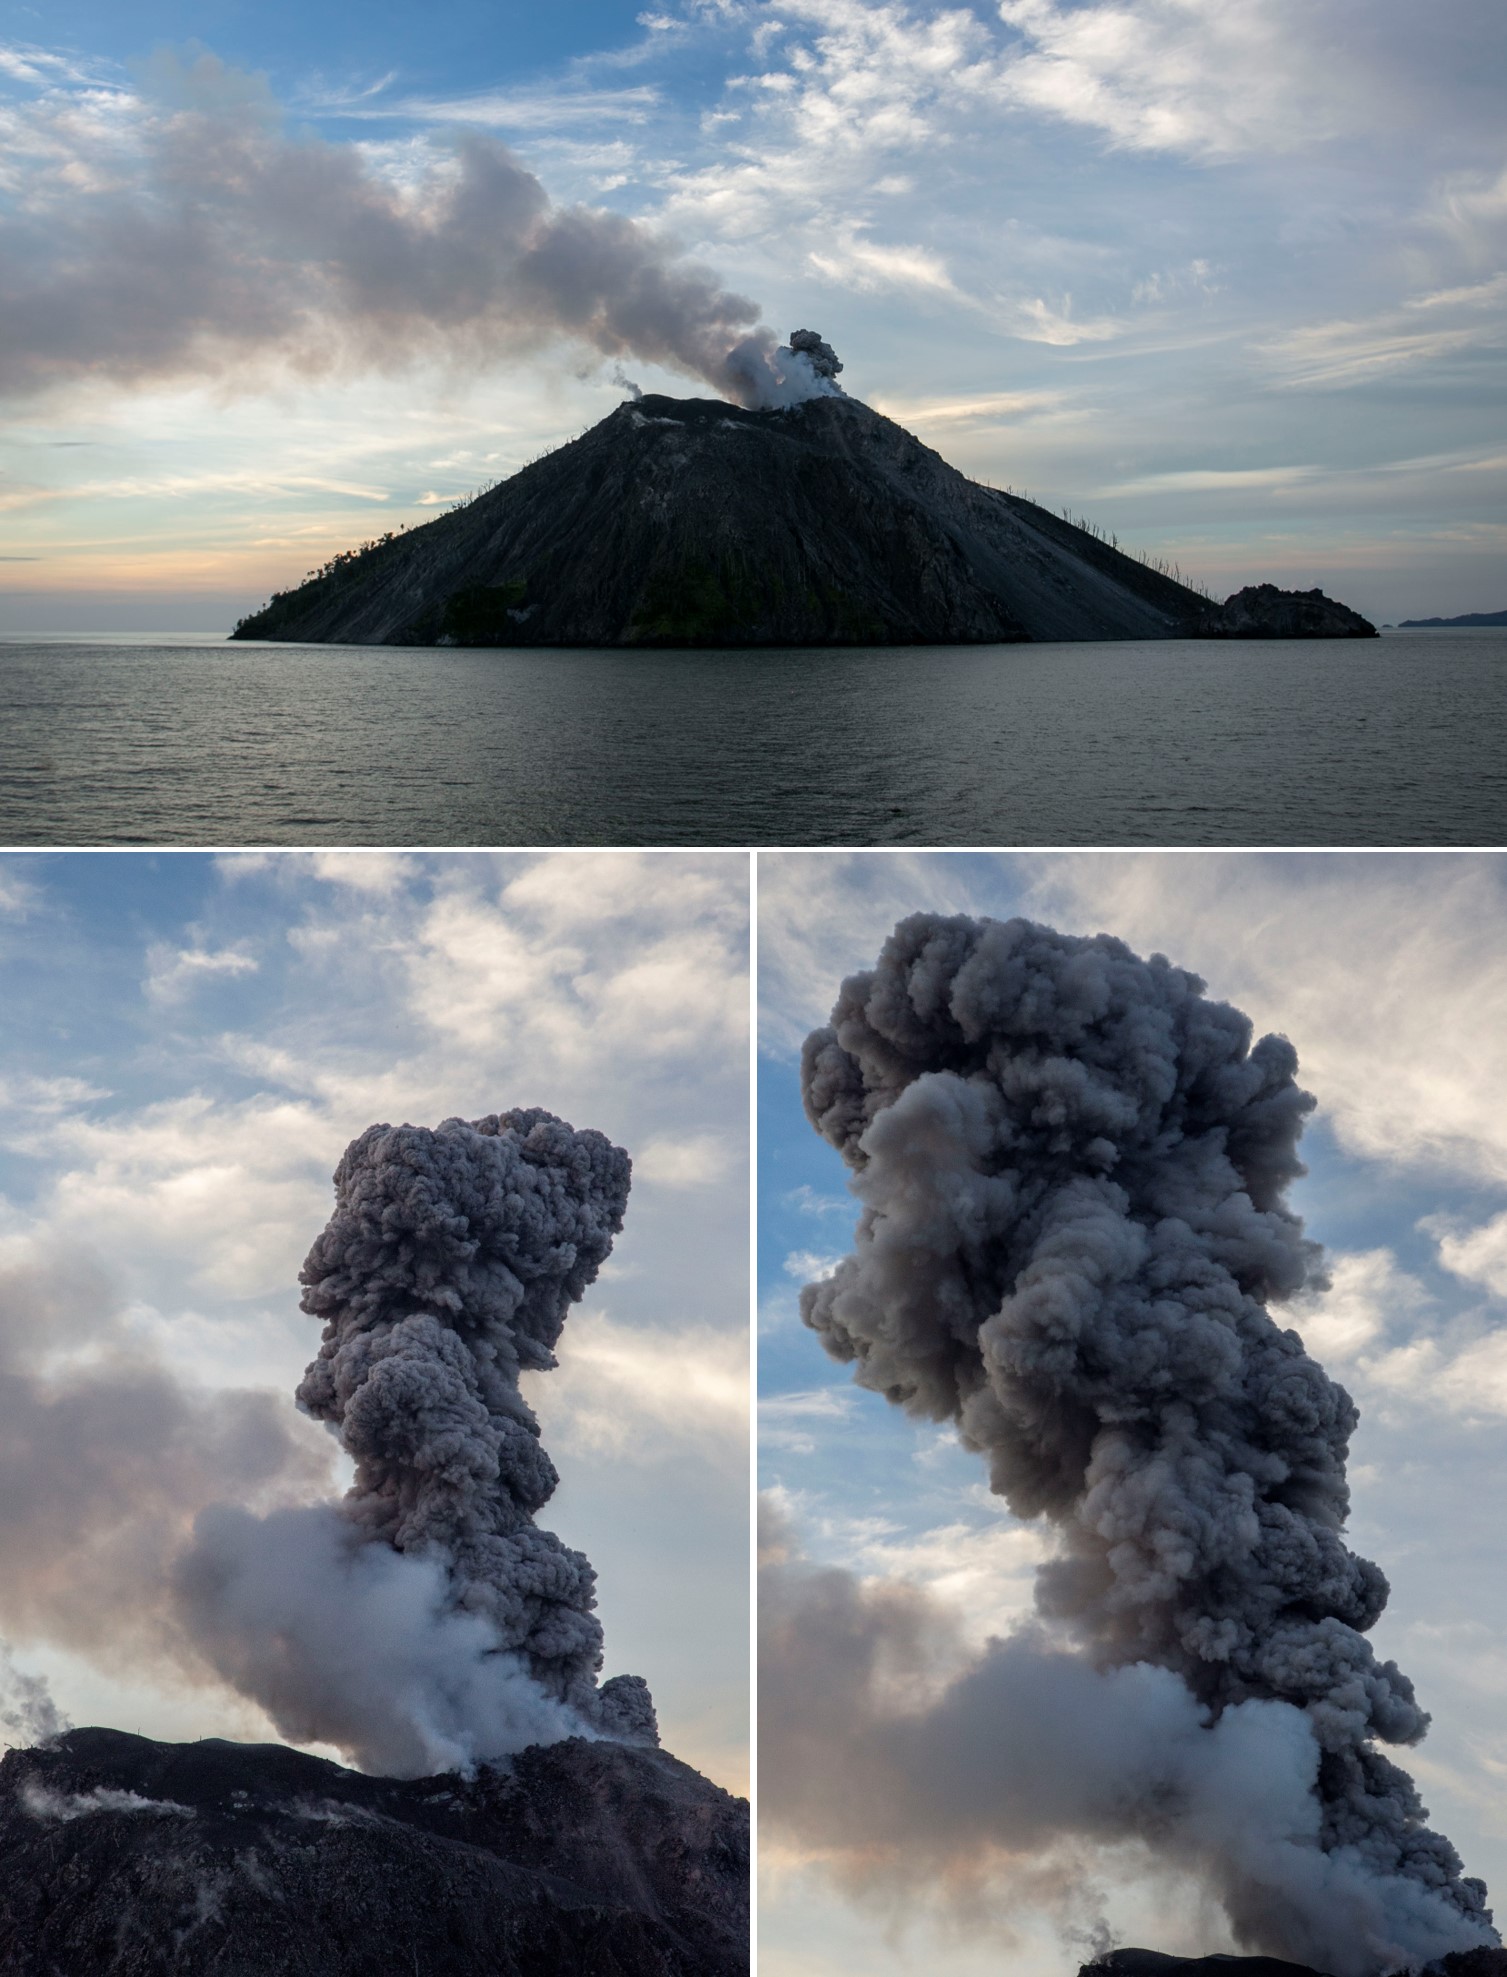 |
Figure 42. An ash plume and a lower gas plume rise during an eruption of Kadovar on 13 November 2019. The summit lava dome is visibly degassing to produce the white gas plume. Copyrighted photos by Chrissie Goldrick, used with permission. |
While gas plumes were visible throughout May-December 2019 (figure 43), SO2 plumes were difficult to detect in NASA SO2 images due to the activity of nearby Manam volcano. The MIROVA thermal detection system shows continued elevated temperatures through to early December, with an increase during May-June (figure 44). Sentinel-2 thermal images showed elevated temperatures through to the end of December but at a lower intensity than previous months.
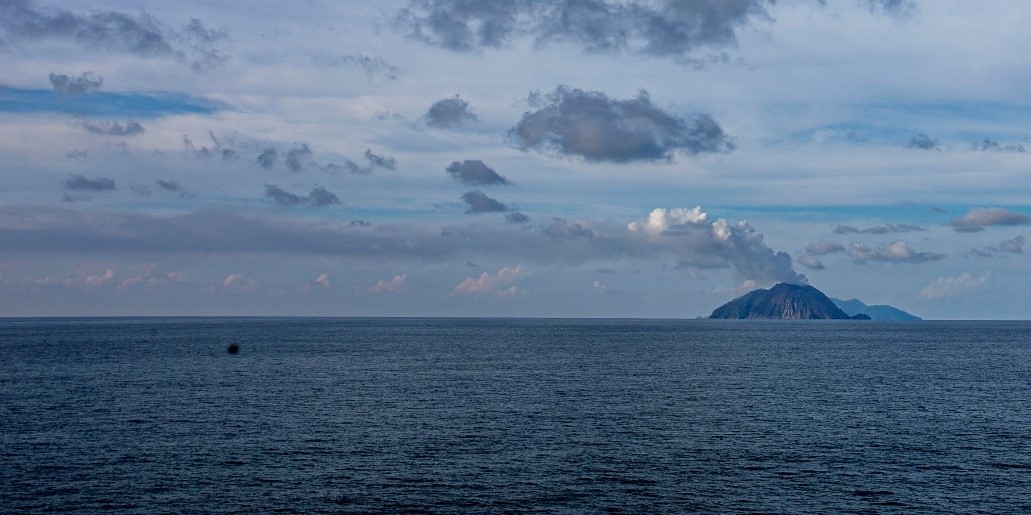 |
Figure 43. This photo of the southeast side Kadovar on 13 November 2019 shows a persistent low-level gas plume blowing towards the left and a more vigorous plume is visible near the crater. This is an example of the persistent plume visible in satellite imagery throughout July-December 2019. Copyrighted photo by Chrissie Goldrick, used with permission. |
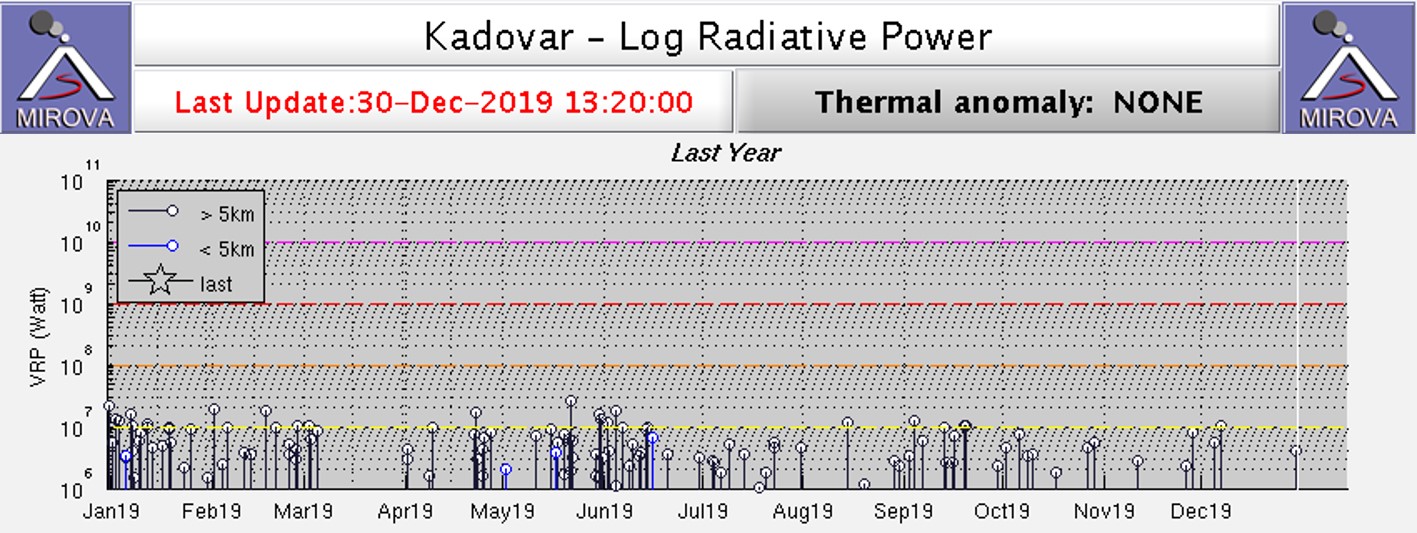 |
Figure 44. The MIROVA plot of radiative power at Kadovar shows thermal anomalies throughout 2019 with some variations in frequency. Note that while the black lines indicate that the thermal anomalies are greater than 5 km from the vent, the designated summit location is inaccurate so these are actually a the summit crater and on the E flank. Courtesy of MIROVA. |
Geological Summary. The 2-km-wide island of Kadovar is the emergent summit of a Bismarck Sea stratovolcano of Holocene age. It is part of the Schouten Islands, and lies off the coast of New Guinea, about 25 km N of the mouth of the Sepik River. Prior to an eruption that began in 2018, a lava dome formed the high point of the andesitic volcano, filling an arcuate landslide scarp open to the south; submarine debris-avalanche deposits occur in that direction. Thick lava flows with columnar jointing forms low cliffs along the coast. The youthful island lacks fringing or offshore reefs. A period of heightened thermal phenomena took place in 1976. An eruption began in January 2018 that included lava effusion from vents at the summit and at the E coast.
Information Contacts: Hawai'i Institute of Geophysics and Planetology (HIGP) - MODVOLC Thermal Alerts System, School of Ocean and Earth Science and Technology (SOEST), Univ. of Hawai'i, 2525 Correa Road, Honolulu, HI 96822, USA (URL: http://modis.higp.hawaii.edu/); Planet Labs, Inc. (URL: https://www.planet.com/); Sentinel Hub Playground (URL: https://www.sentinel-hub.com/explore/sentinel-playground); NASA Worldview (URL: https://worldview.earthdata.nasa.gov); Chrissie Goldrick, Australian Geographic, Level 7, 54 Park Street, Sydney, NSW 2000, Australia (URL: https://www.australiangeographic.com.au/).