Report on Augustine (United States) — March 1986
Scientific Event Alert Network Bulletin, vol. 11, no. 3 (March 1986)
Managing Editor: Lindsay McClelland.
Augustine (United States) Strong explosions send clouds to 14.5 km; pyroclastic flows to sea; strong shallow seismicity
Please cite this report as:
Global Volcanism Program, 1986. Report on Augustine (United States) (McClelland, L., ed.). Scientific Event Alert Network Bulletin, 11:3. Smithsonian Institution. https://doi.org/10.5479/si.GVP.SEAN198603-313010
Augustine
United States
59.3626°N, 153.435°W; summit elev. 1218 m
All times are local (unless otherwise noted)
A series of powerful explosions 27-31 March sent eruption clouds into the stratosphere and generated pyroclastic flows that reached the sea. Ash was deposited over a wide area and international air traffic was disrupted.
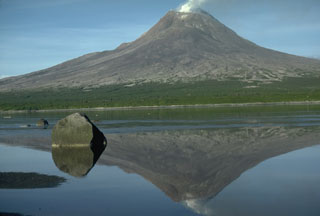
M.E. Yount reports that "Augustine began to erupt during the early morning of 27 March. Observers in fishing boats 55 km SE of the volcano and ashore in Homer, 110 km ENE, reported 'orange flashes' of light and 'smoke and fire' from the volcano between 0200 and 0528. A strong sulfur smell was reported from Homer to Kenai (175 km NE of Augustine). The leading edge of the main plume moved up the E side of Cook Inlet, depositing an estimated 1.5 cm of ash on Kenai and dusting the Anchorage area (260 km NE of the volcano). Numerous major eruptive events with column heights estimated at 9.1-12.2 km punctuated a continuous eruptive plume of varying ash content (figures 1 and 2). Major bursts were recorded at 1023, 1545, 1646, and 1724. During 27 March several lahars were generated on the S flank of the volcano, and pyroclastic flow activity was reported.
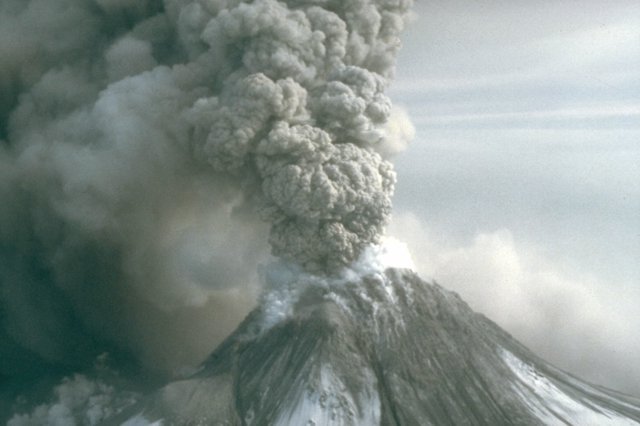 |
Figure 1. Oblique airphoto of Augustine from the south on 27 March 1986, showing the eruption column extending and deposits on the upper flanks. Steam can be seen rising from the margins of the summit crater and from other areas where groundwater has been heated by the eruption. Courtesy of USGS; photo by M.E. Yount. |
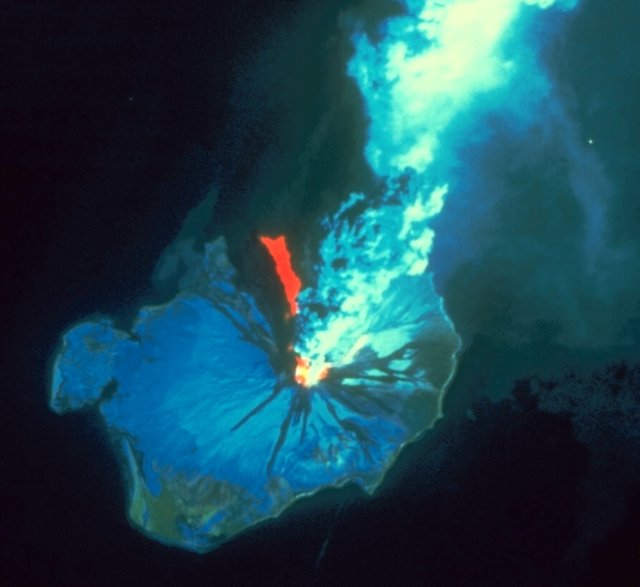 |
Figure 2. LANDSAT image (number 5075620463) of Augustine on 27 March at 1146, showing a vigorous vertical eruption column and pyroclastic flow deposits. Image courtesy of John Power, Geophysical Institute, University of Alaska. |
"Similar eruptive behavior continued through the next day, with column heights generally estimated at 6.1-7.6 km, and perhaps as high as 14.3 km at 1533. Pyroclastic flows down the N flank . . . accompanied these bursts. Most were of insufficient volume or speed to reach the sea. On 29 and 30 March, a continuous eruptive plume with varying ash content rose to elevations of 3-4.5 km; eruptive events with high ash columns were less frequent than on 27 March. During periods of high plume ash content, pyroclastic flows were spilling from the summit vent area at a rate of one every 4-10 minutes (figure 3). As before, most did not reach the sea.
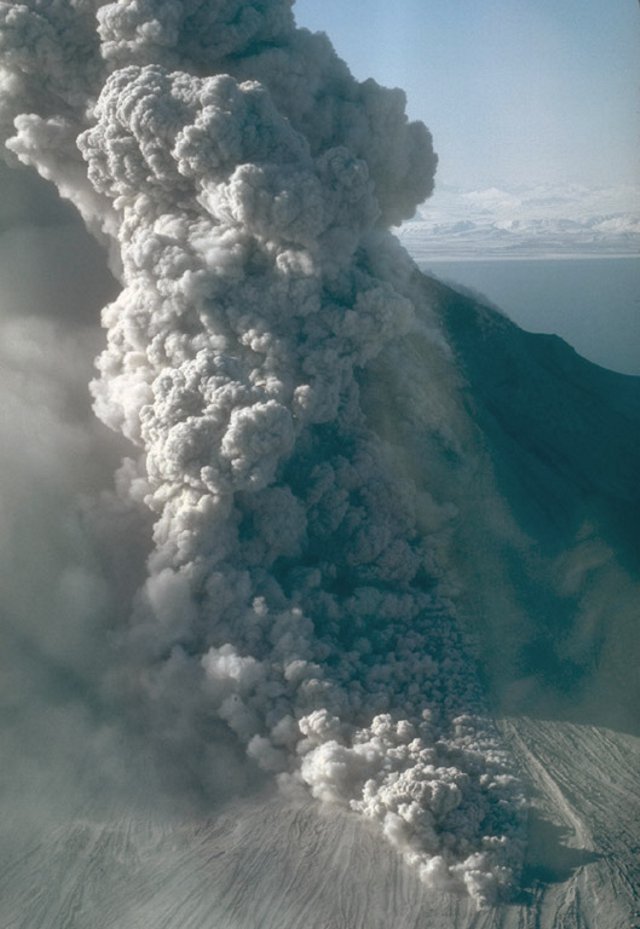 |
Figure 3. Oblique airphoto of Augustine's upper N flank on 30 March 1986, showing a pyroclastic flow advancing down the near flank. The ascending eruption column moving away to the SE casts a strong shadow to the W (right). Courtesy of USGS; photo by M.E. Yount. |
"The final major eruptive ash column was recorded on 31 March at 0952 with an estimated height of 11.6-12.2 km. This burst was accompanied by large pyroclastic flows which entered the sea (on both sides of the University of Alaska Geophysical Institute's Burr Point Cabin on the N side of the island) generating billowing white plumes to 1.5 km as they reached the water. Both seismicity and ash content of the plume tapered off after 31 March.
"Air traffic was disrupted at Anchorage International Airport, a major transportation hub, for several days because of ash clouds in the area. On 29 March, a Sabena Airlines DC-10 suffered significant abrasion of windshield and turbine parts while descending to Anchorage airport in near zero visibility conditions caused by ash in the atmosphere. Businesses and offices in Anchorage closed early on 27 March after requests from the utility company to curtail electrical usage because of potential shutdowns of turbine generators. Postal service was disrupted. An air quality health alert was in effect on 28 March due to high particulate concentrations."
On 3 April at about noon, COSPEC measurements by William Rose from a fixed wing aircraft indicated that SO2 emission was occurring at a rate of about 24,000 t/d, probably a significantly lower rate than during earlier more vigorous activity. Calculations based on COSPEC measurements the previous afternoon suggested that roughly 70,000 metric tons of SO2 may have been present between 1.5 and 4.5 km altitude, within a circular area (about 250 km diameter) extending between Anchorage and Augustine. SO2 from eruptions on 27 and 31 March was detected by the TOMS instrument of the Nimbus-7 satellite. Total SO2 content was significant, but its magnitude has not yet been determined.
Many images from the NOAA 6 and 9 polar orbiting weather satellites showed plumes, extending as much as 450 km from Augustine. NOAA scientists estimated possible plume heights by comparing radiosonde data on wind directions at various altitudes with directions of plume movement observed on satellite images (table 1). Estimates ranged to 24 km, but elevations often could not be determined uniquely because of similar wind patterns at different altitudes. Infrared imagery generally showed a hot spot over the volcano, where heat saturated the temperature sensors.
Table 1. Dimensions of plumes from Augustine, 27 March-6 April 1986, derived from polar-orbiting weather satellite images. Plume heights are estimated by comparing wind data collected at known altitudes by nearby radiosondes with observed directions of plume movement. Multiple altitude estimates are given when plume behavior correlated with similar wind patterns at more than one elevation.
| Date | Time | Satellite | Plume Length (km) | Direction | Altitude estimate (km) |
| 27 Mar 1986 | 1516 | NOAA 9 | 120 | NE | 7 or 9 |
| 27 Mar 1986 | 1850 | NOAA 6 | 180 | NE | 7 or 9 |
| 28 Mar 1986 | 0509 | NOAA 9 | 200-250 | NE | 10 |
| 28 Mar 1986 | 1505 | NOAA 9 | 30 | E | 21 |
| 28 Mar 1986 | 1826 | NOAA 6 | 45 | E | 21 |
| 29 Mar 1986 | 1455 | NOAA 9 | 5 | SE | -- |
| 30 Mar 1986 | 1444 | NOAA 9 | 450 | SE | 3, 5.5, or 7 |
| 31 Mar 1986 | 1629 | NOAA 9 | 150 | SE | 3, 5.5, or 7 |
| 31 Mar 1986 | 1854 | NOAA 6 | 80 | SE | 1.5 or 18.5 |
| 31 Mar 1986 | 1917 | NOAA 6 | 150 | SE | 3, 5.5, or 7 |
| 31 Mar 1986 | 1433 | NOAA 9 | 160 | SE | 1.5 or 18.5 |
| 03 Apr 1986 | 1403 | NOAA 9 | 200 | SE | 16 or 24 |
| 03 Apr 1986 | 1542 | NOAA 9 | 250+ | SE | 16 or 24 |
| 03 Apr 1986 | 1921 | NOAA 6 | 150 | SE | 16 or 24 |
| 05 Apr 1986 | 1520 | NOAA 9 | 150 | E | 3 |
| 05 Apr 1986 | 1833 | NOAA 6 | 150 | E | 3 |
| 06 Apr 1986 | 1512 | NOAA 9 | 100 | ESE | 3 |
| 06 Apr 1986 | 1808 | NOAA 6 | 100 | ESE | 3 |
After a substantial increase in the number of earthquakes on 25 March (figure 4), seismic data indicated that the eruption began at about midnight 26/27 March. On the 27th, the island's five seismic stations recorded intense high-frequency shallow seismicity. Superimposed pulses that saturated the instruments for several-minute periods were believed to be associated with eruptive bursts.
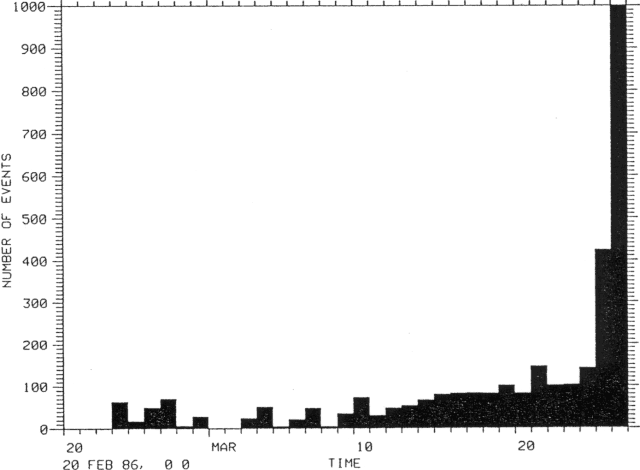 |
Figure 4. Number of seismic events/day at Augustine, 20 February-26 March 1986. Courtesy of John Power, University of Alaska. |
On 28 March, larger seismic events (M > 2) began to be recorded at stations 40 and 80 km from Augustine (figure 5). These occurred during periods of increased seismic intensity at island stations and were associated with reports of ash bursts. Seismicity continued with variable intensity over the next few days. Seismometers on the N side of the island sensed more activity than those on the other flanks, presumably indicating passage of pyroclastic flows down that side of the volcano.
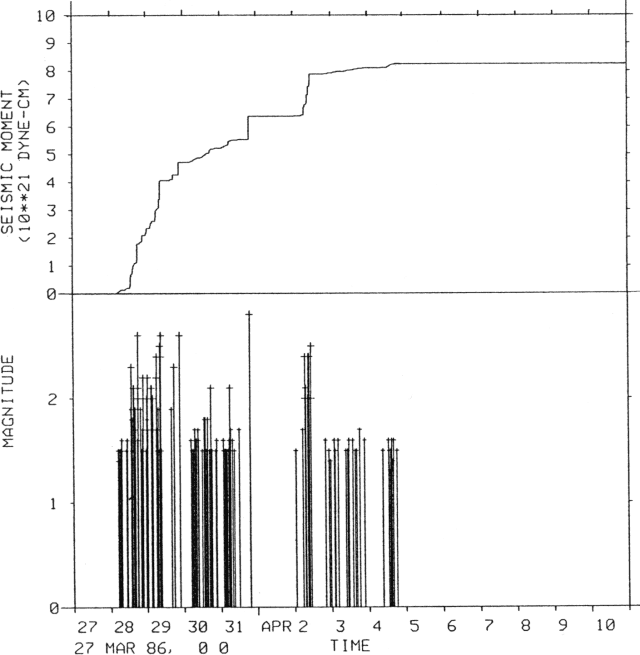 |
Figure 5. Cumulative seismic moment of explosion earthquakes vs time, 28 March-4 April (top); and magnitudes vs time, as recorded by a University of Alaska seismic station 23 km N of the volcano, 28 March-10 April (bottom). As of 16 April, no significant events had been recorded at that station since 4 April. Times and dates are GMT. Plot courtesy of Elliot Endo. |
On 31 March, a large seismic event, associated with the last major ash explosion, began at 0955 and lasted approximately 15 minutes. The signal contained three major pulses and had an average magnitude of 2.75. Seismicity was quiet for a day, then resumed briefly before ceasing to be recorded at seismometers 28 km away (figure 6).
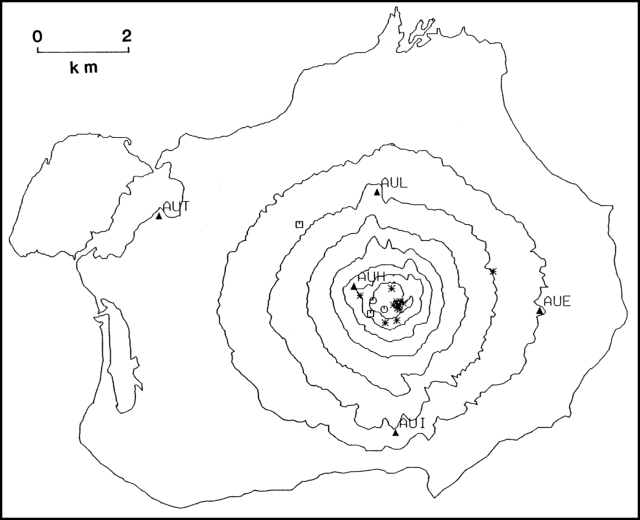 |
Figure 6. Map showing epicenters of the 19 best-located events 25 March-2 April. Hypocenters 0-0.5 km below the summit are shown by asterisks, 0.5-1 km by octagons, and 1-5 km by squares. The five seismometer stations are shown by solid triangles. Courtesy of Charlotte Rowe, University of Alaska. |
During the first week of April, poor weather conditions precluded systematic observation of the volcano, but continuous seismicity indicated that a continuous plume, carrying variable amounts of ash, was being emitted from the volcano. During an overflight on 2 April, pyroclastic flows were observed advancing down the N side of the volcano. On 3 April an airplane pilot reported a plume to 3 km. During an overflight on 6 April, "boil-over" type pyroclastic flows were being emitted from the volcano. During the same day, from separate aircraft, Juergen Kienle and USGS scientists were able to make their first good observation of the summit. They both noted that most of the 1976 dome was still intact, with some loss on the S side. There were no signs of a new dome.
On 10 April, Kienle noted that: 1) A virtually continuous plume containing variable amounts of ash had been emitted from the summit since the eruption's onset. 2) No coarse (subplinian) deposits had been seen during overflights. Sampling on the island had been impossible, but fine brown ash appeared to cover the entire island. 3) Scanning electron micrographs of ash collected in Anchorage on 28 March and in Homer following the 31 March explosion show blocky textures typical of phreatomagmatic eruptions. 4) All earthquakes have been located at approximately sea level (figure 6). 5) Most of the 1976 dome is still in place. These data suggested to Kienle that only phreatic or phreatomagmatic activity had occurred, produced by dike injection to approximately sea level, where magma came into contact with the water table.
Tom Gosink reports that preliminary chemical analysis of ash shows that low-sulfur, high-silica, andesitic material was ejected from the 28 March eruption (table 2). The 2 April eruption was distinctly richer in silica, particularly the fine (3, up to 1,500 ppm, were measured, associated almost exclusively with the fine particles. Lead was detected to only 10 ppm concentrations in all of the ash except the 2 April fine material, in which more than 80 ppm was measured. Rb/Sr is 0.07 for the 28 March bulk sample and 0.10 for the 2 April fine material.
Table 2. Analyses of 1986 Augustine ash, by energy dispersive X-ray fluorescence at the University of Alaska, showing changes with time and particle size. 28 March: bulk sample of ash collected in Anchorage; 2 April: fine (2O3.
| Date | 28 Mar 1986 | 02 Apr 1986 |
| SiO2 | 63.51 | 68.1 |
| Al2O3 | 16.10 | 11.9 |
| Fe2O3* | 6.55 | 5.7 |
| CaO | 5.78 | 5.2 |
| Na2O | 3.08 | 4.6 |
| MgO | 2.37 | 2.4 |
| K2O | 1.33 | 1.2 |
| TiO2 | 0.81 | 0.46 |
| P2O5 | 0.34 | 0.28 |
| MnO | 0.11 | 0.09 |
| Total | 99.98 | 99.93 |
Geological Summary. Augustine volcano, rising above Kamishak Bay in the southern Cook Inlet about 290 km SW of Anchorage, is the most active volcano of the eastern Aleutian arc. It consists of a complex of overlapping summit lava domes surrounded by an apron of volcaniclastic debris that descends to the sea on all sides. Few lava flows are exposed; the flanks consist mainly of debris-avalanche and pyroclastic-flow deposits formed by repeated collapse and regrowth of the summit. The latest episode of edifice collapse occurred during Augustine's large 1883 eruption; subsequent dome growth has restored the edifice to a height comparable to that prior to 1883. The oldest dated volcanic rocks on Augustine are more than 40,000 years old. At least 11 large debris avalanches have reached the sea during the past 1,800-2,000 years, and five major pumiceous tephras have been erupted during this interval. Recorded eruptions have typically consisted of explosive activity with emplacement of pumiceous pyroclastic-flow deposits followed by lava dome extrusion with associated block-and-ash flows.
Information Contacts: J. Kienle, Tom Gosink, John Davies, John Power, David Stone, Chris Nye, Larry Gedney, and Charlotte Rowe, Geophysical Institute, University of Alaska, Fairbanks; M.E. Yount and T. Miller, USGS Anchorage; W. Rose, Los Alamos National Laboratory; Elliot Endo and Michael Doukas, CVO; M. Matson, G. Stephens, and O. Karst, NOAA/NESDIS; A. Krueger, GSFC.