Report on Lonquimay (Chile) — December 1988
Scientific Event Alert Network Bulletin, vol. 13, no. 12 (December 1988)
Managing Editor: Lindsay McClelland.
Lonquimay (Chile) Fissure eruption produces tephra clouds and lava flow
Please cite this report as:
Global Volcanism Program, 1988. Report on Lonquimay (Chile) (McClelland, L., ed.). Scientific Event Alert Network Bulletin, 13:12. Smithsonian Institution. https://doi.org/10.5479/si.GVP.SEAN198812-357100
Lonquimay
Chile
38.379°S, 71.586°W; summit elev. 2832 m
All times are local (unless otherwise noted)
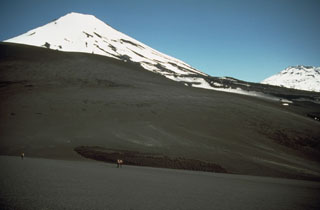
On Christmas Day, after more than 2 weeks of increasing seismicity, an eruption began at the NE foot of the volcano. Vigorous tephra emission fed a large eruption column that produced substantial ashfalls E of the volcano, and a lava flow advanced ~4.5 km.
Felt earthquakes and subterranean noises began 7 December. Several of the shocks reached intensities between IV and V, with magnitudes of 4.2-4.6. Some were registered at Santiago, 800 km away. About 200 earthquakes were felt during the 3 days prior to the start of the eruption, some of intensity VI. One was felt at Temuco, 110 km from the volcano, on 24 December.
The eruption began at 1615 the next day, with a strong ejection of gas and water vapor. Early in the eruption, about eight small vents were active along a fissure ~800 m long, 3.5 km from the summit. Its N60°E trend was similar to the orientation of previous Holocene and historic monogenetic eruptive centers that had produced lava domes and andesitic/dacitic block lava flows. Within a few hours, activity was concentrated at two principal vents. The eruption was dominated by gas emission during its first 36 hours. Moderate Strombolian activity from several vents was reported on 26 December. The next day, gas and tephra rose several thousand meters from the two main vents, feeding a plume that was blown E by mid-level winds. The plume was first detected on NOAA weather satellite images at 1100, when it extended 70 km E at roughly 5.5 km altitude, and remained evident in clear weather during the following weeks (table 1). Viscous lava began to flow N and NE from the fissure on 27 December at about noon.
Table 1. Observations of plumes from Lonquimay on NOAA weather satellite imagery, 27 December 1988-17 January 1989.
| Date | Time | Direction / Length | Weather and/or Height |
| 27 Dec 1988 | 1100-1200 | 70 km E, diffuse | about 5.5 km |
| 27 Dec 1988 | up to 1700 | dense to 50-80 km diffuse to 350 km | cirrus developing |
| 28 Dec 1988 | a.m. | dense ~70 km ENE diffuse to 160 km very diffuse to 68°W periodic pulses | freezing temp, 500-250 mbars |
| 28 Dec 1988 | 1430 | dense 50-80 km, S of E | cloudy |
| 29 Dec 1988 | 0900 | two plumes (v-shaped and diffuse) | -- |
| 29 Dec 1988 | 1200 | denser plume to 175 km E 100 km wide at 125 km very diffuse to 500 km | -- |
| 30 Dec 1988 | a.m. | dense to 150 km (10 km wide) diffuse to 425 km 65 km at widest point | weather front approaching |
| 30 Dec 1988 | p.m. | 100 km, more diffuse | -- |
| 31 Dec 1988 | 1400 | dense to 95 km E, 15-60 km wide; apparently weakening | -- |
| 31 Dec 1988 | 1900 | plume length increased by 2x; 250 km E, 50 km wide | -- |
| 02 Jan 1989 | 1430 | dense to 250 km, very diffuse to 500 km; 25 km wide at 250 km, due E, 40 km/hr wind speed | -- |
| 03 Jan 1989 | -- | 120 km long, 12 km wide; thin as far as 400 km; across continent | at least 5.5 km; -10°C |
| 04 Jan 1989 | 1300 | new eruption pulse (more dense) | -- |
| 04 Jan 1989 | 1500 | starting to separate from volcano | -34°C, about 9 km |
| 04 Jan 1989 | 1600 | weakened (more diffuse); fully separated from volcano; dense to 95 km, 35 km wide; 25 km thick, 120 km SE | -- |
| 05 Jan 1989 | 1400-1600 | still erupting; not as strong; 100-120 km SE | cloudy |
| 06 Jan 1989 | through 1750 | moderate density, 150 km E or N of E; diffuse to 400 km | -- |
| 08 Jan 1989 | 0500 | new eruption pulse | -- |
| 08 Jan 1989 | 1000 | dense, 20-30 km wide, 135 km NE | -- |
| 10 Jan 1989 | a.m. | dense to 200 km SE; diffuse to 500-600 km | -- |
| 10 Jan 1989 | 0630-0700 | eruption pulse | -- |
| 10 Jan 1989 | 0700-0800 | -- | -5°C, 5.5-6 km |
| 10 Jan 1989 | 1430-1730 | dense to 105 km ESE, 45 km wide; diffuse to 200-290 km | -- |
| 12 Jan 1989 | -- | -- | cloudy |
| 13 Jan 1989 | -- | no eruption evident | clear |
| 14-15 Jan 1989 | 2300-0300 | little or no plume evident (on IR) | clear |
| 15 Jan 1989 | 0330-0400 | possible weak eruption | -- |
| 15 Jan 1989 | 0420 | plume on visible image; dense to 150 km NE, diffuse to 350 E | -- |
| 16 Jan 1989 | 0900 | dense to 100-130 km ENE-NE; diffuse to 150-180 km; 20-30 km wide (visible image) | -- |
| 17 Jan 1989 | 0931 | very diffuse ENE to 300-360 km | clear |
A second phase, characterized by strongly explosive phreatomagmatic activity, began on 27 December at 1820 with the violent ejection of a column of gas and tephra, primarily andesite-dacite ash, that reached 9 km altitude in 5 minutes. The activity was concentrated in the upper vent, at 1,680 m elevation, which became the principal eruptive center. Two similar explosions followed, separated by intervals of approximately an hour. Oscar González-Ferrán estimated that the velocity of ejection reached between 250 and 350 km/hour. The next day, activity was nearly continuous, with alternating 15-20-minute periods of higher and lower explosivity ejecting spatter, bombs, lapilli, scoria, and ash. The cone over the main vent had reached 50 m height and 80 m in diameter (table 2). As the crater grew, it developed a horseshoe shape, open to the NE (downslope).
Table 2. Growth of Lonquimay's new Navidad cone, 28 December 1988-4 January 1989. Courtesy of Hugo Moreno Roa.
| Date | Height (m) | Diameter (m) |
| 28 Dec 1988 | 50 | 80 |
| 30 Dec 1988 | 60 | 150 |
| 31 Dec 1988 | 100 | 250 |
| 01 Jan 1989 | 110 | 250 |
| 02 Jan 1989 | 180 | 250 |
| 04 Jan 1989 | above 200 | 300 |
Some 60 hours after the large explosion on 27 December, the third phase began, characterized by substantial lava production (table 3) accompanied by strong magmatic degassing. Vigorous explosions produced shock waves and a large amount of ash, while an andesitic block lava flow crept very slowly NNE. Two lobes were active, the longer to the E. The rate of lava effusion was estimated at ~4 x 10⁵ m3/day through 4 January, with the flow front advancing 20-25 m/hour.
Table 3. Dimensions of the lava flow from Lonquimay, 28 December 1988-4 January 1989. Courtesy of Hugo Moreno Roa.
| Date | Length (km) | Thickness (m) | Surface Area (km2) | Volume (x 106 m3) |
| 28 Dec 1988 | 1.8 | 10 | 1.0 | 10 |
| 30 Dec 1988 | 3.0 | 10 | 1.5 | 15 |
| 31 Dec 1988 | 3.3 | 10 | 2.2 | 22 |
| 02 Jan 1989 | 4.0 | 10 | 2.5 | 25 |
| 04 Jan 1989 | 4.5 | 10 | 3.0 | 30 |
Three seismographs from the Univ of Chile were installed by Sergio Barrientos, Hector Masone, and Oscar González-Ferrán ~27 hours after the onset of the eruption (between 2100 on 26 December and 0400 on the 27th): LON1, on the flank of Cerro Cautín, 4 km from the eruptive center; LON2, in Pinitos Malalcahuello, 11 km away; and LON3 in Quebrada Guamachuco, 12 km from the vent (figure 1). When seismic recording began, activity was very intense, with ~50 events every 3 hours (figure 2). However, seismic activity declined rapidly between 40 and 120 hours after the start of the eruption. Initial analysis of the seismograms showed that the epicenters were concentrated in the immediate eruption area. Geologists therefore believed that eruptive activity was unlikely to propagate SE toward the main crater of Lonquimay or to another point on the eruptive fissure.
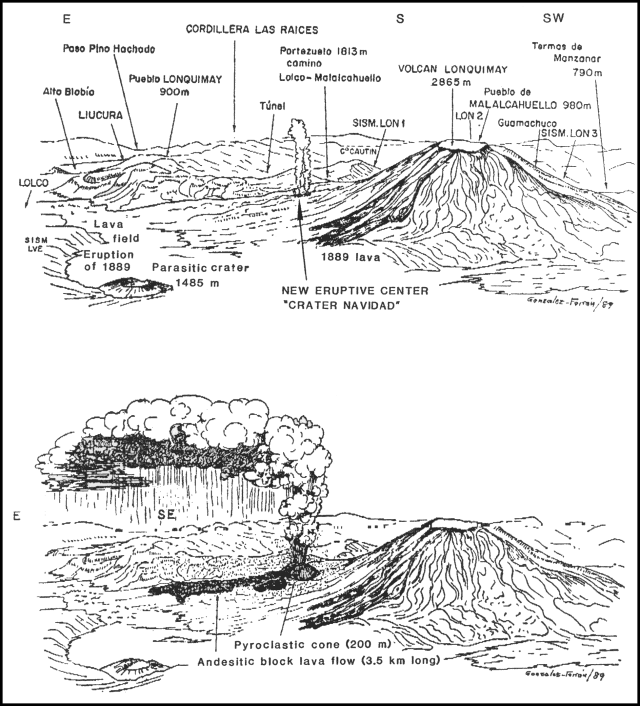 |
Figure 1. Sketches of Lonquimay showing activity during the initial phase during 25-26 December 1988 (top) and in early January 1989 (bottom). In December the new eruptive fissure emitted water vapor, blocks, and fragments of older lava. Positions of newly installed seismic stations LON1, LON2, and LON3 are also indicated. The January sketch depicts the plume rising several thousand meters above the 200-m-high pyroclastic cone and extending tens of kilometers downwind; the lava flow has reached 3.5 km length. Courtesy of O. González-Ferrán. |
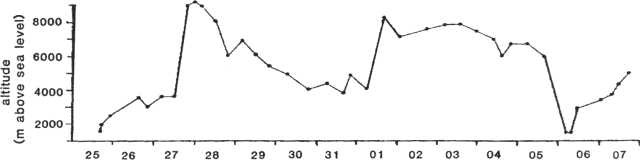 |
Figure 2. Number of seismic events recorded in 3-hour periods, 27 December 1988-7 January 1989, by Univ of Chile seismic station LON3, 12 km from the vent. Arrows label changes in eruptive activity. Courtesy of O. González-Ferrán. |
The effusive phase continued during the following week, with strong magmatic degassing. Explosive activity was intense and nearly continuous with vigorous emission of gas and ash, generating a column that usually remained between 5,000 and 7,000 m altitude (figure 3). The plume was generally very consistent in both altitude and direction, toward the SE.
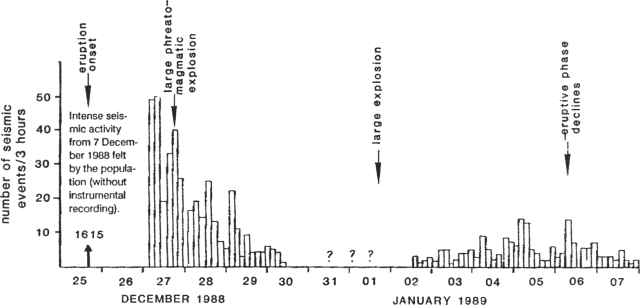 |
Figure 3. Daily altitude of the gas-tephra column from Lonquimay, in meters above sea level, 25 December 1988-7 January 1989. Courtesy of O. González-Ferrán. |
Satellite imagery showed dense plumes extending as much as 250 km and more diffuse material was occasionally evident to 500 km from the volcano (figure 4). The plumes generally were of insufficient density to yield precise blackbody temperatures (and thus infer plume height from satellite data). However, correlations of estimated plume temperatures and directions of drift with data from nearby radiosondes agreed well with altitude estimates by field geologists. Winds caused sporadic rotation and shearing of the eruption column at 2,000-3,000 m altitude, producing ashfall to the SW and NE (figure 5). On 4 January at 1500, during a period of increased atmospheric humidity, geologists observed that the plume became cauliflower-shaped and a thunderstorm developed within it. An acidic rain began to fall, probably of pH 3-4. The estimated volume of the mixture of gas and pyroclastics, principally ash, was on the order of 8 x 10¹¹ m3 as of mid-January. Lava emission was slow and not very voluminous, with the block flow reaching a length of around 3.5 km by 8 January.
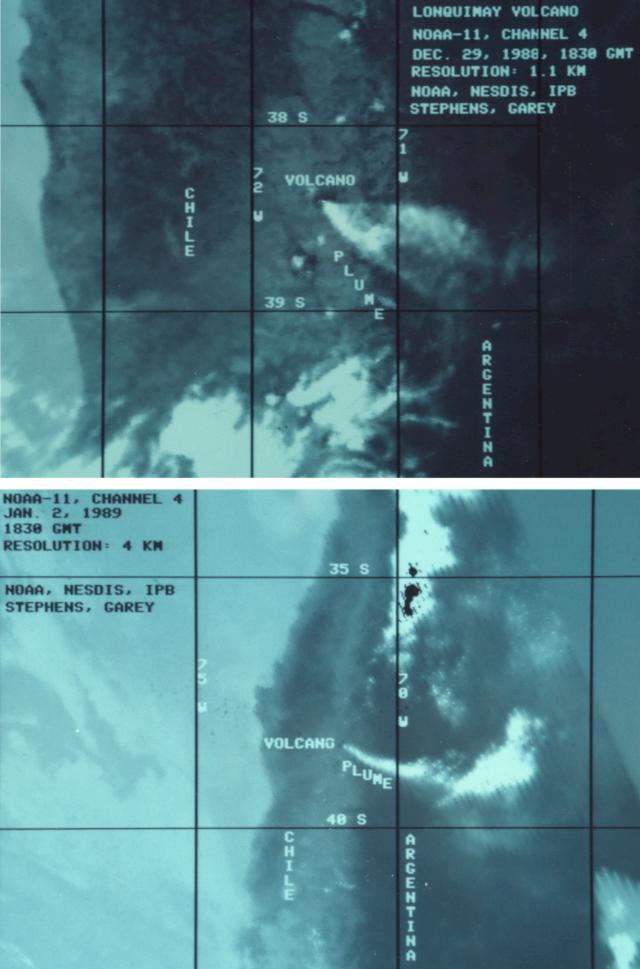 |
Figure 4. Images from data collected by the AVHRR on the NOAA-11 polar orbiting satellite, 29 December 1988 at 1530, 1.1 km resolution (top) and 2 January 1989 at 1530, 4 km resolution (bottom). One of the five spectral channels on the AVHRR (channel 4) senses thermal radiation, and was used to determine plume temperatures of around 0°C on both images. Correlation of this temperature and the direction of plume movement with radiosonde data indicate that the plume is at an altitude of about 5 km on both images. Courtesy of G. Stephens. |
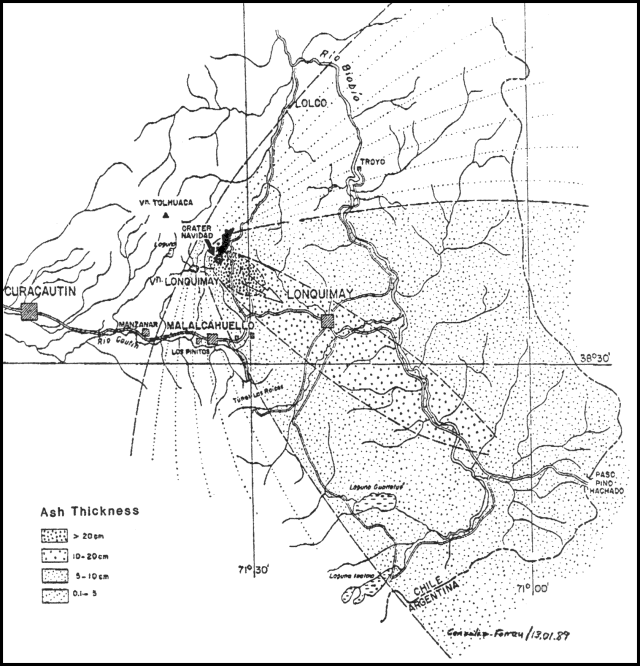 |
Figure 5. Cumulative ash deposition from the Lonquimay eruption as of 13 January 1989. Courtesy of O. González-Ferrán. |
Explosive activity declined noticeably on 6 January at a little before 0400, and had practically ended by 0500. The column of gas and pyroclastics disappeared, with ejection limited to some incandescent blocks. Resumption of activity began with small emissions of gas and pyroclastics every 15 minutes until 0730, to heights that did not exceed 200 m. A new vent-clearing phase then began, consisting of strong emission of ash and soot-like material, without magmatic degassing or ejection of incandescent blocks. Satellite images had shown decreased activity on 5 January, but moderate plumes were evident with diffuse material to 400 km from the volcano on the 6th. Explosive activity continued during the following 24 hours, to altitudes that increased to some 3,000-4,000 m, accompanied by strong explosions. During this phase the plume continued to drift primarily ENE. The lava flow remained stationary.
The number of seismic events had noticeably decreased from the first week of the eruption. During the more effusive activity of 2-8 January, only 210 shocks were registered. No changes or migrations of the epicentral area were observed, with the sole exception of a brief shift toward the SW sector of the volcano (Quebrada de Guamachuco area). This ended quickly and was not repeated. The seismic net was temporarily reinforced by another four seismographs, one with three components, contributed by the Instituto Nacional de Prevención Sísmico de San Juan, Argentina (INPRES) and brought to the region by geologist Nestor Weidmann. This equipment operated 4-9 January before it was returned to its base in San Juan.
Associated with the decline in activity on 6 January was a sequence of strong shocks, some with maximum intensities of IV-V. These were interpreted to be related to the collapse of the roof of the magma chamber as magma column pressure diminished, coinciding with the observed vent-clearing phase. Between 8 and 14 January, a strong increase in seismicity was recorded, while eruptive activity remained at a medium-low level. On 12 January at 0011, a M 4.6 shock reached an estimated intensity of V-VII in the epicentral area, causing landslides, slumping of roads, and broken windows in houses. A shock registered 24 hours later reached M 5.0, larger than the events on 25 December.
On 8 January, the activity continued to increase and was entering a magmatic degassing phase, with an increase in lava block and spatter emission accompanied by strong explosions that caused expansive air waves. González-Ferrán noted that the compositional characteristics of the ejecta had changed from the more viscous and silicic (andesite-dacite) initial phase to a more fluid andesite. Satellite imagery showed continued plume production through 10 January. Clouds then obscured the area until 13 January, when no plume was evident throughout the day despite clear weather. A distinct plume was next detected on 15 January at 0420, with dense material extending 150 km from the volcano. Plume emission was continuing as of 17 January.
Moyra Gardeweg and Jorge Muñoz (SERNAGEOMIN) reported that bombs were of andesite to basaltic andesite composition with plagioclase, pyroxene, and olivine phenocrysts in a pale brown glassy groundmass. L. López-Escobar and J. Martínez (Univ of Chile) noted that ash collected at the town of Lonquimay (20 km from the vent) had an SiO2 content of 57.78% and a bomb collected near the cone, 59.21%, similar to the 59.49% in a sample from the lava flow extruded 100 years ago.
The principal risk for the population continues to be ashfall and gases that have particularly affected the region SE of the vent (Pueblo de Lonquimay, areas around the Cordillera de las Raices and upper Bio-Bio, to the Troyo zone; ashfall also extends into Argentina). The ashfall caused by low-altitude wind shearing occurred to the SSW, affecting the Malalcahuello region and the upper part of the Cautín river toward Guamachuco. The total population affected in Chile was ~10,000, of which ~2,000 were evacuated. The National Emergency Office, The Regional Intendancy, and the National Health Service conveyed immediate medical assistance, distributed protective masks, and issued emergency instructions. The agricultural and livestock authorities have provided information to help protect farm animals, which include ~100,000 cattle and sheep.
Participants in fieldwork included Sergio Barrientos, Hector Masone, Carlos Droguett, and O. González-Ferrán (Univ de Chile), Maurice and Katia Krafft (Equipe Vulcain, Cernay, France), Patricio Acevedo (Dept de Física, Univ de la Frontera, Temuco), Jaime Abarzua (Administrador, Reserva Malalcahuello, CONAF), and E. Casanova (Jefe, Oficina Emergencia, Victoria).
Geological Summary. Lonquimay is a small, flat-topped, symmetrical stratovolcano of late-Pleistocene to dominantly Holocene age immediately SE of Tolguaca volcano. A glacier fills its summit crater and flows down the S flank. It is dominantly andesitic, but basalt and dacite are also found. The prominent NE-SW Cordón Fissural Oriental fissure zone cuts across the entire volcano. A series of NE-flank vents and scoria cones were built along an E-W fissure, some of which have been the source of voluminous lava flows, including those during 1887-90 and 1988-90, that extended out to 10 km.
Information Contacts: O. González-Ferrán and H. Moreno, Univ de Chile; S. Kusselson, O. Karst, G. Swanson, M. Ruminsky, and A. Powell, SAB; G. Stephens, NOAA/NESDIS.