
Since the beginning of an eruption of Jebel at Tair on 30 September, the MODIS satellite detected thermal anomalies over the island every day through 4 December. According to a news article, an eruption took place on 4 December and lava flows intermittently occurred since 30 September.
Sources: IRIN News, Hawai'i Institute of Geophysics and Planetology (HIGP) Thermal Alerts Team
Eruptive cloud entered stratosphere; decaying thermal anomalies
On 30 September 2007 an eruption began on the island of Jebel at Tair (BGVN 32:10) that generated a large SO2 plume, sent lava flows into the sea, and resulted in the deaths of Yemeni soldiers. Observations of continuing activity were made in late November-early December 2007, and also in mid-January 2008, but no other eyewitness reports have been received since that time. However, satellite data indicated continuing thermal anomalies, indicative of hot lava flows, into mid-May 2008.
Thermal anomalies detected by the MODIS instrument on the Terra and Aqua satellites were recorded daily from the beginning of the eruption through 14 January 2008 (figure 10). After that time the detections of anomalies became more intermittent, and fewer alert pixels were recorded each time. Only single-pixel anomalies were observed after 19 February, and the 19-22 February period was the last time anomalies were recorded for more than two consecutive days. Single anomalous pixels were later noted on 13 days from 26 February through May 2008, all apparently located on the N or NW slopes; the last one was on 18 May. [Another thermal anomaly was later detected on 14 June local time.]
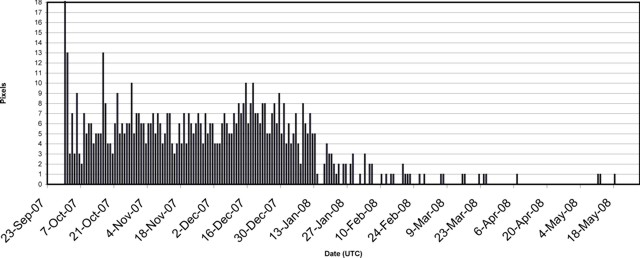 |
Figure 10. Plot showing the maximum number of daily MODVOLC thermal alert pixels detected at Jebel at Tair using MODIS data from Aqua and Terra satellites, September 2007-May 2008. Data courtesy of Hawai'i Institute of Geophysics and Planetology (HIGP) Thermal Alerts System. |
News media reports about the continuing eruption published in early December 2007 stated that at least eight soldiers had been killed during the initial activity on 30 September. Following a magnitude 2.7 earthquake in the Red Sea on 3 December reported by the Yemen Earthquake Observation Center (EOC), other officials were quoted as saying the eruption was "strong" with lava "shooting high in the air." The news stories also noted that two seismic stations had been installed on the Red Sea islands of Zuqar and Hunaish in late November 2007.
A later news report from 13 January 2008 indicated that a third seismic station was placed on the island of Kamaran. The 13 January story in the Yemen Times also included information from the head of the General Authority for Developing Yemeni Islands (GADYI), a government agency, indicating that "smoke steam" plumes were still rising from the crater.
Satellite data analysis. Eckhardt and others (2008) developed an "inverse modeling technique for estimating the vertical profile of SO2 emissions from a volcanic eruption, using total column measurements of SO2 from satellites and a Lagrangian particle dispersion model." Cloud-free satellite views of the 30 September 2007 eruption at Jebel at Tair and the long-range SO2 transport made for an "ideal" test case of the model. Modeling results will not be presented here, but the data analysis undertaken to initialize and test the model produced additional information about the eruption itself. The eruption began earlier than previously reported, and the plume reached stratospheric altitudes.
The onset of the eruption was not well documented, but soldiers reported entering the water to escape the eruption at 1530 local time (BGVN 32:10). By that time the water was described as "boiling" by survivors. Eckhardt and others (2008) looked for signs of the eruption onset using SEVIRI (Spinning Enhanced Visible and Infra-red Imager) satellite imagery (12µ channel). Their analysis of the temperature data suggested that the initial eruption took place before 1427 local time (1127 UTC). Temperature profiles also showed that the eruption cloud penetrated the tropopause, the atmospheric boundary found here at 15.3 km altitude (Eckhardt and others, 2008). Their initial eruption findings were summarized as follows: satellite observations combined with ECMWF (European Center for Medium range Weather Forecasting) and radiosonde profiles suggested an initial eruption no later than 1427; the plume reached neutral buoyancy no earlier than 1500; the minimum value of the 12µ brightness temperature was at 1557, and the plume reached an altitude above 16 km.
Total SO2 column measurements from AIRS (Atmospheric Infrared Sounder), OMI (Ozone Monitoring Instrument), and SEVIRI enabled Eckhardt and others (2008) to estimate a total emission of 80 (± 20) kt of SO2 into the atmosphere. Some instruments observed the plume dispersion for over a week, as it stretched across Asia and the Pacific Ocean.
Reference. Eckhardt, S., Prata, A.J., Seibert, P., Stebel, K., and Stohl, A., 2008, Estimation of the vertical profile of sulfur dioxide injection into the atmosphere by a volcanic eruption using satellite column measurements and inverse transport modeling: Atmospheric Chemistry and Physics Discussions, v. 8, p. 3761-3805.
Information Contacts: Hawai'i Institute of Geophysics and Planetology (HIGP) Thermal Alerts System, School of Ocean and Earth Science and Technology (SOEST), Univ. of Hawai'i, 2525 Correa Road, Honolulu, HI 96822, USA (URL: http://modis.higp.hawaii.edu/); Yemen Times (URL: http://yementimes.com/); Yemen Observer (URL: http://www.yobserver.com/).
2007: September
| October
| November
Since the beginning of an eruption of Jebel at Tair on 30 September, the MODIS satellite detected thermal anomalies over the island every day through 4 December. According to a news article, an eruption took place on 4 December and lava flows intermittently occurred since 30 September.
Sources: IRIN News; Hawai'i Institute of Geophysics and Planetology (HIGP) Thermal Alerts Team
Since the beginning of an eruption of Jebel at Tair on 30 September, the MODIS satellite detected thermal anomalies over the island every day through 6 November.
Source: Hawai'i Institute of Geophysics and Planetology (HIGP) Thermal Alerts Team
According to news reports, the eruption from the Jebel at Tair that began on 30 September continued on 3 October with lava flows noted on the W part of the island.
Source: Gulf News
According to news reports, an eruption from the Jebel at Tair volcano was observed from several passing NATO ships on the evening of 30 September. Witnesses described a fissure eruption that produced lava fountains approximately 100 m high and ash plumes to a height of 300 m (1,000 ft) a.s.l. Multiple 1-km-long lava flows descended to the sea and a large landslide occurred on the W part of the island. Activity continued for at least two days.
The eruption prompted Yemeni authorities to evacuate about 50 soldiers from a military base on the island. A news article on 2 October reported that the Yemeni authorities lowered the death toll to three.
Two weeks prior to the eruption seismicity reportedly increased with earthquakes of M 2-3.6 recorded through 30 September.
Sources: Associated Press; Agence France-Presse (AFP); Agence France-Presse (AFP); IRIN News
Reports are organized chronologically and indexed below by Month/Year (Publication Volume:Number), and include a one-line summary. Click on the index link or scroll down to read the reports.
Eruption on 30 September sends lava flows to the ocean; fatalities among soldiers
An eruption that began on the afternoon of 30 September 2007 from Jebel at Tair (figure 1) sent lava flows across the NE part of the 2 x 3 km island to the sea, and resulted in fatalities among Yemen military personnel. The eruption continued through at least the end of November. A wide variety of spelling variations have been used to identify this island volcano, which is generally translated as meaning "Bird Island" in English; the name used in this report is based on Gass and others (1973). The following information is based on a compilation of news media reports, observations and reports from NATO (North Atlantic Treaty Organization) ship crews that assisted with search and rescue operations, and satellite data.
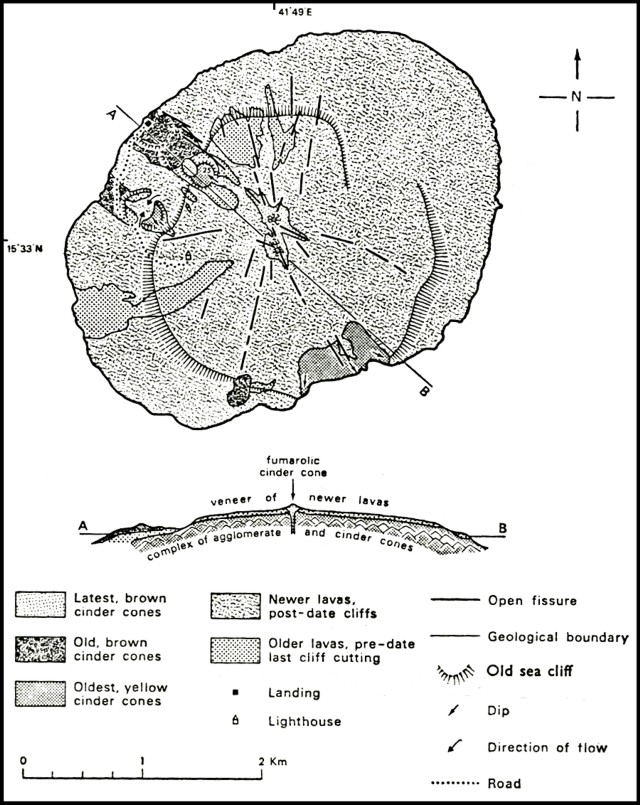 |
Figure 1. Geologic map and cross-section of Jebel at Tair showing the old sea cliff, areas of older lava flows, and yellow cinder cones. The central highland area contained a fumarolic cinder cone noted at the time of the study. Modified from Gass and others (1973). |
A survivor rescued by the HMCS Toronto, Ahmad Abdullah al-Jalal, stated that the eruption "started with shocks like quakes, and then we heard huge blasts with lava and rocks spewing out and dropping on us." Al-Jalal also said that he and six fellow soldiers decided to flee the island by trying to swim through "boiling water" surrounding the island. He claimed to have entered the water at 1530 local time, shortly after the eruption began.
Before the island was visible on the horizon from the NATO ships, the glow of molten rock could be seen lighting up the night sky and a spout of lava was clearly visible. As the ships arrived just after dusk, the crews saw multiple lava flows moving down the slopes. Lava flows and fire fountains were visible on the infrared camera of the Shipboard Electro-Optical Sensor System (SEOSS), though with the naked eye sailors could make out a faint red glow in the cloud of steam and smoke. The infrared camera allowed sailors to watch the lava flow down the slopes into the water, and the enormous pillar of steam rising above it. Photographs and video clearly showed that the source of the lava flows was not confined to a vent near the summit, but was also originating from NE flank fissures that were producing multiple fire fountains (figure 2). Small boats approached within 15 m of the lava-flow ocean entries, where sailors could feel the heat from the lava, steam plumes, and heated seawater.
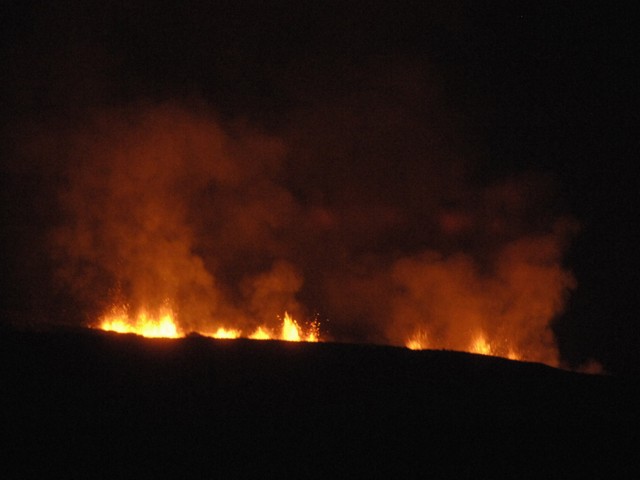 |
Figure 2. Fire fountains rising from a fissure eruption at Jebel at Tair, 30 September 2007. Infrared photo taken from the deck of the Canadian frigate HMCS Toronto offshore of the island. Photo by MCpl Kevin Paul, Canadian Forces Combat Camera. |
Ash plumes were also observed by shipboard observers rising 300 m. Tephra from the activity fell into the water and created floating rafts of ash and pumice that were described in some news reports as extending almost 10 km from the island. NATO ships later encountered the volcanic material 20 km away (figure 3). Lava flows at the shoreline on 2 October remained fluid in some areas (figure 4), while others were steaming (figure 5). Enough steam was rising from the lava flows on the NE side of the island to form a small plume (figure 6).
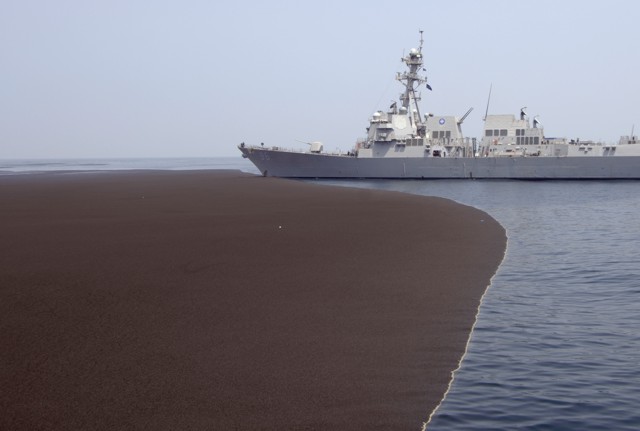 |
Figure 3. Large floating ash and pumice rafts resulted from the 30 September eruption of Jebel at Tair. One of these rafts can be seen in this photo with the USS Bainbridge about 20 km from the island on 2 October 2007. Photo by MCpl Kevin Paul, Canadian Forces Combat Camera. |
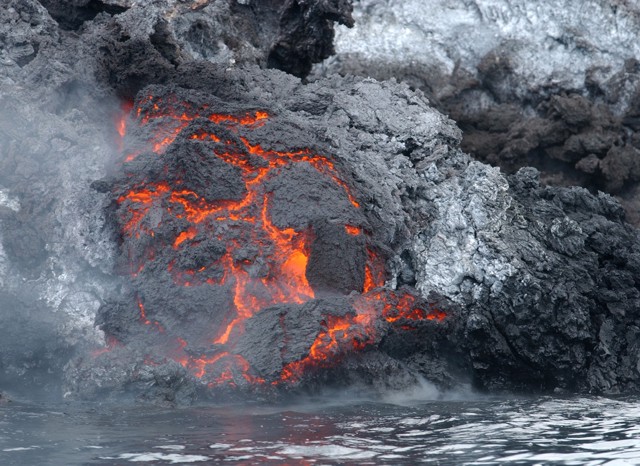 |
Figure 4. Lava entering the ocean at Jebel at Tair, 2 October 2007. U.S. Navy photo by Mass Communication Specialist 3rd Class Vincent J. Street. |
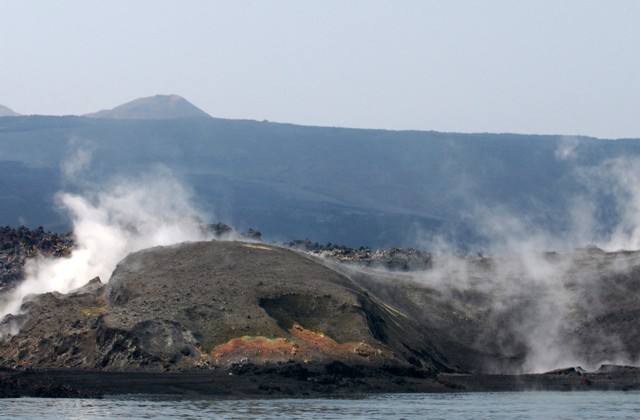 |
Figure 5. Steaming lava flows seen along the NW shoreline of Jebel at Tair, 2 October 2007. U.S. Navy photo by Mass Communication Specialist 3rd Class Vincent J. Street. |
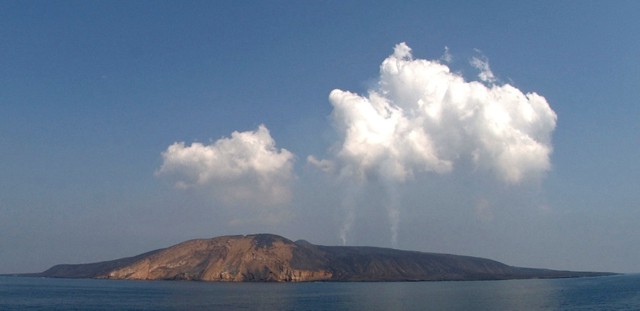 |
Figure 6. Photograph of steam plumes rising from Jebel at Tair, 2 October 2007. View looking N taken from the USS Bainbridge. U.S. Navy photo by Mass Communication Specialist 3rd Class Vincent J. Street. |
Conflicting information reported by news media was attributed to the Yemen Earthquake Observation Centre regarding precursory seismicity. It appears that there was at least some level of increased seismicity in the Red Sea, perhaps as early as 7 September. Starting on 22 September earthquakes with magnitude 2.0-3.6 were allegedly recorded, with five of the larger ones occurring on 30 September. Some reports stated that there were three earthquakes up to M 4.3 on the afternoon of 30 September.
Evacuations and fatalities. Statements from Yemeni Coast Guard sources to news media soon after the onset of activity were that "around 50" soldiers had been evacuated from the island. Communications from the Yemeni Coast Guard to the NATO fleet, when assistance was requested on 30 September, indicated that 21 of the 29 soldiers on the island had been rescued with eight missing. Ships later rescued two soldiers and recovered the bodies of four soldiers from the Red Sea. Reports on 1 October by news media quoting evacuated soldiers and sources in the Yemeni Naval Forces indicated that 3-4 soldiers were killed at the onset of the eruption. One soldier stated that his comrades had been "burned by lava." No official statements were later made about fatalities among the soldiers, so it is unknown if these early reports were accurate.
Assistance from NATO. On the afternoon of 30 September 2007, Standing NATO Maritime Group 1 received a report of an explosion about 150 km N of the force. Two ships scouting ahead were on scene by late afternoon, confirming an eruption. The six NATO ships included Portuguese frigate NRP Alvares Cabral with her Lynx Mk95 helicopter, American destroyer USS Bainbridge, Dutch frigate HNLMS Evertsen, Danish frigate HDMS Olfert Fischer, German oiler FGS Spessart, and the previously mentioned Canadian frigate HMCS Toronto.
Working directly with the Yemen Coast Guard Operations Center, following an official request for assistance, NATO crews searched the volcanic debris-filled waters around the island throughout the night for survivors. After the Yemeni Coast Guard ended the search operation at daybreak and the NATO ships were departing the area, the USS Bainbridge sighted and recovered a survivor. He had drifted about 10 km N of the island, and was found at 0845 on 1 October. Shortly thereafter, HMCS Toronto recovered a second survivor. The only further discoveries were those of soldiers who perished at sea, two found by NATO and two by the Coast Guard.
Satellite imagery and data. Hot spots were detected in MODIS thermal infrared satellite imagery from Jebel at Tair beginning at 2220 (1920 UTC) on 30 September. Thermal anomalies detected by MODIS-MODVOLC continued on a daily basis through November 2007.
Aqua MODIS imagery taken at 1340 (1040 UTC) on 1 October showed a white plume covering the entire NE half of the island. A small white plume rising from the N end of the island was noticeable in visible MODIS imagery on 8 October. Also on 8 October, a Terra ASTER (Advanced Spaceborne Thermal Emission and Reflection Radiometer) image clearly showed recent lava flows emanating from the summit crater along with a thermal anomaly both in the crater and a small elongate anomaly, probably a lava flow or eruptive fissure, immediately to the NNE. Gas plumes were also rising from the summit crater and near-summit lava flows. Lava flows seen in the 8 October image had moved NE from the source before branching out and entering the sea across most of the NE coast at a distance of 2 km from the summit.
Another ASTER image acquired on 15 October (figure 7) provided evidence that the eruption was continuing, with a strong thermal anomaly from the summit crater and from summit-area lava flows. Two new areas of lava flows could be seen compared to the 8 October image, to the NNW and SE, each extending more than 400 m from the crater.
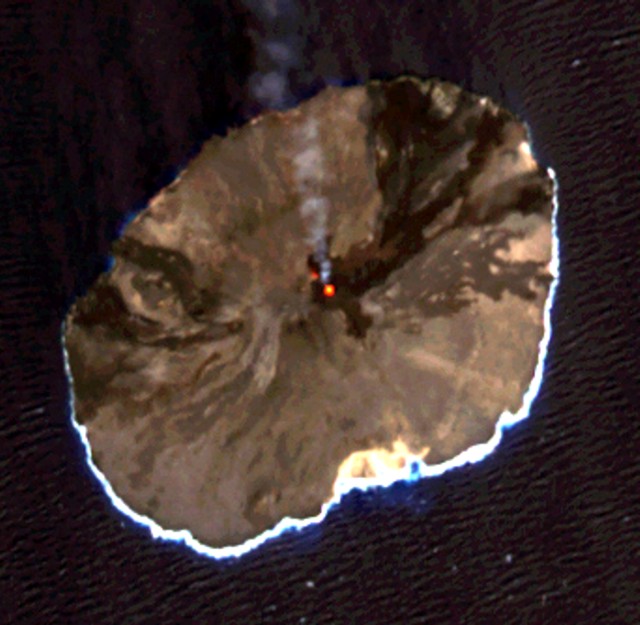 |
Figure 7. Terra ASTER image of Jebel at Tair on 15 October 2007 showing the active summit crater and fresh lava flows. Recent lava flows can be seen extending 2 km NE to the coast, and small flows not present on imagery from 8 October moved NE, NNW, and SE from the vent. A diffuse gas plume is rising and blowing N from the summit crater. Tonal ranges have been adjusted to enhance lava flows. N is towards the top of the image. Courtesy of NASA Earth Observatory. |
Sulfur dioxide emissions. The Ozone Monitoring Instrument (OMI) aboard NASA's Aura satellite detected significant SO2 emissions associated with the 30 September eruption. No SO2 emissions were apparent in OMI data collected at 1315 (1015 UTC) on 30 September. On 1 October at 1400 (1100 UTC) a large SO2 cloud was observed NW of the volcano over NE Sudan and the Red Sea (figure 8), and a less concentrated plume was emanating from the island. The total SO2 burden measured by OMI at this time was ~ 70 kilotons.
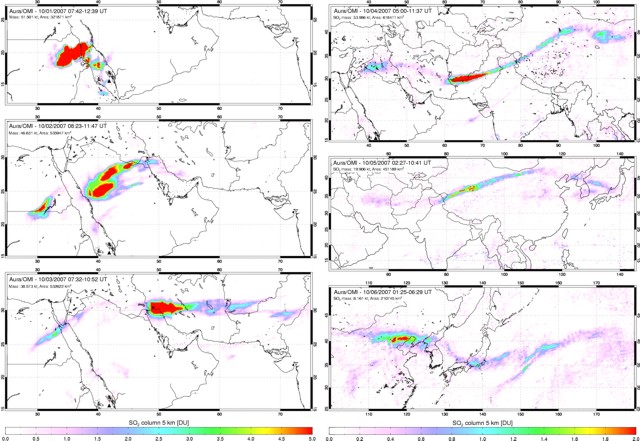 |
Figure 8. Sequence of maps showing the long-range transport by the subtropical jet stream of the SO2 cloud from the Jebel at Tair eruption during 1-6 October 2007. The identifiable cloud reached across Asia and well out over the Pacific Ocean. Courtesy of Simon Carn. |
Subsequently, through 5 October, only very weak SO2 emissions were detected near the volcano. The SO2 cloud observed on 1 October continued to drift across the Arabian Peninsula and central Asia, and on 5 October the leading edge of the cloud reached Japan. The precise altitude of the SO2 cloud is currently unknown, but the speed and pattern of its dispersion, coupled with a relatively slow decrease in SO2 burden, imply that it was transported by the subtropical jet stream at an altitude of at least 10 km. This high altitude suggests an energetic eruption with high lava effusion rates in the early stages of the event.
Observations during November 2007. On 3 November at 0500 Captain Lars Melin and crew aboard the MV Falstaff observed the continuing activity. Incandescence and lava fountains (figure 9) were seen on the NW side of the island near the summit from 6-7 km offshore as the ship passed along the W side. Lava fountains were an estimated 20-50 m high.
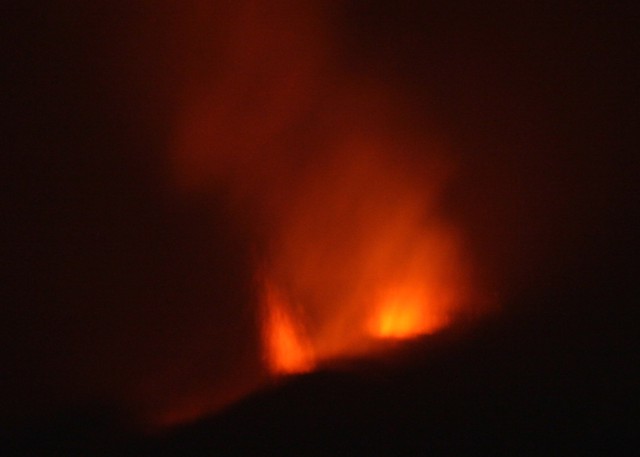 |
Figure 9. Night-time photograph of lava fountains and incandescence from the summit crater at Jebel at Tair, 30 November 2007. Material was estimated to be rising 20-50 m as viewed from 6-7 km offshore during the night. Courtesy of Lars Melin. |
Reference. Gass, I.G., Mallick, D.I.J., and Cox, K.G., 1973, Volcanic islands of the Red Sea: J Geol Soc London, v. 129, p. 275-310.
Information Contacts: Hawai'i Institute of Geophysics and Planetology (HIGP) Thermal Alerts System, School of Ocean and Earth Science and Technology (SOEST), Univ. of Hawai'i, 2525 Correa Road, Honolulu, HI 96822, USA (URL: http://modis.higp.hawaii.edu/); Simon Carn, Joint Center for Earth Systems Technology, University of Maryland Baltimore County (UMBC), 1000 Hilltop Circle, Baltimore, MD 21250 USA (URL: https://so2.gsfc.nasa.gov/); Lars Melin, M/V Falstaff, Sweden; NASA Earth Observatory (URL: http://earthobservatory.nasa.gov/); Ensign Matthew A. Goetz, US Navy, Staff Public Affairs Officer (SPAO); Yemen Observer (URL: http://www.yobserver.com/); Agence France Presse (URL: http://www.afp.com/); Yemen News Agency (SABA) (URL: http://www.sabanews.net/en/); Lookout Newspaper (URL: http://www.lookoutnewspaper.com/); Navy NewsStand, U.S. Navy; Deutsche Presse-Agentur (URL: http://www.dpa.de/); The Canadian Press (URL: http://www.thecanadianpress.com/); The Chronicle Herald (URL: http://thechronicleherald.ca/); Associated Press (URL: http://www.ap.org/).
Eruptive cloud entered stratosphere; decaying thermal anomalies
On 30 September 2007 an eruption began on the island of Jebel at Tair (BGVN 32:10) that generated a large SO2 plume, sent lava flows into the sea, and resulted in the deaths of Yemeni soldiers. Observations of continuing activity were made in late November-early December 2007, and also in mid-January 2008, but no other eyewitness reports have been received since that time. However, satellite data indicated continuing thermal anomalies, indicative of hot lava flows, into mid-May 2008.
Thermal anomalies detected by the MODIS instrument on the Terra and Aqua satellites were recorded daily from the beginning of the eruption through 14 January 2008 (figure 10). After that time the detections of anomalies became more intermittent, and fewer alert pixels were recorded each time. Only single-pixel anomalies were observed after 19 February, and the 19-22 February period was the last time anomalies were recorded for more than two consecutive days. Single anomalous pixels were later noted on 13 days from 26 February through May 2008, all apparently located on the N or NW slopes; the last one was on 18 May. [Another thermal anomaly was later detected on 14 June local time.]
|
Figure 10. Plot showing the maximum number of daily MODVOLC thermal alert pixels detected at Jebel at Tair using MODIS data from Aqua and Terra satellites, September 2007-May 2008. Data courtesy of Hawai'i Institute of Geophysics and Planetology (HIGP) Thermal Alerts System. |
News media reports about the continuing eruption published in early December 2007 stated that at least eight soldiers had been killed during the initial activity on 30 September. Following a magnitude 2.7 earthquake in the Red Sea on 3 December reported by the Yemen Earthquake Observation Center (EOC), other officials were quoted as saying the eruption was "strong" with lava "shooting high in the air." The news stories also noted that two seismic stations had been installed on the Red Sea islands of Zuqar and Hunaish in late November 2007.
A later news report from 13 January 2008 indicated that a third seismic station was placed on the island of Kamaran. The 13 January story in the Yemen Times also included information from the head of the General Authority for Developing Yemeni Islands (GADYI), a government agency, indicating that "smoke steam" plumes were still rising from the crater.
Satellite data analysis. Eckhardt and others (2008) developed an "inverse modeling technique for estimating the vertical profile of SO2 emissions from a volcanic eruption, using total column measurements of SO2 from satellites and a Lagrangian particle dispersion model." Cloud-free satellite views of the 30 September 2007 eruption at Jebel at Tair and the long-range SO2 transport made for an "ideal" test case of the model. Modeling results will not be presented here, but the data analysis undertaken to initialize and test the model produced additional information about the eruption itself. The eruption began earlier than previously reported, and the plume reached stratospheric altitudes.
The onset of the eruption was not well documented, but soldiers reported entering the water to escape the eruption at 1530 local time (BGVN 32:10). By that time the water was described as "boiling" by survivors. Eckhardt and others (2008) looked for signs of the eruption onset using SEVIRI (Spinning Enhanced Visible and Infra-red Imager) satellite imagery (12µ channel). Their analysis of the temperature data suggested that the initial eruption took place before 1427 local time (1127 UTC). Temperature profiles also showed that the eruption cloud penetrated the tropopause, the atmospheric boundary found here at 15.3 km altitude (Eckhardt and others, 2008). Their initial eruption findings were summarized as follows: satellite observations combined with ECMWF (European Center for Medium range Weather Forecasting) and radiosonde profiles suggested an initial eruption no later than 1427; the plume reached neutral buoyancy no earlier than 1500; the minimum value of the 12µ brightness temperature was at 1557, and the plume reached an altitude above 16 km.
Total SO2 column measurements from AIRS (Atmospheric Infrared Sounder), OMI (Ozone Monitoring Instrument), and SEVIRI enabled Eckhardt and others (2008) to estimate a total emission of 80 (± 20) kt of SO2 into the atmosphere. Some instruments observed the plume dispersion for over a week, as it stretched across Asia and the Pacific Ocean.
Reference. Eckhardt, S., Prata, A.J., Seibert, P., Stebel, K., and Stohl, A., 2008, Estimation of the vertical profile of sulfur dioxide injection into the atmosphere by a volcanic eruption using satellite column measurements and inverse transport modeling: Atmospheric Chemistry and Physics Discussions, v. 8, p. 3761-3805.
Information Contacts: Hawai'i Institute of Geophysics and Planetology (HIGP) Thermal Alerts System, School of Ocean and Earth Science and Technology (SOEST), Univ. of Hawai'i, 2525 Correa Road, Honolulu, HI 96822, USA (URL: http://modis.higp.hawaii.edu/); Yemen Times (URL: http://yementimes.com/); Yemen Observer (URL: http://www.yobserver.com/).
|
|
||||||||||||||||||||||||||
There is data available for 5 confirmed eruptive periods.
2007 Sep 30 - 2008 Jun 16 (?) ± 15 days Confirmed Eruption (Explosive / Effusive) VEI: 3 (?)
| Episode 1 | Eruption (Explosive / Effusive) | ||||||||||||||||||||||||||||||||||||||||||||||||||||||||||||||||
|---|---|---|---|---|---|---|---|---|---|---|---|---|---|---|---|---|---|---|---|---|---|---|---|---|---|---|---|---|---|---|---|---|---|---|---|---|---|---|---|---|---|---|---|---|---|---|---|---|---|---|---|---|---|---|---|---|---|---|---|---|---|---|---|---|
| 2007 Sep 30 - 2008 Jun 16 (?) ± 15 days | Evidence from Observations: Reported | |||||||||||||||||||||||||||||||||||||||||||||||||||||||||||||||
|
List of 11 Events for Episode 1
|
||||||||||||||||||||||||||||||||||||||||||||||||||||||||||||||||
1883 Confirmed Eruption (Explosive / Effusive) VEI: 2
| Episode 1 | Eruption (Explosive / Effusive) | |||||||||||||||||||
|---|---|---|---|---|---|---|---|---|---|---|---|---|---|---|---|---|---|---|---|
| 1883 - Unknown | Evidence from Observations: Reported | ||||||||||||||||||
|
List of 2 Events for Episode 1
|
|||||||||||||||||||
1863 Confirmed Eruption (Explosive / Effusive) VEI: 2
| Episode 1 | Eruption (Explosive / Effusive) | |||||||||||||||||||
|---|---|---|---|---|---|---|---|---|---|---|---|---|---|---|---|---|---|---|---|
| 1863 - Unknown | Evidence from Observations: Reported | ||||||||||||||||||
|
List of 2 Events for Episode 1
|
|||||||||||||||||||
1833 Dec 31 ± 365 days Confirmed Eruption (Explosive / Effusive) VEI: 2
| Episode 1 | Eruption (Explosive / Effusive) | |||||||||||||||||||
|---|---|---|---|---|---|---|---|---|---|---|---|---|---|---|---|---|---|---|---|
| 1833 Dec 31 ± 365 days - Unknown | Evidence from Observations: Reported | ||||||||||||||||||
|
List of 2 Events for Episode 1
|
|||||||||||||||||||
1750 ± 50 years Confirmed Eruption (Explosive / Effusive) VEI: 2
| Episode 1 | Eruption (Explosive / Effusive) | |||||||||||||||||||
|---|---|---|---|---|---|---|---|---|---|---|---|---|---|---|---|---|---|---|---|
| 1750 ± 50 years - Unknown | Evidence from Observations: Reported | ||||||||||||||||||
|
List of 2 Events for Episode 1
|
|||||||||||||||||||
This compilation of synonyms and subsidiary features may not be comprehensive. Features are organized into four major categories: Cones, Craters, Domes, and Thermal Features. Synonyms of features appear indented below the primary name. In some cases additional feature type, elevation, or location details are provided.
Synonyms |
||||
| Teyr, Djebel | Teir, Djebel | Tayir, Djebel | Ter, Djebel | Tar, Djebel | Teer, Gebel | Tir, Jibbel | Sebain, Djebel | Sziwan, Djebel | Khebrit, Djebel | Cabret, Djebel | Tayr, Jabal al | ||||
Cones |
||||
| Feature Name | Feature Type | Elevation | Latitude | Longitude |
| Duchan, Jebel
Doukkhan, Djebel |
Cone | 244 m | 15° 33' 0.00" N | 41° 50' 0.00" E |
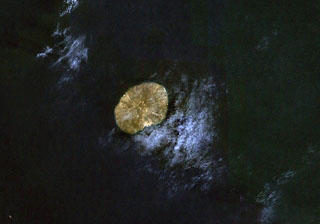 The small, oval-shaped island in this NASA Landsat image (with north to the top) is Jebel at Tair. This 3-km-wide island is the emergent summit of a stratovolcano that rises from a 1,200 m depth in the south-central Red Sea. Youthful lava flows from a steep-sided central vent, Jebel Duchan, cover most of the island. The island is of Holocene age, and explosive eruptions were reported in the 18th and 19th centuries.
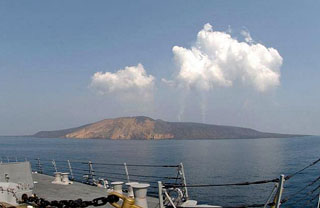 Plumes are visible from the eruption of Jebel at Tair rise above the volcano as seen from the U.S. Navy vessel USS Bainbridge on 2 October 2007, two days after the start of the eruption. The small, 3-km-wide island rises from a 1,200 m depth in the south-central Red Sea. Jebel at Tair (one of many variations of the name, including Djebel Teyr, Jabal at Tayr, and Jibbel Tir) is the northernmost known Holocene volcano in the Red Sea. Historical eruptions date back to the 18th century.
There are no samples for Jebel at Tair in the Smithsonian's NMNH Department of Mineral Sciences Rock and Ore collection.
| Copernicus Browser | The Copernicus Browser replaced the Sentinel Hub Playground browser in 2023, to provide access to Earth observation archives from the Copernicus Data Space Ecosystem, the main distribution platform for data from the EU Copernicus missions. |
| MIROVA | Middle InfraRed Observation of Volcanic Activity (MIROVA) is a near real time volcanic hot-spot detection system based on the analysis of MODIS (Moderate Resolution Imaging Spectroradiometer) data. In particular, MIROVA uses the Middle InfraRed Radiation (MIR), measured over target volcanoes, in order to detect, locate and measure the heat radiation sourced from volcanic activity. |
| MODVOLC Thermal Alerts | Using infrared satellite Moderate Resolution Imaging Spectroradiometer (MODIS) data, scientists at the Hawai'i Institute of Geophysics and Planetology, University of Hawai'i, developed an automated system called MODVOLC to map thermal hot-spots in near real time. For each MODIS image, the algorithm automatically scans each 1 km pixel within it to check for high-temperature hot-spots. When one is found the date, time, location, and intensity are recorded. MODIS looks at every square km of the Earth every 48 hours, once during the day and once during the night, and the presence of two MODIS sensors in space allows at least four hot-spot observations every two days. Each day updated global maps are compiled to display the locations of all hot spots detected in the previous 24 hours. There is a drop-down list with volcano names which allow users to 'zoom-in' and examine the distribution of hot-spots at a variety of spatial scales. |
|
WOVOdat
Single Volcano View Temporal Evolution of Unrest Side by Side Volcanoes |
WOVOdat is a database of volcanic unrest; instrumentally and visually recorded changes in seismicity, ground deformation, gas emission, and other parameters from their normal baselines. It is sponsored by the World Organization of Volcano Observatories (WOVO) and presently hosted at the Earth Observatory of Singapore.
GVMID Data on Volcano Monitoring Infrastructure The Global Volcano Monitoring Infrastructure Database GVMID, is aimed at documenting and improving capabilities of volcano monitoring from the ground and space. GVMID should provide a snapshot and baseline view of the techniques and instrumentation that are in place at various volcanoes, which can be use by volcano observatories as reference to setup new monitoring system or improving networks at a specific volcano. These data will allow identification of what monitoring gaps exist, which can be then targeted by remote sensing infrastructure and future instrument deployments. |
| Volcanic Hazard Maps | The IAVCEI Commission on Volcanic Hazards and Risk has a Volcanic Hazard Maps database designed to serve as a resource for hazard mappers (or other interested parties) to explore how common issues in hazard map development have been addressed at different volcanoes, in different countries, for different hazards, and for different intended audiences. In addition to the comprehensive, searchable Volcanic Hazard Maps Database, this website contains information about diversity of volcanic hazard maps, illustrated using examples from the database. This site is for educational purposes related to volcanic hazard maps. Hazard maps found on this website should not be used for emergency purposes. For the most recent, official hazard map for a particular volcano, please seek out the proper institutional authorities on the matter. |
| IRIS seismic stations/networks | Incorporated Research Institutions for Seismology (IRIS) Data Services map showing the location of seismic stations from all available networks (permanent or temporary) within a radius of 0.18° (about 20 km at mid-latitudes) from the given location of Jebel at Tair. Users can customize a variety of filters and options in the left panel. Note that if there are no stations are known the map will default to show the entire world with a "No data matched request" error notice. |
| UNAVCO GPS/GNSS stations | Geodetic Data Services map from UNAVCO showing the location of GPS/GNSS stations from all available networks (permanent or temporary) within a radius of 20 km from the given location of Jebel at Tair. Users can customize the data search based on station or network names, location, and time window. Requires Adobe Flash Player. |
| DECADE Data | The DECADE portal, still in the developmental stage, serves as an example of the proposed interoperability between The Smithsonian Institution's Global Volcanism Program, the Mapping Gas Emissions (MaGa) Database, and the EarthChem Geochemical Portal. The Deep Earth Carbon Degassing (DECADE) initiative seeks to use new and established technologies to determine accurate global fluxes of volcanic CO2 to the atmosphere, but installing CO2 monitoring networks on 20 of the world's 150 most actively degassing volcanoes. The group uses related laboratory-based studies (direct gas sampling and analysis, melt inclusions) to provide new data for direct degassing of deep earth carbon to the atmosphere. |
| Large Eruptions of Jebel at Tair | Information about large Quaternary eruptions (VEI >= 4) is cataloged in the Large Magnitude Explosive Volcanic Eruptions (LaMEVE) database of the Volcano Global Risk Identification and Analysis Project (VOGRIPA). |
| EarthChem | EarthChem develops and maintains databases, software, and services that support the preservation, discovery, access and analysis of geochemical data, and facilitate their integration with the broad array of other available earth science parameters. EarthChem is operated by a joint team of disciplinary scientists, data scientists, data managers and information technology developers who are part of the NSF-funded data facility Integrated Earth Data Applications (IEDA). IEDA is a collaborative effort of EarthChem and the Marine Geoscience Data System (MGDS). |

