
CVGHM reported that seismicity from Batur decreased from 1 June to 17 November and fumarolic plumes rose from the crater. On 19 November the Alert level was lowered to Normal, or 1 (on a scale of 1-4).
Source: Pusat Vulkanologi dan Mitigasi Bencana Geologi (PVMBG, also known as CVGHM)
Thousands of dead fish floating in caldera lake during June 2011
Batur stratovolcano sits at the E end of the island of Bali amid nested calderas (figure 4) and rises 686 m above the surface of an intra-caldera lake of the same name (Sutawidjaja, 2009). The entire complex remained non-eruptive through at least mid-2011 as it has for at least a decade (since a moderate eruption in 1974 and a series of smaller eruptions in the 1990s ceasing in about 2000). Local authorities reported that, following some variable seismicity during 2009-2010, starting 19 June 2011 residents smelled sulfurous gas and saw many dead fish floating on the lake's surface. The kill took place in the volcano's caldera lake but in the absence of visible eruptive activity and without anomalous geophysical perturbations.
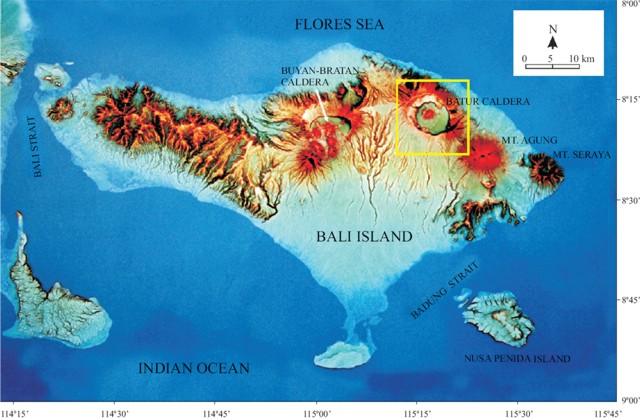 |
Figure 4. Physiographic map of the island of Bali highlighting Batur caldera. The topographic high in the N-central caldera is Batur stratovolcano (summit elevation, 1,717 m). The lake (not delineated) lies along the caldera's SE side. Taken from Sutawidjaja (2009). |
Our previous report on Batur (BGVN 34:11) had noted increased seismicity from September to 7 November 2009. Since that report, the Center of Volcanology and Geological Hazard Mitigation (CVGHM) has reported that seismicity from Batur decreased from 1 June to 17 November 2010 and fumarolic plumes rose from the crater. On 19 November the Alert level was lowered to Normal, or 1.
Investigation of thousands of dead fish. CVGHM scientists visited Lake Batur (figure 5) to learn more about the incident. They learned that residents of lakeside villages first observed lake water discoloration and acrid (like sulfur) odors on the morning of 19 June 2011. A greenish-white discoloration first emerged in spots, but these spots soon connected and spread. The residents had seen a slick on the water surface spread from the E-central lake shore towards the S (from Toya Bungkah to Buahan, figure 6). In conjunction with these changes in color, thousands of dead fish were found at the surface of the lake (figure 7).
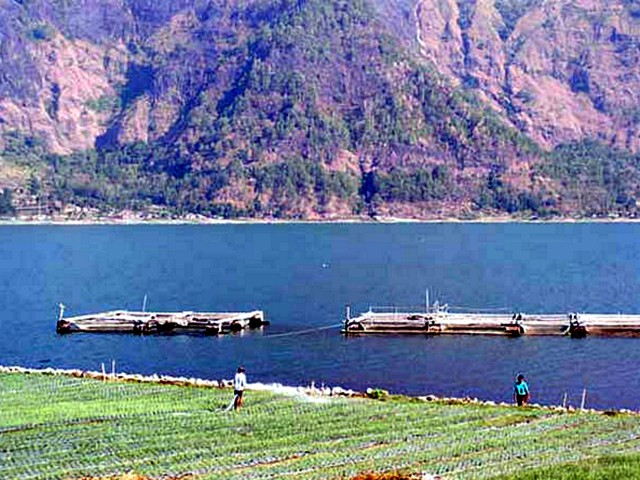 |
Figure 5. Photo of Lake Batur with two farmers for scale. The tops of fish cages (kerambah) can be seen in the lake water. Note steep caldera wall in background. Photo taken from allvoices.com. (Photographer unknown and other details undisclosed.) |
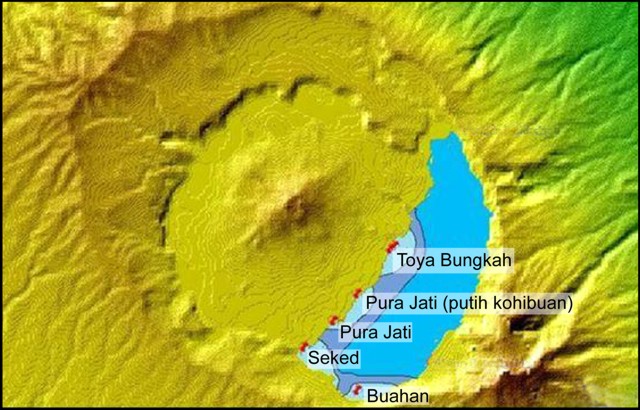 |
Figure 6. Map showing location of Lake Batur, with the locations of the greenish-white water seen near the coast (shaded). The lake is 7.7 km in the long dimension and has a surface area of 16 km2. Courtesy of CVGHM. |
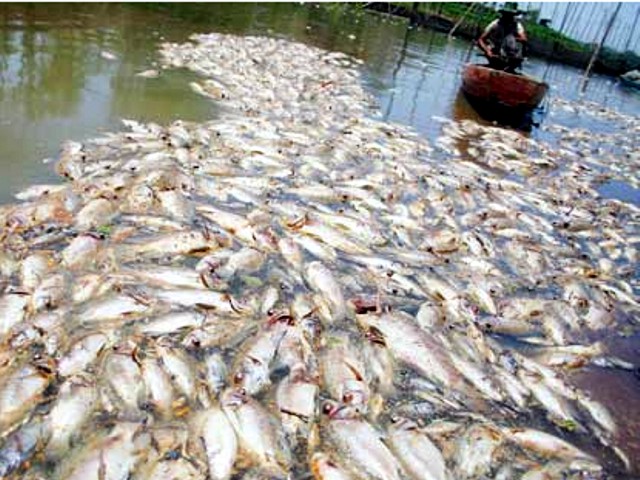 |
Figure 7. Photo of dead fish floating on the surface of Lake Batur associated with the fish kill of 2011. Thousands of fish died, many near the village of Toya Bungkah. Undated photo taken from indosurflife.com. |
The translated report contained this important passage. "According to information from a resident (Made Yuni, age 59), the change in color of the lake water, consisting of patches of whitish green, is a yearly event, although [typically] small in scale and not causing the death of fish. The change in color of the lake water occurs during the change of seasons (i.e. the transition), between the wet and dry parts of the year when there is a stiff wind from the S. The incident of the lake water changing color and the death of the fish on 19 June 2011 occurred about two weeks into the dry season. The death of fish in Batur on the present scale happened before, in 1995."
Scientists conducted an examination during 21-22 June 2011. They also had pre-event temperature and pH for multiple sites on the lake going back at least several months. At the time of the visit, all residual odors had dispersed. Results of ambient gas measurements showed no traces of anomalous carbon monoxide, carbon dioxide, methane, or hydrogen sulfide. The lake temperature was found to be 15°C, which is considered normal. pH levels in the lake were found to be constant with other measurements taken in normal times as well. No increase in volcanic earthquakes were reported before or after the fish kill (the pattern of earthquakes was constant at typical background, 1 event/day). The colors seen were attributed to both warm water welling up (springs at Toya Bungkah) but also at places where such springs are absent.
On 20 June the water by the village of Seked returned to its normal color. Late in 21 June the water by the other villages involved returned to its normal color. Scientists found neither dead weeds or algae nor gas bubbles associated with the fish kill.
Scientists from CVGHM found no evidence to conclude the fish kill was volcanically triggered nor did they mention it portending eruptive activity. Rather, the scientists noted the comparatively high diurnal-temperature difference during the onset of the dry season. As a result of these temperature differences, the lake water developed currents, which carried mud from the lake bottom to the surface. This was thought to correspond to the observed odors ('muddy smells') and color changes on the lake surface. In a broad sense, the currents and mud were thought to upset the lake's ecological balance in a manner toxic to the fish.
Residents were advised to not consume dead fish from the incident, but fish that had survived were still considered fit for human consumption. Many inhabitants around Lake Batur are fisherman by trade and it is estimated that the fish kill resulted in losses up to billions of Rupiah (1 billion Rupiah currently equivalent to ~120,000 US Dollars). The water of Lake Batur is also irrigated into surrounding farms. There is no official documentation on whether or not the recent events at Lake Batur have affected the neighboring agriculture.
Reference. Sutawidjaja, I.S., 2009, Ignimbrite Analyses of Batur Caldera, Bali, based on 14C dating, Jurnal Geologi Indonesia, Vol. 4 No. 3, September 2009: 189-202 [http://www.bgl.esdm.go.id/dmdocuments/jurnal20090304.pdf].
Information Contacts: Center of Volcanology and Geological Hazard Mitigation (CVGHM), Jalan Diponegoro 57, Bandung 40122, Indonesia (URL: http://www.vsi.esdm.go.id/); Bali Discovery Tours, Komplek Pertokoan Sanur Raya No. 27 Jl. By Pass Ngurah Rai,Sanur, Bali, Indonesia (URL: http://www.balidiscovery.com)
2010: November
2009: November
2001: April
CVGHM reported that seismicity from Batur decreased from 1 June to 17 November and fumarolic plumes rose from the crater. On 19 November the Alert level was lowered to Normal, or 1 (on a scale of 1-4).
Source: Pusat Vulkanologi dan Mitigasi Bencana Geologi (PVMBG, also known as CVGHM)
CVGHM reported increased seismicity from Batur from September to 7 November and a significant increase in the number of volcanic earthquakes on 8 November. The Alert Level was raised to 2 (on a scale of 1-4).
Source: Pusat Vulkanologi dan Mitigasi Bencana Geologi (PVMBG, also known as CVGHM)
VSI reported that there were no major changes visible at Batur during 9-15 April. Thin steam plumes continued to rise above the volcano's crater. Seismographs recorded no shallow volcanic earthquakes, two deep volcanic earthquakes, two small explosion earthquakes, and 17 tectonic earthquakes. The volcano remained at Alert Level 2 (on a scale of 1-4).
Source: Pusat Vulkanologi dan Mitigasi Bencana Geologi (PVMBG, also known as CVGHM)
During 2-9 April, thin steam plumes were observed rising from Batur's crater. Seismographs recorded one deep volcanic earthquake, two shallow volcanic earthquakes, ten tectonic earthquakes, and five small explosion events. Batur is at Alert Level 2 (on a scale of 1-4).
Source: Pusat Vulkanologi dan Mitigasi Bencana Geologi (PVMBG, also known as CVGHM)
Reports are organized chronologically and indexed below by Month/Year (Publication Volume:Number), and include a one-line summary. Click on the index link or scroll down to read the reports.
Thermal activity
A thin white plume rose 2-10 m from the solfatara field in the N wall of the crater. Gases emerged with a weak hissing sound and had temperatures of 40-80°C in 27° air. Other solfataras emitted 2-5-m white plumes at 90-95°C. Seismic stations recorded one local and 26 distant tectonic events, and one volcanic earthquake in November.
Information Contacts: VSI.
First significant eruptive activity in 18 years leads to ashfall 6 km WSW of the summit
Beginning on 4 August, the daily number of A-type volcanic earthquakes increased to 14; two days later 125 events were registered. An eruption on 7 August from the E part of the summit, Batur Crater III, caused ashfall as far as ~6 km WSW (figure 1). Ash covered Kintamani on the caldera rim, one of Bali's famous tourist attractions. Incandescent lava fragments and black smoke were ejected to heights of 300 m. None of the larger lava fragments fell outside of the active crater. News reports indicated that the eruption generated 960 explosions through 11 August. Volcanic tremor recorded by the VSI on 13 August had a maximum amplitude of 4.5 mm, but was increasing. By 14 August, when lava reached the surface, the tremor amplitude was 23 mm.
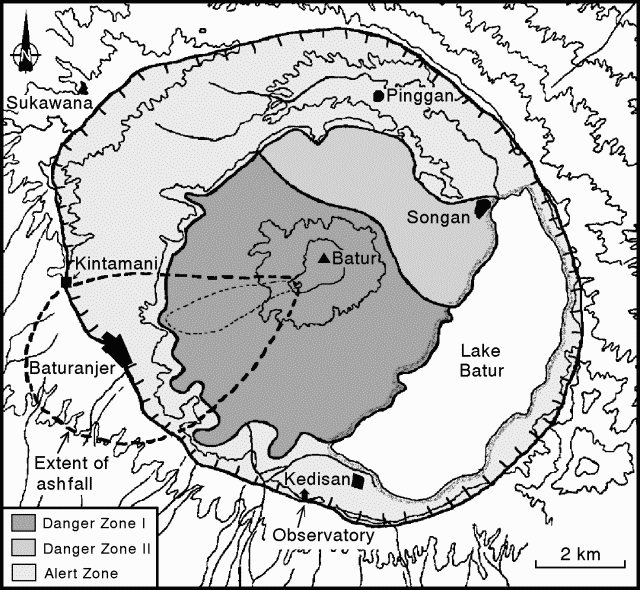 |
Figure 1. Map of the Batur caldera, showing hazard zones, selected towns, and extent of ashfall from the eruption that began on 7 Aug 1994. The inner caldera is not shown, but includes most of danger zones I and II. Courtesy of VSI. |
As of 18 August, no evacuations from the area around the . . . volcano had taken place. About 180,000 people live in Bangli Regency, but only ~500 live in what a spokesman called the "critical region." Batur was declared off-limits for climbers on 7 August, and local villagers were put on alert. An official at a monitoring center said tourists who evaded guards and climbed the mountain were taking large risks. According to press reports, the eruptions have not reduced the number of visitors to the popular resort island; Batur's crater attracts ~300 people every day. Many observe the volcanic activity from Kintamani, on the crater rim (figure 1).
Information Contacts: VSI; AP; Reuters; UPI; ANS; D. Shackleford, Fullerton CA, USA.
Activity declines following 7-11 August eruption
An . . . eruption . . . on 7 August . . . marked the first significant eruptive activity in 18 years. According to a 12 August Reuters news report, during 7-11 August Batur "spewed glowing ash and smoke more than 600 times." The Reuters report noted that a spokesman for the local governor's office said "the threat of a major volcanic blast on Indonesia's resort island of Bali appeared to lessen on Friday [12 August] after Mount Batur's activity slowed." The news report also quoted Wimpy Tjetjep (VSI): "The probability that there will be a big and destructive eruption is small."
Information Contacts: W. Tjetjep, VSI; Reuters.
Continuous mild eruptive activity during first week of July
During the first week of July, Batur continuously emitted a gray plume 25-300 m above the crater. Observers saw incandescent material frequently ejected. Two episodes of tremor with amplitudes of 0.3-24 mm were recorded.
Information Contacts: Volcanological Survey of Indonesia, Jalan Diponegoro No.57, Bandung 40122, Indonesia (URL: http://www.vsi.esdm.go.id/).
New eruption beginning in March; frequent explosions
During the week of 9-15 March, white ash plumes rose 10-100 m above the crater. Booming noises were heard six times, and volcanic earthquakes increased drastically compared to the previous week (table 1). It was later determined that an ash eruption had begun on 15 March, sending bluish-white plumes 10-50 m high. On 17 March, two relatively recent craters merged when a connecting ridge collapsed as a result of earthquakes and small eruptions.
Table 1. Weekly seismicity recorded at Batur, March-July 1999. Types of events include volcanic A-type, volcanic B-type, tectonic, explosion earthquakes, and ash emissions (small explosion earthquakes). No data were available for the period 30 March-19 April. Maximum explosion amplitudes were reported as 2-26 mm during May; more typical, smaller amplitudes were 1.5-24 mm during May-July. Courtesy of VSI.
| Date | A-type | B-type | Tectonic | Explosion | Emission |
| 02-08 Mar 1999 | 2 | 0 | 1 | 0 | 2 |
| 09-15 Mar 1999 | 106 | 241 | 1 | 0 | 26 |
| 16-22 Mar 1999 | 0 | 14 | 1 | 270 | 5 |
| 23-29 Mar 1999 | -- | -- | 1 | 299 | -- |
| 30 Mar-05 Apr 1999 | -- | -- | -- | -- | -- |
| 06-12 Apr 1999 | -- | -- | -- | -- | -- |
| 13-19 Apr 1999 | -- | -- | -- | -- | -- |
| 20-26 Apr 1999 | 1 | 2 | 2 | 79 | 35 |
| 27 Apr-03 May 1999 | 0 | 0 | 0 | 42 | 21 |
| 04-10 May 1999 | 0 | 0 | 0 | 26 | 39 |
| 11-17 May 1999 | 8 | 3 | 6 | 68 | 21 |
| 18-24 May 1999 | 0 | 0 | 3 | 337 | 47 |
| 25-31 May 1999 | 1 | 6 | 0 | 112 | 31 |
| 01-07 Jun 1999 | 3 | 4 | 1 | 6 | 19 |
| 08-14 Jun 1999 | 12 | 5 | 4 | 0 | 52 |
| 15-21 Jun 1999 | 4 | 6 | 4 | 85 | 48 |
| 22-28 Jun 1999 | 5 | 13 | 1 | 141 | 31 |
| 29 Jun-05 Jul 1999 | 10 | 10 | 2 | 171 | 50 |
| 06-12 Jul 1999 | 1 | 6 | 1 | 122 | 32 |
| 13-19 Jul 1999 | 0 | 0 | 1 | 206 | 14 |
Volcanic activity was dominated by emission events (small explosions) during the week of 23-29 March; the eruption plume was white-blue in color, rising 10-100 m above crater rim. Booming noises were heard three times on 22 March, but no glow was observed. Reports are not available for most of April, but during late April through the middle of May the seismic record was dominated by explosion events. Ash plumes, described as "white" or "white-bluish" were observed rising 50-100 m above the crater. Neither explosion sounds nor glow was observed.
Six explosions on 17 May ejected materials that fell around the crater. Another explosion on 25 May was accompanied by incandescent ejections that fell around the crater. Explosion sounds were heard on 17 occasions during the week of 25-31 May. "White ash emissions" rose only to 25 m during 1-14 June, but varied between 10 and 100 m the rest of the month. Similar activity continued through mid-July, and a variable rumbling noise was heard the week of 13-19 July.
Information Contacts: Volcanological Survey of Indonesia (VSI), Jalan Diponegoro No. 57, Bandung 40122, Indonesia (URL: http://www.vsi.esdm.go.id/).
Frequent ash emissions and explosions since August 1999
Intermittent explosive activity has continued since July 1999 (BGVN 24:06). The following report covers the periods of August-September 1999, February-June 2000, and August-September 2000. Reports were not available for the interim periods. However, there was no activity on 20 July 2000 (figure 2) when participants attending the IAVCEI General Assembly visited the caldera (see Sutawidjaja, 2000).
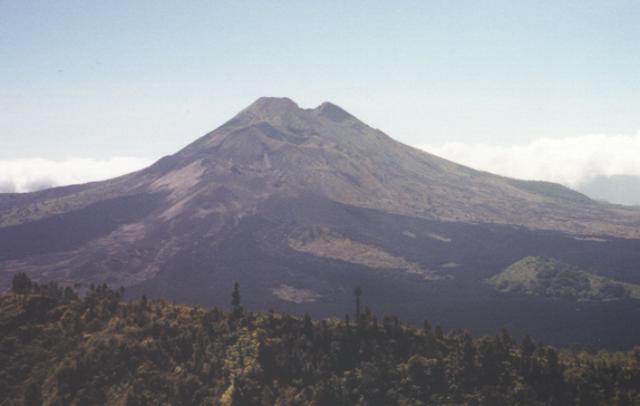 |
Figure 2. Photograph of the active cone at Batur, 20 July 2000. View is looking NE from Penelokan on the caldera rim. Courtesy of Edward Venzke, SI. |
In August 1999, Batur Post Observatory (BPO) observed frequent ash emissions and small explosions. Ash eruptions varied in height from 5 to 150 m above the volcano's crater rim. Some explosive events were accompanied by ejection of lava; the material rose 10-25 m, and incandescence could be observed at night. Explosion earthquakes dominated seismicity, which increased relative to the previous month. Frequent rumbling of varying intensity could be heard in the vicinity of Batur. During September, ash ejection increased in height, ranging from 25 to 250 m. Incandescent material continued to erupt from the crater. Seismicity continued to increase; seismographs recorded explosion earthquakes with amplitudes of 2-28 mm.
Ash emission, lava ejection, and mild explosions occurred during February 2000. Ash rose 25-250 m above the summit. Ejection of molten material accompanied some explosions. Rumbling could be heard frequently around the volcano. Overall seismicity was lower than in September 1999; fewer explosion earthquakes and slightly more shallow volcanic (B-type) earthquakes occurred. In the middle of the month, a gray ash plume rose up to 300 m above the summit. Ejected material fell up to 50 m from the center of the crater. By the end of February, ash emissions rose 10-50 m above the summit. Explosion frequency and intensity decreased. Low-density, white ash-and-gas emissions rose up to 75 m in early March. In mid-March the ash plume rose 10-25 m. Audible rumbling ceased, and seismicity decreased substantially.
On 22-23 March, a large explosion issued from the crater; ejecta were sent 200 m above the rim and rained back down within the crater. Seismicity increased along with the frequency of explosion earthquakes. Explosions and ash emissions continued into April, when ash and explosion debris reached up to 300 m in height, and rumbling resumed. Seismicity decreased by the end of the month. By early May, emission had decreased to a low-density, white ash-and-gas plume and rose 5-25 m above the crater rim. Rumbling ceased. Similar emissions and seismicity remained through the end of June. During August-September, a low-density, white plume rose up to 10 m above the crater rim, and seismicity maintained relatively low levels.
Reference. Sutawidjaja, Igan S., 2000, A guide to the geological phenomena of Batur Caldera, Bali, Indonesia: Fieldtrip guide prepared for the IAVCEI General Assembly, Bali, Indonesia, 33 p.
Information Contacts: Dali Ahmad, Volcanological Survey of Indonesia (VSI), Jalan Diponegoro No. 57, Bandung 40122, Indonesia (URL: http://www.vsi.esdm.go.id/).
White, thin plume to 10 m above crater rim during March and April 2001
During March and April 2001, a thin-white plume was observed reaching up to 10 m above the crater rim at Batur. During January through April 2001 unspecified categories of monthly earthquakes numbered 6, 10, 20, and 6, respectively; their depths were 2-5 km. Some further details on specific types of March-April earthquakes appear in table 2. Based on these data, the Volcanological Survey of Indonesia (VSI) lowered the Alert Level from 2 to 1 (on a scale of 1-4) in early May. No further activity has been reported as of September 2001.
Table 2. Seismic activity registered at Batur during March and April 2001. Courtesy of VSI.
| Date | Deep volcanic (A-type) | Shallow volcanic (B-type) | Small explosion | Tectonic |
| 06 Mar-12 Mar 2001 | -- | 3 | 5 | 14 |
| 12 Mar-18 Mar 2001 | 4 | 3 | 3 | 2 |
| 19 Mar-23 Mar 2001 | -- | 1 | -- | 10 |
| 27 Mar-01 Apr 2001 | -- | -- | 8 | 7 |
| 02 Apr-09 Apr 2001 | 1 | 2 | 5 | 10 |
| 09 Apr-15 Apr 2001 | 2 | -- | 2 | 17 |
| 16 Apr-23 Apr 2001 | -- | 1 | 2 | 10 |
Information Contacts: Dali Ahmad, Volcanological Survey of Indonesia (VSI), Jalan Diponegoro No. 57, Bandung 40122, Indonesia (URL: http://www.vsi.esdm.go.id/).
September 2009 seismic increase after over 8 years of quiet
The Center of Volcanology and Geological Hazard Mitigation (CVGHM) reported that seismicity at Batur (figure 3) increased from September 2009 to 7 November 2009, and the number of earthquakes increased significantly on 8 November (table 3). During this period, sulfurous plumes were ejected from the craters. The Alert Level was raised to 2 (on a scale of 1-4). This seismic activity was the first noted at Batur since 2001, when a series of mild earthquakes occurred (BGVN 26:09).
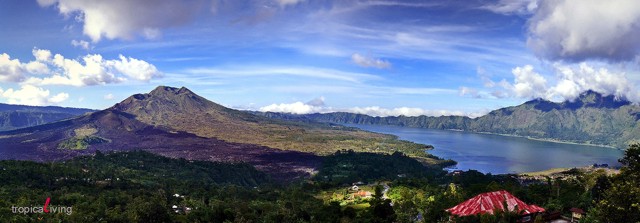 |
Figure 3. Panorama of Batur caldera showing the ~ 7-km-long lake in the SE part of the caldera along with the cental topographic high composed of intracaldera cones. Copyrighted photo courtesy of "tropicaLiving" taken on 9 April 2008. |
Table 3. Number of different types of earthquakes registered at Batur between September 2009 and 8 November 2009. *Through 1830 local time on 8 November. Data from CVGHM.
| Date | Deep volcanic | Shallow volcanic | Low-frequency |
| Sep 2009 | 21 | 11 | 13 |
| Oct 2009 | 28 | 20 | 15 |
| 01 Nov-07 Nov 2009 | 12 | 7 | 7 |
| 88 Nov 2009* | 5 | 53 | -- |
Information Contacts: Center of Volcanology and Geological Hazard Mitigation (CVGHM), Jalan Diponegoro 57, Bandung 40122, Indonesia (URL: http://vsi.esdm.go.id/); tropicaLiving (URL: http://www.flickr.com/photos/tropicaliving/).
Thousands of dead fish floating in caldera lake during June 2011
Batur stratovolcano sits at the E end of the island of Bali amid nested calderas (figure 4) and rises 686 m above the surface of an intra-caldera lake of the same name (Sutawidjaja, 2009). The entire complex remained non-eruptive through at least mid-2011 as it has for at least a decade (since a moderate eruption in 1974 and a series of smaller eruptions in the 1990s ceasing in about 2000). Local authorities reported that, following some variable seismicity during 2009-2010, starting 19 June 2011 residents smelled sulfurous gas and saw many dead fish floating on the lake's surface. The kill took place in the volcano's caldera lake but in the absence of visible eruptive activity and without anomalous geophysical perturbations.
|
Figure 4. Physiographic map of the island of Bali highlighting Batur caldera. The topographic high in the N-central caldera is Batur stratovolcano (summit elevation, 1,717 m). The lake (not delineated) lies along the caldera's SE side. Taken from Sutawidjaja (2009). |
Our previous report on Batur (BGVN 34:11) had noted increased seismicity from September to 7 November 2009. Since that report, the Center of Volcanology and Geological Hazard Mitigation (CVGHM) has reported that seismicity from Batur decreased from 1 June to 17 November 2010 and fumarolic plumes rose from the crater. On 19 November the Alert level was lowered to Normal, or 1.
Investigation of thousands of dead fish. CVGHM scientists visited Lake Batur (figure 5) to learn more about the incident. They learned that residents of lakeside villages first observed lake water discoloration and acrid (like sulfur) odors on the morning of 19 June 2011. A greenish-white discoloration first emerged in spots, but these spots soon connected and spread. The residents had seen a slick on the water surface spread from the E-central lake shore towards the S (from Toya Bungkah to Buahan, figure 6). In conjunction with these changes in color, thousands of dead fish were found at the surface of the lake (figure 7).
|
Figure 5. Photo of Lake Batur with two farmers for scale. The tops of fish cages (kerambah) can be seen in the lake water. Note steep caldera wall in background. Photo taken from allvoices.com. (Photographer unknown and other details undisclosed.) |
|
Figure 6. Map showing location of Lake Batur, with the locations of the greenish-white water seen near the coast (shaded). The lake is 7.7 km in the long dimension and has a surface area of 16 km2. Courtesy of CVGHM. |
|
Figure 7. Photo of dead fish floating on the surface of Lake Batur associated with the fish kill of 2011. Thousands of fish died, many near the village of Toya Bungkah. Undated photo taken from indosurflife.com. |
The translated report contained this important passage. "According to information from a resident (Made Yuni, age 59), the change in color of the lake water, consisting of patches of whitish green, is a yearly event, although [typically] small in scale and not causing the death of fish. The change in color of the lake water occurs during the change of seasons (i.e. the transition), between the wet and dry parts of the year when there is a stiff wind from the S. The incident of the lake water changing color and the death of the fish on 19 June 2011 occurred about two weeks into the dry season. The death of fish in Batur on the present scale happened before, in 1995."
Scientists conducted an examination during 21-22 June 2011. They also had pre-event temperature and pH for multiple sites on the lake going back at least several months. At the time of the visit, all residual odors had dispersed. Results of ambient gas measurements showed no traces of anomalous carbon monoxide, carbon dioxide, methane, or hydrogen sulfide. The lake temperature was found to be 15°C, which is considered normal. pH levels in the lake were found to be constant with other measurements taken in normal times as well. No increase in volcanic earthquakes were reported before or after the fish kill (the pattern of earthquakes was constant at typical background, 1 event/day). The colors seen were attributed to both warm water welling up (springs at Toya Bungkah) but also at places where such springs are absent.
On 20 June the water by the village of Seked returned to its normal color. Late in 21 June the water by the other villages involved returned to its normal color. Scientists found neither dead weeds or algae nor gas bubbles associated with the fish kill.
Scientists from CVGHM found no evidence to conclude the fish kill was volcanically triggered nor did they mention it portending eruptive activity. Rather, the scientists noted the comparatively high diurnal-temperature difference during the onset of the dry season. As a result of these temperature differences, the lake water developed currents, which carried mud from the lake bottom to the surface. This was thought to correspond to the observed odors ('muddy smells') and color changes on the lake surface. In a broad sense, the currents and mud were thought to upset the lake's ecological balance in a manner toxic to the fish.
Residents were advised to not consume dead fish from the incident, but fish that had survived were still considered fit for human consumption. Many inhabitants around Lake Batur are fisherman by trade and it is estimated that the fish kill resulted in losses up to billions of Rupiah (1 billion Rupiah currently equivalent to ~120,000 US Dollars). The water of Lake Batur is also irrigated into surrounding farms. There is no official documentation on whether or not the recent events at Lake Batur have affected the neighboring agriculture.
Reference. Sutawidjaja, I.S., 2009, Ignimbrite Analyses of Batur Caldera, Bali, based on 14C dating, Jurnal Geologi Indonesia, Vol. 4 No. 3, September 2009: 189-202 [http://www.bgl.esdm.go.id/dmdocuments/jurnal20090304.pdf].
Information Contacts: Center of Volcanology and Geological Hazard Mitigation (CVGHM), Jalan Diponegoro 57, Bandung 40122, Indonesia (URL: http://www.vsi.esdm.go.id/); Bali Discovery Tours, Komplek Pertokoan Sanur Raya No. 27 Jl. By Pass Ngurah Rai,Sanur, Bali, Indonesia (URL: http://www.balidiscovery.com)
|
|
||||||||||||||||||||||||||
There is data available for 25 confirmed eruptive periods.
1999 Mar 15 - 2000 Jun 16 (?) ± 15 days Confirmed Eruption (Explosive / Effusive) VEI: 1
| Episode 1 | Eruption (Explosive / Effusive) | |||||||||||||||||||||||||||||||||||||||
|---|---|---|---|---|---|---|---|---|---|---|---|---|---|---|---|---|---|---|---|---|---|---|---|---|---|---|---|---|---|---|---|---|---|---|---|---|---|---|---|
| 1999 Mar 15 - 2000 Jun 16 (?) ± 15 days | Evidence from Observations: Reported | ||||||||||||||||||||||||||||||||||||||
|
List of 6 Events for Episode 1
|
|||||||||||||||||||||||||||||||||||||||
1998 Jul 4 ± 3 days Confirmed Eruption (Explosive / Effusive) VEI: 1
| Episode 1 | Eruption (Explosive / Effusive) | ||||||||||||||||||||||||
|---|---|---|---|---|---|---|---|---|---|---|---|---|---|---|---|---|---|---|---|---|---|---|---|---|
| 1998 Jul 4 ± 3 days - Unknown | Evidence from Observations: Reported | |||||||||||||||||||||||
|
List of 3 Events for Episode 1
|
||||||||||||||||||||||||
1994 Aug 7 - 1994 Aug 14 (on or after) Confirmed Eruption (Explosive / Effusive) VEI: 1
| Episode 1 | Eruption (Explosive / Effusive) | Batur III | |||||||||||||||||||||||||||||||||
|---|---|---|---|---|---|---|---|---|---|---|---|---|---|---|---|---|---|---|---|---|---|---|---|---|---|---|---|---|---|---|---|---|---|---|
| 1994 Aug 7 - 1994 Aug 14 (on or after) | Evidence from Observations: Reported | |||||||||||||||||||||||||||||||||
|
List of 5 Events for Episode 1 at Batur III
|
||||||||||||||||||||||||||||||||||
[ 1976 Mar 26 - 1976 Mar 26 ] Uncertain Eruption
| Episode 1 | Eruption (Explosive / Effusive) | |||||||||||||||||||
|---|---|---|---|---|---|---|---|---|---|---|---|---|---|---|---|---|---|---|---|
| 1976 Mar 26 - 1976 Mar 26 | Evidence from Unknown | ||||||||||||||||||
|
List of 2 Events for Episode 1
|
|||||||||||||||||||
1974 Mar 12 - 1974 Apr 16 ± 15 days Confirmed Eruption (Explosive / Effusive) VEI: 2
| Episode 1 | Eruption (Explosive / Effusive) | Batur III | |||||||||||||||||||||||
|---|---|---|---|---|---|---|---|---|---|---|---|---|---|---|---|---|---|---|---|---|---|---|---|---|
| 1974 Mar 12 - 1974 Apr 16 ± 15 days | Evidence from Observations: Reported | |||||||||||||||||||||||
|
List of 3 Events for Episode 1 at Batur III
|
||||||||||||||||||||||||
[ 1973 Mar 30 ± 90 days ] Uncertain Eruption
| Episode 1 | Eruption (Explosive / Effusive) | ||||
|---|---|---|---|---|
| 1973 Mar 30 ± 90 days - Unknown | Evidence from Observations: Reported | |||
1972 Jan 19 - 1972 Mar 16 ± 15 days Confirmed Eruption (Explosive / Effusive) VEI: 2
| Episode 1 | Eruption (Explosive / Effusive) | Batur III | |||||||||||||||||||||||
|---|---|---|---|---|---|---|---|---|---|---|---|---|---|---|---|---|---|---|---|---|---|---|---|---|
| 1972 Jan 19 - 1972 Mar 16 ± 15 days | Evidence from Observations: Reported | |||||||||||||||||||||||
|
List of 3 Events for Episode 1 at Batur III
|
||||||||||||||||||||||||
1971 Mar 11 - 1971 Aug 25 (on or after) Confirmed Eruption (Explosive / Effusive) VEI: 1
| Episode 1 | Eruption (Explosive / Effusive) | |||||||||||||||||||||||||||||
|---|---|---|---|---|---|---|---|---|---|---|---|---|---|---|---|---|---|---|---|---|---|---|---|---|---|---|---|---|---|
| 1971 Mar 11 - 1971 Aug 25 (on or after) | Evidence from Observations: Reported | ||||||||||||||||||||||||||||
|
List of 4 Events for Episode 1
|
|||||||||||||||||||||||||||||
1970 Jan 5 ± 4 days - 1970 Jan 15 Confirmed Eruption (Explosive / Effusive) VEI: 1
| Episode 1 | Eruption (Explosive / Effusive) | SW flank (1963 vent) | ||||||||||||||||||||||||||||
|---|---|---|---|---|---|---|---|---|---|---|---|---|---|---|---|---|---|---|---|---|---|---|---|---|---|---|---|---|---|
| 1970 Jan 5 ± 4 days - 1970 Jan 15 | Evidence from Observations: Reported | ||||||||||||||||||||||||||||
|
List of 4 Events for Episode 1 at SW flank (1963 vent)
|
|||||||||||||||||||||||||||||
1968 Jan 23 - 1968 Feb 15 Confirmed Eruption (Explosive / Effusive) VEI: 2
| Episode 1 | Eruption (Explosive / Effusive) | SW flank (Batur III) | |||||||||||||||||||||||||||||||||
|---|---|---|---|---|---|---|---|---|---|---|---|---|---|---|---|---|---|---|---|---|---|---|---|---|---|---|---|---|---|---|---|---|---|---|
| 1968 Jan 23 - 1968 Feb 15 | Evidence from Observations: Reported | |||||||||||||||||||||||||||||||||
|
List of 5 Events for Episode 1 at SW flank (Batur III)
|
||||||||||||||||||||||||||||||||||
1966 Apr 28 Confirmed Eruption (Explosive / Effusive) VEI: 1
| Episode 1 | Eruption (Explosive / Effusive) | SW flank (west of 1965 vent) | ||||||||||||||||||||||||||||
|---|---|---|---|---|---|---|---|---|---|---|---|---|---|---|---|---|---|---|---|---|---|---|---|---|---|---|---|---|---|
| 1966 Apr 28 - Unknown | Evidence from Observations: Reported | ||||||||||||||||||||||||||||
|
List of 4 Events for Episode 1 at SW flank (west of 1965 vent)
|
|||||||||||||||||||||||||||||
1965 Aug 18 - 1965 Dec 16 ± 15 days Confirmed Eruption (Explosive / Effusive) VEI: 1
| Episode 1 | Eruption (Explosive / Effusive) | SW flank (near Batur III) | |||||||||||||||||||||||||||||||||
|---|---|---|---|---|---|---|---|---|---|---|---|---|---|---|---|---|---|---|---|---|---|---|---|---|---|---|---|---|---|---|---|---|---|---|
| 1965 Aug 18 - 1965 Dec 16 ± 15 days | Evidence from Observations: Reported | |||||||||||||||||||||||||||||||||
|
List of 5 Events for Episode 1 at SW flank (near Batur III)
|
||||||||||||||||||||||||||||||||||
1963 Sep 5 - 1964 May 10 Confirmed Eruption (Explosive / Effusive) VEI: 2
| Episode 1 | Eruption (Explosive / Effusive) | SW, W flanks (near Batur III, Butus) | |||||||||||||||||||||||||||||||||||||||||||||||||||||||||||||||
|---|---|---|---|---|---|---|---|---|---|---|---|---|---|---|---|---|---|---|---|---|---|---|---|---|---|---|---|---|---|---|---|---|---|---|---|---|---|---|---|---|---|---|---|---|---|---|---|---|---|---|---|---|---|---|---|---|---|---|---|---|---|---|---|---|
| 1963 Sep 5 - 1964 May 10 | Evidence from Observations: Reported | |||||||||||||||||||||||||||||||||||||||||||||||||||||||||||||||
|
List of 11 Events for Episode 1 at SW, W flanks (near Batur III, Butus)
|
||||||||||||||||||||||||||||||||||||||||||||||||||||||||||||||||
1926 Aug 2 - 1926 Sep 21 Confirmed Eruption (Explosive / Effusive) VEI: 2
| Episode 1 | Eruption (Explosive / Effusive) | SW flank below Batur III | |||||||||||||||||||||||||||||||||||||||||||||||||||||
|---|---|---|---|---|---|---|---|---|---|---|---|---|---|---|---|---|---|---|---|---|---|---|---|---|---|---|---|---|---|---|---|---|---|---|---|---|---|---|---|---|---|---|---|---|---|---|---|---|---|---|---|---|---|---|
| 1926 Aug 2 - 1926 Sep 21 | Evidence from Observations: Reported | |||||||||||||||||||||||||||||||||||||||||||||||||||||
|
List of 9 Events for Episode 1 at SW flank below Batur III
|
||||||||||||||||||||||||||||||||||||||||||||||||||||||
1925 Jan 5 ± 4 days - 1925 Jan 5 ± 4 days Confirmed Eruption (Explosive / Effusive) VEI: 2
| Episode 1 | Eruption (Explosive / Effusive) | Batur II | |||||||||||||||||||||||
|---|---|---|---|---|---|---|---|---|---|---|---|---|---|---|---|---|---|---|---|---|---|---|---|---|
| 1925 Jan 5 ± 4 days - 1925 Jan 5 ± 4 days | Evidence from Observations: Reported | |||||||||||||||||||||||
|
List of 3 Events for Episode 1 at Batur II
|
||||||||||||||||||||||||
1924 Mar - 1924 Mar (?) Confirmed Eruption (Explosive / Effusive) VEI: 2
| Episode 1 | Eruption (Explosive / Effusive) | Batur II | ||||||||||||||||||||||||||||
|---|---|---|---|---|---|---|---|---|---|---|---|---|---|---|---|---|---|---|---|---|---|---|---|---|---|---|---|---|---|
| 1924 Mar - 1924 Mar (?) | Evidence from Observations: Reported | ||||||||||||||||||||||||||||
|
List of 4 Events for Episode 1 at Batur II
|
|||||||||||||||||||||||||||||
1923 Confirmed Eruption (Explosive / Effusive) VEI: 2
| Episode 1 | Eruption (Explosive / Effusive) | Batur II | ||||||||||||||||||||||||||||
|---|---|---|---|---|---|---|---|---|---|---|---|---|---|---|---|---|---|---|---|---|---|---|---|---|---|---|---|---|---|
| 1923 - Unknown | Evidence from Observations: Reported | ||||||||||||||||||||||||||||
|
List of 4 Events for Episode 1 at Batur II
|
|||||||||||||||||||||||||||||
1922 Aug 30 Confirmed Eruption (Explosive / Effusive) VEI: 2
| Episode 1 | Eruption (Explosive / Effusive) | |||||||||||||||||||
|---|---|---|---|---|---|---|---|---|---|---|---|---|---|---|---|---|---|---|---|
| 1922 Aug 30 - Unknown | Evidence from Observations: Reported | ||||||||||||||||||
|
List of 2 Events for Episode 1
|
|||||||||||||||||||
1921 Jan 29 - 1921 Apr 17 Confirmed Eruption (Explosive / Effusive) VEI: 2
| Episode 1 | Eruption (Explosive / Effusive) | SW flank (Batur II) | |||||||||||||||||||||||
|---|---|---|---|---|---|---|---|---|---|---|---|---|---|---|---|---|---|---|---|---|---|---|---|---|
| 1921 Jan 29 - 1921 Apr 17 | Evidence from Observations: Reported | |||||||||||||||||||||||
|
List of 3 Events for Episode 1 at SW flank (Batur II)
|
||||||||||||||||||||||||
1905 Confirmed Eruption (Explosive / Effusive) VEI: 2
| Episode 1 | Eruption (Explosive / Effusive) | Batur I, Batur II, Batur III | ||||||||||||||||||||||||||||
|---|---|---|---|---|---|---|---|---|---|---|---|---|---|---|---|---|---|---|---|---|---|---|---|---|---|---|---|---|---|
| 1905 - Unknown | Evidence from Observations: Reported | ||||||||||||||||||||||||||||
|
List of 4 Events for Episode 1 at Batur I, Batur II, Batur III
|
|||||||||||||||||||||||||||||
1904 Confirmed Eruption (Explosive / Effusive) VEI: 2
| Episode 1 | Eruption (Explosive / Effusive) | West caldera floor (Gunung Anti) | ||||||||||||||||||||||||||||
|---|---|---|---|---|---|---|---|---|---|---|---|---|---|---|---|---|---|---|---|---|---|---|---|---|---|---|---|---|---|
| 1904 - Unknown | Evidence from Observations: Reported | ||||||||||||||||||||||||||||
|
List of 4 Events for Episode 1 at West caldera floor (Gunung Anti)
|
|||||||||||||||||||||||||||||
1897 Confirmed Eruption (Explosive / Effusive) VEI: 2
| Episode 1 | Eruption (Explosive / Effusive) | Batur I | ||||||||||||||||||
|---|---|---|---|---|---|---|---|---|---|---|---|---|---|---|---|---|---|---|---|
| 1897 - Unknown | Evidence from Observations: Reported | ||||||||||||||||||
|
List of 2 Events for Episode 1 at Batur I
|
|||||||||||||||||||
1888 May 30 - 1888 May 31 Confirmed Eruption (Explosive / Effusive) VEI: 2
| Episode 1 | Eruption (Explosive / Effusive) | SE flank of Batur I | ||||||||||||||||||||||||||||
|---|---|---|---|---|---|---|---|---|---|---|---|---|---|---|---|---|---|---|---|---|---|---|---|---|---|---|---|---|---|
| 1888 May 30 - 1888 May 31 | Evidence from Observations: Reported | ||||||||||||||||||||||||||||
|
List of 4 Events for Episode 1 at SE flank of Batur I
|
|||||||||||||||||||||||||||||
1854 Apr 28 Confirmed Eruption (Explosive / Effusive) VEI: 1 (?)
| Episode 1 | Eruption (Explosive / Effusive) | Batur I | ||||||||||||||||||
|---|---|---|---|---|---|---|---|---|---|---|---|---|---|---|---|---|---|---|---|
| 1854 Apr 28 - Unknown | Evidence from Observations: Reported | ||||||||||||||||||
|
List of 2 Events for Episode 1 at Batur I
|
|||||||||||||||||||
1849 Confirmed Eruption (Explosive / Effusive) VEI: 2
| Episode 1 | Eruption (Explosive / Effusive) | ||||||||||||||||||||||||
|---|---|---|---|---|---|---|---|---|---|---|---|---|---|---|---|---|---|---|---|---|---|---|---|---|
| 1849 - Unknown | Evidence from Observations: Reported | |||||||||||||||||||||||
|
List of 3 Events for Episode 1
|
||||||||||||||||||||||||
[ 1847 ] Uncertain Eruption
| Episode 1 | Eruption (Explosive / Effusive) | ||||
|---|---|---|---|---|
| 1847 - Unknown | Evidence from Unknown | |||
1821 Mar 16 Confirmed Eruption (Explosive / Effusive) VEI: 2
| Episode 1 | Eruption (Explosive / Effusive) | Batur I | ||||||||||||||||||
|---|---|---|---|---|---|---|---|---|---|---|---|---|---|---|---|---|---|---|---|
| 1821 Mar 16 - Unknown | Evidence from Observations: Reported | ||||||||||||||||||
|
List of 2 Events for Episode 1 at Batur I
|
|||||||||||||||||||
1804 Confirmed Eruption (Explosive / Effusive) VEI: 2
| Episode 1 | Eruption (Explosive / Effusive) | Batur I | ||||||||||||||||||
|---|---|---|---|---|---|---|---|---|---|---|---|---|---|---|---|---|---|---|---|
| 1804 - Unknown | Evidence from Observations: Reported | ||||||||||||||||||
|
List of 2 Events for Episode 1 at Batur I
|
|||||||||||||||||||
This compilation of synonyms and subsidiary features may not be comprehensive. Features are organized into four major categories: Cones, Craters, Domes, and Thermal Features. Synonyms of features appear indented below the primary name. In some cases additional feature type, elevation, or location details are provided.
Synonyms |
||||
| Batoer | Bator | Molengraaff Caldera | ||||
Cones |
||||
| Feature Name | Feature Type | Elevation | Latitude | Longitude |
| Abang, Gunung | Stratovolcano | 2152 m | ||
| Anti, Gunung | Cone | 1146 m | ||
| Bongkok, Bukit | Cone | 1176 m | ||
| Bunder
Boender |
Cone | 1250 m | ||
| Butus, Gunung | Cone | |||
| Paleg | Cone | |||
| Pandan, Gunung | Cone | 1140 m | ||
| Puraknja, Bukit
Poeraknja, Bukit |
Cone | 1156 m | ||
| Srongga, Bukit | Cone | 1186 m | ||
Craters |
||||
| Feature Name | Feature Type | Elevation | Latitude | Longitude |
| Bunbulan | Crater | |||
| Catu
Tjatoe |
Crater | 1238 m | ||
| Goeha Songgadikit | Crater | 1157 m | ||
| Payang
Pajang |
Crater | |||
| Purakkanginan | Crater | |||
| Purakkauhan | Crater | |||
| Sampeanwani | Maar | 1165 m | ||
| Tamansari Group | Crater | 1179 m | ||
Domes |
||||
| Feature Name | Feature Type | Elevation | Latitude | Longitude |
| Bunbulan, Gunung | Dome | |||
| Songan | Dome | |||
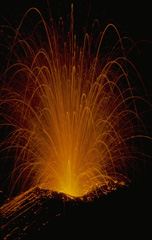 Strombolian explosions produce incandescent ejecta during an eruption of Batur volcano on Bali on August 20, 1971. Exposive eruptions took place from March 11 until August. Incandescent bombs were ejected to 100 m above the vent, and the maximum height of the ash column was 300 m.
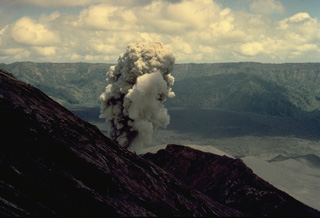 A small ash-bearing eruption column rises from a vent just below the summit of Batur volcano on Bali on August 11, 1971. Batur's outer caldera wall forms the ridge in the background. The maximum height of the ash column during the minor 1971 eruption was 300 m.
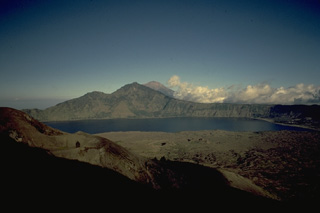 The SE wall of Batur's 10 x 13 km outer caldera rises above the caldera lake, as seen from Batur volcano, which grew within a 7.5-km-wide, inner caldera. Lava flows from 19th century eruptions of Batur volcano, on the island of Bali, form the lake's near shoreline, which is near the margin of the buried eastern rim of the inner caldera. Agung volcano, at the eastern tip of Bali, is visible in the distance.
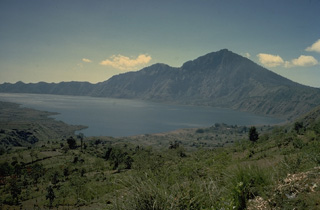 Gunung Abang forms the 2152-m high point along the eastern wall of Batur's outer caldera. The boundary of an inner caldera, within which Batur volcano (out of view to the left) was constructed, is obscured on its SE side beneath the surface of the caldera lake. Lava flows from Batur volcano extent into the lake at the left.
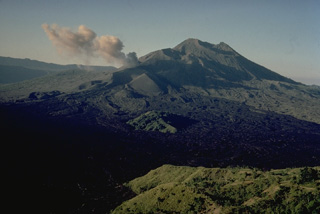 The small 1717-m stratovolcano Batur on the island of Bali was constructed within the inner of two nested calderas. The outer 10 x 13 km caldera contains a crater lake; the inner 7.5-km-wide caldera was formed about 23,670 years ago. Historical eruptions have produced minor explosive activity and lava flows primarily from vents along a NE-SW-trending line. Several historical lava flows have reached the southern caldera wall in the foreground.
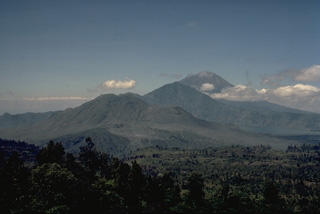 This view from the NW rim of the massive 10 x 13 km outer caldera of Batur volcano looks across the caldera to Gunung Abang (center) on the SE caldera rim. Lake Batur (right) banks against the SE wall of the outer caldera and overlies the rim of the 7.5-km-wide inner caldera. Historically active Gunung Batur stratovolcano (left-center) was constructed along a NE-SW-trending line in the center of the inner caldera of Batur volcano. The large stratovolcano in the distance is Gunung Agung, Bali's highest volcano.
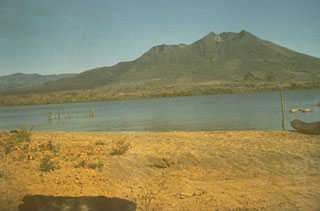 The Batur cone on the island of Bali was constructed as a result of eruptions along a NE-SW-trending line of vents. It is located within a 7.5-km-wide inner caldera with its SE margin below a lake that fills part of the SE floor of an outer 10 x 13 km caldera. Historical lava flows have formed much of the far lake shore in this view.
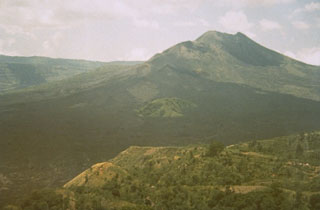 Most of the extensive dark lava flows in the foreground were erupted during 1963-64 from vents near the Batur III cone on the lower SW flank of Batur stratovolcano, viewed here from the village of Penelokan on the southern rim of Batur's outer caldera. The lava flows reached the 7.5-km-wide inner caldera floor and destroyed 16 houses at Tamansari village. Activity has been concentrated along the NE-SW-trending chain of cones and craters.
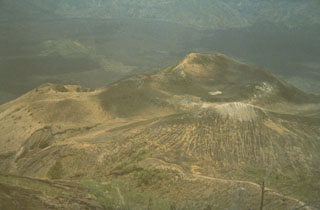 This is the Batur I summit crater of Batur volcano, a cone constructed within the 7.5-km-wide Batur caldera. A chain of cones and craters was constructed along a NE-SW-trending line across the summit. Historical eruptions have occurred from Batur I, Batur II, Batur III, and other flank cones.
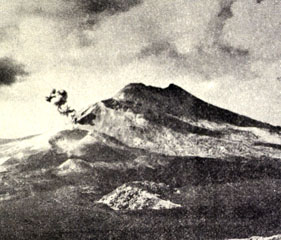 A small ash eruption from Batur III cone on the SW flank of Batur volcano was photographed from the southern rim of the caldera in 1972. An on 19 January produced strong explosions, continuous ashfall from 28 January to 12 February, and small ash plumes during March.
The following 3 samples associated with this volcano can be found in the Smithsonian's NMNH Department of Mineral Sciences collections, and may be availble for research (contact the Rock and Ore Collections Manager). Catalog number links will open a window with more information.
| Catalog Number | Sample Description | Lava Source | Collection Date |
|---|---|---|---|
| NMNH 117222-1 | Basaltic Andesite | -- | 1 Jan 1970 |
| NMNH 117455-15 | Obsidian | -- | -- |
| NMNH 117455-31 | Obsidian | -- | -- |
| Copernicus Browser | The Copernicus Browser replaced the Sentinel Hub Playground browser in 2023, to provide access to Earth observation archives from the Copernicus Data Space Ecosystem, the main distribution platform for data from the EU Copernicus missions. |
| MIROVA | Middle InfraRed Observation of Volcanic Activity (MIROVA) is a near real time volcanic hot-spot detection system based on the analysis of MODIS (Moderate Resolution Imaging Spectroradiometer) data. In particular, MIROVA uses the Middle InfraRed Radiation (MIR), measured over target volcanoes, in order to detect, locate and measure the heat radiation sourced from volcanic activity. |
| MODVOLC Thermal Alerts | Using infrared satellite Moderate Resolution Imaging Spectroradiometer (MODIS) data, scientists at the Hawai'i Institute of Geophysics and Planetology, University of Hawai'i, developed an automated system called MODVOLC to map thermal hot-spots in near real time. For each MODIS image, the algorithm automatically scans each 1 km pixel within it to check for high-temperature hot-spots. When one is found the date, time, location, and intensity are recorded. MODIS looks at every square km of the Earth every 48 hours, once during the day and once during the night, and the presence of two MODIS sensors in space allows at least four hot-spot observations every two days. Each day updated global maps are compiled to display the locations of all hot spots detected in the previous 24 hours. There is a drop-down list with volcano names which allow users to 'zoom-in' and examine the distribution of hot-spots at a variety of spatial scales. |
|
WOVOdat
Single Volcano View Temporal Evolution of Unrest Side by Side Volcanoes |
WOVOdat is a database of volcanic unrest; instrumentally and visually recorded changes in seismicity, ground deformation, gas emission, and other parameters from their normal baselines. It is sponsored by the World Organization of Volcano Observatories (WOVO) and presently hosted at the Earth Observatory of Singapore.
GVMID Data on Volcano Monitoring Infrastructure The Global Volcano Monitoring Infrastructure Database GVMID, is aimed at documenting and improving capabilities of volcano monitoring from the ground and space. GVMID should provide a snapshot and baseline view of the techniques and instrumentation that are in place at various volcanoes, which can be use by volcano observatories as reference to setup new monitoring system or improving networks at a specific volcano. These data will allow identification of what monitoring gaps exist, which can be then targeted by remote sensing infrastructure and future instrument deployments. |
| Volcanic Hazard Maps | The IAVCEI Commission on Volcanic Hazards and Risk has a Volcanic Hazard Maps database designed to serve as a resource for hazard mappers (or other interested parties) to explore how common issues in hazard map development have been addressed at different volcanoes, in different countries, for different hazards, and for different intended audiences. In addition to the comprehensive, searchable Volcanic Hazard Maps Database, this website contains information about diversity of volcanic hazard maps, illustrated using examples from the database. This site is for educational purposes related to volcanic hazard maps. Hazard maps found on this website should not be used for emergency purposes. For the most recent, official hazard map for a particular volcano, please seek out the proper institutional authorities on the matter. |
| IRIS seismic stations/networks | Incorporated Research Institutions for Seismology (IRIS) Data Services map showing the location of seismic stations from all available networks (permanent or temporary) within a radius of 0.18° (about 20 km at mid-latitudes) from the given location of Batur. Users can customize a variety of filters and options in the left panel. Note that if there are no stations are known the map will default to show the entire world with a "No data matched request" error notice. |
| UNAVCO GPS/GNSS stations | Geodetic Data Services map from UNAVCO showing the location of GPS/GNSS stations from all available networks (permanent or temporary) within a radius of 20 km from the given location of Batur. Users can customize the data search based on station or network names, location, and time window. Requires Adobe Flash Player. |
| DECADE Data | The DECADE portal, still in the developmental stage, serves as an example of the proposed interoperability between The Smithsonian Institution's Global Volcanism Program, the Mapping Gas Emissions (MaGa) Database, and the EarthChem Geochemical Portal. The Deep Earth Carbon Degassing (DECADE) initiative seeks to use new and established technologies to determine accurate global fluxes of volcanic CO2 to the atmosphere, but installing CO2 monitoring networks on 20 of the world's 150 most actively degassing volcanoes. The group uses related laboratory-based studies (direct gas sampling and analysis, melt inclusions) to provide new data for direct degassing of deep earth carbon to the atmosphere. |
| Large Eruptions of Batur | Information about large Quaternary eruptions (VEI >= 4) is cataloged in the Large Magnitude Explosive Volcanic Eruptions (LaMEVE) database of the Volcano Global Risk Identification and Analysis Project (VOGRIPA). |
| EarthChem | EarthChem develops and maintains databases, software, and services that support the preservation, discovery, access and analysis of geochemical data, and facilitate their integration with the broad array of other available earth science parameters. EarthChem is operated by a joint team of disciplinary scientists, data scientists, data managers and information technology developers who are part of the NSF-funded data facility Integrated Earth Data Applications (IEDA). IEDA is a collaborative effort of EarthChem and the Marine Geoscience Data System (MGDS). |

