
KVERT reported that activity at Gorely decreased significantly in December 2013; volcanic tremor ceased being detected on 12 December, and the temperature of the thermal anomaly decreased during 12-15 December. No thermal anomaly was detected in January 2014, but weak seismicity continued along with gas-and-steam emissions. On 23 January the Aviation Color Code was lowered to Green (on a four-color scale).
Source: Kamchatkan Volcanic Eruption Response Team (KVERT)
Seismicity above background in post-eruptive phase to July 2012
Our last Bulletin report summarized Kamchatka Volcanic Eruptions Response Team (KVERT) reports on eruptive activity at Gorely through 30 July 2010 (BGVN 35:07); MODVOLC was covered through 3 August 2010. In this report we note subsequent MODVOLC alerts for 10, 15, and 19 August 2010. KVERT reported that satellite-based thermal anomalies were detected on 10-12, 15, and 23 August 2010. During July and August 2011, reports noted red incandescence. This report covers activity through 6 July 2012. The Aviation Color Code remained at Yellow throughout the reporting period, indicating signs of elevated unrest above known background levels.
Our sampling of available KVERT data revealed that for the remainder of 2010, seismicity was above background levels, with continued recording of volcanic tremor. Weak or moderate gas-and-steam activity of the volcano was observed periodically; clouds obscured the volcano on the other days. According to satellite data analysis, a thermal anomaly was registered over the volcano periodically for the remainder of 2010; on 12-14 and 18 November 2010. On 12 November, a gas-steam plume extended about 40 km NE.
KVERT reported predominantly moderate seismicity, with continued recording of volcanic tremor through 2011. Periodic weak thermal anomaly over the volcano continued to be noted in satellite images. Moderate and strong gas-and-steam activity at the volcano was observed on 1-3, and 5 April. The lake in the active crater of the volcano disappeared (figure 7).
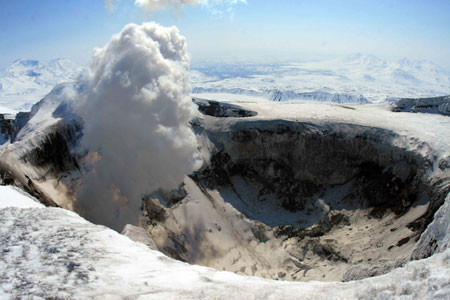 |
Figure 7. Moderate-to-strong gas-and-steam activity at Gorely on 24 April 2011. Photo courtesy of A. Nuzhdaev. IVS FEB RAS. |
According to satellite data on 5 May 2011, a weak thermal anomaly was registered over the volcano, and a gas-and-steam plume extended about 15 km W. During 11-12 June, according to visual data, a red incandescence was observed in the new fumarole vent within the active crater, and the lake remained absent. During 7-8 July, the incandescence continued. Moderate fumarolic activity was observed on 20 July. On 26 July, observers noted a new lake within the active crater, including blocks of ice on the lake's surface (figure 8). The new fumarole was covered with colluvium, but red incandescence was seen within the vent. During 6-9 August these blocks of ice on the lake's surface were melting.
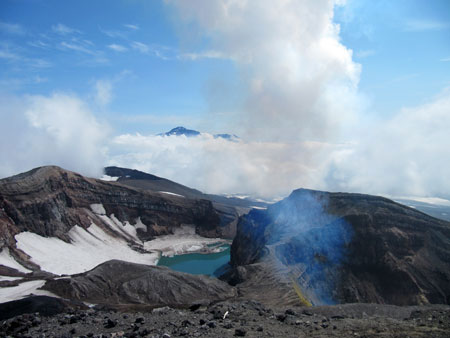 |
Figure 8. Photo at Gorely on 9 August 2011 shows a new lake within the active crater. Courtesy, Yu. Nazimova. |
Moderate seismic activity continued during the remainder of 2011, along with volcanic tremor. According to satellite data, thermal anomalies were registered on 26 and 29 August; 4-5 September; 5, 11-12, 21-25, and 31 October; 1-2, 5, 13, 24, 27-28 November; 2, 7, 20 December. Strong and moderate gas-and-steam activity was observed during 22-23 and 29 December. A large thermal anomaly was detected during 29-30 December 2011.
Seismic activity at Gorely increased in early January 2012 and continued to be elevated through February, but ceased being recorded after 5 February after a technical dysfunction. About 20-30 seismic events were registered within the volcanic edifice during 2-3 January. According to visual data, strong and moderate gas-and-steam activity was observed throughout January and February. Gas-and-steam activity became more moderate in March and continued at that level through the end of June.
Thermal anomalies were registered by satellite images during 1-2, 6-8, 17, 23, 28, and 31 January; 2, 4-5, 7, 11, and 19-21 February; 24 March; 10, 15, 17, 24, and 28 April; 2, 3, 10, 11-13, 15, 22 and 30 May; 21 and 29 June. Visual observations on 12 May revealed that the bottom of the active volcanic crater was covered by snow, but strong fumarolic emissions persisted (figure 9). A gas-and-steam plume was seen rising to 4 km (a.s.l.) During 16-17 June.
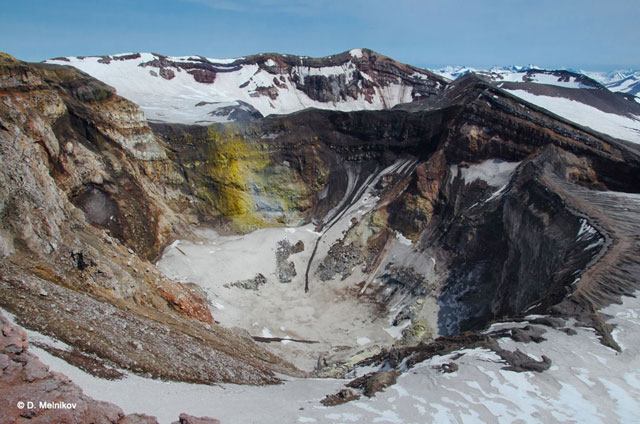 |
Figure 9. Bottom of active crater at Gorely on 12 May 2012, showing strong fumarolic emissions. Courtesy, D. Melnikov, IVS FED RAS. |
Between 28 June and 1 July 2012, seismicity was recorded at above background levels; continuous spasmodic tremor was detected on 28 and 30 June, and on 1 July 2012.
Information Contacts: Kamchatka Volcanic Eruptions Response Team (KVERT), Far East Division, Russian Academy of Sciences, 9 Piip Blvd., Petropavlovsk-Kamchatsky, 683006, Russia (URL: http://www.kscnet.ru/ivs/); Sergey Senukov, Kamchatka Branch of the Geophysical Service of the Russian Academy of Sciences (KB GS RAS), Russia (URL: http://www.emsd.ru/); Alexander Ovsyannikov, Sergei Chirkov, and Anatolii Mushinsky, IV&S FED RAS; and Hawai'i Institute of Geophysics and Planetology (HIGP) Thermal Alerts System, School of Ocean and Earth Science and Technology (SOEST), Univ. of Hawai'i, 2525 Correa Rd, Honolulu, HI 96822, USA (URL: http://modis.higp.hawaii.edu/).
2014: January
2011: October
2010: June
| July
| October
| November
2009: March
2008: January
| June
2002: October
KVERT reported that activity at Gorely decreased significantly in December 2013; volcanic tremor ceased being detected on 12 December, and the temperature of the thermal anomaly decreased during 12-15 December. No thermal anomaly was detected in January 2014, but weak seismicity continued along with gas-and-steam emissions. On 23 January the Aviation Color Code was lowered to Green (on a four-color scale).
Source: Kamchatkan Volcanic Eruption Response Team (KVERT)
KVERT reported that during 21-28 November seismic activity from Gorely was at moderate levels and volcanic tremor was detected. Satellite imagery showed a weak thermal anomaly over the volcano during 21-25 November. The Aviation Color Code level remained at Yellow.
Source: Kamchatkan Volcanic Eruption Response Team (KVERT)
KVERT reported that during 12-19 November seismic activity from Gorely was above background levels and volcanic tremor continued to be detected. Gas-and-steam emissions were observed during 12-14 and 16-18 November. Clouds obscured the volcano on the other days. Satellite imagery showed a gas-and-steam plume drifting 40 km NE on 12 November and a weak thermal anomaly over the volcano during 12-14 and 18 November. The Aviation Color Code level remained at Yellow.
Source: Kamchatkan Volcanic Eruption Response Team (KVERT)
KVERT reported that during 8-15 October seismic activity from Gorely was above background levels and volcanic tremor continued to be detected. A thermal anomaly on the volcano was seen in satellite imagery on 10 and 13 October. Gas-and-steam activity was noted during 10 and 13-15 October. The Aviation Color Code level remained at Yellow.
Source: Kamchatkan Volcanic Eruption Response Team (KVERT)
KVERT reported that during 23-30 July seismic activity from Gorely was above background levels and volcanic tremor continued to be detected. A daily thermal anomaly on the volcano was seen in satellite imagery. Gas-and-steam activity was noted during 26-27 July. The Aviation Color Code level remained at Yellow.
Source: Kamchatkan Volcanic Eruption Response Team (KVERT)
KVERT reported that during 16-23 July seismic activity from Gorely was above background levels and volcanic tremor continued to be detected. Gas-and-steam activity was noted daily and many new small fumarolic vents were seen in the active crater. The temperature of a daily thermal anomaly detected over the volcano in satellite imagery gradually increased from 29 to 46 degrees Celsius during 17-21 July. The Aviation Color Code level remained at Yellow.
Source: Kamchatkan Volcanic Eruption Response Team (KVERT)
KVERT reported that during 9-16 July seismic activity from Gorely was above background levels, and gas-and-steam emissions rose from the crater most days. On 10 July, data suggested that the vent on the crater's inner NE wall, above the level of the lake, had grown by 2-3 times the original size. The lake level had also fallen. Analysis of satellite imagery showed a thermal anomaly over Gorely on 8, 10, 12, and 14 July, and gas-and-steam plumes that drifted 25-150 km SE, E, and S during 10 and 14-15 July. The Level of Aviation Color Code remained at Yellow.
Source: Kamchatkan Volcanic Eruption Response Team (KVERT)
KVERT reported that during 24 June-2 July seismic activity from Gorely was above background levels, further increasing on 28 and 29 June. Analysis of satellite imagery showed a thermal anomaly over Gorely during 24-28 June; cloud cover prevented observations on other days. A gas-and-steam plume drifted 35 km S on 28 June. The Level of Aviation Color Code was raised to Yellow.
Sources: Kamchatkan Volcanic Eruption Response Team (KVERT); Tokyo Volcanic Ash Advisory Center (VAAC)
KVERT reported that during 17-25 June seismic activity from Gorely was above background levels, and gas-and-steam plumes rose from the crater. A volcanologist working at Gorely on 17 June saw that a new vent had opened on the crater's inner NE wall, above the level of the lake. The vent opening was incandescent, and gas was emitted at temperatures of 800-900 degrees Celsius. Analysis of satellite imagery showed a thermal anomaly over Gorely during 17-18 and 21-23 June; cloud cover prevented observations on other days. The Level of Aviation Color Code was raised to Yellow.
Source: Kamchatkan Volcanic Eruption Response Team (KVERT)
KVERT reported that during 6 and 12-13 June strong steam-and-gas activity from Gorely was noted, and during 11-18 June seismic activity was above background levels. A small increase in the size and temperature of a thermal anomaly over the volcano began on 15 June and was detected through 18 June. The Level of Aviation Color Code remained at Green.
Source: Kamchatkan Volcanic Eruption Response Team (KVERT)
KVERT reported that seismic activity from Gorely increased during 10-27 March. The Level of Concern Color Code was raised to Yellow.
Source: Kamchatkan Volcanic Eruption Response Team (KVERT)
KVERT reported that seismic activity in the area of Gorely and Mutnovsky volcanoes decreased during 15-18 June. Moderate fumarolic activity was observed on 17 June; no activity was noted or cloud cover obscured views the other days during 14-20 June. The level of Concern Color Code was lowered to Green on 20 June.
Source: Kamchatkan Volcanic Eruption Response Team (KVERT)
KVERT reported that seismic activity in the area of Gorely and Mutnovsky volcanoes increased on 13 June. There is only one seismic station in the area of the two volcanoes, so the source of the seismicity could not be determined. Activity was not visually noted and satellite imagery was not available at the time of the seismicity increase. The level of Concern Color Code was raised to Yellow on 14 June.
Source: Kamchatkan Volcanic Eruption Response Team (KVERT)
KVERT reported on 11 January that seismic activity in the area of Gorely and Mutnovsky volcanoes was slightly elevated above background levels during the previous three weeks, but increasing activity was not confirmed. There is only one seismic station in the area of the two volcanoes so the source of the seismicity cannot be determined. Activity was not observed on satellite imagery. The level of Concern Color Code was lowered to Green.
Source: Kamchatkan Volcanic Eruption Response Team (KVERT)
KVERT reported that an increased level of volcanic activity has not occurred at Gorely recently, as news articles had indicated. The Concern Color Code at Gorely remained at Green.
Source: Kamchatkan Volcanic Eruption Response Team (KVERT)
According to a Pravda news article, the Laboratory of Active Volcanism at the Institute of Volcanology reported that a seismic station located atop Gorely registered continuous tremor that was four times stronger than background tremor. In addition, "smoke" and steam rose 300 m above the volcano. Another report from the Kamchatkan Experimental-Methodical Seismological Department, which operates the seismic station, stated that the station is in the vicinity of both Gorely and Mutnovsky, therefore it is difficult to attribute the tremor to a specific volcano. They found that during 2-3 October a swarm of about 30 M 1.2-1.7 earthquakes was recorded, and on 26 October there were two M 1.7 earthquakes.
Sources: Kamchatkan Experimental and Methodical Seismological Department; Pravda News
Reports are organized chronologically and indexed below by Month/Year (Publication Volume:Number), and include a one-line summary. Click on the index link or scroll down to read the reports.
Explosions and crater glow
During 1978-79 large fumaroles appeared in the central crater and a lake was formed on the crater floor. In January 1980 a 1-km-high gas column was first observed over the summit. This remained throughout the spring, and gas vents appeared on the walls and floor of the crater.
In June intensive gas emission was accompanied by explosions that ejected lithic material. During this presumed phreatic eruption the crater lake disappeared. As of late July, activity was increasing and a glow was visible over the crater at night.
Further References. Gavrilov, V.A., Gordeev, E.I., and others, 1984, Volcanic tremor and the Gorely volcano earthquakes during the 1980-1981 eruption: Volcanology and Seismology, no. 6, p. 3-17.
Kirsanov, I.T., 1981, Eruption of the Gorely volcano in summer 1980: Volcanology and Seismology, no. 1, p. 70-73.
Information Contacts: E. Vakin and I. Kirsanov, IVP.
Ash explosions
Gorely began to erupt 27 December. During the initial activity, phreatic explosions ejected clouds that rose to 3.5 km height. Ash explosions began 30 December, producing plumes that reached 3 km height and extended 100 km E. The eruption ended 8 January. In the previous eruption, June 1980-July 1981, initial phreatic activity gave way in later phases to phreatomagmatic explosions that ejected alkali-rich basaltic andesite (Kirsanov and Ozerov, 1984).
Reference. Kirsanov, I.T., and Ozerov, A.Yu., 1984, Composition of products and energy yield of the 1980-81 Gorelyi volcano eruption: Volcanology and Seismology, no. 5, p. 23-43.
Further Reference. Gavrilov, and others, 1986, Intensification of Goreli volcanic activity in August-September 1984: Volcanology and Seismology, no. 5, p. 90-92.
Information Contacts: Tass.
Steam and ash emissions
The eruption that began in late 1984 continued into 1986, when steam and ash emissions were observed in April.
Reference. Budnikov, V.A., 1988, The eruption of Gorelyi volcano in April 1986: Volcanology and Seismology, no. 4, p. 99-103 (in Russian); v. 10, p. 650-658 (in English).
Information Contacts:
Seismic activity increases with over 20 earthquakes recorded on 19 September
On 19 September seismic activity increased and more than 20 earthquakes (M <= 1.8) were recorded beneath Gorely. However, no sign of eruptive activity was observed around the crater on 20 September. During 23-30 September seismicity returned to background levels.
Information Contacts: Tom Miller, Alaska Volcano Observatory (AVO), 4200 University Drive, Anchorage, AK 99508-4667, USA; Vladimir Kirianov, Kamchatka Volcanic Eruptions Response Team (KVERT), Institute of Volcanic Geology and Geochemistry, Piip Ave. 9, Petropavlovsk-Kamchatsky, 683006, Russia.
Shallow earthquake swarm in October
At 1832 on 22 October, a 10-minute series of shallow earthquakes was recorded at the volcano. The last Gorely eruptive activity occurred in 1980-81 (SEAN 05:07) and 1984-86 (SEAN 10:01).
Information Contacts: Olga Chubarova, Kamchatka Volcanic Eruptions Response Team (KVERT), Institute of Volcanic Geology and Geochemistry, Piip Ave. 9, Petropavlovsk-Kamchatsky, 683006, Russia; Tom Miller, Alaska Volcano Observatory (AVO), a cooperative program of a) U.S. Geological Survey, 4200 University Drive, Anchorage, AK 99508-4667, USA (URL: http://www.avo.alaska.edu/), b) Geophysical Institute, University of Alaska, PO Box 757320, Fairbanks, AK 99775-7320, USA, and c) Alaska Division of Geological & Geophysical Surveys, 794 University Ave., Suite 200, Fairbanks, AK 99709, USA.
Low seismicity from December 1999 through mid-October 2000
No volcanic activity was reported at Gorely from December 1999 through mid-October 2000. Seismicity, however, occasionally rose above background levels. On April 26, two small local events were recorded on seismic station GRL. On 22 July, two small volcano-tectonic earthquakes occurred between Gorely and neighboring Mutnovsky volcano. Seismicity returned to near-background levels until 24 September, when microseismic signals were registered on seismic station GRL. These signals continued to be recorded into early October. By 14 October, Gorely was quiet.
Information Contacts: Olga Chubarova, Kamchatka Volcanic Eruptions Response Team (KVERT), Institute of Volcanic Geology and Geochemistry, Piip Ave. 9, Petropavlovsk-Kamchatsky, 683006, Russia; Tom Miller, Alaska Volcano Observatory (AVO), a cooperative program of a) U.S. Geological Survey, 4200 University Drive, Anchorage, AK 99508-4667, USA (URL: http://www.avo.alaska.edu/), b) Geophysical Institute, University of Alaska, PO Box 757320, Fairbanks, AK 99775-7320, USA, and c) Alaska Division of Geological & Geophysical Surveys, 794 University Ave., Suite 200, Fairbanks, AK 99709, USA.
Minor June 2010 explosions and new, glowing vent in crater wall
Our last report about Gorely volcano in southern Kamchata (figure 1) described low seismicity in September 2000 (BGVN 25:09). The volcano generated at least seven eruptions in the 20th century, with the latest in August 1984. Below are available summaries of Gorely's activity from October 2000 to June 2010. The information came from various Russian sources credited below. During the first interval, between October 2000 and late October 2002, the volcano was generally quiet and mildly steaming with its lake occasionally boiling.
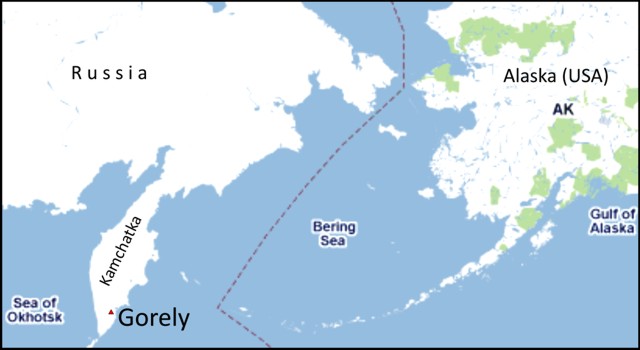 |
Figure 1. A map showing Kamchatka and the location of Gorely. |
Activity during 23-29 October 2002. According to the Laboratory of Active Volcanism Institute of Volcanology and Seismology, IV&S, steam rose 300 m above Gorely's crater. During 2-3 October, about 30 earthquakes M ~ 1.2-1.7 were recorded, and on 26 October there were two M~ 1.7 earthquakes (information from Kamchatka Branch of the Geophysical Service of the Russian Academy of Sciences, KB GS RAS). There is only one seismic station ("Gorely") in the area of both Gorely and Mutnovsky, so it is difficult to determine the source of the seismicity and attribute the tremor to a specific volcano.
Activity during 2007-2009. On 25 December, the Kamchatka Volcanic Eruption Response Team (KVERT) reported an increase in seismicity and undisclosed visual observations of activity. Seismicity had increased on 22 December and remained slightly elevated above background levels during 22-25 December. On 25 December, a gas-steam plume rose to an altitude of 2.2 km.
KVERT reported on 11 January 2008 that seismic activity in the area of Gorely and Mutnovsky had been slightly elevated above background levels during the previous three weeks. On 13 June 2008 seismicity increased further. Moderate fumarolic activity was observed on 17 June. During 15-18 June, seismic activity near Gorely and Mutnovsky decreased. Seismic activity from Gorely increased again during 10-27 March 2009.
Activity during June 2010. Volcanic tremor began to increase slightly on 6 June and strong steam-and-gas emissions were noted. Scientists reported a small plume that rose 400-500 m above the crater and areas of recently deposited ash on the S flank. Tremor increased gradually during the next few days. By 12 June, tremor had risen to several times background values (figure 2). During 12-13 June strong steam-and-gas activity was again noted. On 12 June a substantial steam plume was visible from Petropavlosk-Kamchatsky, ~ 80 km away.
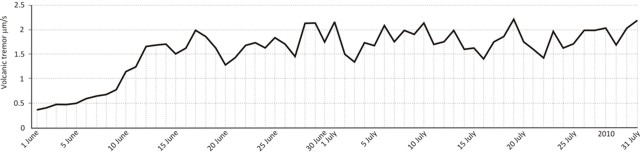 |
Figure 2. Seismicity recorded at Gorely station during 1 June through 31 July 2010. Volcanic tremor increased from 0.3 mm/s on 1 June to 2.15 mm/s on 1 July, and to 2.19 mm/s on 31 July 2010. Data from KB GS RAS. |
On 13 June, volcanologists observed continuous steaming to a height of ~ 300 m (Ovsyannikov and Chirkov, 2010). On 14 June, the plume rose about 1 km above the volcano (figure 3).
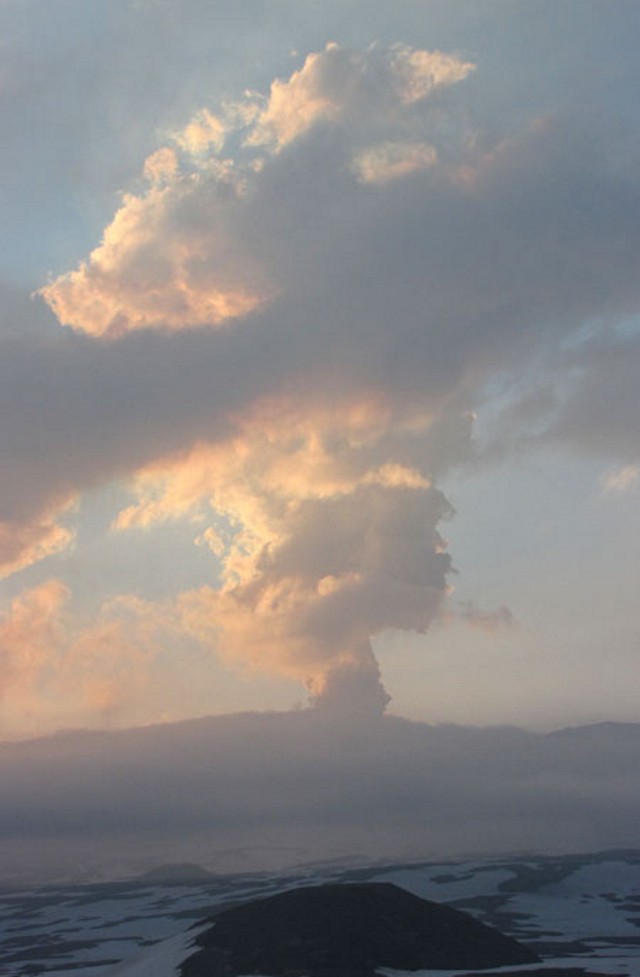 |
Figure 3. Unusual gas-steam emission from Gorely seen at a distance on 19 June 2010. Photo by Sergei Chirkov. |
Observers watching the volcano from 15 to 22 June reported that a new bocca vent, about 20 m in diameter, had formed at the base of the NE wall of the active crater containing a thermal acid lake. The vent's lowest edge was only 5-7 m above the lake level. As the vent formed, chunks of rock and colluvial deposits fell into the growing cavity. The hot gas ejected under high pressure from the vent was seen as a flaming, glowing crimson color (figure 4) and was accompanied by a constant, low rumble. The gas temperature at the outlet, measured by an infrared instrument, was 870°C.
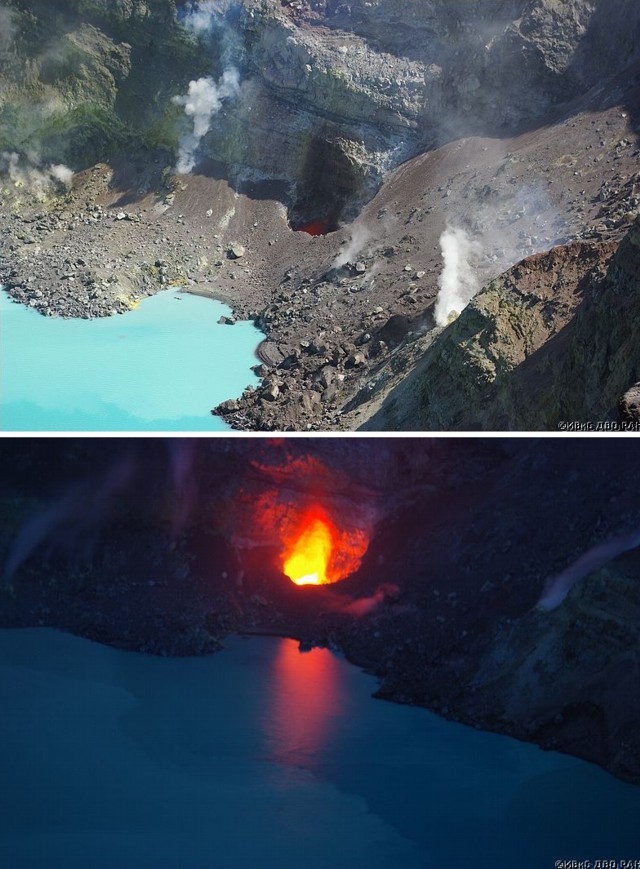 |
Figure 4. (top) Bocca vent seen at the base of Gorely's crater on the NE wall. Newly formed small terraces on the shore of the opal-colored, acidic lake are clearly visible and are of uncertain origin. (bottom) Spectacular view of flaming gas seen at night reflected on the lake surface. Photos by Sergei Chirkov. |
Seismic activity remained above background levels during 24 June-2 July, with a further increase on 28-29 June. A gas-and-steam plume drifted 35 km S on 28 June.
The formation of gas-and-steam clouds is dependent on atmospheric conditions; at some times a white column was visible above the vent. However, sometimes the column was gray due to ash (figure 5, right). The ash was interpreted as exclusively non-juvenile material resulting from the collapse of wall rock into the vent.
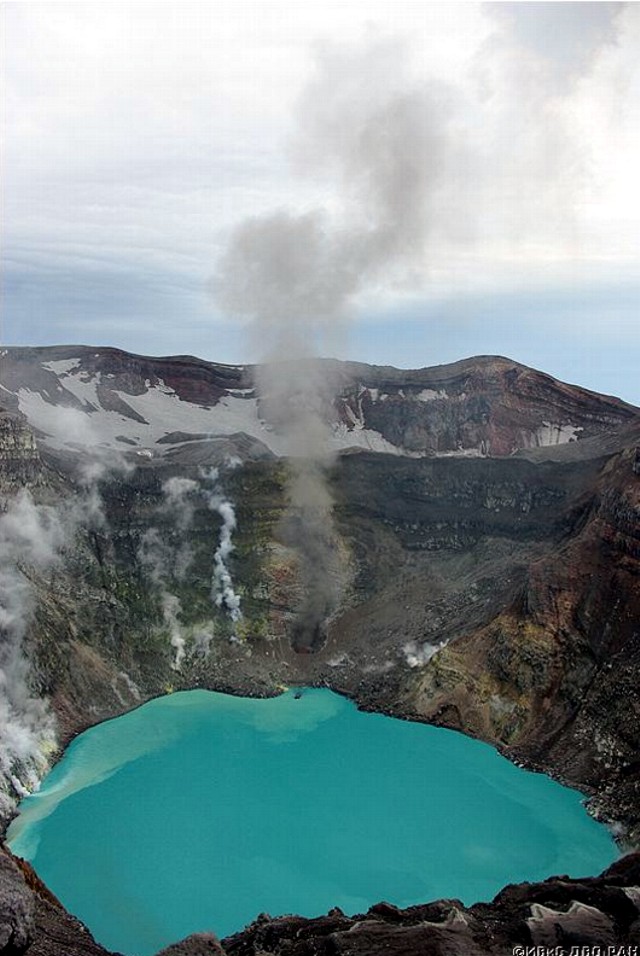 |
Figure 5. Ash-bearing clouds emerging from the new vent at Gorely on 19 June 2010. Photo by Sergei Chirkov. |
Activity during July 2010. According to KVERT, seismic activity remained above background levels during 9-23 July 2010, and gas-and-steam emissions rose from the crater most days. On 10 July, data suggested that the vent on the crater's inner NE wall, above the level of the lake, had grown to 2-3 times the original size. The lake level had also fallen. Gas-and-steam plumes drifted 25-150 km SE, E, and S during 10 and 14-15 July. Many new fumarolic vents were observed in the active crater. The temperature of a daily thermal anomaly detected over the volcano in satellite imagery gradually increased from 29 to 46°C during 17-21 July.
KVERT reported that during 23-30 July seismic activity from Gorely remained above background levels and volcanic tremor continued to be detected. On 26-27 July, gas-and-steam activity was noted.
Formation of the vent had no visible impact on the acid thermal lake. However, in some unconsolidated lake-shore sediments, the scientists observed small terraces (figure 4). This indicates successive intermittent lowering of the lake surface. These shifts may be related to the increased seismicity under the volcano.
Background. Observers saw a vent at the then-dry crater bottom during 1986 (figure 6, top). A vent on the NE crater's side was photographed in 1996; and can be compared with the latest vent observations (figure 6).
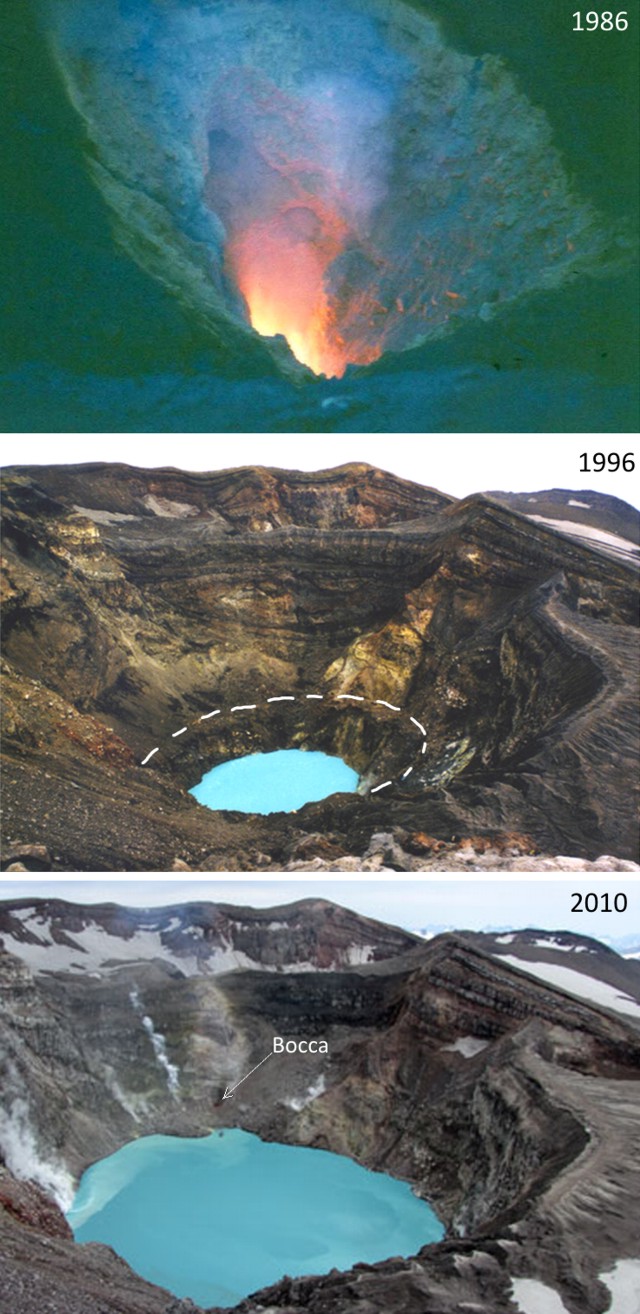 |
Figure 6. (top) Vent developed in the crater bottom at Gorely in 1986. (center) The crater lake as seen in 1996. The broken line shows the margin of the present-day lake. (bottom) Bocca vent on the crater's NE side and lake after its formation on 21 June 2010. Top photo by Anatolii Mushinsky; center by Luda Eichelberger; bottom by Sergei Chirkov. |
During 2000 through 3 August 2010, the only thermal anomalies detected in MODIS/MODVOLC satellite imagery occurred during June-August 2010 (16 June, 21 June, 11 July, 20 July, 27 July, and 3 August).
References. Gavrilenko, G., Melnikov, D., Ovsyannikov, A., 2008, Current state the thermal Lake into active crater Gorely (Kamchatka): Materials of Russian Scientific Conference "100 years of the Kamchatka expedition of the Russian Geographical Society 1908-1910." (Petropavlovsk-Kamchatsky, 22-27 Sept. 2008) (In Russian), Petropavlovsk-Kamchatsky, 2009, 267 p.
Leonov, V., 2006, Influence of depth breakthrough zone on the structure of volcano (the case of Gorely, Kamchatka): Volcanism and Geodynamics. Proceedings of III All-Russia Symposium on Volcanology and paleovolcanology, 5-8 September 2006, Ulan-Ude, 2006, p. 461-467.
Melekestsev, I.V., Braitseva, O.A., Ponomareva, V.V., 1987, Holocene activity dynamics of Mutnovskii and Gorelyi volcanoes and the volcanic risk for adjacent areas (as indicated by tephrochronological studies): Volc Seism, 1987, vol. 3, p. 3-18 (English translation 1990, vol. 9, p. 337-362).
Ovsyannikov, A. and Chirkov S., 2010, Activity (status) of Gorely volcano, June 2010: Bulletin of Kamchatka Regional Association (Educational-Scientific Center); Earth Sciences (in Russian), IV&S FEB RAS, Petropavlovsk-Kamchatsky, 2010, vol. 1, no. 15, ISSN 1816-5532 (Online).
Information Contacts: Kamchatka Volcanic Eruptions Response Team (KVERT), Far East Division, Russian Academy of Sciences, 9 Piip Blvd., Petropavlovsk-Kamchatsky, 683006, Russia (URL: http://www.kscnet.ru/ivs/); Kamchatka Branch of the Geophysical Service of the Russian Academy of Sciences (KB GS RAS), Sergey Senukov, Russia (URL: http://www.emsd.ru/); Alexander Ovsyannikov, Sergei Chirkov, and Anatolii Mushinsky, IV&S FED RAS; Hawai'i Institute of Geophysics and Planetology (HIGP) Thermal Alerts System, School of Ocean and Earth Science and Technology (SOEST), Univ. of Hawai'i, 2525 Correa Rd, Honolulu, HI 96822, USA (URL: http://modis.higp.hawaii.edu/).
Seismicity above background in post-eruptive phase to July 2012
Our last Bulletin report summarized Kamchatka Volcanic Eruptions Response Team (KVERT) reports on eruptive activity at Gorely through 30 July 2010 (BGVN 35:07); MODVOLC was covered through 3 August 2010. In this report we note subsequent MODVOLC alerts for 10, 15, and 19 August 2010. KVERT reported that satellite-based thermal anomalies were detected on 10-12, 15, and 23 August 2010. During July and August 2011, reports noted red incandescence. This report covers activity through 6 July 2012. The Aviation Color Code remained at Yellow throughout the reporting period, indicating signs of elevated unrest above known background levels.
Our sampling of available KVERT data revealed that for the remainder of 2010, seismicity was above background levels, with continued recording of volcanic tremor. Weak or moderate gas-and-steam activity of the volcano was observed periodically; clouds obscured the volcano on the other days. According to satellite data analysis, a thermal anomaly was registered over the volcano periodically for the remainder of 2010; on 12-14 and 18 November 2010. On 12 November, a gas-steam plume extended about 40 km NE.
KVERT reported predominantly moderate seismicity, with continued recording of volcanic tremor through 2011. Periodic weak thermal anomaly over the volcano continued to be noted in satellite images. Moderate and strong gas-and-steam activity at the volcano was observed on 1-3, and 5 April. The lake in the active crater of the volcano disappeared (figure 7).
|
Figure 7. Moderate-to-strong gas-and-steam activity at Gorely on 24 April 2011. Photo courtesy of A. Nuzhdaev. IVS FEB RAS. |
According to satellite data on 5 May 2011, a weak thermal anomaly was registered over the volcano, and a gas-and-steam plume extended about 15 km W. During 11-12 June, according to visual data, a red incandescence was observed in the new fumarole vent within the active crater, and the lake remained absent. During 7-8 July, the incandescence continued. Moderate fumarolic activity was observed on 20 July. On 26 July, observers noted a new lake within the active crater, including blocks of ice on the lake's surface (figure 8). The new fumarole was covered with colluvium, but red incandescence was seen within the vent. During 6-9 August these blocks of ice on the lake's surface were melting.
|
Figure 8. Photo at Gorely on 9 August 2011 shows a new lake within the active crater. Courtesy, Yu. Nazimova. |
Moderate seismic activity continued during the remainder of 2011, along with volcanic tremor. According to satellite data, thermal anomalies were registered on 26 and 29 August; 4-5 September; 5, 11-12, 21-25, and 31 October; 1-2, 5, 13, 24, 27-28 November; 2, 7, 20 December. Strong and moderate gas-and-steam activity was observed during 22-23 and 29 December. A large thermal anomaly was detected during 29-30 December 2011.
Seismic activity at Gorely increased in early January 2012 and continued to be elevated through February, but ceased being recorded after 5 February after a technical dysfunction. About 20-30 seismic events were registered within the volcanic edifice during 2-3 January. According to visual data, strong and moderate gas-and-steam activity was observed throughout January and February. Gas-and-steam activity became more moderate in March and continued at that level through the end of June.
Thermal anomalies were registered by satellite images during 1-2, 6-8, 17, 23, 28, and 31 January; 2, 4-5, 7, 11, and 19-21 February; 24 March; 10, 15, 17, 24, and 28 April; 2, 3, 10, 11-13, 15, 22 and 30 May; 21 and 29 June. Visual observations on 12 May revealed that the bottom of the active volcanic crater was covered by snow, but strong fumarolic emissions persisted (figure 9). A gas-and-steam plume was seen rising to 4 km (a.s.l.) During 16-17 June.
|
Figure 9. Bottom of active crater at Gorely on 12 May 2012, showing strong fumarolic emissions. Courtesy, D. Melnikov, IVS FED RAS. |
Between 28 June and 1 July 2012, seismicity was recorded at above background levels; continuous spasmodic tremor was detected on 28 and 30 June, and on 1 July 2012.
Information Contacts: Kamchatka Volcanic Eruptions Response Team (KVERT), Far East Division, Russian Academy of Sciences, 9 Piip Blvd., Petropavlovsk-Kamchatsky, 683006, Russia (URL: http://www.kscnet.ru/ivs/); Sergey Senukov, Kamchatka Branch of the Geophysical Service of the Russian Academy of Sciences (KB GS RAS), Russia (URL: http://www.emsd.ru/); Alexander Ovsyannikov, Sergei Chirkov, and Anatolii Mushinsky, IV&S FED RAS; and Hawai'i Institute of Geophysics and Planetology (HIGP) Thermal Alerts System, School of Ocean and Earth Science and Technology (SOEST), Univ. of Hawai'i, 2525 Correa Rd, Honolulu, HI 96822, USA (URL: http://modis.higp.hawaii.edu/).
|
|
||||||||||||||||||||||||||
There is data available for 50 confirmed eruptive periods.
2010 Jun 6 - 2010 Jun 22 (?) Confirmed Eruption (Explosive / Effusive) VEI: 1
| Episode 1 | Eruption (Explosive / Effusive) | Summit crater | ||||||||||||||||||||||||||||||||||||||||||||||||
|---|---|---|---|---|---|---|---|---|---|---|---|---|---|---|---|---|---|---|---|---|---|---|---|---|---|---|---|---|---|---|---|---|---|---|---|---|---|---|---|---|---|---|---|---|---|---|---|---|---|
| 2010 Jun 6 - 2010 Jun 22 (?) | Evidence from Observations: Reported | ||||||||||||||||||||||||||||||||||||||||||||||||
|
List of 8 Events for Episode 1 at Summit crater
|
|||||||||||||||||||||||||||||||||||||||||||||||||
1984 Aug 4 - 1986 Sep 21 (?) Confirmed Eruption (Explosive / Effusive) VEI: 2
| Episode 1 | Eruption (Explosive / Effusive) | |||||||||||||||||||||||||||||||||||||||
|---|---|---|---|---|---|---|---|---|---|---|---|---|---|---|---|---|---|---|---|---|---|---|---|---|---|---|---|---|---|---|---|---|---|---|---|---|---|---|---|
| 1984 Aug 4 - 1986 Sep 21 (?) | Evidence from Observations: Reported | ||||||||||||||||||||||||||||||||||||||
|
List of 6 Events for Episode 1
|
|||||||||||||||||||||||||||||||||||||||
1980 Jun 15 ± 5 days - 1981 Jul 3 Confirmed Eruption (Explosive / Effusive) VEI: 3
| Episode 1 | Eruption (Explosive / Effusive) | ||||||||||||||||||||||||||||||||||||||||||||||||||||||||||||||||||||||||||
|---|---|---|---|---|---|---|---|---|---|---|---|---|---|---|---|---|---|---|---|---|---|---|---|---|---|---|---|---|---|---|---|---|---|---|---|---|---|---|---|---|---|---|---|---|---|---|---|---|---|---|---|---|---|---|---|---|---|---|---|---|---|---|---|---|---|---|---|---|---|---|---|---|---|---|
| 1980 Jun 15 ± 5 days - 1981 Jul 3 | Evidence from Observations: Reported | |||||||||||||||||||||||||||||||||||||||||||||||||||||||||||||||||||||||||
|
List of 13 Events for Episode 1
|
||||||||||||||||||||||||||||||||||||||||||||||||||||||||||||||||||||||||||
1961 Jan 16 ± 15 days Confirmed Eruption (Explosive / Effusive) VEI: 2
| Episode 1 | Eruption (Explosive / Effusive) | |||||||||||||||||||
|---|---|---|---|---|---|---|---|---|---|---|---|---|---|---|---|---|---|---|---|
| 1961 Jan 16 ± 15 days - Unknown | Evidence from Observations: Reported | ||||||||||||||||||
|
List of 2 Events for Episode 1
|
|||||||||||||||||||
1947 Dec Confirmed Eruption (Explosive / Effusive) VEI: 2
| Episode 1 | Eruption (Explosive / Effusive) | |||||||||||||||||||
|---|---|---|---|---|---|---|---|---|---|---|---|---|---|---|---|---|---|---|---|
| 1947 Dec - Unknown | Evidence from Observations: Reported | ||||||||||||||||||
|
List of 2 Events for Episode 1
|
|||||||||||||||||||
[ 1932 ] Uncertain Eruption
| Episode 1 | Eruption (Explosive / Effusive) | ||||
|---|---|---|---|---|
| 1932 - Unknown | Evidence from Unknown | |||
1931 May - 1931 Jul 15 ± 45 days Confirmed Eruption (Explosive / Effusive) VEI: 2
| Episode 1 | Eruption (Explosive / Effusive) | |||||||||||||||||||
|---|---|---|---|---|---|---|---|---|---|---|---|---|---|---|---|---|---|---|---|
| 1931 May - 1931 Jul 15 ± 45 days | Evidence from Observations: Reported | ||||||||||||||||||
|
List of 2 Events for Episode 1
|
|||||||||||||||||||
1930 Sep - 1931 Jan 17 Confirmed Eruption (Explosive / Effusive) VEI: 3
| Episode 1 | Eruption (Explosive / Effusive) | |||||||||||||||||||||||||||||
|---|---|---|---|---|---|---|---|---|---|---|---|---|---|---|---|---|---|---|---|---|---|---|---|---|---|---|---|---|---|
| 1930 Sep - 1931 Jan 17 | Evidence from Observations: Reported | ||||||||||||||||||||||||||||
|
List of 4 Events for Episode 1
|
|||||||||||||||||||||||||||||
1929 Sep 1 - 1930 Apr Confirmed Eruption (Explosive / Effusive) VEI: 3
| Episode 1 | Eruption (Explosive / Effusive) | ||||||||||||||||||||||||
|---|---|---|---|---|---|---|---|---|---|---|---|---|---|---|---|---|---|---|---|---|---|---|---|---|
| 1929 Sep 1 - 1930 Apr | Evidence from Observations: Reported | |||||||||||||||||||||||
|
List of 3 Events for Episode 1
|
||||||||||||||||||||||||
1869 Confirmed Eruption (Explosive / Effusive) VEI: 2
| Episode 1 | Eruption (Explosive / Effusive) | |||||||||||||||||||
|---|---|---|---|---|---|---|---|---|---|---|---|---|---|---|---|---|---|---|---|
| 1869 - Unknown | Evidence from Observations: Reported | ||||||||||||||||||
|
List of 2 Events for Episode 1
|
|||||||||||||||||||
[ 1855 Apr ] Uncertain Eruption
| Episode 1 | Eruption (Explosive / Effusive) | ||||||||||||||||||||||||
|---|---|---|---|---|---|---|---|---|---|---|---|---|---|---|---|---|---|---|---|---|---|---|---|---|
| 1855 Apr - Unknown | Evidence from Unknown | |||||||||||||||||||||||
|
List of 3 Events for Episode 1
|
||||||||||||||||||||||||
1832 Feb Confirmed Eruption (Explosive / Effusive) VEI: 3
| Episode 1 | Eruption (Explosive / Effusive) | ||||||||||||||||||||||||
|---|---|---|---|---|---|---|---|---|---|---|---|---|---|---|---|---|---|---|---|---|---|---|---|---|
| 1832 Feb - Unknown | Evidence from Observations: Reported | |||||||||||||||||||||||
|
List of 3 Events for Episode 1
|
||||||||||||||||||||||||
1828 Jun Confirmed Eruption (Explosive / Effusive) VEI: 3
| Episode 1 | Eruption (Explosive / Effusive) | ||||||||||||||||||||||||
|---|---|---|---|---|---|---|---|---|---|---|---|---|---|---|---|---|---|---|---|---|---|---|---|---|
| 1828 Jun - Unknown | Evidence from Observations: Reported | |||||||||||||||||||||||
|
List of 3 Events for Episode 1
|
||||||||||||||||||||||||
[ 1821 ] Uncertain Eruption
| Episode 1 | Eruption (Explosive / Effusive) | ||||
|---|---|---|---|---|
| 1821 - Unknown | Evidence from Unknown | |||
1750 ± 50 years Confirmed Eruption (Explosive / Effusive) VEI: 2 (?)
| Episode 1 | Eruption (Explosive / Effusive) | ||||||||||||||||||||||||||||||||||||||||||||
|---|---|---|---|---|---|---|---|---|---|---|---|---|---|---|---|---|---|---|---|---|---|---|---|---|---|---|---|---|---|---|---|---|---|---|---|---|---|---|---|---|---|---|---|---|
| 1750 ± 50 years - Unknown | Evidence from Correlation: Tephrochronology | |||||||||||||||||||||||||||||||||||||||||||
|
List of 7 Events for Episode 1
|
||||||||||||||||||||||||||||||||||||||||||||
1330 ± 25 years Confirmed Eruption (Explosive / Effusive) VEI: 2 (?)
| Episode 1 | Eruption (Explosive / Effusive) | ||||||||||||||||||||||||||||||||||
|---|---|---|---|---|---|---|---|---|---|---|---|---|---|---|---|---|---|---|---|---|---|---|---|---|---|---|---|---|---|---|---|---|---|---|
| 1330 ± 25 years - Unknown | Evidence from Correlation: Tephrochronology | |||||||||||||||||||||||||||||||||
|
List of 5 Events for Episode 1
|
||||||||||||||||||||||||||||||||||
1030 ± 25 years Confirmed Eruption (Explosive / Effusive) VEI: 3
| Episode 1 | Eruption (Explosive / Effusive) | ||||||||||||||||||||||||
|---|---|---|---|---|---|---|---|---|---|---|---|---|---|---|---|---|---|---|---|---|---|---|---|---|
| 1030 ± 25 years - Unknown | Evidence from Correlation: Tephrochronology | |||||||||||||||||||||||
|
List of 3 Events for Episode 1
|
||||||||||||||||||||||||
0550 (?) Confirmed Eruption (Explosive / Effusive) VEI: 3
| Episode 1 | Eruption (Explosive / Effusive) | ||||||||||||||||||||||||
|---|---|---|---|---|---|---|---|---|---|---|---|---|---|---|---|---|---|---|---|---|---|---|---|---|
| 0550 (?) - Unknown | Evidence from Correlation: Tephrochronology | |||||||||||||||||||||||
|
List of 3 Events for Episode 1
|
||||||||||||||||||||||||
0250 (?) Confirmed Eruption (Explosive / Effusive) VEI: 3
| Episode 1 | Eruption (Explosive / Effusive) | ||||||||||||||||||||||||
|---|---|---|---|---|---|---|---|---|---|---|---|---|---|---|---|---|---|---|---|---|---|---|---|---|
| 0250 (?) - Unknown | Evidence from Correlation: Tephrochronology | |||||||||||||||||||||||
|
List of 3 Events for Episode 1
|
||||||||||||||||||||||||
0200 (?) Confirmed Eruption (Explosive / Effusive) VEI: 3
| Episode 1 | Eruption (Explosive / Effusive) | ||||||||||||||||||||||||
|---|---|---|---|---|---|---|---|---|---|---|---|---|---|---|---|---|---|---|---|---|---|---|---|---|
| 0200 (?) - Unknown | Evidence from Correlation: Tephrochronology | |||||||||||||||||||||||
|
List of 3 Events for Episode 1
|
||||||||||||||||||||||||
0050 (?) Confirmed Eruption (Explosive / Effusive) VEI: 3
| Episode 1 | Eruption (Explosive / Effusive) | ||||||||||||||||||||||||
|---|---|---|---|---|---|---|---|---|---|---|---|---|---|---|---|---|---|---|---|---|---|---|---|---|
| 0050 (?) - Unknown | Evidence from Correlation: Tephrochronology | |||||||||||||||||||||||
|
List of 3 Events for Episode 1
|
||||||||||||||||||||||||
0350 BCE (?) Confirmed Eruption (Explosive / Effusive) VEI: 3
| Episode 1 | Eruption (Explosive / Effusive) | ||||||||||||||||||||||||
|---|---|---|---|---|---|---|---|---|---|---|---|---|---|---|---|---|---|---|---|---|---|---|---|---|
| 0350 BCE (?) - Unknown | Evidence from Correlation: Tephrochronology | |||||||||||||||||||||||
|
List of 3 Events for Episode 1
|
||||||||||||||||||||||||
0700 BCE ± 850 years Confirmed Eruption (Explosive / Effusive) VEI: 0
| Episode 1 | Eruption (Explosive / Effusive) | |||||||||||||||||||
|---|---|---|---|---|---|---|---|---|---|---|---|---|---|---|---|---|---|---|---|
| 0700 BCE ± 850 years - Unknown | Evidence from Correlation: Tephrochronology | ||||||||||||||||||
|
List of 2 Events for Episode 1
|
|||||||||||||||||||
2000 BCE (?) Confirmed Eruption (Explosive / Effusive) VEI: 2
| Episode 1 | Eruption (Explosive / Effusive) | |||||||||||||||||||
|---|---|---|---|---|---|---|---|---|---|---|---|---|---|---|---|---|---|---|---|
| 2000 BCE (?) - Unknown | Evidence from Correlation: Tephrochronology | ||||||||||||||||||
|
List of 2 Events for Episode 1
|
|||||||||||||||||||
2050 BCE (?) Confirmed Eruption (Explosive / Effusive) VEI: 2
| Episode 1 | Eruption (Explosive / Effusive) | |||||||||||||||||||
|---|---|---|---|---|---|---|---|---|---|---|---|---|---|---|---|---|---|---|---|
| 2050 BCE (?) - Unknown | Evidence from Correlation: Tephrochronology | ||||||||||||||||||
|
List of 2 Events for Episode 1
|
|||||||||||||||||||
2200 BCE (?) Confirmed Eruption (Explosive / Effusive) VEI: 2
| Episode 1 | Eruption (Explosive / Effusive) | |||||||||||||||||||
|---|---|---|---|---|---|---|---|---|---|---|---|---|---|---|---|---|---|---|---|
| 2200 BCE (?) - Unknown | Evidence from Correlation: Tephrochronology | ||||||||||||||||||
|
List of 2 Events for Episode 1
|
|||||||||||||||||||
2250 BCE (?) Confirmed Eruption (Explosive / Effusive) VEI: 2
| Episode 1 | Eruption (Explosive / Effusive) | |||||||||||||||||||
|---|---|---|---|---|---|---|---|---|---|---|---|---|---|---|---|---|---|---|---|
| 2250 BCE (?) - Unknown | Evidence from Correlation: Tephrochronology | ||||||||||||||||||
|
List of 2 Events for Episode 1
|
|||||||||||||||||||
2450 BCE (?) Confirmed Eruption (Explosive / Effusive) VEI: 3
| Episode 1 | Eruption (Explosive / Effusive) | ||||||||||||||||||||||||
|---|---|---|---|---|---|---|---|---|---|---|---|---|---|---|---|---|---|---|---|---|---|---|---|---|
| 2450 BCE (?) - Unknown | Evidence from Correlation: Tephrochronology | |||||||||||||||||||||||
|
List of 3 Events for Episode 1
|
||||||||||||||||||||||||
2750 BCE (?) Confirmed Eruption (Explosive / Effusive) VEI: 2
| Episode 1 | Eruption (Explosive / Effusive) | |||||||||||||||||||||||||||||
|---|---|---|---|---|---|---|---|---|---|---|---|---|---|---|---|---|---|---|---|---|---|---|---|---|---|---|---|---|---|
| 2750 BCE (?) - Unknown | Evidence from Correlation: Tephrochronology | ||||||||||||||||||||||||||||
|
List of 4 Events for Episode 1
|
|||||||||||||||||||||||||||||
3450 BCE (?) Confirmed Eruption (Explosive / Effusive) VEI: 3
| Episode 1 | Eruption (Explosive / Effusive) | |||||||||||||||||||||||||||||
|---|---|---|---|---|---|---|---|---|---|---|---|---|---|---|---|---|---|---|---|---|---|---|---|---|---|---|---|---|---|
| 3450 BCE (?) - Unknown | Evidence from Correlation: Tephrochronology | ||||||||||||||||||||||||||||
|
List of 4 Events for Episode 1
|
|||||||||||||||||||||||||||||
3550 BCE (?) Confirmed Eruption (Explosive / Effusive) VEI: 0
| Episode 1 | Eruption (Explosive / Effusive) | |||||||||||||||||||
|---|---|---|---|---|---|---|---|---|---|---|---|---|---|---|---|---|---|---|---|
| 3550 BCE (?) - Unknown | Evidence from Correlation: Tephrochronology | ||||||||||||||||||
|
List of 2 Events for Episode 1
|
|||||||||||||||||||
3580 BCE ± 100 years Confirmed Eruption (Explosive / Effusive) VEI: 2 (?)
| Episode 1 | Eruption (Explosive / Effusive) | Gsh1 tephra | |||||||||||||||||||||||
|---|---|---|---|---|---|---|---|---|---|---|---|---|---|---|---|---|---|---|---|---|---|---|---|---|
| 3580 BCE ± 100 years - Unknown | Evidence from Isotopic: 14C (uncalibrated) | |||||||||||||||||||||||
|
List of 3 Events for Episode 1 at Gsh1 tephra
|
||||||||||||||||||||||||
3900 BCE (?) Confirmed Eruption (Explosive / Effusive) VEI: 2
| Episode 1 | Eruption (Explosive / Effusive) | |||||||||||||||||||
|---|---|---|---|---|---|---|---|---|---|---|---|---|---|---|---|---|---|---|---|
| 3900 BCE (?) - Unknown | Evidence from Correlation: Tephrochronology | ||||||||||||||||||
|
List of 2 Events for Episode 1
|
|||||||||||||||||||
3950 BCE (?) Confirmed Eruption (Explosive / Effusive) VEI: 2
| Episode 1 | Eruption (Explosive / Effusive) | |||||||||||||||||||
|---|---|---|---|---|---|---|---|---|---|---|---|---|---|---|---|---|---|---|---|
| 3950 BCE (?) - Unknown | Evidence from Correlation: Tephrochronology | ||||||||||||||||||
|
List of 2 Events for Episode 1
|
|||||||||||||||||||
4150 BCE (?) Confirmed Eruption (Explosive / Effusive) VEI: 2
| Episode 1 | Eruption (Explosive / Effusive) | |||||||||||||||||||
|---|---|---|---|---|---|---|---|---|---|---|---|---|---|---|---|---|---|---|---|
| 4150 BCE (?) - Unknown | Evidence from Correlation: Tephrochronology | ||||||||||||||||||
|
List of 2 Events for Episode 1
|
|||||||||||||||||||
4300 BCE ± 150 years Confirmed Eruption (Explosive / Effusive) VEI: 0
| Episode 1 | Eruption (Explosive / Effusive) | |||||||||||||||||||
|---|---|---|---|---|---|---|---|---|---|---|---|---|---|---|---|---|---|---|---|
| 4300 BCE ± 150 years - Unknown | Evidence from Correlation: Tephrochronology | ||||||||||||||||||
|
List of 2 Events for Episode 1
|
|||||||||||||||||||
4350 BCE (?) Confirmed Eruption (Explosive / Effusive) VEI: 3
| Episode 1 | Eruption (Explosive / Effusive) | |||||||||||||||||||||||||||||||||||||||
|---|---|---|---|---|---|---|---|---|---|---|---|---|---|---|---|---|---|---|---|---|---|---|---|---|---|---|---|---|---|---|---|---|---|---|---|---|---|---|---|
| 4350 BCE (?) - Unknown | Evidence from Correlation: Tephrochronology | ||||||||||||||||||||||||||||||||||||||
|
List of 6 Events for Episode 1
|
|||||||||||||||||||||||||||||||||||||||
4450 BCE (?) Confirmed Eruption (Explosive / Effusive) VEI: 2
| Episode 1 | Eruption (Explosive / Effusive) | |||||||||||||||||||
|---|---|---|---|---|---|---|---|---|---|---|---|---|---|---|---|---|---|---|---|
| 4450 BCE (?) - Unknown | Evidence from Correlation: Tephrochronology | ||||||||||||||||||
|
List of 2 Events for Episode 1
|
|||||||||||||||||||
4500 BCE (?) Confirmed Eruption (Explosive / Effusive) VEI: 2
| Episode 1 | Eruption (Explosive / Effusive) | |||||||||||||||||||
|---|---|---|---|---|---|---|---|---|---|---|---|---|---|---|---|---|---|---|---|
| 4500 BCE (?) - Unknown | Evidence from Correlation: Tephrochronology | ||||||||||||||||||
|
List of 2 Events for Episode 1
|
|||||||||||||||||||
4600 BCE (?) Confirmed Eruption (Explosive / Effusive) VEI: 2
| Episode 1 | Eruption (Explosive / Effusive) | |||||||||||||||||||
|---|---|---|---|---|---|---|---|---|---|---|---|---|---|---|---|---|---|---|---|
| 4600 BCE (?) - Unknown | Evidence from Correlation: Tephrochronology | ||||||||||||||||||
|
List of 2 Events for Episode 1
|
|||||||||||||||||||
4650 BCE (?) Confirmed Eruption (Explosive / Effusive) VEI: 3
| Episode 1 | Eruption (Explosive / Effusive) | |||||||||||||||||||||||||||||||||||||||
|---|---|---|---|---|---|---|---|---|---|---|---|---|---|---|---|---|---|---|---|---|---|---|---|---|---|---|---|---|---|---|---|---|---|---|---|---|---|---|---|
| 4650 BCE (?) - Unknown | Evidence from Correlation: Tephrochronology | ||||||||||||||||||||||||||||||||||||||
|
List of 6 Events for Episode 1
|
|||||||||||||||||||||||||||||||||||||||
4700 BCE (?) Confirmed Eruption (Explosive / Effusive) VEI: 2
| Episode 1 | Eruption (Explosive / Effusive) | |||||||||||||||||||
|---|---|---|---|---|---|---|---|---|---|---|---|---|---|---|---|---|---|---|---|
| 4700 BCE (?) - Unknown | Evidence from Correlation: Tephrochronology | ||||||||||||||||||
|
List of 2 Events for Episode 1
|
|||||||||||||||||||
4750 BCE (?) Confirmed Eruption (Explosive / Effusive) VEI: 3
| Episode 1 | Eruption (Explosive / Effusive) | |||||||||||||||||||||||||||||||||||||||
|---|---|---|---|---|---|---|---|---|---|---|---|---|---|---|---|---|---|---|---|---|---|---|---|---|---|---|---|---|---|---|---|---|---|---|---|---|---|---|---|
| 4750 BCE (?) - Unknown | Evidence from Correlation: Tephrochronology | ||||||||||||||||||||||||||||||||||||||
|
List of 6 Events for Episode 1
|
|||||||||||||||||||||||||||||||||||||||
4950 BCE (?) Confirmed Eruption (Explosive / Effusive) VEI: 2
| Episode 1 | Eruption (Explosive / Effusive) | |||||||||||||||||||
|---|---|---|---|---|---|---|---|---|---|---|---|---|---|---|---|---|---|---|---|
| 4950 BCE (?) - Unknown | Evidence from Correlation: Tephrochronology | ||||||||||||||||||
|
List of 2 Events for Episode 1
|
|||||||||||||||||||
5150 BCE (?) Confirmed Eruption (Explosive / Effusive) VEI: 3
| Episode 1 | Eruption (Explosive / Effusive) | |||||||||||||||||||||||||||||||||||||||
|---|---|---|---|---|---|---|---|---|---|---|---|---|---|---|---|---|---|---|---|---|---|---|---|---|---|---|---|---|---|---|---|---|---|---|---|---|---|---|---|
| 5150 BCE (?) - Unknown | Evidence from Correlation: Tephrochronology | ||||||||||||||||||||||||||||||||||||||
|
List of 6 Events for Episode 1
|
|||||||||||||||||||||||||||||||||||||||
5300 BCE (?) Confirmed Eruption (Explosive / Effusive) VEI: 2
| Episode 1 | Eruption (Explosive / Effusive) | |||||||||||||||||||
|---|---|---|---|---|---|---|---|---|---|---|---|---|---|---|---|---|---|---|---|
| 5300 BCE (?) - Unknown | Evidence from Correlation: Tephrochronology | ||||||||||||||||||
|
List of 2 Events for Episode 1
|
|||||||||||||||||||
5450 BCE (?) Confirmed Eruption (Explosive / Effusive) VEI: 3
| Episode 1 | Eruption (Explosive / Effusive) | |||||||||||||||||||||||||||||||||||||||
|---|---|---|---|---|---|---|---|---|---|---|---|---|---|---|---|---|---|---|---|---|---|---|---|---|---|---|---|---|---|---|---|---|---|---|---|---|---|---|---|
| 5450 BCE (?) - Unknown | Evidence from Correlation: Tephrochronology | ||||||||||||||||||||||||||||||||||||||
|
List of 6 Events for Episode 1
|
|||||||||||||||||||||||||||||||||||||||
5500 BCE (?) Confirmed Eruption (Explosive / Effusive) VEI: 3
| Episode 1 | Eruption (Explosive / Effusive) | |||||||||||||||||||||||||||||||||||||||
|---|---|---|---|---|---|---|---|---|---|---|---|---|---|---|---|---|---|---|---|---|---|---|---|---|---|---|---|---|---|---|---|---|---|---|---|---|---|---|---|
| 5500 BCE (?) - Unknown | Evidence from Correlation: Tephrochronology | ||||||||||||||||||||||||||||||||||||||
|
List of 6 Events for Episode 1
|
|||||||||||||||||||||||||||||||||||||||
5650 BCE (?) Confirmed Eruption (Explosive / Effusive) VEI: 3
| Episode 1 | Eruption (Explosive / Effusive) | |||||||||||||||||||||||||||||||||||||||
|---|---|---|---|---|---|---|---|---|---|---|---|---|---|---|---|---|---|---|---|---|---|---|---|---|---|---|---|---|---|---|---|---|---|---|---|---|---|---|---|
| 5650 BCE (?) - Unknown | Evidence from Correlation: Tephrochronology | ||||||||||||||||||||||||||||||||||||||
|
List of 6 Events for Episode 1
|
|||||||||||||||||||||||||||||||||||||||
5950 BCE (?) Confirmed Eruption (Explosive / Effusive) VEI: 3
| Episode 1 | Eruption (Explosive / Effusive) | |||||||||||||||||||||||||||||||||||||||
|---|---|---|---|---|---|---|---|---|---|---|---|---|---|---|---|---|---|---|---|---|---|---|---|---|---|---|---|---|---|---|---|---|---|---|---|---|---|---|---|
| 5950 BCE (?) - Unknown | Evidence from Correlation: Tephrochronology | ||||||||||||||||||||||||||||||||||||||
|
List of 6 Events for Episode 1
|
|||||||||||||||||||||||||||||||||||||||
6050 BCE (?) Confirmed Eruption (Explosive / Effusive) VEI: 0
| Episode 1 | Eruption (Explosive / Effusive) | |||||||||||||||||||
|---|---|---|---|---|---|---|---|---|---|---|---|---|---|---|---|---|---|---|---|
| 6050 BCE (?) - Unknown | Evidence from Correlation: Tephrochronology | ||||||||||||||||||
|
List of 2 Events for Episode 1
|
|||||||||||||||||||
7250 BCE (?) Confirmed Eruption (Explosive / Effusive) VEI: 2
| Episode 1 | Eruption (Explosive / Effusive) | |||||||||||||||||||
|---|---|---|---|---|---|---|---|---|---|---|---|---|---|---|---|---|---|---|---|
| 7250 BCE (?) - Unknown | Evidence from Correlation: Tephrochronology | ||||||||||||||||||
|
List of 2 Events for Episode 1
|
|||||||||||||||||||
7400 BCE ± 150 years Confirmed Eruption (Explosive / Effusive) VEI: 0
| Episode 1 | Eruption (Explosive / Effusive) | |||||||||||||||||||
|---|---|---|---|---|---|---|---|---|---|---|---|---|---|---|---|---|---|---|---|
| 7400 BCE ± 150 years - Unknown | Evidence from Correlation: Tephrochronology | ||||||||||||||||||
|
List of 2 Events for Episode 1
|
|||||||||||||||||||
This compilation of synonyms and subsidiary features may not be comprehensive. Features are organized into four major categories: Cones, Craters, Domes, and Thermal Features. Synonyms of features appear indented below the primary name. In some cases additional feature type, elevation, or location details are provided.
Synonyms |
||||
| Gorelaia Sopka | Gorely Khrebet | Pravaia Mutnovskaia Sopka | Vtoraia Mutnovskaia Sopka | Asacha | Prawaja Mutnowskaja | Gorely Kurebet | ||||
Cones |
||||
| Feature Name | Feature Type | Elevation | Latitude | Longitude |
| Vysokaya | Cone | |||
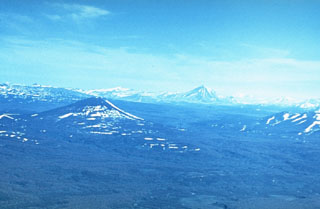 Visokiy (left of center) is surrounded by young lava flows produced by regional basaltic volcanism, seen here from the southwest. Mutnovsky is the cone on the horizon and to the left is Gorely.
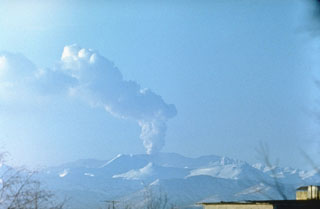 A plume rises above Gorely volcano in February 1985, seen here from the N. Intermittent minor ash eruptions began in August 1984 and lasted until September 1986. Steam-and-gas plumes, sometimes containing minor ash, rose 2 km and the eruption deposited fresh ash on the flanks.
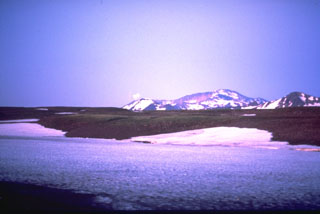 Gorely consists of five small overlapping edifices constructed within a large Pleistocene caldera that formed about 40,000-50,000 years ago. The rims of the 9 x 13.5 km caldera form the flat area on the center horizon and the peak at the right, seen here from the south. The Gorely complex contains 11 summit and 30 flank craters. Historical eruptions have largely consisted of moderate Vulcanian and phreatic explosions.
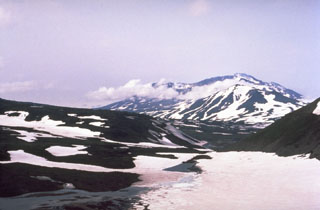 Part of the summit complex of Gorely is seen in this view from the S. It was constructed within a large caldera and contains 11 summit and 30 flank craters. Historical eruptions, largely consisting of moderate Vulcanian and phreatic explosions, have commonly produced ash plumes that are visible from Petropavlovsk, Kamchatka's largest city.
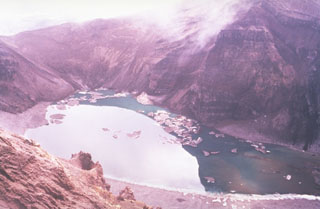 The lake in this photo is within the central of three large craters across the summit of the Gorely. Stratified deposits are exposed in the walls of the crater, which drains to the SW (lower right) through a small valley. Small icebergs float on the surface in this July 1992 view.
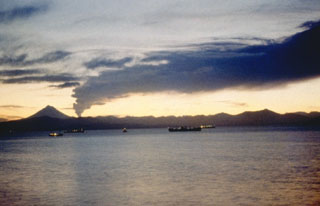 An ash plume from Gorely drifts to the N across Avachinsky Bay in this 1980 view from Petropavlovsk, Kamchatka's largest city. Explosive activity began in June 1980 and intermittent explosions took place until July 1981. An explosion on 31 July produced a plume that rose up to 5.5-km altitude, and a pyroclastic flow was produced on 3 December 1980.
 The following 8 samples associated with this volcano can be found in the Smithsonian's NMNH Department of Mineral Sciences collections, and may be availble for research (contact the Rock and Ore Collections Manager). Catalog number links will open a window with more information.
| Catalog Number | Sample Description | Lava Source | Collection Date |
|---|---|---|---|
| NMNH 116556-34 | Liparite | -- | -- |
| NMNH 116556-35 | Liparite | -- | -- |
| NMNH 116556-36 | Dacitic Andesite | -- | -- |
| NMNH 116556-37 | Rhyolite | -- | -- |
| NMNH 116556-38 | Andesite | -- | -- |
| NMNH 116556-39 | Andesite | -- | -- |
| NMNH 116556-40 | Basalt | -- | -- |
| NMNH 116556-41 | Andesitic Basalt | -- | -- |
| Copernicus Browser | The Copernicus Browser replaced the Sentinel Hub Playground browser in 2023, to provide access to Earth observation archives from the Copernicus Data Space Ecosystem, the main distribution platform for data from the EU Copernicus missions. |
| MIROVA | Middle InfraRed Observation of Volcanic Activity (MIROVA) is a near real time volcanic hot-spot detection system based on the analysis of MODIS (Moderate Resolution Imaging Spectroradiometer) data. In particular, MIROVA uses the Middle InfraRed Radiation (MIR), measured over target volcanoes, in order to detect, locate and measure the heat radiation sourced from volcanic activity. |
| MODVOLC Thermal Alerts | Using infrared satellite Moderate Resolution Imaging Spectroradiometer (MODIS) data, scientists at the Hawai'i Institute of Geophysics and Planetology, University of Hawai'i, developed an automated system called MODVOLC to map thermal hot-spots in near real time. For each MODIS image, the algorithm automatically scans each 1 km pixel within it to check for high-temperature hot-spots. When one is found the date, time, location, and intensity are recorded. MODIS looks at every square km of the Earth every 48 hours, once during the day and once during the night, and the presence of two MODIS sensors in space allows at least four hot-spot observations every two days. Each day updated global maps are compiled to display the locations of all hot spots detected in the previous 24 hours. There is a drop-down list with volcano names which allow users to 'zoom-in' and examine the distribution of hot-spots at a variety of spatial scales. |
|
WOVOdat
Single Volcano View Temporal Evolution of Unrest Side by Side Volcanoes |
WOVOdat is a database of volcanic unrest; instrumentally and visually recorded changes in seismicity, ground deformation, gas emission, and other parameters from their normal baselines. It is sponsored by the World Organization of Volcano Observatories (WOVO) and presently hosted at the Earth Observatory of Singapore.
GVMID Data on Volcano Monitoring Infrastructure The Global Volcano Monitoring Infrastructure Database GVMID, is aimed at documenting and improving capabilities of volcano monitoring from the ground and space. GVMID should provide a snapshot and baseline view of the techniques and instrumentation that are in place at various volcanoes, which can be use by volcano observatories as reference to setup new monitoring system or improving networks at a specific volcano. These data will allow identification of what monitoring gaps exist, which can be then targeted by remote sensing infrastructure and future instrument deployments. |
| Volcanic Hazard Maps | The IAVCEI Commission on Volcanic Hazards and Risk has a Volcanic Hazard Maps database designed to serve as a resource for hazard mappers (or other interested parties) to explore how common issues in hazard map development have been addressed at different volcanoes, in different countries, for different hazards, and for different intended audiences. In addition to the comprehensive, searchable Volcanic Hazard Maps Database, this website contains information about diversity of volcanic hazard maps, illustrated using examples from the database. This site is for educational purposes related to volcanic hazard maps. Hazard maps found on this website should not be used for emergency purposes. For the most recent, official hazard map for a particular volcano, please seek out the proper institutional authorities on the matter. |
| IRIS seismic stations/networks | Incorporated Research Institutions for Seismology (IRIS) Data Services map showing the location of seismic stations from all available networks (permanent or temporary) within a radius of 0.18° (about 20 km at mid-latitudes) from the given location of Gorely. Users can customize a variety of filters and options in the left panel. Note that if there are no stations are known the map will default to show the entire world with a "No data matched request" error notice. |
| UNAVCO GPS/GNSS stations | Geodetic Data Services map from UNAVCO showing the location of GPS/GNSS stations from all available networks (permanent or temporary) within a radius of 20 km from the given location of Gorely. Users can customize the data search based on station or network names, location, and time window. Requires Adobe Flash Player. |
| DECADE Data | The DECADE portal, still in the developmental stage, serves as an example of the proposed interoperability between The Smithsonian Institution's Global Volcanism Program, the Mapping Gas Emissions (MaGa) Database, and the EarthChem Geochemical Portal. The Deep Earth Carbon Degassing (DECADE) initiative seeks to use new and established technologies to determine accurate global fluxes of volcanic CO2 to the atmosphere, but installing CO2 monitoring networks on 20 of the world's 150 most actively degassing volcanoes. The group uses related laboratory-based studies (direct gas sampling and analysis, melt inclusions) to provide new data for direct degassing of deep earth carbon to the atmosphere. |
| Large Eruptions of Gorely | Information about large Quaternary eruptions (VEI >= 4) is cataloged in the Large Magnitude Explosive Volcanic Eruptions (LaMEVE) database of the Volcano Global Risk Identification and Analysis Project (VOGRIPA). |
| EarthChem | EarthChem develops and maintains databases, software, and services that support the preservation, discovery, access and analysis of geochemical data, and facilitate their integration with the broad array of other available earth science parameters. EarthChem is operated by a joint team of disciplinary scientists, data scientists, data managers and information technology developers who are part of the NSF-funded data facility Integrated Earth Data Applications (IEDA). IEDA is a collaborative effort of EarthChem and the Marine Geoscience Data System (MGDS). |

