Mount St. Helens 40th Anniversary — Science of Volcanology
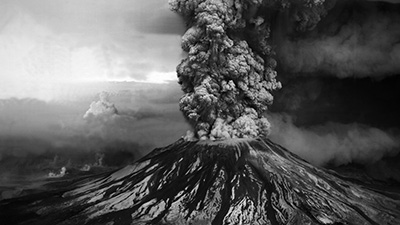
Forty years ago, on May 18th, 1980, Mount St. Helens produced the largest observed eruption in the coterminus United States. This eruption had profound impacts on human life and the science of volcanology, as well as on hazard preparedness, communication, and forecasting.
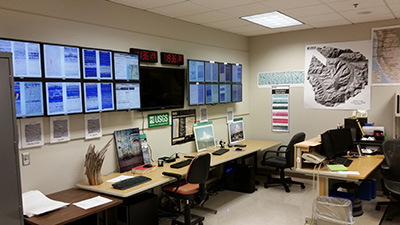
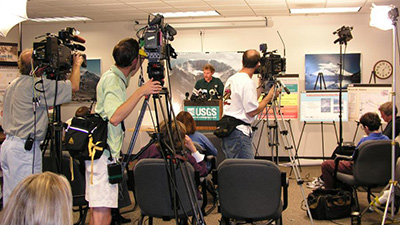
A volcanologist that works at a volcano observatory has a unique job to monitor what their volcanoes are doing, understand what the data they are collecting means, and then communicate that information to a variety of groups including civil protection or emergency management agencies (that are in charge of keeping people safe), the aviation community, and interested public. How do they do all of those things?
|
Volcanology
Volcanoes are natural systems, and as with all natural systems, there are varying degrees of uncertainly that comes along with understanding them and figuring out what may happen next. There are many tools in a volcanologist’s toolbox that are used to figure out what the volcano is doing. Are there any changes? Is it waking up? Might there be an eruption in the near future? To answer these questions, volcanologist use instruments to monitor the type and frequency of earthquakes, what kinds of gases are emitted, or if the volcano is changing shape, just to name a few. Because past eruptive activity gives an indication of potential future activity, volcanologists study volcanic histories by examining ancient deposits and analyzing rock samples. Together, all of these data give volcanologists clues about the state of the volcano. |
|
|
|
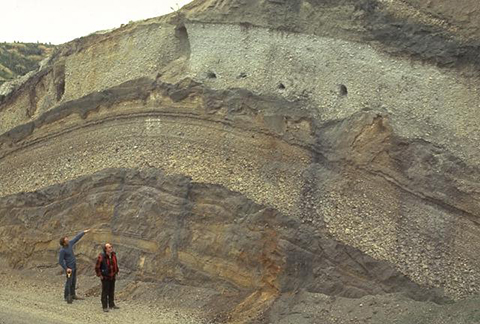
Volcanologists Colin Wilson and Peter Ballance examine a roadcut that dissects deposits of major eruptions from the Taupo volcanic center. The bottom visible unit is an exposure of an unwelded pyroclastic flow deposit from the Oruanui eruption, which formed Taupo's initial caldera about 22,600 years ago. Light-colored pumice fall deposits from other major eruptions are between it and the deposits of the 1,800-year-old Taupo eruption (upper right), which were responsible for Taupo's second caldera. Photo by Bruce Houghton (Wairakei Research Center). |
|
|
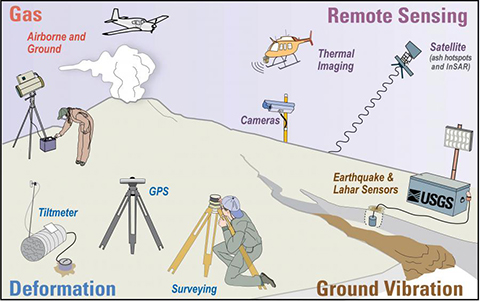
Volcanic monitoring types and methods employed by the USGS Volcano Hazards Program. |
|
Monitoring Then and Now
Monitoring tools and techniques have changed in some significant ways over the past 40 years. The interviews and content below touch on some of these changes. |
|
|
|
Interview with Chris Newhall. The May 18, 1980 eruption of Mount St. Helens occurred when volcanologists had early monitoring tools and little experience with large explosive eruptions. The 40 years following the eruption has brought tremendous strides forward in the science, the technology, and the collective global experience of the field. Volcanologist Chris Newhall talks about what hindsight offers, looking back to the lead up of the eruption. |
|
|
Interview with David W. Ramsey, Geologist, USGS Cascades Volcano Observatory. Geospatial techniques help us to study the surface of volcanoes and the land around them, including understanding the risk to people and property when it comes to volcanic activity. This was an important way of trying to understand what was happening as Mount St. Helens was leading towards the 1980 eruption, and to understand what happened that day. USGS Geologist Dave Ramsey discusses what this looked like in 1980 and how this has improved over the past 40 years. |
|
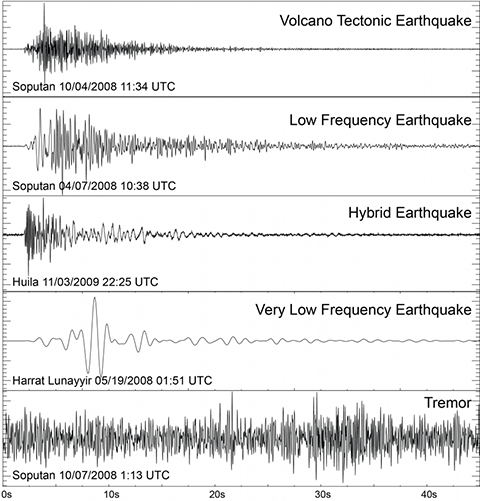
Seismology. When magma beneath a volcano rises up, possibly leading to an eruption, seismometers may pick up earthquakes that happen as surrounding rocks move and break. The lines on a seismograph may just look like squiggles at first, but if you look closer you can see that they each have a unique signature. These signatures help volcanologists understand what is happening underground. |
|
|
|
https://volcanoes.usgs.gov/vhp/earthquakes.html |
|
Deformation. Magma moving beneath a volcano changes the shape of a volcano, much like inflating a balloon under a blanket. These changes are often incredibly small, changes in angle of a few micro-radians (equivalent to a tilting a kilometer-long object up or down by a few millimeters) or changes in position on the order of centimeters, but volcanologists can measure these changes using tiltmeters, precision GPS units, laser ranging systems, and satellites. |
|
|
|
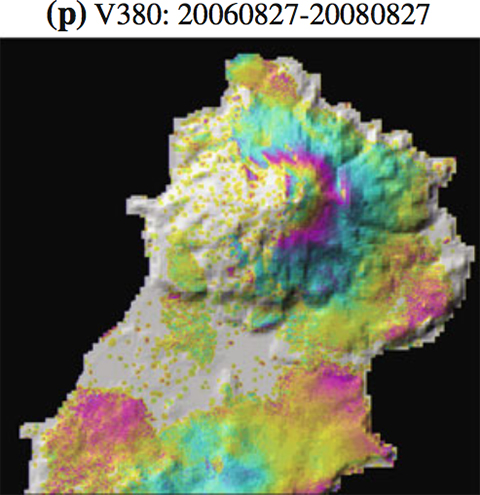
Observed C-band interferogram showing time-varying deformation near the summit of Kiska Volcano. A full cycle of colors (i.e., one interferometric fringe) represents 2.83 cm of surface displacement along the LOS. A color progression from red to yellow to blue represents an increase in LOS distance as a result of surface subsidence; the opposite progression represents LOS shortening (surface uplift). Areas lacking interferometric coherence are uncolored. Interferometric phase images are shown superimposed on the shaded-relief image. From: Lu and Dzurisin 2014. https://volcano.si.edu/volcano.cfm?vn=311020&vtab=Deformation |
|
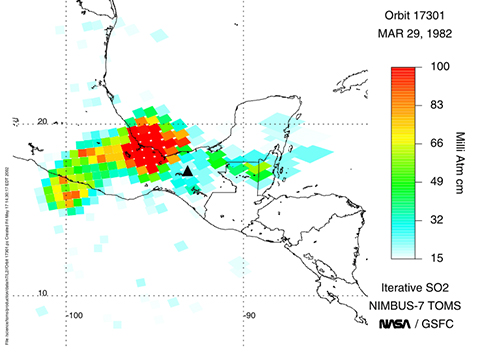
Gases. Volcanoes emit lots of gas, indeed these gases are what drive eruptions and make some eruptions explosive. Water, followed by CO2, and then sulfur (in various species) compose the majority of the erupted gases. Changes in the ratios of the different gas species can indicate a new batch of magma, changes in the depth at which a magma degases, or changes in the magma plumbing system. In addition, sulfur species erupted by volcanoes react with the atmosphere to form SO2, which is observable by satellite, allowing tracking of volcanic plumes and estimates of eruption size. |
|
|
|
TOMS measurement of SO2 emission from El Chichón volcano. NASA Goddard Space Flight Center. |
|
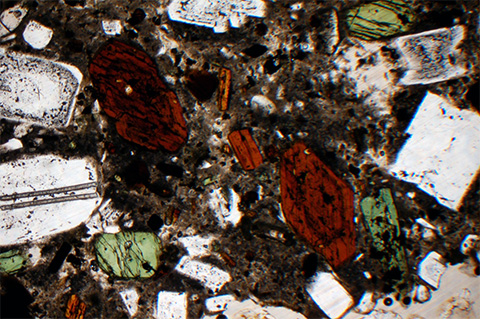
Petrology. The mineral compositions and assemblage present in a volcanic rock provide information on magmatic conditions (depth and temperature) prior to or during eruption of that rock and sometimes the speed with which the magma ascended to the surface. Volcanologists analyze rocks from previous eruptions to understand likely conditions from which future or current activity may arise, and to help interpret seismic unrest, deformation, and degassing. |
|
|
|
Photomicrograph of El Chichón Unit B (~550 yBP) trachyandesite. The assemblage and compositions of plagioclase feldspar (white), hornblende (brown), and clinopyroxene (green) indicate pre-eruption storage at ~5-6 km and ~825°C, with frequent episodes of magma recharge. Field of View is 2.5 cm. Image credit, B. Andrews. |
|
New Technologies
|
|
|
Interview with Diana Roman, Earth and Planets Laboratory, Carnegie Institution for Science. Technology advancements in volcano monitoring techniques have been immense over the past 40 years, since the Mount St. Helens 1980 eruption. Volcanologist Diana Roman takes us through some of the big advancements in seismology, geophysics, and petrology, that help us monitor volcanoes in real time, from our kitchen tables. |
|