Recently Published Bulletin Reports
Agung (Indonesia) Three eruptive events reported in April, May, and December 2022
Tengger Caldera (Indonesia) Minor ash emission in December 2023; persistent weak thermal anomaly in the Bromo crater
Saunders (United Kingdom) Persistent thermal anomalies from the summit crater lava lake during February 2023-January 2024
Shishaldin (United States) New eruption with significant Strombolian explosions, ash plumes, and ashfall
Ioto (Japan) New eruption with discolored water, ejecta, and floating pumice during October-December 2023
Purace (Colombia) Gas-and-ash emission on 16 November 2023
Etna (Italy) Strombolian explosions, lava fountains, and lava flows during July-August 2023
Suwanosejima (Japan) Eruption plumes, crater incandescence, and occasional explosions during July-October 2023
Aira (Japan) Explosions, ash plumes, ash fall, and crater incandescence during July-October 2023
Nishinoshima (Japan) Gray emissions during October 2023
Kilauea (United States) Strong lava fountains, lava flows, and spatter at Halema’uma’u during January-September 2023
Tinakula (Solomon Islands) Continued lava flows and thermal activity during June through November 2023
Agung (Indonesia) — January 2024  Cite this Report
Agung
Indonesia
8.343°S, 115.508°E; summit elev. 2997 m
All times are local (unless otherwise noted)
Three eruptive events reported in April, May, and December 2022
Mount Agung, located on the E end of the island of Bali, Indonesia, rises above the SE rim of the Batur caldera. The summit area extends 1.5 km E-W, with the highest point on the W and a steep-walled 800-m-wide crater on the E. Recorded eruptions date back to the early 19th century. A large and deadly explosive and effusive eruption occurred during 1963-64, which was characterized by voluminous ashfall, pyroclastic flows, and lahars that caused extensive damage and many fatalities. More recent activity was documented during November 2017-June 2019 that consisted of multiple explosions, significant ash plumes, lava flows at the summit crater, and incandescent ejecta. This report covers activity reported during April-May 2022 and December 2022 based on data from the Darwin Volcanic Ash Advisory Center (VAAC).
Activity during 2022 was relatively low and mainly consisted of a few ash plumes during April-May and December. An ash plume on 3 April rising to 3.7 km altitude (700 m above the summit) and drifting N was reported in a Darwin VAAC notice based on a ground report, with ash seen in HIMAWARI-8 visible imagery. Another ash plume was reported at 1120 on 27 May that rose to 5.5 km altitude (2.5 m above the summit); the plume was not visible in satellite or webcam images due to weather clouds. An eruption was reported based on seismic data at 0840 on 13 December, with an estimated plume altitude of 3.7 km; however, no ash was seen using satellite imagery in clear conditions before weather clouds obscured the summit.
Geologic Background. Symmetrical Agung stratovolcano, Bali's highest and most sacred mountain, towers over the eastern end of the island. The volcano, whose name means "Paramount," rises above the SE rim of the Batur caldera, and the northern and southern flanks extend to the coast. The summit area extends 1.5 km E-W, with the high point on the W and a steep-walled 800-m-wide crater on the E. The Pawon cone is located low on the SE flank. Only a few eruptions dating back to the early 19th century have been recorded in historical time. The 1963-64 eruption, one of the largest in the 20th century, produced voluminous ashfall along with devastating pyroclastic flows and lahars that caused extensive damage and many fatalities.
Information Contacts: Darwin Volcanic Ash Advisory Centre (VAAC), Bureau of Meteorology, Northern Territory Regional Office, PO Box 40050, Casuarina, NT 0811, Australia (URL: http://www.bom.gov.au/info/vaac/).
Tengger Caldera (Indonesia) — February 2024 Cite this Report
Tengger Caldera
Indonesia
7.942°S, 112.95°E; summit elev. 2329 m
All times are local (unless otherwise noted)
Minor ash emission in December 2023; persistent weak thermal anomaly in the Bromo crater
Tengger Caldera, located at the N end of a volcanic massif in Indonesia’s East Java, consists of five overlapping stratovolcanoes. The youngest and only active cone in the 16-km-wide caldera is Bromo, which typically produces gas-and-steam plumes, occasional ash plumes and explosions, and weak thermal signals (BGVN 44:05, 47:01). This report covers activity during January 2022-December 2023, consisting of mostly white gas-and-steam emissions and persistent weak thermal anomalies. Information was provided by the Pusat Vulkanologi dan Mitigasi Bencana Geologi (PVMBG, also known as Indonesian Center for Volcanology and Geological Hazard Mitigation, CVGHM) and satellite imagery. The Alert Level remained at 2 (on a scale of 1-4), and visitors were warned to stay at least 1 km from the crater.
Activity was generally low during the reporting period, similar to that in 2021. According to almost daily images from MAGMA Indonesia (a platform developed by PVMBG), white emissions and plumes rose from 50 to 900 m above the main crater during this period (figure 24). During several days in March and June 2022, white plumes reached heights of 1-1.2 km above the crater.
After an increase in activity at 2114 on 3 February 2023, a PVMBG team that was sent to observe white emissions rising as high as 300 m during 9-12 February and heard rumbling noises. A sulfur dioxide odor was also strong near the crater and measurements indicated that levels were above the healthy (non-hazardous) threshold of 5 parts per million; differential optical absorption spectroscopy (DOAS) measurements indicated an average flux of 190 metric tons per day on 11 February. Incandescence originating from a large fumarole in the NNW part of the crater was visible at night. The team observed that vegetation on the E caldera wall was yellow and withered. The seismic network recorded continuous tremor and deep and shallow volcanic earthquakes.
According to a PVMBG press release, activity increased on 13 December 2023 with white, gray, and brown emissions rising as high as 900 m above Bromo’s crater rim and drifting in multiple directions (figure 25). The report noted that tremor was continuous and was accompanied in December by three volcanic earthquakes. Deformation data indicated inflation in December. There was no observable difference in the persistent thermal anomaly in the crater between 11 and 16 December 2023.
All clear views of the Bromo crater throughout this time, using Sentinel-2 infrared satellite images, showed a weak persistent thermal anomaly; none of the anomalies were strong enough to cause MODVOLC Thermal Alerts. A fire in the SE part of the caldera in early September 2023 resulted in a brief period of strong thermal anomalies.
Geologic Background. The 16-km-wide Tengger caldera is located at the northern end of a volcanic massif extending from Semeru volcano. The massive volcanic complex dates back to about 820,000 years ago and consists of five overlapping stratovolcanoes, each truncated by a caldera. Lava domes, pyroclastic cones, and a maar occupy the flanks of the massif. The Ngadisari caldera at the NE end of the complex formed about 150,000 years ago and is now drained through the Sapikerep valley. The most recent of the calderas is the 9 x 10 km wide Sandsea caldera at the SW end of the complex, which formed incrementally during the late Pleistocene and early Holocene. An overlapping cluster of post-caldera cones was constructed on the floor of the Sandsea caldera within the past several thousand years. The youngest of these is Bromo, one of Java's most active and most frequently visited volcanoes.
Information Contacts: Pusat Vulkanologi dan Mitigasi Bencana Geologi (PVMBG, also known as Indonesian Center for Volcanology and Geological Hazard Mitigation, CVGHM), Jalan Diponegoro 57, Bandung 40122, Indonesia (URL: http://www.vsi.esdm.go.id/); MAGMA Indonesia, Kementerian Energi dan Sumber Daya Mineral (URL: https://magma.esdm.go.id/v1); Copernicus Browser, Copernicus Data Space Ecosystem, European Space Agency (URL: https://dataspace.copernicus.eu/browser/); Hawai'i Institute of Geophysics and Planetology (HIGP) - MODVOLC Thermal Alerts System, School of Ocean and Earth Science and Technology (SOEST), Univ. of Hawai'i, 2525 Correa Road, Honolulu, HI 96822, USA (URL: http://modis.higp.hawaii.edu/).
Saunders (United Kingdom) — February 2024 Cite this Report
Saunders
United Kingdom
57.8°S, 26.483°W; summit elev. 843 m
All times are local (unless otherwise noted)
Persistent thermal anomalies from the summit crater lava lake during February 2023-January 2024
Saunders is one of eleven islands that comprise the South Sandwich Islands in the South Atlantic. The active Mount Michael volcano has been in almost continuous eruption since November 2014 (BGVN 48:02). Recent activity has resulted in intermittent thermal anomalies and gas-and-steam emissions (BGVN 47:03, 48:02). Visits are infrequent due to its remote location, and cloud cover often prevents satellite observations. Satellite thermal imagery and visual observation of incandescence during a research expedition in 2019 (BGVN 28:02 and 44:08) and a finding confirmed by a National Geographic Society research team that summited Michael in November 2022 reported the presence of a lava lake.
Although nearly constant cloud cover during February 2023 through January 2024 greatly limited satellite observations, thermal anomalies from the lava lake in the summit crater were detected on clear days, especially around 20-23 August 2023. Anomalies similar to previous years (eg. BGVN 48:02) were seen in both MIROVA (Middle InfraRed Observation of Volcanic Activity) data from MODIS instruments and in Sentinel 2 infrared imagery. The only notable sulfur dioxide plume detected near Saunders was on 25 September 2023, with the TROPOMI instrument aboard the Sentinel-5P satellite.
Geologic Background. Saunders Island consists of a large central volcanic edifice intersected by two seamount chains, as shown by bathymetric mapping (Leat et al., 2013). The young Mount Michael stratovolcano dominates the glacier-covered island, while two submarine plateaus, Harpers Bank and Saunders Bank, extend north. The symmetrical Michael has a 500-m-wide summit crater and a remnant of a somma rim to the SE. Tephra layers visible in ice cliffs surrounding the island are evidence of recent eruptions. Ash clouds were reported from the summit crater in 1819, and an effusive eruption was inferred to have occurred from a N-flank fissure around the end of the 19th century and beginning of the 20th century. A low ice-free lava platform, Blackstone Plain, is located on the north coast, surrounding a group of former sea stacks. A cluster of cones on the SE flank, the Ashen Hills, appear to have been modified since 1820 (LeMasurier and Thomson, 1990). Analysis of satellite imagery available since 1989 (Gray et al., 2019; MODVOLC) suggests frequent eruptive activity (when weather conditions allow), volcanic clouds, steam plumes, and thermal anomalies indicative of a persistent, or at least frequently active, lava lake in the summit crater. Due to this observational bias, there has been a presumption when defining eruptive periods that activity has been ongoing unless there is no evidence for at least 10 months.
Information Contacts: MIROVA (Middle InfraRed Observation of Volcanic Activity), a collaborative project between the Universities of Turin and Florence (Italy) supported by the Centre for Volcanic Risk of the Italian Civil Protection Department (URL: http://www.mirovaweb.it/); NASA Global Sulfur Dioxide Monitoring Page, Atmospheric Chemistry and Dynamics Laboratory, NASA Goddard Space Flight Center (NASA/GSFC), 8800 Greenbelt Road, Goddard MD 20771, USA (URL: https://so2.gsfc.nasa.gov/); Copernicus Browser (URL: https://dataspace.copernicus.eu/browser).
Shishaldin (United States) — December 2023 Cite this Report
Shishaldin
United States
54.756°N, 163.97°W; summit elev. 2857 m
All times are local (unless otherwise noted)
New eruption with significant Strombolian explosions, ash plumes, and ashfall
Shishaldin is located on the eastern half of Unimak Island, one of the Aleutian Islands. Frequent explosive activity, primarily consisting of Strombolian ash eruptions from the small summit crater, but sometimes producing lava flows, has been recorded since the 18th century. The previous eruption ended in May 2020 and was characterized by intermittent thermal activity, increased seismicity and surface temperatures, ash plumes, and ash deposits (BGVN 45:06). This report covers a new eruption during July through November 2023, which consisted of significant explosions, ash plumes, ashfall, and lava fountaining. Information comes from daily, weekly, and special reports from the Alaska Volcano Observatory (AVO) and various satellite data. AVO monitors the volcano using local seismic and infrasound sensors, satellite data, web cameras, and remote infrasound and lightning networks.
AVO reported that intermittent tremor and low-frequency earthquakes had gradually become more regular and consistent during 10-13 July. Strongly elevated surface temperatures at the summit were identified in satellite images during 10-13 July. On 11 July AVO raised the Aviation Color Code (ACC) to Yellow (the second color on a four-color scale) and Volcano Alert Level (VAL) to Advisory (the second level on a four-level scale) at 1439. Later in the day on 11 July summit crater incandescence was observed in webcam images. Observations of the summit suggested that lava was likely present at the crater, which prompted AVO to raise the ACC to Orange (the second highest color on a four-color scale) and the VAL to Watch (the second highest level on a four-level scale). The US Coast Guard conducted an overflight on 12 July and confirmed that lava was erupting from the summit. That same day, sulfur dioxide emissions were detected in satellite images.
A significant explosion began at 0109 on 14 July that produced an ash plume that rose to 9-12 km altitude and drifted S over the Pacific Ocean (figure 43). Webcam images and photos taken around 0700 from a ship SW off Unimak Island showed small lahar deposits, which were the result of the interaction of hot pyroclastic material and snow and ice on the flanks. There was also ashfall on the SW and N flanks. A smaller explosion at 0710 generated an ash plume that rose to 4.5 km altitude. Webcam images and pilot reports showed continued low-level ash emissions during the morning, rising to less than 4.6 km altitude; those emissions included a small ash plume near the summit around 1030 resulting from a small explosion.
Seismic tremor amplitude began increasing at around 1700 on 15 July; strongly elevated surface temperatures were also reported. An ash plume rose to 4.6 km altitude and drifted SSE at 2100, based on a satellite image. A continuous ash plume during 2150 through 2330 rose to 5 km altitude and extended 125 km S. At 2357 AVO raised the ACC to Red (the highest color on a four-color scale) and the VAL to Warning (the highest level on a four-level scale), noting that seismicity remained elevated for more than six hours and explosion signals were frequently detected by regional infrasound (pressure sensor) networks. Explosions generated an ash plume that rose to 4.9 km altitude and drifted as far as 500 km SE. Activity throughout the night declined and by 0735 the ACC was lowered to Orange and the VAL to Watch. High-resolution satellite images taken on 16 July showed pyroclastic deposits extending as far as 3 km from the vent; these deposits generated lahars that extended further down the drainages on the flanks. Ash deposits were mainly observed on the SSE flank and extended to the shore of Unimak Island. During 16-17 July lava continued to erupt at the summit, which caused strongly elevated surface temperatures that were visible in satellite imagery.
Lava effusion increased at 0100 on 18 July, as noted in elevated surface temperatures identified in satellite data, increasing seismic tremor, and activity detected on regional infrasound arrays. A significant ash plume at 0700 rose to 7 km altitude and continued until 0830, eventually reaching 9.1 km altitude and drifting SSE (figure 44). As a result, the ACC was raised to Red and the VAL to Warning. By 0930 the main plume detached, but residual low-level ash emissions continued for several hours, remaining below 3 km altitude and drifting S. The eruption gradually declined and by 1208 the ACC was lowered to Orange and the VAL was lowered to Watch. High-resolution satellite images showed ash deposits on the SW flank and pyroclastic deposits on the N, E, and S flanks, extending as far as 3 km from the vent; lahars triggered by the eruption extended farther down the flanks (figure 45). Lava continued to erupt from the summit crater on 19 July.
Elevated surface temperatures were detected in satellite images during 19-25 July, despite occasional weather cloud cover, which was consistent with increased lava effusion. During 22-23 July satellite observations acquired after the eruption from 18 July showed pyroclastic flow and lahar deposits extending as far as 3 km down the N, NW, and NE flanks and as far as 1.5 km down the S and SE flanks. Ash deposits covered the SW and NE flanks. No lava flows were observed outside the crater. On 22 July a sulfur dioxide plume was detected in satellite data midday that had an estimated mass of 10 kt. In a special notice issued at 1653 on 22 July AVO noted that eruptive activity had intensified over the previous six hours, which was characterized by an hours-long steady increase in seismic tremor, intermittent infrasound signals consistent with small explosions, and an increase in surface temperatures that were visible in satellite data. Pilots first reported low-level ash plumes at around 1900. At 2320 an ash plume had risen to 9 km altitude based on additional pilot reports and satellite images. The ACC was increased to Red and the VAL to Warning at 2343. Satellite images indicated growth of a significantly higher ash plume that rose to 11 km altitude continued until 0030 and drifted NE. During the early morning hours of 23 July ash plumes had declined to 4.6 k altitude. Seismic tremor peaked at 0030 on 23 July and began to rapidly decline at 0109; active ash emissions were no longer visible in satellite data by 0130. The ACC was lowered to Orange and the VAL to Watch at 0418; bursts of increased seismicity were recorded throughout the morning, but seismicity generally remained at low levels. Elevated surface temperatures were visible in satellite data until about 0600. On 24 July pilots reported seeing vigorous gas-and-steam plumes rising to about 3 km altitude; the plumes may have contained minor amounts of ash.
During 24-25 July low level seismicity and volcanic tremor were detected at low levels following the previous explosion on 23 July. Strongly elevated surface temperatures were observed at the summit crater in satellite data. Around 2200 on 25 July seismicity began to increase, followed by infrasound signals of explosions after 0200 on 26 July. An ash plume rose to 3 km altitude at 0500 and drifted ENE, along with an associated sulfur dioxide plume that drifted NE and had an estimated mass of 22 kt. Diffuse ash emissions were visible in satellite data and rose to 6.1-7.6 km altitude and extended 125 km from the volcano starting around 1130. These ash events were preceded by about seven hours of seismic tremor, infrasound detections of explosions, and five hours of increased surface temperatures visible in satellite data. Activity began to decline around 1327, which included low-frequency earthquakes and decreased volcanic tremor, and infrasound data no longer detected significant explosions. Surface temperatures remained elevated through the end of the month.
Seismicity, volcanic tremor, and ash emissions remained at low levels during early August. Satellite images on 1 August showed that some slumping had occurred on the E crater wall due to the recent explosive activity. Elevated surface temperatures continued, which was consistent with cooling lava. On 2 August small explosive events were detected, consistent with low-level Strombolian activity. Some episodes of volcanic tremor were reported, which reflected low-level ash emissions. Those ash emissions rose to less than 3 km altitude and drifted as far as 92.6 km N. Pilots that were located N of the volcano observed an ash plume that rose to 2.7 km altitude. Seismicity began to increase in intensity around 0900 on 3 August. Seismicity continued to increase throughout the day and through the night with strongly elevated surface temperatures, which suggested that lava was active at the surface.
An ash cloud that rose to 7.6-7.9 km altitude and drifted 60-75 km NE was visible in a satellite image at 0520 on 4 August. Pilots saw and reported the plume at 0836 (figure 46). By 0900 the plume had risen to 9.1 km altitude and extended over 100 km NE. AVO raised the ACC to Red and the VAL to Warning as a result. Seismic tremor levels peaked at 1400 and then sharply declined at 1500 to slightly elevated levels; the plume was sustained during the period of high tremor and drifted N and NE. The ACC was lowered to Orange and the VAL to Watch at 2055. During 5-14 August seismicity remained low and surface temperatures were elevated based on satellite data due to cooling lava. On 9 August a small lava flow was observed that extended from the crater rim to the upper NE flank. It had advanced to 55 m in length and appeared in satellite imagery on 11 August. Occasional gas-and-steam plumes were noted in webcam images. At 1827 AVO noted that seismic tremor had steadily increased during the afternoon and erupting lava was visible at the summit in satellite images.
Strong explosion signals were detected at 0200 on 15 August. An ash cloud that was visible in satellite data extended 100 km NE and may have risen as high as 11 km altitude around 0240. By 0335 satellite images showed the ash cloud rising to 7.6 km altitude and drifting NE. Significant seismicity and explosions were detected by the local AVO seismic and infrasound networks, and volcanic lightning was detected by the World Wide Lightning Location Network (WWLLN). A sulfur dioxide plume associated with the eruption drifted over the S Bering Sea and parts of Alaska and western Canada. Seismicity was significantly elevated during the eruption but had declined by 1322. A pilot reported that ash emissions continued, rising as high as 4.9 km altitude. Elevated surface temperatures detected in satellite data were caused by hot, eruptive material (pyroclastic debris and lava) that accumulated around the summit. Eruptive activity declined by 16 August and the associated sulfur dioxide plume had mostly dissipated; remnants continued to be identified in satellite images at least through 18 August. Surface temperatures remained elevated based on satellite images, indicating hot material on the upper parts of the volcano. Small explosions were detected in infrasound data on the morning of 19 August and were consistent with pilot reports of small, short-lived ash plumes that rose to about 4.3 km altitude. Low-level explosive activity was reported during 20-24 August, according to seismic and infrasound data, and weather clouds sometimes prevented views. Elevated surface temperatures were observed in satellite images, which indicated continued hot material on the upper parts of the volcano.
Seismic tremor began to increase at around 0300 on 25 August and was followed by elevated surface temperatures identified in satellite images, consistent with erupting lava. Small explosions were recorded in infrasound data. The ACC was raised to Red and the VAL to Warning at 1204 after a pilot reported an ash plume that rose to 9.1 km altitude. Seismicity peaked at 1630 and began to rapidly decline at around 1730. Ash plumes rose as high as 10 km altitude and drifted as far as 400 km NE. By 2020 the ash plumes had declined to 6.4 km altitude and continued to drift NE. Ash emissions were visible in satellite data until 0000 on 26 August and seismicity was at low levels. AVO lowered the ACC to Orange and the VAL to Watch at 0030. Minor explosive activity within the summit crater was detected during 26-28 August and strongly elevated surface temperatures were still visible in satellite imagery through the rest of the month. An AVO field crew working on Unimak Island observed a mass flow that descended the upper flanks beginning around 1720 on 27 August. The flow produced a short-lived ash cloud that rose to 4.5 km altitude and rapidly dissipated. The mass flow was likely caused by the collapse of spatter that accumulated on the summit crater rim.
Similar variable explosive activity was reported in September, although weather observations sometimes prevented observations. A moderate resolution satellite image from the afternoon of 1 September showed gas-and-steam emissions filling the summit crater and obscuring views of the vent. In addition, hot deposits from the previous 25-26 August explosive event were visible on the NE flank near the summit, based on a 1 September satellite image. On 2 and 4 September seismic and infrasound data showed signals of small, repetitive explosions. Variable gas-and-steam emissions from the summit were visible but there was no evidence of ash. Possible summit crater incandescence was visible in nighttime webcam images during 3-4 September.
Seismicity began to gradually increase at around 0300 on 5 September and activity escalated at around 0830. A pilot reported an ash plume that rose to 7.6 km altitude at 0842 and continued to rise as high as possibly 9.7 km altitude and drifted SSE based on satellite images (figure 47). The ACC was raised to Red and the VAL to Warning at 0900. In addition to strong tremor and sustained explosions, the eruption produced volcanic lightning that was detected by the WWLLN. Around 1100 seismicity decreased and satellite data confirmed that the altitude of the ash emissions had declined to 7.6 km altitude. By 1200 the lower-altitude portion of the ash plume had drifted 125 km E. Significant ash emissions ended by 1330 based on webcam images. The ACC was lowered to Orange and the VAL to Watch at 1440. Satellite images showed extensive pyroclastic debris flows on most of the flanks that extended 1.2-3.3 km from the crater rim.
During 6-13 September elevated surface temperatures continued to be observed in satellite data, seismicity remained elevated with weak but steady tremor, and small, low-frequency earthquakes and small explosions were reported, except on 12 September. On 6 September a low-level ash plume rose to 1.5-1.8 km altitude and drifted SSE. Occasional small and diffuse gas-and-steam emissions at the summit were visible in webcam images. Around 1800 on 13 September seismic tremor amplitudes began to increase, and small explosions were detected in seismic and infrasound data. Incandescent lava at the summit was seen in a webcam image taken at 0134 on 14 September during a period of elevated tremor. No ash emissions were reported during the period of elevated seismicity. Lava fountaining began around 0200, based on webcam images. Satellite-based radar observations showed that the lava fountaining activity led to the growth of a cone in the summit crater, which refilled most of the crater. By 0730 seismicity significantly declined and remained at low levels.
Seismic tremor began to increase around 0900 on 15 September and rapidly intensified. An explosive eruption began at around 1710, which prompted AVO to raise the ACC to Red and the VAL to Warning. Within about 30 minutes ash plumes drifted E below a weather cloud at 8.2 km altitude. The National Weather Service estimated that an ash-rich plume rose as high as 12.8 km altitude and produced volcanic lightning. The upper part of the ash plume detached from the vent around 1830 and drifted E, and was observed over the Gulf of Alaska. Around the same time, seismicity dramatically decreased. Trace ashfall was reported in the community of False Pass (38 km ENE) between 1800-2030 and also in King Cove and nearby marine waters. Activity declined at around 1830 although seismicity remained elevated, ash emissions, and ashfall continued until 2100. Lightning was again detected beginning around 1930, which suggested that ash emissions continued. Ongoing explosions were detected in infrasound data, at a lower level than during the most energetic phase of this event. Lightning was last detected at 2048. By 2124 the intensity of the eruption had decreased, and ash emissions were likely rising to less than 6.7 km altitude. Seismicity returned to pre-eruption levels. On 16 September the ACC was lowered to Orange and the VAL to Watch at 1244; the sulfur dioxide plume that was emitted from the previous eruption event was still visible over the northern Pacific Ocean. Elevated surface temperatures, gas-and-steam emissions from the vent, and new, small lahars were reported on the upper flanks based on satellite and webcam images. Minor deposits were reported on the flanks which were likely the result of collapse of previously accumulated lava near the summit crater.
Elevated seismicity with tremor, small earthquakes, and elevated surface temperatures were detected during 17-23 September. Minor gas-and-steam emissions were visible in webcam images. On 20 September small volcanic debris flows were reported on the upper flanks. On 21 September a small ash deposit was observed on the upper flanks extending to the NE based on webcam images. Seismic tremor increased significantly during 22-23 September. Regional infrasound sensors suggested that low-level eruptive activity was occurring within the summit crater by around 1800 on 23 September. Even though seismicity was at high levels, strongly elevated surface temperatures indicating lava at the surface were absent and no ash emissions were detected; weather clouds at 0.6-4.6 km altitude obscured views. At 0025 on 24 September AVO noted that seismicity continued at high levels and nearly continuous small infrasound signals began, likely from low-level eruptive activity. Strongly elevated surface temperatures were identified in satellite images by 0900 and persisted throughout the day; the higher temperatures along with infrasound and seismic data were consistent with lava erupting at the summit. Around 1700 similarly elevated surface temperatures were detected from the summit in satellite data, which suggested that more vigorous lava fountaining had started. Starting around 1800 low-level ash emissions rose to altitudes less than 4.6 km altitude and quickly dissipated.
Beginning at midnight on 25 September, a series of seismic signals consistent with volcanic flows were recorded on the N side of the volcano. A change in seismicity and infrasound signals occurred around 0535 and at 0540 a significant ash cloud formed and quickly reached 14 km altitude and drifted E along the Alaska Peninsula. The cloud generated at least 150 lightning strokes with thunder that could be heard by people in False Pass. Seismicity rapidly declined to near background levels around 0600. AVO increased the ACC to Red and the VAL to Warning at 0602. The ash cloud detached from the volcano at around 0700, rose to 11.6 km altitude, and drifted ESE. Trace to minor amounts of ashfall were reported by the communities of False Pass, King Cove, Cold Bay, and Sand Point around 0700. Ash emissions continued at lower altitudes of 6-7.6 km altitude at 0820. Small explosions at the vent area continued to be detected in infrasound data and likely represented low-level eruptive activity near the vent. Due to the significant decrease in seismicity and ash emissions the ACC was lowered to Orange and the VAL to Watch at 1234. Radar data showed significant collapses of the crater that occurred on 25 September. Satellite data also showed significant hot, degassing pyroclastic and lahar deposits on all flanks, including more extensive flows on the ENE and WSW sections below two new collapse scarps. Following the significant activity during 24-25 September, only low-level activity was observed. Seismicity decreased notably near the end of the strong activity on 25 September and continued to decrease through the end of the month, though tremor and small earthquakes were still reported. No explosive activity was detected in infrasound data through 2 October. Gas-and-steam emissions rose to 3.7 km altitude, as reported by pilots and seen in satellite images. Satellite data from 26 September showed that significant collapses had occurred at the summit crater and hot, steaming deposits from pyroclastic flows and lahars were present on all the flanks, particularly to the ENE and WSW. A small ash cloud was visible in webcam images on 27 September, likely from a collapse at the summit cone. High elevated surface temperatures were observed in satellite imagery during 27-28 September, which were likely the result of hot deposits on the flanks erupted on 25 September. Minor steaming at the summit crater and from an area on the upper flanks was visible in webcam images on 28 September.
During October, explosion events continued between periods of low activity. Seismicity significantly increased starting at around 2100 on 2 October; around the same time satellite images showed an increase in surface temperatures consistent with lava fountaining. Small, hot avalanches of rock and lava descended an unspecified flank. In addition, a distinct increase in infrasound, seismicity, and lightning detections was followed by an ash plume that rose to 12.2 km altitude and drifted S and E at 0520 on 3 October, based on satellite images. Nighttime webcam images showed incandescence due to lava fountaining at the summit and pyroclastic flows descending the NE flank. AVO reported that a notable explosive eruption started at 0547 and lasted until 0900 on 3 October, which prompted a rise in the ACC to Red and the VAL to Warning. Subsequent ash plumes rose to 6-7.6 km altitude by 0931. At 1036 the ACC was lowered back to Orange and the VAL to Watch since both seismic and infrasound data quieted substantially and were slightly above background levels. Gas-and-steam emissions were observed at the summit, based on webcam images. Trace amounts of ashfall were observed in Cold Bay. Resuspended ash was present at several kilometers altitude near the volcano. During the afternoon, low-level ash plumes were visible at the flanks, which appeared to be largely generated by rock avalanches off the summit crater following the explosive activity. These ash plumes rose to 3 km altitude and drifted W. Trace amounts of ashfall were reported by observers in Cold Bay and Unalaska and flights to these communities were disrupted by the ash cloud. Satellite images taken after the eruption showed evidence of pyroclastic flows and lahar deposits in drainages 2 km down the SW flank and about 3.2 km down the NE flank, and continued erosion of the crater rim. Small explosion craters at the end of the pyroclastic flows on the NE flank were noted for the first time, which may have resulted from gas-and-steam explosions when hot deposits interact with underlying ice.
During 4 October seismicity, including frequent small earthquakes, remained elevated, but was gradually declining. Ash plumes were produced for over eight hours until around 1400 that rose to below 3.7 km altitude. These ash plumes were primarily generated off the sides of the volcano where hot rock avalanches from the crater rim had entered drainages to the SW and NE. Two explosion craters were observed at the base of the NE deposits about 3.2 km from the crater rim. Webcam images showed the explosion craters were a source of persistent ash emissions; occasional collapse events also generated ash. Seismicity remained elevated with sulfur dioxide emissions that had a daily average of more than 1,000 tons per day, and frequent small earthquakes through the end of the month. Frequent elevated surface temperatures were identified in satellite images and gas-and-steam plumes were observed in webcam images, although weather conditions occasionally prevented clear views of the summit. Emissions were robust during 14-16 October and were likely generated by the interaction of hot material and snow and ice. During the afternoon of 21 October a strong gas-and-steam plume rose to 3-4.6 km altitude and extended 40 km WSW, based on satellite images and reports from pilots. On 31 October the ACC was lowered to Yellow and the VAL was lowered to Advisory.
Activity in November was characterized by elevated seismicity with ongoing seismic tremor and small, low-frequency earthquakes, elevated surface temperatures, and gas-and-steam emissions. There was an increase in seismic and infrasound tremor amplitudes starting at 1940 on 2 November. As a result, the ACC was again raised to Orange and the VAL was increased to Watch, although ash was not identified in satellite data. An ash cloud rose to 6.1 km altitude and drifted W according to satellite data at 2000. By 0831 on 3 November ash emissions were no longer visible in satellite images. On 6 and 9 November air pressure sensors detected signals consistent with small explosions. Small explosions were detected in infrasound data consistent with weak Strombolian activity on 19 and 21 November. Seismicity started to decrease on 21 November. On 25 November gas-and-steam emissions were emitted from the vent as well as from a scarp on the NE side of the volcano near the summit. A gas-and-steam plume extended about 50 km SSE and was observed in satellite and webcam images on 26 November. On 28 November small explosions were observed in seismic and local infrasound data and gas-and-steam emissions were visible from the summit and from the upper NE collapse scarp based on webcam images. Possible small explosions were observed in infrasound data on 30 November. Weakly elevated surface temperatures and a persistent gas-and-steam plume from the summit and collapse scarps on the upper flanks. A passing aircraft reported the gas-and-steam plume rose to 3-3.4 km altitude on 30 November, but no significant ash emissions were detected.
Satellite data. MODIS thermal anomaly data provided through MIROVA (Middle InfraRed Observation of Volcanic Activity) showed a strong pulse of thermal activity beginning in July 2023 that continued through November 2023 (figure 48). This strong activity was due to Strombolian explosions and lava fountaining events at the summit crater. According to data from MODVOLC thermal alerts, a total of 101 hotspots were detected near the summit crater in July (11-14, 16-19, 23-24 and 26), August (4, 25-26, and 29), September (5, 12, and 17), and October (3, 4, and 8). Infrared satellite data showed large lava flows descending primarily the northern and SE flanks during the reporting period (figure 49). Sulfur dioxide plumes often exceeded two Dobson Units (DUs) and drifted in different directions throughout the reporting period, based on satellite data from the TROPOMI instrument on the Sentinel-5P satellite (figure 50).
Geologic Background. The symmetrical glacier-covered Shishaldin in the Aleutian Islands is the westernmost of three large stratovolcanoes in the eastern half of Unimak Island. The Aleuts named the volcano Sisquk, meaning "mountain which points the way when I am lost." Constructed atop an older glacially dissected edifice, it is largely basaltic in composition. Remnants of an older edifice are exposed on the W and NE sides at 1,500-1,800 m elevation. There are over two dozen pyroclastic cones on its NW flank, which is covered by massive aa lava flows. Frequent explosive activity, primarily consisting of Strombolian ash eruptions from the small summit crater, but sometimes producing lava flows, has been recorded since the 18th century. A steam plume often rises from the summit crater.
Information Contacts: Alaska Volcano Observatory (AVO), a cooperative program of a) U.S. Geological Survey, 4200 University Drive, Anchorage, AK 99508-4667 USA (URL: https://avo.alaska.edu/), b) Geophysical Institute, University of Alaska, PO Box 757320, Fairbanks, AK 99775-7320, USA, and c) Alaska Division of Geological & Geophysical Surveys, 794 University Ave., Suite 200, Fairbanks, AK 99709, USA (URL: http://dggs.alaska.gov/); MIROVA (Middle InfraRed Observation of Volcanic Activity), a collaborative project between the Universities of Turin and Florence (Italy) supported by the Centre for Volcanic Risk of the Italian Civil Protection Department (URL: http://www.mirovaweb.it/); Hawai'i Institute of Geophysics and Planetology (HIGP) - MODVOLC Thermal Alerts System, School of Ocean and Earth Science and Technology (SOEST), Univ. of Hawai'i, 2525 Correa Road, Honolulu, HI 96822, USA (URL: http://modis.higp.hawaii.edu/); NASA Global Sulfur Dioxide Monitoring Page, Atmospheric Chemistry and Dynamics Laboratory, NASA Goddard Space Flight Center (NASA/GSFC), 8800 Greenbelt Road, Goddard, Maryland, USA (URL: https://so2.gsfc.nasa.gov/); Copernicus Browser, Copernicus Data Space Ecosystem, European Space Agency (URL: https://dataspace.copernicus.eu/browser/).
Ioto
Japan
24.751°N, 141.289°E; summit elev. 169 m
All times are local (unless otherwise noted)
New eruption with discolored water, ejecta, and floating pumice during October-December 2023
Ioto (Iwo-jima), located about 1,200 km S of Tokyo, lies within a 9-km-wide submarine caldera along the Izu-Bonin-Mariana volcanic arc. Previous eruptions date back to 1889 and have consisted of dominantly phreatic explosions, pumice deposits during 2001, and discolored water. A submarine eruption during July through December 2022 was characterized by discolored water, pumice deposits, and gas emissions (BGVN 48:01). This report covers a new eruption during October through December 2023, which consisted of explosions, black ejecta, discolored water, and floating pumice, based on information from the Japan Meteorological Association (JMA), the Japan Coast Guard (JCG), and satellite data.
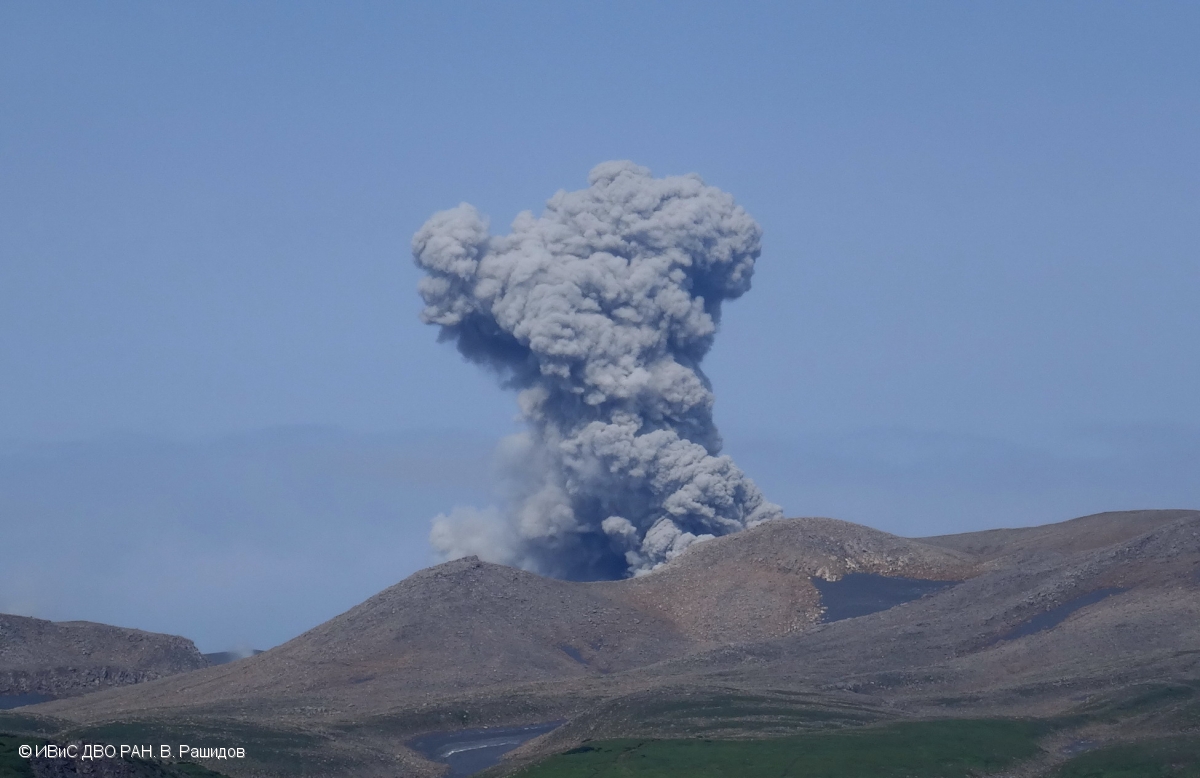
JMA reported that an eruption had been occurring offshore of Okinahama on the SE side of the island since 21 October, which was characterized by volcanic tremor, according to the Japan Maritime Self-Defense Force (JMSDF) Iwo Jima Air Base (figure 22). According to an 18 October satellite image a plume of discolored water at the site of this new eruption extended NE (figure 23). During an overflight conducted on 30 October, a vent was identified about 1 km off the coast of Okinahama. Observers recorded explosions every few minutes that ejected dark material about 20 m above the ocean and as high as 150 m. Ejecta from the vent formed a black-colored island about 100 m in diameter, according to observations conducted from the air by the Earthquake Research Institute of the University of Tokyo in cooperation with the Mainichi newspaper (figure 24). Occasionally, large boulders measuring more than several meters in size were also ejected. Observations from the Advanced Land Observing Satellite Daichi-2 and Sentinel-2 satellite images also confirmed the formation of this island (figure 23). Brown discolored water and floating pumice were present surrounding the island.
The eruption continued during November. During an overflight on 3 November observers photographed the island and noted that material was ejected 169 m high, according to a news source. Explosions gradually became shorter, and, by the 3rd, they occurred every few seconds; dark and incandescent material were ejected about 800 m above the vent. On 4 November eruptions were accompanied by explosive sounds. Floating, brown-colored pumice was present in the water surrounding the island. There was a brief increase in the number of volcanic earthquakes during 8-14 November and 24-25 November. The eruption temporarily paused during 9-11 November and by 12 November eruptions resumed to the W of the island. On 10 November dark brown-to-dark yellow-green discolored water and a small amount of black floating material was observed (figure 25). A small eruption was reported on 18 November off the NE coast of the island, accompanied by white gas-and-steam plumes (figure 23). Another pause was recorded during 17-19 November, which then resumed on 20 November and continued erupting intermittently. According to a field survey conducted by the National Institute for Disaster Prevention Science and Technology on 19 November, a 30-m diameter crater was visible on the NE coast where landslides, hot water, and gray volcanic ash containing clay have occurred and been distributed previously. Erupted blocks about 10 cm in diameter were distributed about 90-120 m from the crater. JCG made observations during an overflight on 23 November and reported a phreatomagmatic eruption. Explosions at the main vent generated dark gas-and-ash plumes that rose to 200 m altitude and ejected large blocks that landed on the island and in the ocean (figure 26). Discolored water also surrounded the island. The size of the new island had grown to 450 m N-S x 200 m E-W by 23 November, according to JCG.
The eruption continued through 11 December, followed by a brief pause in activity, which then resumed on 31 December, according to JMA. Intermittent explosions produced 100-m-high black plumes at intervals of several minutes to 30 minutes during 1-10 December. Overflights were conducted on 4 and 15 December and reported that the water surrounding the new island was discolored to dark brown-to-dark yellow-green (figure 27). No floating material was reported during this time. In comparison to the observations made on 23 November, the new land had extended N and part of it had eroded away. In addition, analysis by the Geospatial Information Authority of Japan using SAR data from Daichi-2 also confirmed that the area of the new island continued to decrease between 4 and 15 December. Ejected material combined with wave erosion transformed the island into a “J” shape, 500-m-long and with the curved part about 200 m offshore of Ioto. The island was covered with brown ash and blocks, and the surrounding water was discolored to greenish-brown and contained an area of floating pumice. JCG reported from an overflight on 4 December that volcanic ash-like material found around the S vent on the NE part of the island was newly deposited since 10 November (figure 28). By 15 December the N part of the “J” shaped island had separated and migrated N, connecting to the Okinahama coast and the curved part of the “J” had eroded into two smaller islands (figure 27).
References. Ukawa, M., Fujita, E., Kobayashi, T., 2002, Recent volcanic activity of Iwo Jima and the 2001 eruption, Monthly Chikyu, Extra No. 39, 157-164.
Geologic Background. Ioto, in the Volcano Islands of Japan, lies within a 9-km-wide submarine caldera. The volcano is also known as Ogasawara-Iojima to distinguish it from several other "Sulfur Island" volcanoes in Japan. The triangular, low-elevation, 8-km-long island narrows toward its SW tip and has produced trachyandesitic and trachytic rocks that are more alkalic than those of other volcanoes in this arc. The island has undergone uplift for at least the past 700 years, accompanying resurgent doming of the caldera; a shoreline landed upon by Captain Cook's surveying crew in 1779 is now 40 m above sea level. The Motoyama plateau on the NE half of the island consists of submarine tuffs overlain by coral deposits and forms the island's high point. Many fumaroles are oriented along a NE-SW zone cutting through Motoyama. Numerous recorded phreatic eruptions, many from vents on the W and NW sides of the island, have accompanied the uplift.
Information Contacts: Japan Meteorological Agency (JMA), 1-3-4 Otemachi, Chiyoda-ku, Tokyo 100-8122, Japan (URL: http://www.jma.go.jp/jma/indexe.html); Japan Coast Guard (JCG) Volcano Database, Hydrographic and Oceanographic Department, 3-1-1, Kasumigaseki, Chiyoda-ku, Tokyo 100-8932, Japan (URL: https://www1.kaiho.mlit.go.jp/GIJUTSUKOKUSAI/kaiikiDB/kaiyo22-2.htm); Copernicus Browser, Copernicus Data Space Ecosystem, European Space Agency (URL: https://dataspace.copernicus.eu/browser/); Asahi, 5-3-2, Tsukiji, Chuo Ward, Tokyo, 104-8011, Japan (URL: https://www.asahi.com/ajw/articles/15048458).
Purace (Colombia) — December 2023 Cite this Report
Purace
Colombia
2.3095°N, 76.3948°W; summit elev. 4650 m
All times are local (unless otherwise noted)
Gas-and-ash emission on 16 November 2023
Puracé, located in Colombia, is a stratovolcano that contains a 500-m-wide summit crater. It is part of the Los Coconucos volcanic chain that is a NW-SE trending group of seven cones and craters. The most recent eruption occurred during March 2022 that was characterized by frequent seismicity and gas-and-steam emissions (BGVN 47:06). This report covers a brief eruption during November 2023 based on monthly reports from the Popayán Observatory, part of the Servicio Geologico Colombiano (SGC).
Activity during November 2022 through November 2023 primarily consisted of seismicity: VT-type events, LP-type events, HB-type events, and TR-type events (table 4). Maximum sulfur dioxide values were measured weekly and ranged from 259-5,854 tons per day (t/d) during November 2022 through April 2023. White gas-and-steam emissions were also occasionally reported.
SGC issued a report on 25 October that noted a significant increase in the number of earthquakes associated with rock fracturing. These earthquakes were located SE of the crater between Puracé and Piocollo at depths of 1-4 km. There were no reported variations in sulfur dioxide values, but SGC noted high carbon dioxide values, compared to those recorded in the first half of 2023.
SGC reported that at 1929 on 16 November the seismic network detected a signal that was possibly associated with a gas-and-ash emission, though it was not confirmed in webcam images due to limited visibility. On 17 November an observer confirmed ash deposits on the N flank. Webcam images showed an increase in degassing both inside the crater and from the NW flank, rising 700 m above the crater.
Table 4. Seismicity at Puracé during November 2022-November 2023. Volcano-tectonic (VT), long-period (LP), hybrid (HB), and tremor (TR) events are reported each month. Courtesy of SGC.
| Month |
Volcano-tectonic |
Long-period |
Hybrid |
Tremor |
| Nov 2022 |
429 |
2,023 |
5 |
831 |
| Dec 2022 |
423 |
1,390 |
9 |
834 |
| Jan 2023 |
719 |
1,622 |
0 |
957 |
| Feb 2023 |
598 |
1,701 |
2 |
1,124 |
| Mar 2023 |
331 |
2,408 |
147 |
607 |
| Apr 2023 |
614 |
4,427 |
33 |
148 |
| May 2023 |
620 |
3,717 |
170 |
109 |
| Jun 2023 |
467 |
3,293 |
86 |
148 |
| Jul 2023 |
1,116 |
5,809 |
183 |
542 |
| Aug 2023 |
692 |
2,927 |
94 |
321 |
| Sep 2023 |
887 |
1,505 |
82 |
848 |
| Oct 2023 |
2,373 |
2,949 |
135 |
692 |
| Nov 2023 |
1,212 |
2,302 |
69 |
293 |
Geologic Background. Puracé is an active andesitic volcano with a 600-m-diameter summit crater at the NW end of the Los Coconucos Volcanic Chain. This volcanic complex includes nine composite and five monogenetic volcanoes, extending from the Puracé crater more than 6 km SE to the summit of Pan de Azúcar stratovolcano. The dacitic massif which the complex is built on extends about 13 km NW-SE and 10 km NE-SW. Frequent small to moderate explosive eruptions reported since 1816 CE have modified the morphology of the summit crater, with the largest eruptions in 1849, 1869, and 1885.
Information Contacts: Servicio Geologico Colombiano (SGC), Diagonal 53 No. 34-53 - Bogotá D.C., Colombia (URL: https://www.sgc.gov.co/volcanes).
Etna
Italy
37.748°N, 14.999°E; summit elev. 3357 m
All times are local (unless otherwise noted)
Strombolian explosions, lava fountains, and lava flows during July-August 2023
Etna, located on the Italian island of Sicily, has had documented eruptions dating back to 1500 BCE. Activity typically originates from multiple cones at the summit, where several craters have formed and evolved. The currently active craters are Northeast Crater (NEC), Voragine (VOR), and Bocca Nuova (BN), and the Southeast Crater (SEC); VOR and BN were previously referred to as the “Central Crater”. The original Southeast crater formed in 1978, and a second eruptive site that opened on its SE flank in 2011 was named the New Southeast Crater (NSEC). Another eruptive site between the SEC and NSEC developed during early 2017 and was referred to as the "cono della sella" (saddle cone). The current eruption period began in November 2022 and has been characterized by intermittent Strombolian activity, lava flows, and ash plumes (BGVN 48:08). This report updates activity during July through October 2023, which includes primarily gas-and-steam emissions; during July and August Strombolian explosions, lava fountains, and lava flows were reported, based on weekly and special reports by the Osservatorio Etneo (OE), part of the Catania Branch of Italy's Istituo Nazionale di Geofisica e Vulcanologica (INGV) and satellite data.
Variable fumarolic degassing was reported at all summit craters (BN, VOR, NEC, and SEC) throughout the entire reporting period (table 15). The MIROVA (Middle InfraRed Observation of Volcanic Activity) volcano hotspot detection system based on the analysis of MODIS data showed frequent low-to-moderate power thermal anomalies during the reporting period (figure 399). During mid-August there was a pulse in activity that showed an increase in the power of the anomalies due to Strombolian activity, lava fountains, and lava flows. Infrared satellite imagery captured strong thermal anomalies at the central and southeast summit crater areas (figure 400). Accompanying thermal activity were occasional sulfur dioxide plumes that exceeded 2 Dobson Units (DUs) recorded by the TROPOMI instrument on the Sentinel-5P satellite (figure 401).
Table 15. Summary of activity at the four primary crater areas at the summit of Etna during July-October 2023. Information is from INGV weekly reports.
| Month |
Bocca Nuova (BN) |
Voragine (VOR) |
Northeast Crater (NEC) |
Southeast Crater (SEC) |
| Jul 2023 |
Continuous degassing. |
No observations. |
Weak gas emissions. |
Continuous degassing. Sporadic and weak-to-moderate ash emissions. Strombolian explosions. |
| Aug 2023 |
Continuous degassing. |
No observations. |
No observations. |
Continuous degassing. Occasional ash emissions. Strombolian activity, lava fountaining, and lava flows. |
| Sep 2023 |
Variable degassing. Crater incandescence. |
Weak fumarolic activity. |
Weak fumarolic activity. |
Variable degassing. |
| Oct 2023 |
Continuous degassing. |
Weak fumarolic activity. |
Weak fumarolic activity. |
Continuous degassing. |
Activity during July and August was relatively low and mainly consisted of degassing at the summit craters, particularly at SEC and BN. Cloudy weather prevented clear views of the summit during early July. During the night of 2 July some crater incandescence was visible at SEC. Explosive activity resumed at SEC during 9-10 July, which was characterized by sporadic and weak ash emissions that rapidly dispersed in the summit area (figure 402). INGV reported moderate Strombolian activity began at 2034 on 14 July and was confined to the inside of the crater and fed by a vent located in the E part of SEC. An ash emission was detected at 2037. A new vent opened on 15 July in the SE part of BN and began to produce continuous gas-and-steam emissions. During an inspection carried out on 28 July pulsating degassing, along with audible booms, were reported at two active vents in BN. Vigorous gas-and-steam emissions intermittently generated rings. On rare occasions, fine, reddish ash was emitted from BN1 and resuspended by the gas-and-steam emissions.
Around 2000 on 13 August INGV reported a sudden increase in volcanic tremor amplitude. Significant infrasonic activity coincided with the tremor increase. Incandescent flashes were visible through the cloud cover in webcam images of SEC (figure 403). Strombolian activity at SEC began to gradually intensify starting at 2040 as seismicity continued to increase. The Aviation Color Code (ACC) was raised to Yellow (the second lowest-level on a four-color scale) at 2126 and then to Orange (the second highest-level on a four-color scale) at 2129 due to above-background activity. The activity rapidly transitioned from Strombolian activity to lava fountains around 2333 that rose 300-400 m above the crater (figure 403). Activity was initially focused on the E vent of the crater, but then the vent located above the S flank of the cone also became active. A lava flow from this vent traveled SW into the drainage created on 10 February 2022, overlapping with previous flows from 10 and 21 February 2022 and 21 May 2023, moving between Monte Barbagallo and Monte Frumento Supino (figure 404). The lava flow was 350 m long, oriented NNE-SSW, and descended to an elevation of 2.8 km. Flows covered an area of 300,000 m2 and had an estimated volume of 900,000 m3. The ACC was raised to Red at 2241 based on strong explosive activity and ashfall in Rifugio Sapienza-Piano Vetore at 1.7 km elevation on the S flank. INGV reported that pyroclastic flows accompanied this activity.
Activity peaked between 0240 and 0330 on 14 August, when roughly 5-6 vents erupted lava fountains from the E to SW flank of SEC. The easternmost vents produced lava fountains that ejected material strongly to the E, which caused heavy fallout of incandescent pyroclastic material on the underlying flank, triggering small pyroclastic flows. This event was also accompanied by lightning both in the ash column and in the ash clouds that were generated by the pyroclastic flows. A fracture characterized by a series of collapse craters (pit craters) opened on the upper SW flank of SEC. An ash cloud rose a few kilometers above the crater and drifted S, causing ash and lapilli falls in Rifugio Sapienza and expanding toward Nicolosi, Mascalucia, Catania, and up to Syracuse. Ashfall resulted in operational problems at the Catania airport (50 km S), which lasted from 0238 until 2000. By 0420 the volcanic tremor amplitude values declined to background levels. After 0500 activity sharply decreased, although the ash cloud remained for several hours and drifted S. By late morning, activity had completely stopped. The ACC was lowered to Orange as volcanic ash was confined to the summit area. Sporadic, minor ash emissions continued throughout the day. At 1415 the ACC was lowered to Yellow and then to Green at 1417.
During the night of 14-15 August only occasional flashes were observed, which were more intense during avalanches of material inside the eruptive vents. Small explosions were detected at SEC at 2346 on 14 August and at 0900 on 26 August that each produced ash clouds which rapidly dispersed into the atmosphere (figure 405). According to a webcam image, an explosive event detected at 2344 at SEC generated a modest ash cloud that was rapidly dispersed by winds. The ACC was raised to Yellow at 2355 on 14 August due to increasing unrest and was lowered to Green at 0954 on 15 August.
Activity during September and October was relatively low and mainly characterized by variable degassing from BN and SEC. Intense, continuous, and pulsating degassing was accompanied by roaring sounds and flashes of incandescence at BN both from BN1 and the new pit crater that formed during late July (figure 406). The degassing from the new pit crater sometimes emitted vapor rings. Cloudy weather during 6-8 September prevented observations of the summit craters .
Geologic Background. Mount Etna, towering above Catania on the island of Sicily, has one of the world's longest documented records of volcanism, dating back to 1500 BCE. Historical lava flows of basaltic composition cover much of the surface of this massive volcano, whose edifice is the highest and most voluminous in Italy. The Mongibello stratovolcano, truncated by several small calderas, was constructed during the late Pleistocene and Holocene over an older shield volcano. The most prominent morphological feature of Etna is the Valle del Bove, a 5 x 10 km caldera open to the east. Two styles of eruptive activity typically occur, sometimes simultaneously. Persistent explosive eruptions, sometimes with minor lava emissions, take place from one or more summit craters. Flank vents, typically with higher effusion rates, are less frequently active and originate from fissures that open progressively downward from near the summit (usually accompanied by Strombolian eruptions at the upper end). Cinder cones are commonly constructed over the vents of lower-flank lava flows. Lava flows extend to the foot of the volcano on all sides and have reached the sea over a broad area on the SE flank.
Information Contacts: Sezione di Catania - Osservatorio Etneo, Istituto Nazionale di Geofisica e Vulcanologia (INGV), Sezione di Catania, Piazza Roma 2, 95123 Catania, Italy (URL: http://www.ct.ingv.it/it/); MIROVA (Middle InfraRed Observation of Volcanic Activity), a collaborative project between the Universities of Turin and Florence (Italy) supported by the Centre for Volcanic Risk of the Italian Civil Protection Department (URL: http://www.mirovaweb.it/); NASA Global Sulfur Dioxide Monitoring Page, Atmospheric Chemistry and Dynamics Laboratory, NASA Goddard Space Flight Center (NASA/GSFC), 8800 Greenbelt Road, Goddard MD 20771, USA (URL: https://so2.gsfc.nasa.gov/); Copernicus Browser, Copernicus Data Space Ecosystem, European Space Agency (URL: https://dataspace.copernicus.eu/browser/).
Suwanosejima (Japan) — December 2023 Cite this Report
Suwanosejima
Japan
29.638°N, 129.714°E; summit elev. 796 m
All times are local (unless otherwise noted)
Eruption plumes, crater incandescence, and occasional explosions during July-October 2023
Suwanosejima is an 8-km-long island that consists of a stratovolcano and two active summit craters, located in the northern Ryukyu Islands, Japan. Volcanism over the past century has been characterized by Strombolian explosions, ash plumes, and ashfall. The current eruption began in October 2004 and has more recently consisted of frequent eruption plumes, explosions, and incandescent ejecta (BGVN 48:07). This report covers similar activity of ash plumes, explosions, and crater incandescence during July through October 2023 using monthly reports from the Japan Meteorological Agency (JMA) and satellite data.
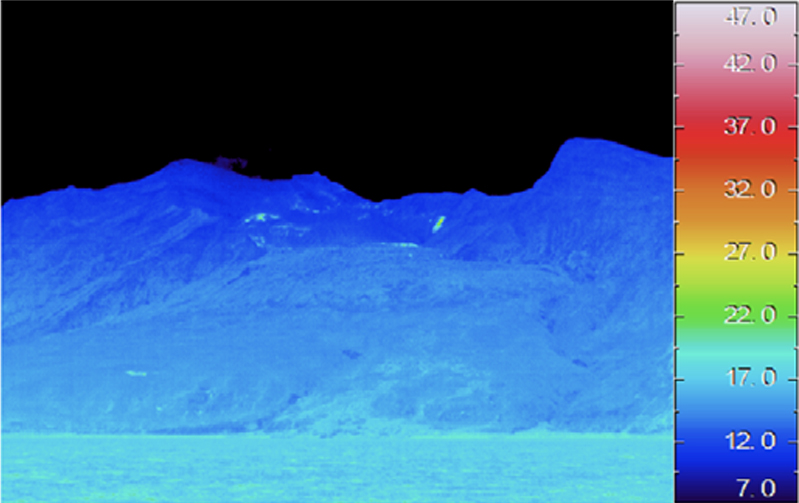
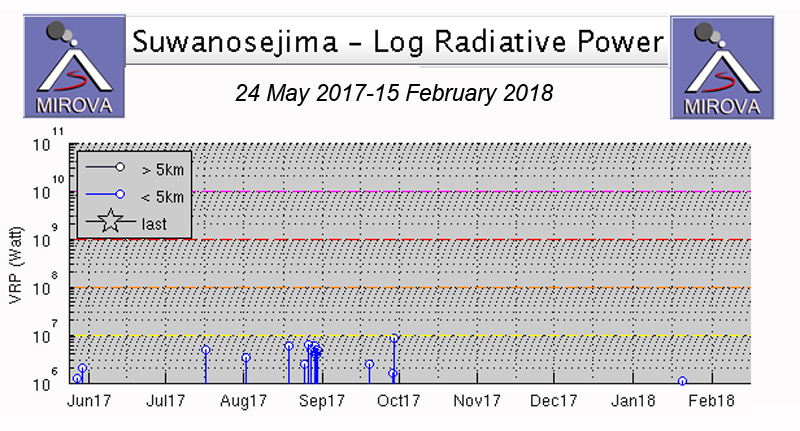
Thermal activity during the reporting period was relatively low; only one low-power thermal anomaly was detected during mid-July and one during early August, based on a MIROVA (Middle InfraRed Observation of Volcanic Activity) Log Radiative Power graph of the MODIS thermal anomaly data. On two clear weather days, a thermal anomaly was visible in infrared satellite images (figure 81).
Low-level activity was reported at the Otake crater during July and no explosions were detected. Eruption plumes rose as high as 1.8 km above the crater. On 13 July an ash plume rose 1.7 km above the crater rim, based on a webcam image. During the night of the 28th crater incandescence was visible in a webcam image. An eruptive event reported on 31 July produced an eruption plume that rose 2.1 km above the crater. Seismicity consisted of 11 volcanic earthquakes on the W flank, the number of which had decreased compared to June (28) and 68 volcanic earthquakes near the Otake crater, which had decreased from 722 in the previous month. According to observations conducted by the University of Tokyo Graduate School of Science, Kyoto University Disaster Prevention Research Institute, Toshima Village, and JMA, the amount of sulfur dioxide emissions released during the month was 400-800 tons per day (t/d).
Eruptive activity in the Otake crater continued during August and no explosions were reported. An eruptive event produced a plume that rose 1 km above the crater at 1447 on 12 August. Subsequent eruptive events were recorded at 0911 on 16 August, at 1303 on 20 August, and at 0317 on 21 August, which produced ash plumes that rose 1-1.1 km above the crater and drifted SE, SW, and W. On 22 August an ash plume was captured in a webcam image rising 1.4 km above the crater (figure 82). Multiple eruptive events were detected on 25 August at 0544, 0742, 0824, 1424, and 1704, which generated ash plumes that rose 1.1-1.2 km above the crater and drifted NE, W, and SW. On 28 August a small amount of ashfall was observed as far as 1.5 km from the crater. There were 17 volcanic earthquakes recorded on the W flank of the volcano and 79 recorded at the Otake crater during the month. The amount of sulfur dioxide emissions released during the month was 400-800 t/d.
Activity continued at the Otake crater during September. Occasionally, nighttime crater incandescence was observed in webcam images and ashfall was reported. An eruptive event at 1949 on 4 September produced an ash plume that rose 1 km above the crater and drifted SW. On 9 September several eruption events were detected at 0221, 0301, and 0333, which produced ash plumes that rose 1.1-1.4 km above the crater rim and drifted W; continuous ash emissions during 0404-0740 rose to a maximum height of 2 km above the crater rim (figure 83). More eruptive events were reported at 1437 on 10 September, at 0319 on 11 September, and at 0511 and 1228 on 15 September, which generated ash plumes that rose 1-1.8 km above the crater. During 25, 27, and 30 September, ash plumes rose as high as 1.3 km above the crater rim. JMA reported that large blocks were ejected as far as 300 m from the center of the crater. There were 18 volcanic earthquakes detected beneath the W flank and 82 volcanic earthquakes detected near the Otake crater. The amount of sulfur dioxide released during the month ranged from 600 to 1,600 t/d.
Activity during early-to-mid-October consisted of occasional explosions, a total number of 13, and ash plumes that rose as high as 1.9 km above the Otake crater rim on 29 October (figure 84). These explosions are the first to have occurred since June 2023. Continuous ash emissions were reported during 0510-0555 on 1 October. Explosions were recorded at 0304, 2141, and 2359 on 2 October, at 0112 on 3 October, and at 1326 on 6 October, which produced ash plumes that rose as high as 1 km above the crater rim and drifted SW and W. An explosion was noted at 0428 on 3 October, but emission details were unknown. A total of eight explosions were recorded by the seismic network at 1522 on 14 October, at 0337, 0433, 0555, 1008, and 1539 on 15 October, and at 0454 and 0517 on 16 October. Ash plumes from these explosions rose as high as 900 m above the crater and drifted SE. Eruptive events during 25-27 and 29-30 October generated plumes that rose as high as 1.9 km above the crater and drifted SE, S, and SW. Ash was deposited in Toshima village (3.5 km SSW). Eruptive activity occasionally ejected large volcanic blocks as far as 600 m from the crater. Nighttime crater incandescence was visible in webcams. Intermittent ashfall was reported as far as 1.5 km from the crater. There were 43 volcanic earthquakes detected on the W flank during the month, and 184 volcanic earthquakes detected near the Otake crater. The amount of sulfur dioxide emitted ranged between 400 and 900 t/d.
Geologic Background. The 8-km-long island of Suwanosejima in the northern Ryukyu Islands consists of an andesitic stratovolcano with two active summit craters. The summit is truncated by a large breached crater extending to the sea on the E flank that was formed by edifice collapse. One of Japan's most frequently active volcanoes, it was in a state of intermittent Strombolian activity from Otake, the NE summit crater, between 1949 and 1996, after which periods of inactivity lengthened. The largest recorded eruption took place in 1813-14, when thick scoria deposits covered residential areas, and the SW crater produced two lava flows that reached the western coast. At the end of the eruption the summit of Otake collapsed, forming a large debris avalanche and creating an open collapse scarp extending to the eastern coast. The island remained uninhabited for about 70 years after the 1813-1814 eruption. Lava flows reached the eastern coast of the island in 1884. Only about 50 people live on the island.
Information Contacts: Japan Meteorological Agency (JMA), 1-3-4 Otemachi, Chiyoda-ku, Tokyo 100-8122, Japan (URL: http://www.jma.go.jp/jma/indexe.html); MIROVA (Middle InfraRed Observation of Volcanic Activity), a collaborative project between the Universities of Turin and Florence (Italy) supported by the Centre for Volcanic Risk of the Italian Civil Protection Department (URL: http://www.mirovaweb.it/); Hawai'i Institute of Geophysics and Planetology (HIGP) - MODVOLC Thermal Alerts System, School of Ocean and Earth Science and Technology (SOEST), Univ. of Hawai'i, 2525 Correa Road, Honolulu, HI 96822, USA (URL: http://modis.higp.hawaii.edu/); Copernicus Browser, Copernicus Data Space Ecosystem, European Space Agency (URL: https://dataspace.copernicus.eu/browser/).
Aira
Japan
31.5772°N, 130.6589°E; summit elev. 1117 m
All times are local (unless otherwise noted)
Explosions, ash plumes, ash fall, and crater incandescence during July-October 2023
Aira caldera, located in the northern half of Kagoshima Bay, Japan, contains the post-caldera Sakurajima volcano. Eruptions typically originate from the Minamidake crater, and since the 8th century, ash deposits have been recorded in the city of Kagoshima (10 km W), one of Kyushu’s largest cities. The Minamidake summit cone and crater has had persistent activity since 1955; the Showa crater on the E flank has also been intermittently active since 2006. The current eruption period began during March 2017 and has recently been characterized by intermittent explosions, eruption plumes, and ashfall (BGVN 48:07). This report updates activity during July through October 2023 and describes explosive events, ash plumes, nighttime crater incandescence, and ashfall, according to monthly activity reports from the Japan Meteorological Agency (JMA) and satellite data.
Thermal activity remained at low levels during this reporting period, according to the MIROVA (Middle InfraRed Observation of Volcanic Activity) system (figure 149). There was a slight increase in the number of anomalies during September through October. Occasional thermal anomalies were visible in infrared satellite images mainly at the Minamidake crater (Vent A is located to the left and Vent B is located to the right) (figure 150).
Table 30. Number of monthly explosive events, days of ashfall, area of ash covered, and sulfur dioxide emissions from Sakurajima’s Minamidake crater at Aira during July-October 2023. Note that smaller ash events are not listed. Ashfall days were measured at Kagoshima Local Meteorological Observatory and ashfall amounts represent material covering all the Kagoshima Prefecture. Data courtesy of JMA monthly reports.
| Month |
Explosive events |
Days of ashfall |
Ashfall amount (g/m2) |
SO2 emissions (tons/day) |
| Jul 2023 |
3 |
0 |
0 |
1,600-3,200 |
| Aug 2023 |
3 |
10 |
7 |
1,800-3,300 |
| Sep 2023 |
3 |
7 |
3 |
1,600-2,300 |
| Oct 2023 |
33 |
8 |
61 |
2,200-4,200 |
JMA reported that during July, there were eight eruptions, three of which were explosion events in the Showa crater. Large blocks were ejected as far as 600 m from the Showa crater. Very small eruptions were occasionally reported at the Minamidake crater. Nighttime incandescence was observed in both the Showa and Minamidake crater. Explosions were reported on 16 July at 2314 and on 17 July at 1224 and at 1232 (figure 151). Resulting eruption plumes rose 700-2,500 m above the crater and drifted N. On 23 July the number of volcanic earthquakes on the SW flank of the volcano increased. A strong Mw 3.1 volcanic earthquake was detected at 1054 on 26 July. The number of earthquakes recorded throughout the month was 545, which markedly increased from 73 in June. No ashfall was observed at the Kagoshima Regional Meteorological Observatory during July. According to a field survey conducted during the month, the daily amount of sulfur dioxide emissions was 1,600-3,200 tons per day (t/d).
There were three eruptions reported at the Minamidake crater during August, each of which were explosive. The explosions occurred on 9 August at 0345, on 13 August at 2205, and on 31 August at 0640, which generated ash plumes that rose 800-2,000 m above the crater and drifted W. There were two eruptions detected at Showa crater; on 4 August at 2150 ejecta traveled 800 m from the Showa crater and associated eruption plumes rose 2.3 km above the crater. The explosion at 2205 on 13 August generated an ash plume that rose 2 km above the crater and was accompanied by large blocks that were ejected 600 m from the Minamidake crater (figure 152). Nighttime crater incandescence was visible in a high-sensitivity surveillance camera at both craters. Seismicity consisted of 163 volcanic earthquakes, 84 of which were detected on the SW flank. According to the Kagoshima Regional Meteorological Observatory there was a total of 7 g/m2 of ashfall over the course of 10 days during the month. According to a field survey, the daily amount of sulfur dioxide emitted was 1,800-3,300 t/d.
During September, four eruptions were reported, three of which were explosion events. These events occurred at 1512 on 9 September, at 0018 on 11 September, and at 2211 on 13 September. Resulting ash plumes generally rose 800-1,100 m above the crater. An explosion produced an ash plume at 2211 on 13 September that rose as high as 1.7 km above the crater. Large volcanic blocks were ejected 600 m from the Minamidake crater. Smaller eruptions were occasionally observed at the Showa crater. Nighttime crater incandescence was visible at the Minamidake crater. Seismicity was characterized by 68 volcanic earthquakes, 28 of which were detected beneath the SW flank. According to the Kagoshima Regional Meteorological Observatory there was a total of 3 g/m2 of ashfall over the course of seven days during the month. A field survey reported that the daily amount of sulfur dioxide emitted was 1,600-2,300 t/d.
Eruptive activity during October consisted of 69 eruptions, 33 of which were described as explosive. These explosions occurred during 4 and 11-21 October and generated ash plumes that rose 500-3,600 m above the crater and drifted S, E, SE, and N. On 19 October at 1648 an explosion generated an ash plume that rose 3.6 km above the crater (figure 153). No eruptions were reported in the Showa crater; white gas-and-steam emissions rose 100 m above the crater from a vent on the N flank. Nighttime incandescence was observed at the Minamidake crater. On 24 October an eruption was reported from 0346 through 0430, which included an ash plume that rose 3.4 km above the crater. Ejected blocks traveled 1.2 km from the Minamidake crater. Following this eruption, small amounts of ashfall were observed from Arimura (4.5 km SE) and a varying amount in Kurokami (4 km E) (figure 154). The number of recorded volcanic earthquakes during the month was 190, of which 14 were located beneath the SW flank. Approximately 61 g/m2 of ashfall was reported over eight days of the month. According to a field survey, the daily amount of sulfur dioxide emitted was 2,200-4,200 t/d.
Geologic Background. The Aira caldera in the northern half of Kagoshima Bay contains the post-caldera Sakurajima volcano, one of Japan's most active. Eruption of the voluminous Ito pyroclastic flow accompanied formation of the 17 x 23 km caldera about 22,000 years ago. The smaller Wakamiko caldera was formed during the early Holocene in the NE corner of the caldera, along with several post-caldera cones. The construction of Sakurajima began about 13,000 years ago on the southern rim and built an island that was joined to the Osumi Peninsula during the major explosive and effusive eruption of 1914. Activity at the Kitadake summit cone ended about 4,850 years ago, after which eruptions took place at Minamidake. Frequent eruptions since the 8th century have deposited ash on the city of Kagoshima, located across Kagoshima Bay only 8 km from the summit. The largest recorded eruption took place during 1471-76.
Information Contacts: Japan Meteorological Agency (JMA), 1-3-4 Otemachi, Chiyoda-ku, Tokyo 100-8122, Japan (URL: http://www.jma.go.jp/jma/indexe.html); MIROVA (Middle InfraRed Observation of Volcanic Activity), a collaborative project between the Universities of Turin and Florence (Italy) supported by the Centre for Volcanic Risk of the Italian Civil Protection Department (URL: http://www.mirovaweb.it/); Copernicus Browser, Copernicus Data Space Ecosystem, European Space Agency (URL: https://dataspace.copernicus.eu/browser/).
Nishinoshima (Japan) — November 2023 Cite this Report
Nishinoshima
Japan
27.247°N, 140.874°E; summit elev. 100 m
All times are local (unless otherwise noted)
Gray emissions during October 2023
Nishinoshima is a small island in the Ogasawara Arc, about 1,000 km S of Tokyo, Japan. It contains prominent submarine peaks to the S, W, and NE. Recorded eruptions date back to 1973, with the current eruption period beginning in October 2022. Eruption plumes and fumarolic activity characterize recent activity (BGVN 48:10). This report covers the end of the eruption for September through October 2023, based on information from monthly reports of the Japan Meteorological Agency (JMA) monthly reports, and satellite data.
No eruptive activity was reported during September 2023, although JMA noted that the surface temperature was slightly elevated compared to the surrounding area since early March 2023. The Japan Coast Guard (JCG) conducted an overflight on 20 September and reported white gas-and-steam plumes rising 3 km above the central crater of the pyroclastic cone, as well as multiple white gas-and-steam emissions emanating from the N, E, and S flanks of the crater to the coastline. In addition, dark reddish brown-to-green discolored water was distributed around almost the entire circumference of the island.
Similar low-level activity was reported during October. Multiple white gas-and-steam emissions rose from the N, E, and S flanks of the central crater of the pyroclastic cone and along the coastline; these emissions were more intense compared to the previous overflight observations. Dark reddish brown-to-green discolored water remained visible around the circumference of the island. On 4 October aerial observations by JCG showed a small eruption consisting of continuous gas-and-steam emissions emanating from the central crater, with gray emissions rising to 1.5 km altitude (figure 129). According to observations from the marine weather observation vessel Keifu Maru on 26 October, white gas-and-steam emissions persisted from the center of the pyroclastic cone, as well as from the NW, SW, and SE coasts of the island for about five minutes. Slightly discolored water was visible up to about 1 km.
Frequent low-to-moderate power thermal anomalies were recorded in the MIROVA graph (Middle InfraRed Observation of Volcanic Activity) during September (figure 130). Occasional anomalies were detected during October, and fewer during November through December. A thermal anomaly was visible in the crater using infrared satellite imagery on 6, 8, 11, 16, 18, 21, and 23 September and 8, 13, 21, 26, and 28 October (figure 131).
Geologic Background. The small island of Nishinoshima was enlarged when several new islands coalesced during an eruption in 1973-74. Multiple eruptions that began in 2013 completely covered the previous exposed surface and continued to enlarge the island. The island is the summit of a massive submarine volcano that has prominent peaks to the S, W, and NE. The summit of the southern cone rises to within 214 m of the ocean surface 9 km SSE.
Information Contacts: Japan Meteorological Agency (JMA), 1-3-4 Otemachi, Chiyoda-ku, Tokyo 100-8122, Japan (URL: http://www.jma.go.jp/jma/indexe.html); MIROVA (Middle InfraRed Observation of Volcanic Activity), a collaborative project between the Universities of Turin and Florence (Italy) supported by the Centre for Volcanic Risk of the Italian Civil Protection Department (URL: http://www.mirovaweb.it/); Copernicus Browser, Copernicus Data Space Ecosystem, European Space Agency (URL: https://dataspace.copernicus.eu/browser/).
Kilauea (United States) — October 2023 Cite this Report
Kilauea
United States
19.421°N, 155.287°W; summit elev. 1222 m
All times are local (unless otherwise noted)
Strong lava fountains, lava flows, and spatter at Halema’uma’u during January-September 2023
Kīlauea is on the island of Hawai’i and overlaps the E flank of the Mauna Loa volcano. Its East Rift Zone (ERZ) has been intermittently active for at least 2,000 years. An extended eruption period began in January 1983 and was characterized by open lava lakes and lava flows from the summit caldera and the East Rift Zone. During May 2018 magma migrated into the Lower East Rift Zone (LERZ) and opened 24 fissures along a 6-km-long NE-trending fracture zone that produced lava flows traveling in multiple directions. As lava emerged from the fissures, the lava lake at Halema'uma'u drained and explosions sent ash plumes to several kilometers altitude (BGVN 43:10).
The current eruption period started during September 2021 and has been characterized by low-level lava effusions in the active Halema’uma’u lava lake (BGVN 48:01). This report covers three notable eruption periods during February, June, and September 2023 consisting of lava fountaining, lava flows, and spatter during January through September 2023 using information from daily reports, volcanic activity notices, and abundant photo, map, and video data from the US Geological Survey's (USGS) Hawaiian Volcano Observatory (HVO).
Activity during January 2023. Small earthquake swarms were recorded on 2 January 2023; increased seismicity and changes in the pattern of deformation were noted on the morning of 5 January. At around 1500 both the rate of deformation and seismicity drastically increased, which suggested magma movement toward the surface. HVO raised the Volcano Alert Level (VAL) to Watch (the second highest level on a four-level scale) and the Aviation Color Code (ACC) to Orange (the second highest color on a four-color scale) at 1520.
Multiple lava fountains and lava effusions from vents in the central eastern portion of the Halema’uma’u crater began on 5 January around 0434; activity was confined to the eastern half of the crater and within the basin of the western half of the crater, which was the focus of the eruption in 2021-2022 (figure 525). Incandescence was visible in webcam images at 1634 on 5 January, prompting HVO to raise the VAL to Warning (the highest level on a four-level scale) and the ACC to Red (the highest color on a four-color scale). Lava fountains initially rose as high as 50 m above the vent at the onset of the eruption (figure 526) but then declined to a more consistent 5-6 m height in the proceeding days. By 1930 that same day, lava had covered most of the crater floor (an area of about 1,200,000 m2) and the lava lake had a depth of 10 m. A higher-elevation island that formed during the initial phase of the December 2020 eruption remained exposed, appearing darker in images, along with a ring of older lava around the lava lake that was active prior to December 2022. Overnight during 5-6 January the lava fountains continued to rise 5 m high, and the lava effusion rate had slowed.
On 6 January at 0815 HVO lowered the VAL to Watch and the ACC to Orange due to the declining effusion rates. Sulfur dioxide emission rates ranged from 3,000-12,500 tonnes per day (t/d), the highest value of which was recorded on 6 January. Lava continued to erupt from the vents during 6-8 January, although the footprint of the active area had shrunk; a similar progression has been commonly observed during the early stages of recent eruptions at Halema’uma’u. On 9 January HVO reported one dominant lava fountain rising 6-7 m high in the E half of the crater. Lava flows built up the margins of the lake, causing the lake to be perched. On 10 January the eastern lava lake had an area of approximately 120,000 m2 that increased to 250,000 m2 by 17 January. During 13-31 January several small overflows occurred along the margins of the E lake. A smaller area of lava was active within the basin in the W half of the crater that had been the focus of activity during 2021-2022. On 19 January just after 0200 a small ooze-out was observed on the crater’s W edge.
Activity during February 2023. Activity continued in the E part of Halema’uma’u crater, as well as in a smaller basin in the W part of the 2021-2022 lava lake (figure 527). The E lava lake contained a single lava fountain and frequent overflows. HVO reported that during the morning of 1 February the large E lava lake began to cool and crust over in the center of the lake; two smaller areas of lava were observed on the N and S sides by the afternoon. The dominant lava fountain located in the S part of the lava lake paused for roughly 45 minutes at 2315 and resumed by midnight, rising 1-2 m. At 0100 on 2 February lava from the S part was effusing across the entire E lava lake area, covering the crusted over portion in the center of the lake and continuing across the majority of the previously measured 250,000 m2 by 0400. A small lava pond near the E lake produced an overflow around 0716 on 2 February. On 3 February some lava crust began to form against the N and E levees, which defined the 250,000 m2 eastern lava lake. The small S lava fountain remained active, rising 1-6 m high during 3-9 February; around 0400 on 5 February occasional bursts doubled the height of the lava fountain.
A large breakout occurred overnight during 2100 on 4 February to 0900 on 5 February on the N part of the crater floor, equal to or slightly larger in size than the E lava lake. A second, smaller lava fountain appeared in the same area of the E lava lake between 0300 and 0700 on 5 February and was temporarily active. This large breakout continued until 7 February. A small, brief breakout was reported in the S of the E lava lake around midnight on 7 February. In the W lake, as well as the smaller lava pond in the central portion of the crater floor, contained several overflows during 7-10 February and intermittent fountaining. Activity at the S small lava pond and the small S lava fountain within the E lake declined during 9-10 February. The lava pond in the central portion of the crater floor had nearly continuous, expansive flows during 10-13 February; channels from the small central lava pond seemed to flow into the larger E lake. During 13-18 February a small lava fountain was observed in the small lava pond in the central portion of the crater floor. Continuous overflows persisted during this time.
Activity in the eastern and central lakes began to decline in the late afternoon of 17 February. By 18 February HVO reported that the lava effusions had significantly declined, and that the eastern and central lakes were no longer erupting. The W lake in the basin remained active but at a greatly reduced level that continued to decline. HVO reported that this decrease in activity is attributed to notable deflationary tilt that began early on the morning of 17 February and lasted until early 19 February. By 19 February the W lake was mostly crusted over although some weak lava flows remained, which continued through 28 February. The sulfur dioxide emission rates ranged 250-2,800 t/d, the highest value of which was recorded on 6 February.
Activity during March 2023. The summit eruption at Halema’uma’u crater continued at greatly reduced levels compared to the previous two months. The E and central vents stopped effusing lava, and the W lava lake remained active with weak lava flows; the lake was mostly crusted over, although slowly circulating lava intermittently overturned the crust. By 6 March the lava lake in the W basin had stopped because the entire surface was crusted over. The only apparent surface eruptive activity during 5-6 March was minor ooze-outs of lava onto the crater floor, which had stopped by 7 March. Several hornitos on the crater floor still glowed through 12 March according to overnight webcam images, but they did not erupt any lava. A small ooze-out of lava was observed just after 1830 in the W lava lake on 8 March, which diminished overnight. The sulfur dioxide emission rate ranged from 155-321 t/d on 21 March. The VAL was lowered to Advisory, and the ACC was lowered to Yellow (the second lowest on a four-color scale) on 23 March due to a pause in the eruption since 7 March.
Activity during April-May 2023. The eruption at Halema’uma’u crater was paused; no lava effusions were visible on the crater floor. Sulfur dioxide emission rates ranged from 75-185 t/d, the highest of which was measured on 22 April. During May and June summit seismicity was elevated compared to seismicity that preceded the activity during January.
Activity during June 2023. Earthquake activity and changes in the patterns of ground deformation beneath the summit began during the evening of 6 June. The data indicated magma movement toward the surface, prompting HVO to raise the VAL to Watch and the ACC to Orange. At about 0444 on 7 June incandescence in Halema’uma’u crater was visible in webcam images, indicating that a new eruption had begun. HVO raised the VAL to Warning and the ACC to Red (the highest color on a four-color scale). Lava flowed from fissures that had opened on the crater floor. Multiple minor lava fountains were active in the central E portion of the Halema’uma’u crater, and one vent opened on the W wall of the caldera (figure 528). The eruptive vent on the SW wall of the crater continued to effuse into the lava lake in the far SW part of the crater (figure 529). The largest lava fountain consistently rose 15 m high; during the early phase of the eruption, fountain bursts rose as high as 60 m. Lava flows inundated much of the crater floor and added about 6 m depth of new lava within a few hours, covering approximately 10,000 m2. By 0800 on 7 June lava filled the crater floor to a depth of about 10 m. During 0800-0900 the sulfur dioxide emission rate was about 65,000 t/d. Residents of Pahala (30 km downwind of the summit) reported minor deposits of fine, gritty ash and Pele’s hair. A small spatter cone had formed at the vent on the SW wall by midday, and lava from the cone was flowing into the active lava lake. Fountain heights had decreased from the onset of the eruption and were 4-9 m high by 1600, with occasional higher bursts. Inflation switched to deflation and summit earthquake activity greatly diminished shortly after the eruption onset.
At 0837 on 8 June HVO lowered the VAL to Watch and the ACC to Orange because the initial high effusion rates had declined, and no infrastructure was threatened. The surface of the lava lake had dropped by about 2 m, likely due to gas loss by the morning of 8 June. The drop left a wall of cooled lava around the margins of the crater floor. Lava fountain heights decreased during 8-9 June but continued to rise to 10 m high. Active lava and vents covered much of the W half of Halema’uma’u crater in a broad, horseshoe-shape around a central, uplifted area (figure 530). The preliminary average effusion rate for the first 24 hours of the eruption was about 150 cubic meters per second, though the estimate did not account for vesiculated lava and variations in crater floor topography. The effusion rate during the very earliest phases of the eruption appeared significantly higher than the previous three summit eruptions based on the rapid coverage of the entire crater floor. An active lava lake, also referred to as the “western lava lake” was centered within the uplifted area and was fed by a vent in the NE corner. Two small active lava lakes were located just SE from the W lava lake and in the E portion of the crater floor.
During 8-9 June the lava in the central lava lake had a thickness of approximately 1.5 m, based on measurements from a laser rangefinder. During 9-12 June the height of the lava fountains decreased to 9 m high. HVO reported that the previously active lava lake in the E part of the crater appeared stagnant during 10-11 June. The surface of the W lake rose approximately 1 m overnight during 11-12 June, likely due to the construction of a levee around it. Only a few small fountains were active during 12-13 June; the extent of the active lava had retreated so that all activity was concentrated in the SW and central parts of Halema’uma’u crater. Intermittent spattering from the vent on the SW wall was visible in overnight webcam images during 13-18 June. On the morning of 14 June a weak lava effusion originated from near the western eruptive vent, but by 15 June there were no signs of continued activity. HVO reported that other eruptive vents in the SW lava lake had stopped during this time, following several days of waning activity; lava filled the lake by about 0.5 m. Lava circulation continued in the central lake and no active lava was reported in the northern or eastern parts of the crater. Around 0800 on 15 June the top of the SW wall spatter cone collapsed, which was followed by renewed and constant spattering from the top vent and a change in activity from the base vent; several new lava flows effused from the top of the cone, as well as from the pre-existing tube-fed flow from its base. Accumulation of lava on the floor resulted in a drop of the central basin relative to the crater floor, allowing several overflows from the SW lava lake to cascade into the basin during the night of 15 June into the morning of 16 June.
Renewed lava fountaining was reported at the eruptive vent on the SW side of the crater during 16-19 June, which effused lava into the far SW part of the crater. This activity was described as vigorous during midday on 16 June; a group of observatory geologists estimated that the lava was consistently ejected at least 10 m high, with some spatter ejected even higher and farther. Deposits from the fountain further heightened and widened the spatter cone built around the original eruptive vent in the lower section of the crater wall. Multiple lava flows from the base of the cone were fed into the SW lava lake and onto the southwestern-most block from the 2018 collapse within Halema’uma’u on 17 June (figure 531); by 18 June they focused into a single flow feeding into the SW lava lake. On the morning of 19 June a second lava flow from the base of the eruptive cone advanced into the SW lava lake.
Around 1600 on 19 June there was a rapid decline in lava fountaining and effusion at the eruptive vent on the SW side of the crater; vent activity had been vigorous up to that point (figure 532). Circulation in the lava lake also slowed, and the lava lake surface dropped by several meters. Overnight webcam images showed some previously eruptive lava still flowing onto the crater floor, which continued until those flows began to cool. By 21 June no lava was erupting in Halema’uma’u crater. Overnight webcam images during 29-30 June showed some incandescence from previously erupted lava flows as they continued to cool. Seismicity in the crater declined to low levels. Sulfur dioxide emission rates ranged 160-21,000 t/d throughout the month, the highest measurement of which was recorded on 8 June. On 30 June the VAL was lowered to Advisory (the second level on a four-level scale) and the ACC was lowered to Yellow. Gradual inflation was detected at summit tiltmeters during 19-30 June.
Activity during July-August 2023. During July, the eruption paused; no lava was erupting in Halema’uma’u crater. Nighttime webcam images showed some incandescence from previously erupted lava as it continued to cool on the crater floor. During the week of 14 August HVO reported that the rate in seismicity increased, with 467 earthquakes of Mw 3.2 and smaller occurring. Sulfur dioxide emission rates remained low, ranging from 75-86 t/d, the highest of which was recorded on 10 and 15 August. On 15 August beginning at 0730 and lasting for several hours, a swarm of approximately 50 earthquakes were detected at a depth of 2-3 km below the surface and about 2 km long directly S of Halema’uma’u crater. HVO reported that this was likely due to magma movement in the S caldera region. During 0130-0500 and 1700-2100 on 21 August two small earthquake swarms of approximately 20 and 25 earthquakes, respectively, occurred at the same location and at similar depths. Another swarm of 50 earthquakes were recorded during 0430-0830 on 23 August. Elevated seismicity continued in the S area through the end of the month.
Activity during September 2023. Elevated seismicity persisted in the S summit with occasional small, brief seismic swarms. Sulfur dioxide measurements were relatively low and were 70 t/d on 8 September. About 150 earthquakes occurred during 9-10 September, and tiltmeter and Global Positioning System (GPS) data showed inflation in the S portion of the crater.
At 0252 on 10 September HVO raised the VAL to Watch and the ACC to Orange due to increased earthquake activity and changes in ground deformation that indicated magma moving toward the surface. At 1515 the summit eruption resumed in the E part of the caldera based on field reports and webcam images. Fissures opened on the crater floor and produced multiple minor lava fountains and flows (figure 533). The VAL and ACC were raised to Warning and Red, respectively. Gas-and-steam plumes rose from the fissures and drifted downwind. A line of eruptive vents stretched approximately 1.4 km from the E part of the crater into the E wall of the down dropped block by 1900. The lava fountains at the onset of the eruption had an estimated 50 m height, which later rose 20-25 m high. Lava erupted from fissures on the down dropped block and expanded W toward Halema’uma’u crater. Data from a laser rangefinder recorded about 2.5 m thick of new lava added to the W part of the crater. Sulfur dioxide emissions were elevated in the eruptive area during 1600-1500 on 10 September, measuring at least 100,000 t/d.
At 0810 on 11 September HVO lowered the VAL and ACC back to Watch and Orange due to the style of eruption and the fissure location had stabilized. The initial extremely high effusion rates had declined (but remained at high levels) and no infrastructure was threatened. An eruption plume, mainly comprised of sulfur dioxide and particulates, rose as high as 3 km altitude. Several lava fountains were active on the W side of the down dropped block during 11-15 September, while the easternmost vents on the down dropped block and the westernmost vents in the crater became inactive on 11 September (figure 534). The remaining vents spanned approximately 750 m and trended roughly E-W. The fed channelized lava effusions flowed N and W into Halema’uma’u. The E rim of the crater was buried by new lava flows; pahoehoe lava flows covered most of the crater floor except areas of higher elevation in the SW part of the crater. The W part of the crater filled about 5 m since the start of the eruption, according to data from a laser rangefinder during 11-12 September. Lava fountaining continued, rising as high as 15 m by the morning of 12 September. During the morning of 13 September active lava flows were moving on the N and E parts of the crater. The area N of the eruptive vents that had active lava on its surface became perched and was about 3 m higher than the surrounding ground surface. By the morning of 14 September active lava was flowing on the W part of the down dropped block and the NE parts of the crater. The distances of the active flows progressively decreased. Spatter had accumulated on the S (downwind) side of the vents, forming ramparts about 20 m high.
Vigorous spattering was restricted to the westernmost large spatter cone with fountains rising 10-15 m high. Minor spattering occurred within the cone to the E of the main cone, but HVO noted that the fountains remained mostly below the rim of the cone. Lava continued to effuse from these cones and likely from several others as well, traveled N and W, confined to the W part of the down-dropped block and the NE parts of Halema’uma’u. Numerous ooze-outs of lava were visible over other parts of the crater floor at night. Laser range-finder measurements taken of the W part of the crater during 14-15 September showed that lava filled the crater by 10 m since the start of the eruption. Sulfur dioxide emissions remained elevated after the onset of the eruption, ranging 20,000-190,000 t/d during the eruption activity, the highest of which occurred on 10 September.
Field crews observed the eruptive activity on 15 September; they reported a notable decrease or stop in activity at several vents. Webcam images showed little to no fountaining since 0700 on 16 September, though intermittent spattering continued from the westernmost large cone throughout the night of 15-16 September. Thermal images showed that lava continued to flow onto the crater floor. On 16 September HVO reported that the eruption stopped around 1200 and that there was no observable activity anywhere overnight or on the morning of 17 September. HVO field crews reported that active lava was no longer flowing onto Halema’uma’u crater floor and was restricted to a ponded area N of the vents on the down dropped block. They reported that spattering stopped around 1115 on 16 September. Nighttime webcam images showed some incandescence on the crater floor as lava continued to cool. Field observations supported by geophysical data showed that eruptive tremor in the summit region decreased over 15-16 September and returned to pre-eruption levels by 1700 on 16 September. Sulfur dioxide emissions were measured at a rate of 800 t/d on 16 September while the eruption was waning, and 200 t/d on 17 September, which were markedly lower compared to measurements taken the previous week of 20,000-190,000 t/d.
Geologic Background. Kilauea overlaps the E flank of the massive Mauna Loa shield volcano in the island of Hawaii. Eruptions are prominent in Polynesian legends; written documentation since 1820 records frequent summit and flank lava flow eruptions interspersed with periods of long-term lava lake activity at Halemaumau crater in the summit caldera until 1924. The 3 x 5 km caldera was formed in several stages about 1,500 years ago and during the 18th century; eruptions have also originated from the lengthy East and Southwest rift zones, which extend to the ocean in both directions. About 90% of the surface of the basaltic shield volcano is formed of lava flows less than about 1,100 years old; 70% of the surface is younger than 600 years. The long-term eruption from the East rift zone between 1983 and 2018 produced lava flows covering more than 100 km2, destroyed hundreds of houses, and added new coastline.
Information Contacts: Hawaiian Volcano Observatory (HVO), U.S. Geological Survey, PO Box 51, Hawai'i National Park, HI 96718, USA (URL: http://hvo.wr.usgs.gov/).
Tinakula (Solomon Islands) — December 2023 Cite this Report
Tinakula
Solomon Islands
10.386°S, 165.804°E; summit elev. 796 m
All times are local (unless otherwise noted)
Continued lava flows and thermal activity during June through November 2023
Tinakula is a remote 3.5 km-wide island in the Solomon Islands, located 640 km ESE of the capital, Honiara. The current eruption period began in December 2018 and has more recently been characterized by intermittent lava flows and thermal activity (BGVN 48:06). This report covers similar activity during June through November 2023 using satellite data.
During clear weather days (20 July, 23 September, 23 October, and 12 November), infrared satellite imagery showed lava flows that mainly affected the W side of the island and were sometimes accompanied by gas-and-steam emissions (figure 54). The flow appeared more intense during July and September compared to October and November. According to the MODVOLC thermal alerts, there were a total of eight anomalies detected on 19 and 21 July, 28 and 30 October, and 16 November. Infrared MODIS satellite data processed by MIROVA (Middle InfraRed Observation of Volcanic Activity) detected a small cluster of thermal activity occurring during late July, followed by two anomalies during August, two during September, five during October, and five during November (figure 55).
Geologic Background. The small 3.5-km-wide island of Tinakula is the exposed summit of a massive stratovolcano at the NW end of the Santa Cruz islands. It has a breached summit crater that extends from the summit to below sea level. Landslides enlarged this scarp in 1965, creating an embayment on the NW coast. The Mendana cone is located on the SE side. The dominantly andesitic volcano has frequently been observed in eruption since the era of Spanish exploration began in 1595. In about 1840, an explosive eruption apparently produced pyroclastic flows that swept all sides of the island, killing its inhabitants. Recorded eruptions have frequently originated from a cone constructed within the large breached crater. These have left the upper flanks and the steep apron of lava flows and volcaniclastic debris within the breach unvegetated.
Information Contacts: MIROVA (Middle InfraRed Observation of Volcanic Activity), a collaborative project between the Universities of Turin and Florence (Italy) supported by the Centre for Volcanic Risk of the Italian Civil Protection Department (URL: http://www.mirovaweb.it/); Hawai'i Institute of Geophysics and Planetology (HIGP) - MODVOLC Thermal Alerts System, School of Ocean and Earth Science and Technology (SOEST), Univ. of Hawai'i, 2525 Correa Road, Honolulu, HI 96822, USA (URL: http://modis.higp.hawaii.edu/); Copernicus Browser, Copernicus Data Space Ecosystem, European Space Agency (URL: https://dataspace.copernicus.eu/browser/).
Search Bulletin Archive by Publication Date
Select a month and year from the drop-downs and click "Show Issue" to have that issue displayed in this tab.
The default month and year is the latest issue available.
Bulletin of the Global Volcanism Network - Volume 43, Number 03 (March 2018)
Ebeko (Russia)
Continuing frequent ash explosions through November 2017, typically to about 2 km altitude
Fournaise, Piton de la (France)
Second eruption of 2017; July-August, fissure with flows on the SE flank
Kilauea (United States)
Activity continues at Halema'uma'u lava lake, and at the East Rift Zone 61g flow, July-December 2017
Manam (Papua New Guinea)
Ash plumes and Strombolian explosions increase, March-May 2017
Poas (Costa Rica)
Increase in phreatic and phreato-magmatic explosions during April through August 2017
Rincon de la Vieja (Costa Rica)
Phreatic explosions during 29 September-22 October 2017
San Cristobal (Nicaragua)
Intermittent ash-bearing explosions during 2017; ash plume drifts 250 km in August
Sangay (Ecuador)
Eruptive episode of ash-bearing explosions and lava on SE flank, 20 July-26 October 2017
Suwanosejima (Japan)
Large explosions with ash plumes and Strombolian activity continue during 2017
Turrialba (Costa Rica)
Persistent explosions and ash emissions continue through 2017; small lava lake
Ebeko
Russia
50.686°N, 156.014°E; summit elev. 1103 m
All times are local (unless otherwise noted)
Continuing frequent ash explosions through November 2017, typically to about 2 km altitude
Ebeko volcano is located on the remote N end of Paramushir Island in the Kuril Islands and contains many craters, lakes, and thermal features. Eruptions and ash plumes were observed at Ebeko in early July 2010 (BGVN 36:07). No additional activity was reported from Ebeko until October 2016, marking the start of the more recent eruptive cycle. New explosive eruptions accompanied by ash fall began on 20 October 2016 through April 2017 (BGVN: 42:08). Explosive eruptions, ash plumes, ash falls were observed and reported at a regular frequency during this reporting period from May through November 2017 (table 5). Eruptions were reported by observations from residents in the town of Severo-Kurilsk, located about 7 km E of Ebeko, by volcanologists and by satellite imagery. The Kamchatkan Volcanic Eruption Response Team (KVERT) is responsible for monitoring Ebeko, and is the primary source of information. The Aviation Color Code (ACC) remained at Orange throughout this reporting period. This color is the second highest level of the four color scale.
Table 5. Summary of activity at Ebeko volcano from May 2017 to November 2017. Aviation Color Code (ACC) is a 4-color scale. Data courtesy of KVERT.
| Date |
Plume Altitude |
Plume Distance |
Plume Direction |
Other Observations |
| 23 Apr-26 Apr 2017 |
2.1 km |
50 km |
NE |
ACC at Orange. Minor ashfall in Severo-Kurilsk reported on 25 April |
| 07 May 2017 |
-- |
-- |
-- |
Satellite observation |
| 08 May-09 May 2017 |
2.4-2.7 km |
-- |
S, NE |
Satellite observation |
| 15 May 2017 |
2 km |
-- |
-- |
Explosions |
| 23-24 May 2017 |
2 km |
-- |
-- |
Explosions |
| 25 May-02 Jun 2017 |
-- |
-- |
-- |
Explosions |
| 02 Jun-09 Jun 2017 |
-- |
-- |
-- |
Explosions |
| 09 Jun-16 Jun 2017 |
-- |
-- |
-- |
Explosions |
| 17, 21 Jun 2017 |
2 km |
-- |
-- |
Explosions |
| 23 Jun-30 Jun 2017 |
2 km |
-- |
-- |
Explosions, ashfall in Severo-Kurilsk reported on 24 and 26 Jun |
| 01, 04 Jul 2017 |
2.6 km |
-- |
-- |
Explosions |
| 07 Jul-08 Jul 2017 |
1.5 km |
-- |
-- |
Explosions |
| 31 Jul 2017 |
-- |
-- |
-- |
Weak thermal anomaly |
| 01 Aug 2017 |
1.6 km |
-- |
-- |
Explosions |
| 10 Aug 2017 |
-- |
-- |
-- |
Explosions |
| 22 Aug 2017 |
2 km |
-- |
SW |
Explosions |
| 28 Aug-29 Aug 2017 |
2.2 km |
-- |
-- |
Explosions, minor ashfall in Severo-Kurilsk |
| 02 Sep 2017 |
4 km |
-- |
-- |
Explosions |
| 03, 06-07 Sep 2017 |
2.1 km |
-- |
-- |
Explosions, minor ashfall in Severo-Kurilsk |
| 13 Sep-14 Sep 2017 |
2.2 km |
-- |
-- |
Explosions |
| 15 Sep-17 Sep 2017 |
3 km |
-- |
-- |
Explosions, minor ashfall in Severo-Kurilsk |
| 24 Sep 2017 |
2 km |
-- |
-- |
Explosions |
| 29-30 Sep, 01, 05 Oct 2017 |
1.5 km |
-- |
-- |
Explosions |
| 06-07, 09, 12 Oct 2017 |
3 km |
-- |
-- |
Explosions, ashfall in Severo-Kurilsk reported on 7, 9, and 12 Oct |
| 13-20 Oct 2017 |
2.5 km |
-- |
-- |
Explosions |
| 20-27 Oct 2017 |
2 km |
-- |
-- |
Explosions |
| 27 Oct-03 Nov 2017 |
2 km |
-- |
-- |
Explosions |
| 05, 07-08 Nov 2017 |
2 km |
-- |
-- |
Explosions |
| 16 Nov 2017 |
2 km |
-- |
-- |
Explosions |
| 17-18, 20-21 Nov 2017 |
2 km |
-- |
-- |
Explosions, ashfall in Severo-Kurlisk reported on 22 Nov |
| 25-26, 28-30 Nov 2017 |
2 km |
-- |
-- |
Explosions, ashfall in Severo-Kurlisk reported on 28 Nov |
Explosives events, bursts of ash, ashfall, and ash plumes were reported throughout this period, and were quite variable in appearance (figures 12-16). Minor amounts of ash fell in Severo-Kurilsk on 25 April, 2-3, 6-7, 16, and 18 September, and 22 November. Ash plume altitudes during this reporting period ranged from 1.5 to 4 km; with the highest altitude of 4 km recorded on 2 September (table 5).
MIROVA only identified two low-power thermal anomalies in the past year, one in late February 2017 and the other in late March 2017. A weak thermal anomaly was reported by KVERT on 31 July 2017.
Geologic Background. The flat-topped summit of the central cone of Ebeko volcano, one of the most active in the Kuril Islands, occupies the northern end of Paramushir Island. Three summit craters located along a SSW-NNE line form Ebeko volcano proper, at the northern end of a complex of five volcanic cones. Blocky lava flows extend west from Ebeko and SE from the neighboring Nezametnyi cone. The eastern part of the southern crater contains strong solfataras and a large boiling spring. The central crater is filled by a lake about 20 m deep whose shores are lined with steaming solfataras; the northern crater lies across a narrow, low barrier from the central crater and contains a small, cold crescentic lake. Historical activity, recorded since the late-18th century, has been restricted to small-to-moderate explosive eruptions from the summit craters. Intense fumarolic activity occurs in the summit craters, on the outer flanks of the cone, and in lateral explosion craters.
Information Contacts: Kamchatka Volcanic Eruptions Response Team (KVERT), Far Eastern Branch, Russian Academy of Sciences, 9 Piip Blvd., Petropavlovsk-Kamchatsky, 683006, Russia (URL: http://www.kscnet.ru/ivs/kvert/); Institute of Volcanology and Seismology, Far Eastern Branch, Russian Academy of Sciences (IVS FEB RAS), 9 Piip Blvd., Petropavlovsk-Kamchatsky 683006, Russia (URL: http://www.kscnet.ru/ivs/eng/); MIROVA (Middle InfraRed Observation of Volcanic Activity), a collaborative project between the Universities of Turin and Florence (Italy) supported by the Centre for Volcanic Risk of the Italian Civil Protection Department (URL: http://www.mirovaweb.it/).
Piton de la Fournaise (France) — March 2018 Cite this Report
Piton de la Fournaise
France
21.244°S, 55.708°E; summit elev. 2632 m
All times are local (unless otherwise noted)
Second eruption of 2017; July-August, fissure with flows on the SE flank
Short pulses of intermittent eruptive activity have characterized Piton de la Fournaise, the large basaltic shield volcano on Reunion Island in the western Indian Ocean, for several thousand years. The most recent episode occurred during 31 January-27 February 2017 with an active vent located inside the Enclos caldera on the S flank, about 1 km SE of Château Fort and about 2.5 km ENE of Piton de Bert (BGVN 42:07). The next episode, discussed here, began on 14 July 2017 and lasted for about six weeks. Activity through February 2018 is covered in this report. Information is provided by the Observatoire Volcanologique du Piton de la Fournaise (OVPF) and satellite instruments.
A new fissure eruption began on 14 July 2017 on the S flank inside the caldera about 850 m W of Château Fort and lasted through 28 August. The fissure was initially 450 m long with seven active lava fountains. Within 48 hours the flow had reached its farthest extent, about 2.8 km from the fissure. Activity continued from the southernmost cone of the fissure with three active vents for a few weeks. Surface lava flows diminished, and activity was concentrated in lava tubes flowing SE from the cone with occasional breakouts and ephemeral vents along the flow field. The tremor signal briefly spiked with lava fountains on 16-17 August, and then ceased altogether on 28 August. A brief seismic swarm during 24 August-1 September led OVPF to conclude that magma had moved but did not open a new fissure. Inflation was intermittent through December, and then increased significantly during January before leveling off during February 2018.
Activity during June-July 2017. The brief seismic swarm of 17-18 May 2017 was followed by another brief increase in seismicity during the first few days of June 2017, but no surface eruption was reported. The inflation that occurred during the May event tapered off by early June. The volcano remained quiet until seismicity began increasing on 10 July 2017; this was accompanied by inflation recorded at the GPS stations as well. The observatory (OVPF) noted the beginning of seismic tremors, indicative of a new eruption, around 0050 on 14 July 2017. Webcams revealed that eruptive fissures opened on the S flank of the cone inside the Enclos caldera. A reconnaissance flight conducted later in the morning on 14 July indicated that the eruptive site was located 750 m SE of the Kala-Pele peak and 850 m W of Château Fort, about 2.2 km NE of Piton Bert (Figure 110).
By 0930 that morning, the fissure extended over a total length of approximately 450 m. Seven lava fountains with a maximum height of 30 m were active (figure 111). The fountain farthest downstream began to build a cone with two arms of flowing lava. Satellite measurements indicated an initial flow rate of about 22-30 m3/s at the beginning of the eruption.
The tremor intensity decreased significantly the following day; this was reflected in the decrease in the flow rates and the distribution of activity on the fissure. Only three lava fountains were active on 15 July 2017 near the downstream end of the fissure; they began to form two small cones with lava flows that merged into a single channel (figure 112). The fountains did not exceed 30 m in height. By 1400 on 15 July the flow front was 2.2 km SE from the fissure. Satellite instrument measurements suggested the flow rate had dropped to two m3/s. Sulfur dioxide anomalies were measured by the OMI satellite instrument during 14-16 July (figure 113).
Tremors fluctuated over the next few days with changes related to the growth and collapse of various the cones along the fissure. On 18 July, there were six active fountains (figure 114). The flow rate remained approximately 1-3 m3/s. Fountains reached 20 m high on 19 July and a third vent was visible forming on the N side of the main cone. During an overflight on 21 July, OVPF noted that all three vents were active, but lava was only flowing SE from the central one (figure 115). Lava tubes had begun to form downstream of the cone, with numerous breakouts creating small lateral expansion arms.
OVPF measured the flow dimensions on 22 July as 2.8 km long and 0.6 km wide (figure 116); the flow front had not advanced in the previous seven days. A fourth vent on the N side of the cone was periodically emitting ejecta, and two flows were active; one moving SE towards Château Fort and the other moving towards the SW inside a lava tube. On 24 July OVPF measured the flow rate as 1-4 m3/s, and the total volume of lava to date as 5.3 ± 1.9 million m3. On 25 July 2017, local observers reported that the main vent on the SE flank of the cone was visible, as well as a second vent on the N flank of the growing cone. The main lava channel was clearly visible downstream of the cone with frequent overflows (figure 117), and active flow continued inside the lava tubes.
By 30 July the flow intensity had decreased to about half of its original flow rate. The cone continued to grow, but no surface lava flows were observed (figure 118). The main vent rarely produced ejecta. Active lava was flowing in tunnels with a few minor breakouts near the cone. The flow front remained 2.8 km from the eruptive vent.
Activity during August 2017-February 2018. The intensity of the tremors associated with the eruption continued to taper off into early August to levels below 20% of what they were at the beginning of the eruption, and this corresponded to a decrease in observed activity in the field. During an OVPF overflight on 2 August 2017 no flows or ejecta from the eruptive cone were seen, but a number of surface breakouts from lava tubes were still visible; the nearest to the cone was 520 m to the SE (figure 119). The main vent was completely blocked, but the smaller vent still had visible incandescence and strong degassing (figure 120).
Estimates of the flow rates during the first week of August were less than 1-2 m3/s, and the total lava volume emitted on the surface was measured at 7.2 ± 2.3 million m3. A larger breakout from a tunnel on 5 August was visible in the OVPF webcams and fed a surface flow over several hundred meters for several hours. By 6 August 2017 the activity was focused mainly in lava tunnels with a few surface breakouts, although incandescence was visible from the small vent seen in imagery available in Google Earth (figure 121). Small ejecta was observed during 7-9 August from the remaining active small vent on the N flank of the cone (figure 122).
Observations made on 14 August 2017 indicated lava was still active in tunnels as pahoehoe flows were observed about 2 km from the active vent. A brief increase in seismic and surface activity occurred on 16 August. The Piton de Bert webcam captured short-lived lava fountains at the E edge of the eruptive cone. Seismic tremor intensity increased rapidly and then oscillated during 16-17 August. The minor inflation of the cone that had been observed since 1 August ceased by 18 August. Field measurements on 21 August demonstrated a significant decrease in flow activity since 12 August. The volcanic tremor signal was stable at a low level on 25 August; it decreased significantly on 27 August and disappeared altogether about 0300 local time on 28 August 2017, leading OVPF to conclude the eruptive phase had ended.
A number of indications led OVPF to conclude that two migrations of magma that did not reach the surface occurred between 16 August and 1 September. Increased seismicity began on 16 August and was accompanied by a measured increase in SO2; satellite measurements showed two areas of inflation SE of the active fissure between 7 and 25 August. A seismic swarm in the same area was recorded during 24 and 25 August (figure 123). Overflights by OVPF on 25 August did not identify any new fissures associated with the seismic events and inflation.
After the seismic swarm, the number of daily seismic events decreased to less than one per day by the end of September 2017. OVPF reported minor inflation during the second half of October along with a slight increase in seismicity. Inflation stabilized in November but increased again during January 2018 (figure 124). A gradual increase in shallow seismicity beneath the summit craters was recorded during the second half of February. It was accompanied by an increase in CO2 concentrations in the soil as well, which rose to some of the highest levels since measurements began in 2015.
Thermal anomaly data. The MIROVA project thermal anomaly record shows both the episodic nature of the activity and the cooling signature of the flows that continued beyond 28 August 2017 when OVPF noted the cessation of tremors associated with eruptive activity (figure 125). The MODVOLC thermal alerts first appeared on 13 July 2017 and continued persistently with multiple daily alerts until 23 August 2017.
Geologic Background. Piton de la Fournaise is a massive basaltic shield volcano on the French island of Réunion in the western Indian Ocean. Much of its more than 530,000-year history overlapped with eruptions of the deeply dissected Piton des Neiges shield volcano to the NW. Three scarps formed at about 250,000, 65,000, and less than 5,000 years ago by progressive eastward slumping, leaving caldera-sized embayments open to the E and SE. Numerous pyroclastic cones are present on the floor of the scarps and their outer flanks. Most recorded eruptions have originated from the summit and flanks of Dolomieu, a 400-m-high lava shield that has grown within the youngest scarp, which is about 9 km wide and about 13 km from the western wall to the ocean on the E side. More than 150 eruptions, most of which have produced fluid basaltic lava flows, have occurred since the 17th century. Only six eruptions, in 1708, 1774, 1776, 1800, 1977, and 1986, have originated from fissures outside the scarps.
Information Contacts: Observatoire Volcanologique du Piton de la Fournaise (OVPF), Institut de Physique du Globe de Paris, 14 route nationale 3, 27 ème km, 97418 La Plaine des Cafres, La Réunion, France (URL: http://www.ipgp.fr/fr); NASA Goddard Space Flight Center (NASA/GSFC), Global Sulfur Dioxide Monitoring Page, Atmospheric Chemistry and Dynamics Laboratory, 8800 Greenbelt Road, Goddard, Maryland, USA (URL: https://so2.gsfc.nasa.gov/); MIROVA (Middle InfraRed Observation of Volcanic Activity), a collaborative project between the Universities of Turin and Florence (Italy) supported by the Centre for Volcanic Risk of the Italian Civil Protection Department (URL: http://www.mirovaweb.it/); Hawai'i Institute of Geophysics and Planetology (HIGP) - MODVOLC Thermal Alerts System, School of Ocean and Earth Science and Technology (SOEST), Univ. of Hawai'i, 2525 Correa Road, Honolulu, HI 96822, USA (URL: http://modis.higp.hawaii.edu/).
Kilauea (United States) — March 2018 Cite this Report
Kilauea
United States
19.421°N, 155.287°W; summit elev. 1222 m
All times are local (unless otherwise noted)
Activity continues at Halema'uma'u lava lake, and at the East Rift Zone 61g flow, July-December 2017
Hawaii's Kīlauea volcano continued its eruptive activity, intermittent for thousands of years and continuous since 1983, throughout 2017. The summit caldera formed about 500 years ago, and the East Rift Zone (ERZ) has been active for much longer. Lava lakes were intermittent in and around Halema'uma'u crater at the summit until 1982. Lava has been continuously flowing from points along the ERZ since 1983, and the episode 61g flow was still vigorous through the end of 2017. A large explosion within Halema'uma'u Crater in March 2008 resulted in a new vent with a lava lake that has been continuously active through 2017.
The US Geological Survey's (USGS) Hawaiian Volcano Observatory (HVO) has been monitoring and researching the volcano for over a century, since 1912. Quarterly Kīlauea reports for July-December 2017, written by HVO scientists Carolyn Parcheta and Lil DeSmither, form the basis of this report. MODVOLC, MIROVA, and NASA Goddard Space Flight Center (GSFC) provided additional satellite information about thermal anomalies and SO2 plumes.
The lava lake inside the Overlook vent at Halema'uma'u Crater continued to rise and fall during the second half of 2017 with no significant lake level changes and a few periods of spattering. The lake level overall was lower at the end of the year than during much of the year, reflecting long-term deflation of the summit. There were no major explosive events from rockfalls, but smaller sloughs of veneer (thin layers of recently cooled lava that adhere to the vent walls) without accompanying explosions were common. Ongoing subsidence at Pu'u 'O'o, especially around the West Pit prompted moves of monitoring equipment, but little else changed at the cone.
The episode 61g lava flow continued with numerous surface breakouts from areas near the vent all the way down over the pali and into the ocean at the Kamokuna delta during July-December 2017. Changes in the subsurface flow in lava tubes contributed to changing locations of surface breakouts, which were still active at the end of the year. The lava flowing into the ocean at Kamokuna slowed and finally ended in November with changes occurring on the delta in the final weeks of its activity.
Activity at Halema'uma'u. For the second half of 2017, activity at the lava lake inside the Overlook crater continued with little change from January-June. The lake's surface circulation pattern was typical, with upwelling in the N and subsidence of the crust along the southern lake margin, but also around the entire edge of the lake depending on the upwelling location (figure 292). There were often "sinks" a few tens of meters from the SW edge of the lake where the crust folds in on itself and sinks, pulling material away from the wall. A noticeable lava veneer buildup often occurred on the southern margin, where the surface crust was most consistently subducting. Short-term spattering events lasted minutes to hours and occasionally altered the surface crust motion by creating localized subsidence. Throughout the period, spattering was often confined to a grotto at the SE sink. On most days, two or more spattering sites were active simultaneously.
The lava lake level generally rose and fell over periods of hours to days in response to gas-piston action and to inferred changes in summit lava pressure indicated by deflation-inflation (DI) events. There were a few periods with exceptions when the lake level remained constant for many days at a time, heating up the surrounding walls enough to produce thermal cracking and popping sounds. The total range of the lake level varied between 35 and 40 m during July-December 2017, with the highest level about 17 m below the rim in early September (elevation 1,020 m), and the lowest levels, about 57 m below the rim in late July and September (elevation 977 m) (figure 293).
There were no significant explosive events triggered by rockfalls, but smaller collapses of veneer and the wall were common, particularly during deflationary phases when the lake level was low and exposed larger areas of the walls. A few larger collapses in September 2017 were big enough to change the geometry of the lake slightly (figure 294). The first, on 8 September at 1806 HST, was a collapse of the large ledge attached to the wall in the southern corner of the lake. This event produced a plume containing ash, a composite seismic event, and lake surface agitation. The following day, 9 September, there was another collapse at 0509. This involved an area of the E Overlook rim composed of mainly lithic deposits, directly above the Southeast sink, which produced a dusty plume, a composite seismic event, and lake surface agitation. On 12 September a thin slice of the southwest lake rim collapsed at 1420, producing a dusty plume, an agitated lake surface for about 10 minutes, and a composite seismic event.
An interesting effect observed on two veneer collapses occurred on 24 October 2017 at 1617 and 1623. Both were silent events but were noticed because they visually depressed the lake as they fell in and sent a small "wave" propagating outward before spattering began a few seconds later. The wave did not make it more than half way across the lake in either case, and both spattering events lasted only a few minutes. Several veneer ledges built up and subsequently collapsed around the lakes perimeter but were most notable on the SW corner of the lake. Three collapses, on 5 December at 0400 and 7 December at 1856 and 2024, enlarged the NNE edge of the lake towards true N, but did not produce a spatter deposit or explosion (figure 295). Another rockfall occurred on the N margin of the lake on 23 December 2017 at 1552 and triggered a large spattering event.
Activity at Pu'u 'O'o. During July-December 2017, there were only minor changes in the main crater of Pu'u 'O'o as recorded by the PO webcam, PT webcam, and the West Pit time-lapse camera. Due to slight subsidence, altered ground, and widening cracks first noted in August, the West Pit time-lapse camera was relocated 20 m to the SE on 12 October, and roughly 25 m further back from the rim on 1 November after new crack expansion was observed.
During the month of August 2017 there was slight subsidence of the W portion of the crater floor, and around 20 August a crack opened up in the S embayment with three heat locations. There appeared to be slight subsidence of the E side of West Pit from the time-lapse imagery spanning 22 November to 12 December. This subsidence accelerated during 15-17 December, but then was slower through the end of the year. The deformation data confirmed subsidence at Pu'u 'O'o, but it seemed to be confined to the land bridge separating the main crater and the West Pit lava pond. The lava pond inside of the west pit rose slightly during the period from around an elevation of 847 m in early August to 849.5 m on 12 December when measured during site visits about every three weeks. A thick surface crust and sluggish plate motion was typical at the lava pond.
The time-lapse camera located on the E rim of the lava pond (through October) captured three rockfalls in July and two in August that disturbed the pond's surface. On 30 September 2017 a collapse of the west pit's SE rim also broke off a portion of the ledge below, as it was impacted by the falling rocks (figure 296). The collapse was large enough to agitate the pond surface for several tens of minutes, and produced a small step in the tilt at the POC tiltmeter.
The pond surface was also disturbed from rockfalls on 22, 28, and 31 October 2017. The first two events were on the N side of the West Pit rim, and the events on 31 October were on the S side of the rim. A small rockfall that triggered minor spattering was witnessed during an overflight on 1 November (figure 297). After 1 November, when the camera was moved away from the rim, it no longer had direct views of the pond. One of the E spillway spatter cones collapsed into the lava tube that was feeding the 61g flow on 20 November and provided a skylight into the tube for a day before it crusted over. On 12 December, a large talus pile on the NNE side of West Pit was evidence of rock falls near the original time-lapse camera site. The talus, likely resulting from several rock falls, piled up onto the lava coated bench.
Activity at the East Rift Zone, episode 61g flow field. The 13 June 2017 breakout that had started on the upper flow field, approximately 1.1 km from the vent, was the largest area of active surface flows on the 61g flow during July-September. Ranging between 2.6–5.8 km from the vent, the breakout significantly expanded the upper flow fields western flow margin. This breakout remained active through the end of September (figure 298). On 26 June 2017 a breakout started near the top of Royal Gardens and quickly advanced down the pali, east of the main flow field. By 6 July the front of the breakout had extended 500 m beyond the pali base with fluid pahoehoe at the front, and a small a'a channel on the steep part of the pali. Slow advancement of the flow placed it approximately 1.5 km from the emergency road near the coast by 9 August before the flow front stalled. When mapped again on 15 August, the closest active flows were about 2.1 km uphill from the road. Intermittently during 1-20 September the breakout produced channelized flows on the steep part of the pali, sometimes as often as every 24 hours. By the end of September active surface flows had advanced to approximately 1.6 km from the emergency road (figure 298).
Two other breakouts that started near the episode 61g vent were also active during July-September 2017. The 5 March breakout, which had advanced downslope during its 4 months of activity, was weakly active on 10 July, with two small lava pads observed approximately 4.8 km from the vent. By the time of the overflight on 9 August, the breakout was inactive. On 26 July around 1025 HST, a new breakout started about 1.1 km from the vent and remained active through the end of September with flow activity located 1.1-2.5 km from the vent. On 27 August at roughly 0945 a breakout began on the steep part of the pali originating from the main 61g tube. By 1 September the breakout was at the base of the pali and spreading onto the coastal plain. A few other channels were reported on this area of the pali, and activity continued through the end of September with very little advancement across the coastal plain (figure 299).
The 26 June 2017 breakout remained active and stable through the end of 2017, forming a tube from its breakout point to midway down the pali on the E side of the 61g flow. The area where breakouts from 5 March, 13 June, and 26 July occurred (1.1 km from vent) also remained intermittently active through the end of 2017 (figure 300).
Numerous overflows originating on the sea cliff began in early October 2017. These breakouts occurred within 310 m of the sea cliff and persisted for nearly a month. There were also approximately 20 short-lived breakouts in October above the sea cliff, each lasting 1-3 days. They were located mostly in clusters on the upper flow field at 1, 2, and 3.5 km from the vent, along the top and base of the pali, and from the coastal tube.
An estimated 35 tube breakouts occurred during November 2017; they typically lasted 2- 10 days, and were located inland of the October breakouts. Locations of activity were in the upper flow field almost entirely between 2 and 3.5 km from vent, with three closer breakouts at 0.5, 0.8, and 1 km from vent. The two active tubes on the pali continued to have breakouts at the top and base of the cliff, but also started breakouts midway downslope (figure 301). At 0805 on 7 November, a viscous breakout occurred approximately 500 m above the sea cliff. The small breakout came directly from the 61g tube and lasted for roughly four and a half days. Another viscous breakout from the tube occurred approximately 950 m upslope of the sea cliff from 18-23 November. A week after that, a third viscous breakout occurred about 2 km from the sea cliff. By the end of November, there was no further breakout activity on the delta or the distal half of the coastal plain.
During December 2017, an estimated 30 breakouts were recorded from the 61g flow tube, however these were often longer, lasting up to a week on the upper flow field, and with near perpetual breakouts on the pali throughout the month, which made quantifying the exact number difficult. A new breakout occurred 500 m from the 61g vent on 1 December and lasted through 20 December. This breakout, and the whole area between 500-1,200 m from the vent, poured lava onto the eastern upper flow field (figure 300). Most of the upper flow field activity was focused very close to the vent, between 350-800 m; additional activity also occurred at the 1 km location and a few continued breakouts were noted from the 2-3.5 km region. The coastal flow field activity was sluggish and mostly a result of the near-constant pali tube breakouts reaching the base. On 9 December a new voluminous breakout began near the top of the pali that burned through the kipuka near the center of the flow field (figures 302 and 303). This major breakout lasted through the end of the year and produced mostly 'a'a channels on the pali with pahoehoe at the pali base. Pali tube breakouts occurred at nearly every elevation but seemed to move higher up the slope as the month came to a close. Activity did not advance more than 400 m from the base of the pali.
Time series thermal maps of the 61g flow field overlaid on all of the tubes mapped from the field to date suggested to HVO scientists that some of the many breakouts during October-December 2017 may have come from reactivation of an earlier tube thought to be inactive since at least April 2017 (figure 304). Breakout locations coincided with the former tube trace, and happened at least five times between 21 September and 5 January 2018.
Activity at the East Rift Zone, Kamokuna ocean entry. By the end of June 2017, flows from multiple breakouts had resurfaced the delta of the Kamokuna ocean entry, covering earlier cracks, and building up and steepening the delta's landward side. These surface breakouts continued into early July, but by 10 July several new cracks had appeared, two of which visibly spanned the width of the delta (figure 305). Slumping of the seaward half of the delta and expansion of the cracks was visible in time-lapse camera images until the end of September.
On 19 August 2017 around 0405 HST a breakout started on the sea cliff approximately 100 m upslope of the ramp, and five minutes later lava was spilling over the sea cliff and onto the delta. The breakout point and the lava falls over the cliff were both on the W side of the 61g tube. The lava produced a small 'a'a flow on the delta (figure 305), during its short-lived activity that lasted roughly 9.5 hours. Late on 19 August, the time-lapse camera also captured two images of littoral explosions in the center of the delta that produced a large spatter deposit on the delta's surface.
Three more sea cliff breakouts started on 23 September 2017. The first was brief "firehose-like" activity that began in the early morning hours. Based on the delta surface flows it produced, activity lasted less than 24 hours. Later views of the cliff face revealed that the "firehose" came out of a narrow horizontal crack E of the ramp, that was less than a meter below the top of the cliff. Later that day, on the sea cliff near the ocean entry, two new breakouts started, one to the E and one to the W of the tube. The E breakout originated roughly 70 m upslope of the sea cliff, and the breakout point had been fractured and depressed. Its thin pahoehoe flow spread out behind the littoral cone and came close to the edge of the cliff but did not spill over. The W breakout was visible in the time-lapse camera images on 23 September from around noon until midnight, producing only a few small dribbles of lava over the sea cliff. The breakout point was roughly 100 m upslope of the sea cliff, and buried the breakout from 19 August with thick, viscous pahoehoe. By the end of September, surface flows again covered much of the delta until most of the cracks were obscured, and only the ramp and a small area of the eastern delta close to the sea cliff were still uncovered.
Beginning in late August 2017, the ocean entry plume started to fluctuate regularly, and the plume was often weak or would briefly shut down. A shatter ring (a raised rim depression that forms over active lava tubes) began forming near the front of the delta on 21 August. By 30 August, the repeated uplifting and subsidence of the delta had broken the surface flows and built up a large rubble pile. On 26 September 2017 a bulge formed on the back half of the delta where the slope was steepest (figure 306). This inflationary feature produced steam and a delta surface flow from a crack at its base.
HVO scientists concluded that the bulge observed on 26 September 2017 was the result of the formation of a spreading-induced graben in the middle of the delta that obstructed the 61g tube between 23 and 26 September 2017 (figure 307, top row). During the first part of October, additional breakouts from the tube above the sea cliff produced lava falls that poured down on the W side of the tube (figure 307, middle row). A few breakouts in the latter half of October flowed to the E side of the tube (figure 307, bottom row). The delta did not expand much in area during October-December 2017, but it thickened greatly due to the added volume from the lava falls breakouts and several small sluggish breakouts on the delta. The maximum extent that the delta reached was a little over 4 hectares in October, and then it began to shrink from waves crumbling its edges. By the end of December, the delta had lost about 0.4 hectares (1 acre) of land.
The ocean entry was thought to have fully ceased activity shortly after 12 November 2017. The plume had its first pause in activity on 23 September, and quickly resumed but with decreasing vigor. By 26 September the plume was noticeably weaker and beginning to show intermittent pauses, which continued and became more prolonged through 4 November. The following day (5 November) was the first day with no plume visible in the HPcam, and 6 November was the last day an ocean entry plume was visible in the HP webcam. Ocean entry was active and observed during field visits between 6-11 November, but its weak, diffuse plume was not visible to the HP camera. The time-lapse camera stopped taking photos during the end of the Kamokuna delta activity in the late afternoon on 11 November (figure 308). This malfunction was discovered during a field visit on 12 November; the batteries were replaced a week later. The last photo of known lava activity on the delta was taken on 12 November, and the delta was likely completely inactive within a day or two.
During a 12 December 2017 overflight, an HVO scientist witnessed a collapse of a small portion of the sea cliff east of the tube into a yellow talus pile on the back portion of the delta, removing the evidence of the lava falls.
Satellite thermal and SO2 data. In addition to field observations, satellite-based thermal and SO2 data provide important insights into the ongoing activity at Kīlauea. The many MODVOLC thermal alerts issued during July-December 2017 show the varying intensity and locations through time of the many breakouts along the episode 61g flow field from near the vent at the base of Pu'u 'O'o all the way down to the Kamokuna ocean entry delta (figure 309).
The MIROVA project thermal anomaly graph of distance from the summit also shows the multiple sources of heat at Kīlauea and the migration of those sources over time (figure 310). The MIROVA center point for relative distances described here is about 10 km (0.1°) E of Halema'uma'u crater. The anomaly locations at about 10 km distance from this point correspond to both the lava pond at Pu'u 'O'o crater and the Halema'uma'u crater lava lake. Those about 20 km away correspond to the Kamokuna ocean entry. Anomalies that migrate over time between 10 and 20 km distance trace the movement of the many episode 61g flow breakouts between Pu'u 'O'o and the Kamokuna ocean entry during July-December 2017.
Kīlauea emits significant SO2 that is recorded by both ground-based and satellite instruments. Sulfur dioxide emissions exceeded density levels of two Dobson Units (DU) multiple times every month during the period (figure 311). Increases in SO2 flux are caused by many factors including increases in the number and size of surface lava breakouts as well as activity at the summit crater.
Geologic Background. Kilauea overlaps the E flank of the massive Mauna Loa shield volcano in the island of Hawaii. Eruptions are prominent in Polynesian legends; written documentation since 1820 records frequent summit and flank lava flow eruptions interspersed with periods of long-term lava lake activity at Halemaumau crater in the summit caldera until 1924. The 3 x 5 km caldera was formed in several stages about 1,500 years ago and during the 18th century; eruptions have also originated from the lengthy East and Southwest rift zones, which extend to the ocean in both directions. About 90% of the surface of the basaltic shield volcano is formed of lava flows less than about 1,100 years old; 70% of the surface is younger than 600 years. The long-term eruption from the East rift zone between 1983 and 2018 produced lava flows covering more than 100 km2, destroyed hundreds of houses, and added new coastline.
Information Contacts: Hawaiian Volcano Observatory (HVO), U.S. Geological Survey, PO Box 51, Hawai'i National Park, HI 96718, USA (URL: http://hvo.wr.usgs.gov/); MIROVA (Middle InfraRed Observation of Volcanic Activity), a collaborative project between the Universities of Turin and Florence (Italy) supported by the Centre for Volcanic Risk of the Italian Civil Protection Department (URL: http://www.mirovaweb.it/); Hawai'i Institute of Geophysics and Planetology (HIGP) - MODVOLC Thermal Alerts System, School of Ocean and Earth Science and Technology (SOEST), Univ. of Hawai'i, 2525 Correa Road, Honolulu, HI 96822, USA (URL: http://modis.higp.hawaii.edu/); NASA Goddard Space Flight Center (NASA/GSFC), Global Sulfur Dioxide Monitoring Page, Atmospheric Chemistry and Dynamics Laboratory, 8800 Greenbelt Road, Goddard, Maryland, USA (URL: https://so2.gsfc.nasa.gov/).
Manam (Papua New Guinea) — March 2018 Cite this Report
Manam
Papua New Guinea
4.08°S, 145.037°E; summit elev. 1807 m
All times are local (unless otherwise noted)
Ash plumes and Strombolian explosions increase, March-May 2017
Manam is a basaltic-andesitic stratovolcano that lies 13 km off the northern coast of mainland Papua New Guinea; it has a 400-year history of recorded evidence for recurring low-level ash plumes and occasional Strombolian emissions, lava flows, pyroclastic avalanches, and large ash plumes. Activity during 2016 included only two episodes of ash emissions, during early March and mid-July, but persistent thermal activity (strongest between March and July 2016) was intermittent throughout the year (BGVN 42:03). Activity from January 2017-January 2018, discussed below, included increased Strombolian activity, lava flows, and ash emissions during February-May 2017 that led to evacuations and concern for local residents. Information about Manam is primarily provided by Papua New Guinea's Rabaul Volcano Observatory (RVO), part of the Department of Mineral Policy and Geohazards Management (DMPGM). This information is supplemented with aviation alerts from the Darwin Volcanic Ash Advisory Center (VAAC). MODIS thermal anomaly satellite data is recorded by the University of Hawai'i's MODVOLC thermal alert recording system, and the Italian MIROVA project; sulfur dioxide monitoring is done by instruments on satellites managed by NASA's Goddard Space Flight Center.
Summary of 2017 activity. A strong surge in thermal activity beginning in mid-February 2017 lasted through mid-June. Low levels of intermittent activity continued for the rest of 2017, with a short-lived increase during late December 2017 and early January 2018 (figure 35). Strong multi-pixel daily MODVOLC thermal alerts began on 17 February and continued through 29 May 2017. Plumes of SO2 were detected with satellite instruments in late February, early March, and during the second half of May.
The first report of ash emissions in 2017 was on 2 March. Activity increased in late March, and again during the second half of April. Most of the many ash plume events that took place during May rose to 2-5 km altitude, but on 4 and 26 May they rose to over 12 km altitude. Ash plumes were noted on only two days during June, and none during July. Minor low-level ash emissions resumed in early and mid-August. The final VAAC report of 2017 was issued on 2 September.
RVO reported incandescent activity, Strombolian explosions, lava and pyroclastic flows, and ash emissions during February-May 2017 from both the Main and Southern craters (figures 36 and 37), and steam-and-gas emissions throughout the year. Activity during late February to mid-April occurred at both craters; most of the activity during late April and May came from Southern Crater. The events of mid-May caused ashfall across the island. Lava flows and pyroclastic flows in mid-April and mid-May led to evacuations from several villages. Incandescence was observed once from Southern Crater in November and once from Main Crater in December.
Activity during February-March 2017. After a break during much of December 2016, low-to-moderate pulses of thermal anomalies were recorded briefly by the MIROVA project early in January 2017 (BGVN 42:03, figure 34). Activity increased again in mid-February with stronger MIROVA anomalies and multi-pixel MODVOLC thermal alerts. Sulfur dioxide plumes were released on 25 February and 4 March 2017 (figure 38).
MODVOLC thermal alerts were issued on 13 days during March, many days had 3-6 alerts. The Darwin VAAC issued the first Volcanic Ash Advisory of 2017 on 2 March based on a pilot report of ash extending N of the volcano at 3 km altitude. The next report, on 20 March, indicated an ash plume visible in satellite imagery moving NE at 2.4 km altitude. It extended 80 km E of the summit the following day. Mostly-steam emissions with minor ash content were reported on 23 March, extending 75 km SE at the same altitude.
Activity during April 2017. Intense multi-pixel MODVOLC thermal alerts continued into April 2017; days with multiple alerts included 2, 14, 22-23, and 25-26 April. RVO released a Volcano Information Bulletin on 16 April 2017 noting a sudden increase in RSAM values beginning on 15 April, and indicating that a small-to-moderate eruption was ongoing from Main Crater. Incandescence was visible during most nights of April from both Main and Southern craters. RSAM values increased by two orders of magnitude during 16-17 April (figure 39). During that night, a brief report from Dugulava village on the SE side of the island indicated that large incandescent lava fragments were falling into valleys to the N and SW, accompanied by loud explosions. Strombolian activity at Southern Crater increased on 18 April, and was accompanied by emissions of dark ash plumes that rose a few hundred meters above the crater and drifted NW. Two small pyroclastic flows were channeled into valleys on the SE and SW flanks, and terminated at about 1,000 m elevation. Strombolian activity subsided by late afternoon, but weak gray ash emissions continued. At Main Crater, white-gray ash plumes continued with bursts of incandescence at about 5-minute intervals.
RVO reported that activity diminished after 18 April but continued at low levels through 21 April; explosions were still heard from both Main and Southern Craters. Both craters were incandescent, but only Southern Crater ejected incandescent tephra, which became briefly intense during the morning of 20 April. Pale gray-to-brown plumes containing minor amounts of ash rose from both craters and drifted SE. RSAM values began to rise again on 22 April, and Strombolian activity continued during 22-24 April (figure 40). According to a news article from 25 April (The National) the Alert Level was raised to Stage 3, and an official on the island noted that evacuations of women and children had begun to Bogia, about 16 km SW on the mainland.
The Darwin VAAC reported an ash plume at 4.6 km altitude extending about 35 km SE from the summit on 24 April. The next day, an ash plume was observed drifting a similar distance SW at 3 km altitude. The drift direction changed to WSW then W during 26 April, and the plume was last observed about 65 km from the summit. Infrared imagery indicated ongoing activity at the summit.
Strombolian activity and strong, dark-gray ash emissions continued during 24-25 April; activity declined for a few days before the next pulse began during the early morning of 28 April with Strombolian explosions that were heard at the Bogia Government Station. Most of the lava fell back into the crater, but some traveled down the SW and SE valleys, and minor amounts of ash fell on the SE and W parts of the island.
A pulse of moderately-high Strombolian activity occurred from Southern Crater during the early morning of 30 April 2017. The episode lasted about two hours and produced a small pyroclastic flow that was channeled into the SW valley and stopped at about 200 m elevation. Ejected incandescent lava fragments landed mostly within the crater, but some traveled down the SW and SE valleys. Ash and scoria up to 40 mm in diameter fell on the E side of the island in Abaria and Boakure.
Activity during May 2017. The strongest thermal activity of the year was recorded during May 2017. MODVOLC thermal alerts were issued on 4, 5, 9, 13, 14, 17, 18, 25, and 29 May, with 21 alerts issued on 18 May and a single alert on 29 May that was the last issued for the year. RVO reported a Strombolian event from Southern Crater, lasting from about 1700 on 4 May to 0700 the following morning. A lava flow descended into the SW valley to 600 m above sea level, and minor amounts of ash fell in areas stretching between Warisi to the E, Dugulaba on the S, and Boda and Baliab on the NW parts of the island.
The Darwin VAAC reported an ash plume drifting E at 3 km altitude late on 4 May 2017 (UTC). About an hour later, they reported a much higher altitude ash plume moving S from the summit at 12.5 km altitude, in addition to continuous ash moving E at 3 km altitude. The high-level ash plume dissipated after about five hours, but the lower-level emission continued to be visible in satellite imagery drifting E, then NE at least 25 km from the summit through 7 May, after which activity subsided. RVO reported steam-and-gas emissions from Southern Crater on 13 May. Incandescent lava fragments were ejected during the early morning of 14 May, generating a lava flow that traveled down the SW valley to an elevation of 600-700 m.
The next VAAC report, on 14 May 2017, noted an ash plume drifting NW at 4.6 km altitude 35 km from the summit. Later in the day, they reported another short-lived ash plume that rose to 5.5 km altitude drifting almost 100 km W, and a large hotspot over the summit. The lower-altitude plume lasted for another day before dissipating. RVO reported light gray to dark gray ash plumes during 15-18 May. The Darwin VAAC reported multiple plumes moving W at 2.1-2.4 km altitude on 17 May, and continuous emissions extending WNW on 18 May. RVO reported explosive activity on 18 May; a small lava flow traveled down the SW valley, but not as far as the 13-14 May flow. A weak ash emission, which dissipated after a few hours, was reported on 19 May drifting W at 2.7 km altitude. The Darwin VAAC reported that a substantial ash emission on 26 May 2017 was seen in satellite images drifting 55-75 km W at 12.2 km altitude. A second plume from a continuous lower-level eruption was reported later in the day rising to 4.6 km altitude. Both plumes dissipated by the end of the day. Sulfur dioxide emissions were captured by satellite instruments on 18 and 27 May (figure 41).
Activity during June-December 2017. Activity decreased significantly after May 2017 and was low for the remainder of the year. RVO noted weak-to-moderate steam plumes on the rare clear-weather days during June; there was no observed incandescence, and very low seismicity. The Darwin VAAC reported an ash plume that rose to 5.5 km altitude and drifted W on 6 June. Later in the day the plume extended WNW at about 2.4 km altitude. It was last observed early on 7 June before dissipating. No further ash emissions were noted by the Darwin VAAC or RVO until 5 August 2017 when the Darwin VAAC observed minor ash emissions moving NW at 2.1 km altitude. The emissions were visible that day and the next before dissipating. A new ash emission was reported late on 7 August, drifting W at 1.8 km altitude for about 8 hours before dissipating early the next day. Another minor plume on 12 August briefly extended 35 km NW at 2.1 km altitude. During 21-22 August, a similar plume was seen at the same altitude. A minor ash emission on 1 September, which also rose to 2.1 km altitude, was only visible for a few hours before dissipating, and was the last emission reported in 2017.
RVO noted incandescence at Southern Crater once in early November, and once at Main Crater in early December. The MIROVA data showed a cluster of thermal anomalies during late December2017 and early January 2018 (figure 35) suggesting a renewed pulse of thermal activity during that time.
Geologic Background. The 10-km-wide island of Manam, lying 13 km off the northern coast of mainland Papua New Guinea, is one of the country's most active volcanoes. Four large radial valleys extend from the unvegetated summit of the conical basaltic-andesitic stratovolcano to its lower flanks. These valleys channel lava flows and pyroclastic avalanches that have sometimes reached the coast. Five small satellitic centers are located near the island's shoreline on the northern, southern, and western sides. Two summit craters are present; both are active, although most observed eruptions have originated from the southern crater, concentrating eruptive products during much of the past century into the SE valley. Frequent eruptions, typically of mild-to-moderate scale, have been recorded since 1616. Occasional larger eruptions have produced pyroclastic flows and lava flows that reached flat-lying coastal areas and entered the sea, sometimes impacting populated areas.
Information Contacts: Rabaul Volcano Observatory (RVO), Geohazards Management Division, Department of Mineral Policy and Geohazards Management (DMPGM), PO Box 3386, Kokopo, East New Britain Province, Papua New Guinea; Darwin Volcanic Ash Advisory Centre (VAAC), Bureau of Meteorology, Northern Territory Regional Office, PO Box 40050, Casuarina, NT 0811, Australia (URL: http://www.bom.gov.au/info/vaac/); MIROVA (Middle InfraRed Observation of Volcanic Activity), a collaborative project between the Universities of Turin and Florence (Italy) supported by the Centre for Volcanic Risk of the Italian Civil Protection Department (URL: http://www.mirovaweb.it/); Hawai'i Institute of Geophysics and Planetology (HIGP) - MODVOLC Thermal Alerts System, School of Ocean and Earth Science and Technology (SOEST), Univ. of Hawai'i, 2525 Correa Road, Honolulu, HI 96822, USA (URL: http://modis.higp.hawaii.edu/); NASA Goddard Space Flight Center (NASA/GSFC), Global Sulfur Dioxide Monitoring Page, Atmospheric Chemistry and Dynamics Laboratory, 8800 Greenbelt Road, Goddard, Maryland, USA (URL: https://so2.gsfc.nasa.gov/); Radio New Zealand (URL: http://www.radionz.co.nz); The National (URL: http://www.thenational.com.pg).
Poas
Costa Rica
10.2°N, 84.233°W; summit elev. 2697 m
All times are local (unless otherwise noted)
Increase in phreatic and phreato-magmatic explosions during April through August 2017
Recent activity at Poás has been characterized by intermittent phreatic explosions from the hyperacid lake (figure 118). Explosions were noted in June-August 2016 (BGVN 42:03), but there were no reports explosions since then through March 2017. This report summarizes activity from April 2017 through March 2018. During this period, activity increased substantially during April-August 2017 and thereafter waned. No explosions were reported during 7 November 2017-31 March 2018. Information below was primarily drawn from reports issued by the Observatorio Vulcanologico Sismologica de Costa Rica-Universidad Nacional (OVSICORI-UNA).
Activity during April 2017. According to OVSICORI-UNA, activity increased substantially at the beginning of 2017, with significant increases in seismicity, steam-and-gas emissions, and surface deformation. Seismicity included numerous long-period (LP) earthquakes, more than 200 daily events between the end of March and the beginning of April, and weak explosions since 30 March. Deformation was characterized by inflation, with a vertical increase of more than 1 cm in a three-month period and an increase of 3 mm horizontally between two sites S and N of the crater separated by 1,570 m.
Gas emissions dramatically shifted toward a more magmatic composition, particularly after 30 March. Sulfur dioxide measurements on 4 April were about an order of magnitude greater than those on 28 March (~180 ± 65 tonnes/day (t/d) vs. ~19 ± 8 t/d), with the dome contributing 25% and the lake 75% of the flow. The increased flow was accompanied by the emergence of new fumaroles that may have contributed to the warming of the lake (which went from 35 to 40°C in just one week). In April, the lake quickly changed from a milky green color to a milky gray color, which suggested that emissions of magmatic gases from vents beneath the lake may have increased. The dome is on the S side of the crater lake and was formed during phreatomagmatic activity between 1953 and 1955; it has been a site of persistent fumarolic degassing for the last 200 years.
OVSICORI-UNA reported that a strong 40-minute phreatic explosion from an area between the lava dome and the hot lake occurred on 12 April 2017, starting at 1830. A plume of steam, altered rocks, sediments, and gases was produced; the height of the column could not be determined due to poor visibility. Ash fell around the crater and in Bajos del Toro (7 km WNW). The water level in the Desague River, with headwaters at the S part of the crater, increased by 2 m. According to news articles (Tico Times, The Costa Rica Star), the National Emergency Commission evacuated residents living near the river. The Poás Volcano National Park closed the next day and has remained closed through March 2018.
On 13 April, at 1546, an eight-minute-long explosion produced a plume that rose 500 m above the crater rim. The event rendered a webcam on the N rim inoperable. Explosions at 0758 (strong) and 1055 on 14 April generated plumes that rose to an undetermined height.
A 10-minute-long event that began at 0810 on 15 April again produced a plume of unknown height. Frequent (2-3 events per hour) small, short-lived, phreatic explosions were recorded by seismographs during 15-16 April. A plume that rose 500 m followed an explosion at 0946 on 16 April. Later that day, at 1350, an event generated a plume that rose 1 km. A news article (The Costa Rica Star) reported that boulders as large as 2 m in diameter fell in an area 30 m away from a tourist trail, breaking a water pipe. Rocks also damaged fences and concrete floors in viewing areas. Small, frequent, and short-lived phreatic explosions continued to be recorded through 18 April. A video posted by a news outlet (The Costa Rica Star) showed an explosion ejecting incandescent material.
According to OVSICORI-UNA, on 20 April a dense steam plume rose from a vent in the newly-forming pyroclastic cone at the site of the old dome in the hot lake. Sulfur dioxide levels increased from 1,000 t/d on 13 April to 2,500 t/d on 20 April. During 20-22 April Strombolian activity ejected tephra that fell around the vent within a 300-m radius. Gas-and-ash plumes rose 200 m above the vent. The Cruz Roja (Red Cross) in Grecia reported ashfall in Alajuela (20 km S), Fraijanes (8 km SE), San Miguel (40 km SSE), Carbonal (8.5 km SSW), Cajón (11 km SSW), San Francisco, San Roque (23 km SSE), and San Juan Norte de Poás (8.5 km S). Explosions at 1316 and 1603 on 22 April produced plumes of unknown height. Several more explosions were recorded that day; an event at 2212 was very intense, ejecting bombs large distances. An event at 1215 on 23 April generated a plume of unknown height.
Activity during May 2017. OVSICORI-UNA reported that large explosions were seismically recorded at 0621 on 1 May and at 1724 on 6 May, though poor visibility prevented visual confirmation of the events. On 10 May, ash emissions were observed. Gas emissions were measured by an instrument mounted on a drone, revealing a gas plume rich in sulfur dioxide and low in carbon dioxide. Deformation was high, with vertical inflation of 3 cm since February.
During 17-23 May, plumes consisted mainly of gas and steam, sometimes including solid material, that rose no more than 1 km above the vent. During 25-26 May, ashfall was reported in some communities around the volcano. Small phreatic explosions were recorded sporadically during 27-30 May.
Activity during June 2017. An explosion reported by OVSICORI-UNA at 1200 on 2 June generated a plume consisting of steam, gases, and minor amounts of ash that rose 600 m above the crater. Another event recorded at 1353 could not be confirmed visually due to weather conditions. An event at 0858 on 6 June generated a plume that rose 1 km.
During 7-8 June, the webcam recorded strong emissions of steam, magmatic gases, and particulates. A sulfur odor was reported in Alajuela, San Ramon (24 km WSW), and Barva (23 km SSE), and incandescence in the area of the crater was recorded at night. OVSICORI-UNA noted that during 8-9 June, a plume of steam, magmatic gases, and particulates rose from two vents; the lake had evaporated and exposed the vents. A minor sulfur odor was reported on the campus of the Universidad Nacional in Heredia. Explosions at 1610 and 1750 on 11 June generated plumes that rose 300 and 600 m above the crater, respectively. Plumes from the vents rose 1 km during 12-13 June. A sulfur odor was noted in Quesada (26 km ENE), Santa Ana (30 km SSE), San José de Alajuela, and San Juanillo Naranjo.
Gas emissions during 13-15 June rose no higher than 500 m above the crater rim and drifted N. During breaks in weather, observers near the crater on 16 June noted ash emissions rising less than 1 km above the crater rim and drifting N. Ash emissions from events at 1340 on 18 June, and 1100 and 1350 on 20 June, rose less than 1 km.
During 20-25 June, plumes of reddish-colored ash, water vapor, and magmatic gases were recorded rising as high as 500 m above two vents during 20-21 June. Magmatic gases and steam plumes rose as high as 1 km above the vents the rest of the period.
Webcams recorded intense incandescence at night during 28-29 June from the bottom of the crater. A sulfur odor was noted in San Rafael de Poás (12 km SSW) and Vara Blanca (10 km ESE). An event at 1115 on 19 June generated a plume that rose 1 km above the vents. An event at 1450 may have generated a plume, but poor visibility did not allow for confirmation.
Activity during July-December 2017. According to OVSICORI-UNA, frequent, but weak Strombolian activity during 1-4 July ejected incandescent material that fell around vent A (Boca Roja). Plumes of steam, magmatic gases, and particulates rose at most 500 m from the vents.
During 4-9 July, plumes of steam, magmatic gases, and aerosols rose 200-600 m above vents A (Boca Roja) and B (Boca Azufrada). Minor incandescence from the bottom of the crater was observed during 4-5 July, and a strong sulfur odor was reported in some areas of Alajuela and Heredia. During 5-7 July, grayish-red ash emissions rose intermittently from vent A, and on 7 July a loud "jet" sound was noted in Mirador. A strong sulfur odor and minor ashfall was reported in some areas of Alajuela. An event at 1450 on 10 July generated a plume that rose 300 m.
OVSICORI-UNA reported that during 12-17 July, gas plumes rose as high as 1 km above vents A and B and drifted SW and NW. From 19 through 24 July plumes of steam, magmatic gases, and aerosols were emitted from vent A, and plumes of steam, gases, and abundant yellow particles of native sulfur rose from vent B. Plumes rose 300-500 m above the vents and drifted W and SW.
On 1 August an event passively produced a plume that rose 500 m above the crater. Incandescence from the bottom of the crater was recorded at night by the webcams. Sulfur dioxide was emitted at a rate of 1,000-1,500 t/d. Activity on 3 August was similar to that in July, except that plumes rose as high as 1 km above the vents. Gas plumes continued to rise from the vents and drift SW and NW at least through 8 August. OVSICORI-UNA reported additional explosions on 22 August (1517 local), 24 August (0920 and 0930), 29 August (0945), 13 September (0820), and 6 November (0915) that rose 300-600 m above the crater rim.
Seismicity. During May and June, some volcano-tectonic (VT) and LP earthquakes were recorded, and tremor levels generally ranged from low-to-moderate amplitude, although higher tremor levels were sometimes detected during 22-30 May. The tremor amplitude often corresponded to the vigor of emissions of steam, magmatic gases, and material from fumarolic vents. Seismic activity was not identified after 30 June, except for a single report that indicated that during 11-14 August seismographs detected low-amplitude tremor, some VT earthquakes, and high-frequency signals indicating gas emissions.
Geologic Background. The broad vegetated edifice of Poás, one of the most active volcanoes of Costa Rica, contains three craters along a N-S line. The frequently visited multi-hued summit crater lakes of the basaltic-to-dacitic volcano are easily accessible by vehicle from the nearby capital city of San José. A N-S-trending fissure cutting the complex stratovolcano extends to the lower N flank, where it has produced the Congo stratovolcano and several lake-filled maars. The southernmost of the two summit crater lakes, Botos, last erupted about 7,500 years ago. The more prominent geothermally heated northern lake, Laguna Caliente, is one of the world's most acidic natural lakes, with a pH of near zero. It has been the site of frequent phreatic and phreatomagmatic eruptions since an eruption was reported in 1828. Eruptions often include geyser-like ejections of crater-lake water.
Information Contacts: Observatorio Vulcanologico Sismologica de Costa Rica-Universidad Nacional (OVSICORI-UNA), Apartado 86-3000, Heredia, Costa Rica (URL: http://www.ovsicori.una.ac.cr/); National Emergency Commission (CNE) (Comisión Nacional de Prevención de Riesgos y Atención de Emergencias (CNE) (URL: http://www.cne.go.cr); Tico Times (URL: http://www.ticotimes.net/); The Costa Rica Star (URL: https://news.co.cr/).
Rincon de la Vieja (Costa Rica) — March 2018 Cite this Report
Rincon de la Vieja
Costa Rica
10.8314°N, 85.3364°W; summit elev. 1729 m
All times are local (unless otherwise noted)
Phreatic explosions during 29 September-22 October 2017
During the first half of 2017, phreatic explosions at Rincón de la Vieja occurred on 23 May, 11-12 June (however, clouds obscured visible observations), 18 and 23 June, and 5 July (BGVN 42:08). This report describes activity from 6 July through December 2017. Information comes from the Observatorio Vulcanológico Sismológica de Costa Rica-Universidad Nacional (OVSICORI-UNA).
After a small phreatic explosion on 5 July 2017, there were no further reports of any explosions until 29 September when OVSICORI-UNA reported that at 0848 a small phreatic explosion produced a plume that rose 1 km above the crater rim (figure 27); material also flowed down the S flank.
According to OVSICORI-UNA, events on 3 October at 0848 and 1445 generated plumes that rose 700 m and 1,500 m, respectively. OVSICORI-UNA also reported that on 9 October at 1048, a small explosion produced a plume that rose 700 m above the crater rim. According to news reports (The Costa Rica Star and CRHoy.com) quoting OVSICORI-UNA, an explosion on 22 October at 0640 generated a steam-and-gas plume that rose about 1 km above the crater. There were no further reports of an explosion through the end of December.
Geologic Background. Rincón de la Vieja is a volcanic complex in the Guanacaste Range of NW Costa Rica. Sometimes referred to as the Rincon de la Vieja-Santa María Volcanic Complex, it consists of a slightly arcuate 20-km-long ridge of 12 craters and pyroclastic cones constructed within the 15-km-wide early Pleistocene Guachipelín caldera, whose rim is exposed on the south side. Sometimes known as the "Colossus of Guanacaste," it has an estimated volume of 130 km3 and contains at least nine major eruptive centers. The Santa María cone, the highest peak of the complex, is located on the E side of the ridge and has a lake within the 400-m-diameter crater. A Plinian eruption producing the 0.25 km3 Río Blanca tephra about 3,500 years ago was the last major magmatic eruption. All subsequent eruptions, including numerous reported eruptions possibly dating back to the 16th century, have been from the active crater, near the center of the complex, with an acidic 300-m-diameter lake.
Information Contacts: Observatorio Vulcanológico Sismológica de Costa Rica-Universidad Nacional (OVSICORI-UNA), Apartado 86-3000, Heredia, Costa Rica (URL: http://www.ovsicori.una.ac.cr/, https://www.facebook.com/OVSICORI/); CRHoy.com (URL: http://www.crhoy.com/); The Costa Rica Star (URL: https://news.co.cr/).
San Cristobal (Nicaragua) — March 2018 Cite this Report
San Cristobal
Nicaragua
12.702°N, 87.004°W; summit elev. 1745 m
All times are local (unless otherwise noted)
Intermittent ash-bearing explosions during 2017; ash plume drifts 250 km in August
Nicaragua's San Cristóbal volcanic complex has exhibited sporadic eruptive activity dated back to the early 16th century. More consistent modern record keeping has documented short-lived eruptive episodes every year since 1999. Small explosions with intermittent gas-and-ash emissions are typical. Three single-day explosive events were reported in 2015; a series of explosions on 5 March 2015 generated a 500 m high ash plume, 41 explosions on 6 June 2015 ejected ash 200 m above the summit, and the first of two explosions on 12 June 2015 sent an ash plume 2,000 m above the summit. The next eruption did not occur until 22 April 2016 when 11 explosions were recorded, with the largest sending an ash plume 2,000 m above the summit. Activity from July 2016-December 2017 is covered in this report. Information is provided by the Instituto Nicaragüense de Estudios Territoriales (INETER), and the Washington Volcanic Ash Advisory Center (VAAC).
Following little activity during the remainder of 2016 after the 22 April explosions, small explosions with minor ash were reported in February, March, and April 2017. Significant explosions during 18-19 August sent ash plumes over 200 km W and deposited ash in numerous communities. Seismicity was high during October-December 2017, but ash-bearing explosions were only reported on 7 and 11 November.
After the 22 April 2016 explosions, San Cristóbal remained quiet for the remainder of 2016. In the month's they were measured, 45-72 degassing-type seismic events were recorded. During a field visit on 29 November 2016, new landslides around the crater rim, both inside the crater and down the outer flanks, were observed. These were interpreted by INETER scientists as resulting from a major tectonic earthquake that occurred offshore in mid-November that was felt in nearby Chinandega (16 km SW), and not from volcanic activity.
Seismic activity increased slightly in January 2017 with 100 degassing events recorded. INETER reported 15 small ash-and-gas explosions during 18-19 February and 153 degassing events. There were no reports of ashfall in the nearby communities. Only 27 degassing seismic events were reported in March; three small gas explosions with minor ash occurred on 16, 25, and 28 March 2017.
Eight small explosions with gas and minor ash took place during April 2017 on days 13, 15, 16 and 19, but no damage was reported in nearby communities. Very low values of SO2 (averaging 147 tons/day) were measured at the end of April 2017, far less than values of 854 and 642 measured in September and October 2016. Degassing-type seismic events increased sharply beginning on 20 April, totaling 1,931 events; they remained elevated through 25 April.
Volcano-tectonic (VT) earthquakes increased significantly to 235 recorded events during May, from values in the single digits earlier in the year. Minor fumarolic activity occurred at the S side of the summit crater on 27 May 2017 (figure 33). Two small gas explosions were recorded on 20 and 27 May, but no ash emissions were reported. A significant increase to 2,349 degasification-type earthquakes was reported during June 2017; slightly fewer (1,981) were reported during July.
Significant explosions early on 18 August 2017 were observed from Chinandega with notable gas and ash emissions (figure 34), and ashfall was deposited around the region (figure 35). Communities affected by the ashfall were located to the W and SW of the volcano and included Belén, La Mora, La Bolsa, El Viejo (18 km WSW), La Grecia, Realejo (25 km SW) and Corinto (30 km SW). Ash plumes rose between 300 and 600 m above the crater rim and drifted W and SW. Additional explosions occurred the next day but had ceased by 20 August.
A small plume was noted in satellite imagery by the Washington VAAC on 18 August 2017 moving NW. Later imagery showed gas and ash drifting W at an estimated altitude of 2.1 km. It extended approximately 265 km W of the summit before dissipating. Ground measurements of SO2 made during 18-20 August showed increases to a peak of 3,519 metric tons per day on 19 August before dropping back to more typical background values below 700 t/d. INETER scientists used GOES and AVHRR satellite images to identify the maximum extent of the ash plume from the eruptive event. The ash cloud covered the area W of San Cristóbal, approximately 2,960 Km2, and extended more than 80 km offshore, with a total length of 125 km and a maximum width of 33 km (figure 36). Seismometers recorded 3,880 degassing-type seismic events during August 2017. Seismicity decreased slightly during September 2017 to 2,604 measured events, of which 2,415 were degassing-type, 187 were VT events, and two explosions were recorded on 1 September, but no ashfall was reported.
An order-of-magnitude increase in seismicity occurred during October-December 2017, with the monthly totals of the numbers of events ranging from 17,000-21,000 (figure 37). INETER reported a series of 14 explosions during the evening of 7 November. Ashfall was reported to the W in Los Farallones, San Agustín, La Mora, El Naranjo and the city of Chinandega. The Washington VAAC subsequently reported an ash plume that models suggested rose to 6.7 km and drifted W on 11 November.
Geologic Background. The San Cristóbal volcanic complex, consisting of five principal volcanic edifices, forms the NW end of the Marrabios Range. The symmetrical 1745-m-high youngest cone, named San Cristóbal (also known as El Viejo), is Nicaragua's highest volcano and is capped by a 500 x 600 m wide crater. El Chonco, with several flank lava domes, is located 4 km W of San Cristóbal; it and the eroded Moyotepe volcano, 4 km NE of San Cristóbal, are of Pleistocene age. Volcán Casita, containing an elongated summit crater, lies immediately east of San Cristóbal and was the site of a catastrophic landslide and lahar in 1998. The Plio-Pleistocene La Pelona caldera is located at the eastern end of the complex. Historical eruptions from San Cristóbal, consisting of small-to-moderate explosive activity, have been reported since the 16th century. Some other 16th-century eruptions attributed to Casita volcano are uncertain and may have been from other Marrabios Range volcanoes.
Information Contacts: Instituto Nicaragüense de Estudios Territoriales (INETER), Apartado Postal 2110, Managua, Nicaragua (URL: http://www.ineter.gob.ni/); Washington Volcanic Ash Advisory Center (VAAC), Satellite Analysis Branch (SAB), NOAA/NESDIS OSPO, NOAA Science Center Room 401, 5200 Auth Rd, Camp Springs, MD 20746, USA (URL: www.ospo.noaa.gov/Products/atmosphere/vaac, archive at: http://www.ssd.noaa.gov/VAAC/archive.html).
Sangay
Ecuador
2.005°S, 78.341°W; summit elev. 5286 m
All times are local (unless otherwise noted)
Eruptive episode of ash-bearing explosions and lava on SE flank, 20 July-26 October 2017
Periodic eruptive activity at Ecuador's remote Sangay has included frequent explosions with ash emissions and occasional andesitic block lava flows. Eruptive activity from late March to mid-November 2016 included multiple ash emissions and persistent thermal signals through July 2016 (BGVN 42:08). A new episode of ash emissions and thermal anomalies, that began on 20 July 2017 (BGVN 42:08) and lasted through late October 2017, is covered in this report. Subsequent activity through February 2018 included a single ash-emission event near the end of the month. Information is provided by Ecuador's Instituto Geofísico (IG) and the Washington Volcanic Ash Advisory Center (VAAC); thermal data from the MODIS satellite instrument is recorded by the University of Hawaii's MODVOLC system and the Italian MIROVA project.
The first ash plume of the latest eruptive episode at Sangay was reported on 20 July 2017. VAAC reports were issued on 20 and 21 July, eleven days in August, six days in September, and on 13 October. Thermal activity first appeared in a MIROVA plot during the last week of July and continued through 26 October. Multiple MODVOLC thermal alerts were issued between 2 August and 19 October. IG reported that low-energy ash emissions rising 1 km or less above the summit crater were typical throughout the period. They also repeatedly noted two distinct thermal hot spots in satellite data. A single ash emission on 25 February 2018 was the only additional activity through the end of February 2018.
Activity during July-October 2017. The Washington VAAC reported an ash emission on 20 July 2017 that rose to 8.2 km altitude and drifted about 80 km W. A plume was reported on 1 August by the Guyaquil MWO near the summit at about 5.3 km altitude, but was obscured by clouds in satellite imagery. The following day an ash plume was observed at 7.6 km altitude centered about 15 km NW of the summit. An ash emission was reported on 6 August, but was not visible in satellite imagery. The MWO reported an ash emission on 12 August at 6.4 km altitude moving SW, but no ash was detected in satellite imagery under partly cloudy conditions. The Washington VAAC observed an ash plume on 13 August extending around 50 km SW at 6.1 km altitude and a well-defined hotpot. IG reported an ash emission drifting W on 16 August, but clouds obscured satellite views of the plume. Hotspots continued to be observed in shortwave infrared (SWIR) imagery. The Washington VAAC reported an ash plume at 8.2 km altitude on 17 August. The imagery showed an initial puff moving NW followed by several smaller puffs. On 19 August, the Guayaquil MWO reported an ash plume at 5.8 km altitude drifting SW. The next day, another explosion was reported with ash rising again to 5.8 km and drifting W, and a hotspot was observed in satellite imagery.
The Washington VAAC reported a possible ash plume extending 30 km SW of the summit at 7 km altitude on 22 August. It had dissipated the next day, but they noted that a hotspot was visible in SWIR imagery. The next ash plume was reported by the MWO on 1 September at 5.2 km altitude but was not observed in satellite imagery. The next day, the Washington VAAC observed an ash plume at 6.1 km altitude extending 15 km NW of the summit. The Guayaquil MWO reported an ash plume to 7.3 km altitude on 6 September. On 20 September, a possible ash plume could be seen in GOES-16 imagery extending about 150 km W from the summit at 6.1 km altitude. Another plume extended 15 km SW from the summit later in the day at the same altitude. By the end of the day, continuous ash emissions were reported drifting W at 5.8 km altitude. The following day, occasional ash emissions were still reported drifting W and dissipating within 35 km of the summit. A new emission late on 21 September sent an ash plume 25 km W of the summit at 6.1 km altitude. Possible ongoing emissions were reported on 22 September, but not visible in satellite imagery. After three weeks of quiet, the Washington VAAC reported an ash emission on 13 October drifting S at 6.1 km altitude along with a bright hot spot visible for part of the day. This was the last report of ash emissions for 2017.
The eruption that began on 20 July 2017 was characterized by explosions from the central crater and lava emissions from the Ñuñurco dome on the E side of the summit. IG reported two areas of hot spots visible in thermal images during August and September. Around 65 seismic explosions and 25 long-period events were recorded daily during most of this time, along with a few harmonic tremors. Low-energy ash emissions rising 1 km or less above the summit crater were typical. Ashfall was reported to the SW and NW in Culebrillas (75 km SW), and Licto (35 km NW). New lava flows were interpreted to be on the ESE flank by IG based on the repeated hot spots visible in satellite imagery and darkened areas in the snow in the webcam images (figure 23).
Thermal activity measured from satellite instruments support the interpretation of significant lava emissions as blocks or flows at Sangay during late July-October 2017. The MODVOLC system reported 11 thermal alerts beginning on 14 August, 15 during September, and 13 between 3 and 19 October. A similar signal of thermal activity was recorded by the MIROVA system during the same period (figure 24).
Activity on 25 February 2018. The Washington VAAC reported an ash plume rising to 6.1 km altitude and drifting NE from the summit on 25 February 2018. The plume was visible 170 km NE before dissipating by the end of the day.
Geologic Background. The isolated Sangay volcano, located east of the Andean crest, is the southernmost of Ecuador's volcanoes and its most active. The steep-sided, glacier-covered, dominantly andesitic volcano grew within the open calderas of two previous edifices which were destroyed by collapse to the east, producing large debris avalanches that reached the Amazonian lowlands. The modern edifice dates back to at least 14,000 years ago. It towers above the tropical jungle on the east side; on the other sides flat plains of ash have been eroded by heavy rains into steep-walled canyons up to 600 m deep. The earliest report of an eruption was in 1628. Almost continuous eruptions were reported from 1728 until 1916, and again from 1934 to the present. The almost constant activity has caused frequent changes to the morphology of the summit crater complex.
Information Contacts: Instituto Geofísico (IG), Escuela Politécnica Nacional, Casilla 17-01-2759, Quito, Ecuador (URL: http://www.igepn.edu.ec ); Washington Volcanic Ash Advisory Center (VAAC), Satellite Analysis Branch (SAB), NOAA/NESDIS OSPO, NOAA Science Center Room 401, 5200 Auth Rd, Camp Springs, MD 20746, USA (URL: www.ospo.noaa.gov/Products/atmosphere/vaac, archive at: http://www.ssd.noaa.gov/VAAC/archive.html); Hawai'i Institute of Geophysics and Planetology (HIGP) - MODVOLC Thermal Alerts System, School of Ocean and Earth Science and Technology (SOEST), Univ. of Hawai'i, 2525 Correa Road, Honolulu, HI 96822, USA (URL: http://modis.higp.hawaii.edu/); MIROVA (Middle InfraRed Observation of Volcanic Activity), a collaborative project between the Universities of Turin and Florence (Italy) supported by the Centre for Volcanic Risk of the Italian Civil Protection Department (URL: http://www.mirovaweb.it/).
Suwanosejima (Japan) — March 2018 Cite this Report
Suwanosejima
Japan
29.638°N, 129.714°E; summit elev. 796 m
All times are local (unless otherwise noted)
Large explosions with ash plumes and Strombolian activity continue during 2017
Suwanosejima, an andesitic stratovolcano in Japan's northern Ryukyu Islands, was intermittently active for much of the 20th century, producing ash plumes, Strombolian explosions, and ash deposits. Continuous activity since October 2004 (figure 24) has consisted generally of multiple ash plumes most months rising hundreds of meters above the summit to altitudes between 1 and 3 km, and tens of reported explosions. The rate of activity began increasing during 2014; the frequency of explosions and the height of the plumes have continued to increase through 2017, which is covered in this report. Information is provided primarily by the Japan Meteorological Agency (JMA), and the Tokyo Volcanic Ash Advisory Center (VAAC).
Activity at Suwanosejima has been persistent and generally increasing during 2014-2017 (figure 25). During 2017, ash emissions rose from a few hundred to nearly 3 km above the Otake crater rim. Large explosions were reported 32 times by JMA, including 12 during August. Most explosions sent ash emissions to less than 1,000 m above the crater rim, but the highest ash plume, on 3 August 2017, rose 2.8 km above the crater rim, and was the highest recorded since observations began in 2003. Incandescence was observed at the crater from a thermal camera throughout the year and was witnessed locally many times. Many of the explosions, large and small, were heard in the nearby village. Ashfall was confirmed in the village to the SSW on nine different occasions during the year.
Activity during January-April 2017. There were no large explosions at Suwanosejima during January 2017, but occasional minor ash emissions rose as high as 1,300 m above the Otake crater rim. Incandescence was visible from the webcam on most clear nights. Ashfall was reported in the village 4 km S on 17 and 26 January. The Tokyo VAAC reported ash emissions four times in January. Ash plumes rose to 1.2 km altitude and drifted SE on 4 January; to 1.8 km and drifted W on 5 January; to 1.2 km and drifted S on 16-17 January; and to 2.1 km and drifted SE on 25 January.
In contrast with January, five large explosions were reported by JMA during February 2017. The first, on 9 February, sent an ash plume to 700 m above the crater rim. An ash emission on 18 February rose to 1,200 m above the rim (figure 26). People in the nearby village reported hearing explosions on 18, 20, 27, and 28 February. The largest explosions occurred during 27-28 February when ejecta was scattered 600 m from the crater rim. The Tokyo VAAC reported ash emissions drifting SE several times: on 9 February at 1.5 km altitude, on 16 and 17 February at 1.8 km, and during 27-28 February at 1.5 km.
Intermittent ash emissions occurred during March 2017, but no large explosive events were reported. Ejecta was scattered around the edge of the crater on 4 March and an ash plume rose 1,000 m. Small ash plumes were noted rising 900 m on 12 and 15 March; explosions were heard in the village on 14 and 16 March, and ashfall was reported there on 25 March. Incandescence was observed at the summit intermittently throughout the month. During a field survey on 21 and 22 March, JMA noted minor thermal anomalies at the Otake Crater, the N slope of the Otake crater, and just above the coastline on the E flank (figure 27). The Tokyo VAAC reported ash emissions three times during March; on 3 March ash plumes rose to 1.5-1.8 km altitude and drifted SE and on both 28 and 31 March they rose to 1.8 km altitude and drifted SE and E.
Only minor ash emissions and occasional incandescence was reported during April 2017. Two emission events on 1 April sent ash plumes to 1,200 m above the crater rim. A tremor that lasted nine minutes occurred on 11 April and a small seismic swarm was recorded on 13 April. Small explosions were also reported on 17 and 19 April, with the 19 April event heard at the nearby village; another small explosion was reported on 30 April. There were no reports issued by the Tokyo VAAC.
Activity during May-August 2017. Activity increased slightly during May 2017; two large explosions were recorded by JMA. A small explosion was reported on 1 May, and the highest plume rose to 1,900 m above the crater rim on 10 May during a larger event. Incandescence was observed from the local village on 16 May, and explosions were heard from the village on 16 and 18 May, and again on 28 and 29 May; no ashfall was reported. The Tokyo VAAC reported ash emissions on 7, 8, and 10 May. On 7 May they reported an ash plume located 45 km S at 1 km altitude extending SW. A few hours later ash extended N at 1.5 km. An explosion on 8 May sent an ash plume to 2.1 km where it remained stationary over the volcano for much of the day before dissipating. A higher ash plume was reported on 10 May at 2.7 km altitude drifting E.
Small ash explosions occurred at Otake Crater on 8 and 21 June 2017, but there were no larger explosive events. Ash plume heights rose to only 600 m above the crater rim, and occasional nighttime incandescence was reported. No reports were issued by the Tokyo VAAC. JMA reported that the highest ash plume during July rose 2.1 km above the summit crater on 17 July, but no large explosions were recorded. Incandescence was observed intermittently throughout the month. A small explosion on 2 July sent an ash plume to 1.9 km above the crater rim. Intermittent ash emissions were noted during 17-19, 22 and 25 July. The Tokyo VAAC reported ash emissions during 2 and 16-18 July. They reported the plumes on 2 July at 1.8-2.4 km altitude, extending N for most of the day. A new explosion on 16 July sent an ash plume to 2.7 km altitude that drifted E. Intermittent ash emissions continued to drift E through 18 July at altitudes ranging from 1.8-2.1 km.
Activity increased substantially during August 2017; JMA reported 12 large explosions, nine of which occurred during the last week. Ashfall was reported in the nearby village on 2 August. The highest plume of the month was reported on 3 August, 2.8 km above the crater rim. Explosions were heard in the village on 3 and 19 August. A small explosion was reported on 12 August. Large explosions occurred on 19, 20, and 24 August in addition to the nine events during the last week. A single MODVOLC thermal alert was reported on 18 August, and the MIROVA system reported thermal anomalies during several days of the last week of the month (figure 28). The Washington VAAC reported ash on 1 August that rose to 2.4 km altitude and drifted SW. A higher plume on 3 August rose to 3.7 km and drifted W. They reported another ash plume that first rose to 3.0 km on 24 August; subsequent emissions that day were drifting NE at 2.1-2.4 km altitude. A new plume on 25 August extended E at 2.4 km. Continuing ash emissions from multiple explosions during 28-31 August rose to 1.2-3.0 km altitude and drifted SE.
Activity during September-December 2017. Four large explosions were recorded during the first week of September 2017, after which a number of smaller ash emission events were reported. Ashfall was reported four times in the nearby village on 2, 4, 29, and 30 September. The Tokyo VAAC reported explosions on 1, 4, 6, and 29 September. The ash plume from the explosion on 6 September rose to 1.5 km altitude and drifted E; on 29 September, it rose to 2.4 km altitude, also drifting E.
JMA reported four large explosions during October 2017. Two explosions occurred on 11 October; one of the ash plumes rose 1,900 m above the crater rim (figure 29). Explosions were heard in the nearby village on 12 and 31 October, and ashfall was reported on 13 October. During the large explosion of 31 October incandescent ejecta was scattered around the crater rim and the ash plume rose 1,900 m. The Tokyo VAAC reported an explosion with ash on 10 October (UTC) that rose to 2.7 km altitude and remained stationary until dissipating a few hours later. They noted that the explosion on 31 October produced a plume that rose over 1.5 km and drifted NW.
JMA reported five large explosions during November 2017. Incandescent ejecta was seen around the crater rim during the explosion of 1 November, and the plume rose to 2 km above the rim. Loud explosions were heard from the nearby village on 3, 5, 6, 15, and 16 November, and ashfall was reported there on 14, 15, and 20 November. A small explosion was reported on 10 November; intermittent explosions with ash plumes rising 700 m were observed on 20 and 21 November. The Tokyo VAAC reported ash plumes at 1.5 km drifting W on 1 and 5 November, and at 1.8 km altitude drifting NW on 10 November, the last VAAC report issued for 2017.
Only small explosions were reported from Otake crater during December 2017. The highest plume rose 700 m above the crater rim. Small explosions were heard a number of times in the nearby village on 8-9, 11-13, and 26-30 December. JMA scientists visiting during 8-10 December heard intermittent explosions and witnessed incandescence visible to the naked eye. They also observed ashfall in the village on the morning of 10 December. During a field survey on 14 December, no significant changes were noted from the previous survey in March 2017 (figures 30 and 31).
Geologic Background. The 8-km-long island of Suwanosejima in the northern Ryukyu Islands consists of an andesitic stratovolcano with two active summit craters. The summit is truncated by a large breached crater extending to the sea on the E flank that was formed by edifice collapse. One of Japan's most frequently active volcanoes, it was in a state of intermittent Strombolian activity from Otake, the NE summit crater, between 1949 and 1996, after which periods of inactivity lengthened. The largest recorded eruption took place in 1813-14, when thick scoria deposits covered residential areas, and the SW crater produced two lava flows that reached the western coast. At the end of the eruption the summit of Otake collapsed, forming a large debris avalanche and creating an open collapse scarp extending to the eastern coast. The island remained uninhabited for about 70 years after the 1813-1814 eruption. Lava flows reached the eastern coast of the island in 1884. Only about 50 people live on the island.
Information Contacts: Japan Meteorological Agency (JMA), Otemachi, 1-3-4, Chiyoda-ku Tokyo 100-8122, Japan (URL: http://www.jma.go.jp/jma/indexe.html); Tokyo Volcanic Ash Advisory Center (VAAC), 1-3-4 Otemachi, Chiyoda-ku, Tokyo, Japan (URL: http://ds.data.jma.go.jp/svd/vaac/data/); MIROVA (Middle InfraRed Observation of Volcanic Activity), a collaborative project between the Universities of Turin and Florence (Italy) supported by the Centre for Volcanic Risk of the Italian Civil Protection Department (URL: http://www.mirovaweb.it/); Hawai'i Institute of Geophysics and Planetology (HIGP) - MODVOLC Thermal Alerts System, School of Ocean and Earth Science and Technology (SOEST), Univ. of Hawai'i, 2525 Correa Road, Honolulu, HI 96822, USA (URL: http://modis.higp.hawaii.edu/).
Turrialba (Costa Rica) — March 2018 Cite this Report
Turrialba
Costa Rica
10.025°N, 83.767°W; summit elev. 3340 m
All times are local (unless otherwise noted)
Persistent explosions and ash emissions continue through 2017; small lava lake
A phreatic eruption at Turrialba in January 2010 heralded a series of brief eruptions during subsequent years. Explosions and emissions containing ash increased in 2015 and 2016 (BGVN 42:06). The current report indicates that increased activity continued during 2017. The information below comes from the Observatorio Vulcanologico y Sysmologico de Costa Rica-Universidad Nacional (OVSICORI-UNA) unless otherwise indicated.
Frequent ash emissions, both passive and explosive events, rose the heights of less than 1 km above the crater and were blown downwind, causing ashfall in communities within about 40 km, and a sulfur odor at greater distances. Fumarolic plumes described as consisting of water vapor, aerosols, and magmatic gases were also common from the West Crater. Volcanic seismicity was variable, often corresponding to changes in activity.
Activity during January-June 2017. During the first part of January, no explosions took place. Based on webcam and satellite views, the Washington Volcanic Ash Advisory Center (VAAC) reported that on 22 January, an ash plume rose to an altitude of 4 km and drifted E. The VAAC reported ongoing ash emissions on 27 January.
On 1 February, OVSICORI-UNA reported that since 27 January the seismic network had recorded variable-amplitude, discontinuous tremor indicative of moving pressurized volcanic fluid. Passive emissions of ash were observed during 1-2 February, rising as high as 500 m above the crater. Ashfall was reported in the area of the capital, San Jose (about 37 km WSW), including Desamparados, Calle Blancos, and Tres Ríos (27 km WSW), and a sulfur odor was noted in San Pablo Heredia (35 km W). An explosion at 0900 on 4 February generated an ash plume that rose 300 m and drifted W. Almost continuous ash emissions rose at most 500 above the crater during 4-5 February and drifted WSW (figure 48).
OVSICORI-UNA reported that at 1610 on 8 February, an ash plume rose 300 m and drifted N. An event at 1531 on 10 February also produced an ash plume, but inclement weather prevented observations. During 11-12 February, variable amplitude tremor was detected, and at night hot blocks ejected from the vent landed in Central Crater. Several events on 13 February (at 0255, 0305, 0415, and 1459) produced ash plumes that rose as high as 1 km and drifted N, NW, and W. Small ejections of incandescent material fell around the active crater during the early morning. On 14 February continuous emissions of gas and steam with low ash content were visible. A strong sulfur odor was reported in San Pablo de Oreamuno (25 km SW). High-amplitude tremor remained constant during 15-16 February and sporadic gas emissions with minor amounts of ash drifted S and E; occasional ballistics were ejected from the crater. During 16-17 February tremor amplitude decreased and sporadic gas emissions with low ash content rose no higher than 300 m and drifted NW and SW. Similar emissions were observed during 20-21 February, drifting NW and NE.
Weak gas emissions during 20-21 March sometimes contained small amounts of ash that rose no higher than 100 m above the crater rim and drifted SW. Volcanic tremor had medium and variable amplitude, and a few low-frequency (LF) earthquakes were recorded. A weak ash emission was visible during 1800-1940 on 25 March. Periods of more intense crater incandescence, from possible Strombolian activity, corresponded to higher tremor amplitude during 0330-0530 on 26 March. Later that day a small plume with minor ash rose 500 m above the crater and drifted S and SE. An event at 0752 on 28 March generated an ash plume that rose 300 m and drifted S.
Ash-and-gas plumes rose 500 m above the crater during 31 March-1 April, and ashfall was reported at the Juan Santamaría airport (48 km W). Ash plumes rose 500 m at 1700 on 2 April, and 200 m at 0601 on 4 April. A passive ash emission occurred on 16 April. An event at 0751 on 17 April generated a plume containing minor amounts of ash that rose 500 m above the crater and drifted SW. On 18 April, a diffuse plume consisting of gas and sometimes ash rose 1 km above the crater and drifted W.
An event at 1700 on 5 May generated a weak ash plume that rose 500 m above the crater and drifted SW. Two short-amplitude events occurred at 1702 and 1820, though it was uncertain if they were associated with an explosion. During 5-7 May volcano-tectonic (VT) and long-period (LP) earthquakes were detected, as well as variable-amplitude tremor. At 1250 on 6 May, an event produced a plume that rose 300 m and drifted W. Passive ash emissions occurred between 1250 and 1730 on 6 May, and at 1000 on 7 May, that rose no higher than 1 km. At 0902 on 9 May an event generated an ash plume that rose 500 m and drifted NW.
An explosion on 10 May was followed by weak and passive ash emissions. Several LP earthquakes were recorded, and inflation continued. Gas measurements indicated a sulfur dioxide flux of 1,000 tonnes/day, and a high carbon dioxide/sulfur dioxide ratio. An event at 0900 on 12 May generated a plume, though poor visibility prevented a height estimate. An event at 0730 on 14 May generated a plume that rose 500 m above the crater rim and drifted N. Low-amplitude tremor was detected during 15-16 May, and a discontinuous ash plume rose no more than 500 m and drifted N and NW.
Ash emissions observed during 17-23 May rose as high as 1 km above the vent. Ashfall was reported in El Tapojo and Juan Viñas (15 km SSE) during 17-18 May, and in Capellades (along with a strong sulfur odor) during 19-20 May. During 23-30 May, tremor amplitude fluctuated from low to high levels, often corresponding to emission characteristics; periods of VT and LP events were also recorded. During 24-26 May several passive ash emissions rose no higher than 500 m above the vent and drifted NW and SW. Frequent and small explosions during 26-27 May generated ash plumes that rose higher than 500 m above the vent and ejected material higher than 200 m and no farther than 100 m towards Central Crater. Small explosions during 27-29 May produced ash plumes that rose 300-500 m. Fumarolic plumes during 30-31 May occasionally contained ash that rose no higher than 300 m above the crater rim and drifted NW.
On 3 June at 1930 an event produced an ash plume that rose 300 m and drifted SW. During 7-13 June, tremor amplitude fluctuated from low to medium levels and periods of small VT events and many small-amplitude LP events were also recorded. Fumarolic plumes rose as high as 1 km above the vent and drifted mainly NW, W, and SW. Gas emissions during 14-15 June sometimes containing ash rose no higher than 300 m above the crater. Events at 0620 and 1405 on 16 June generated ash plumes that rose 500 m and drifted NW, and 200 m and drifted S, respectively. Passive ash emissions during 19-20 June rose as high as 1 km and drifted in multiple directions. During 20-25 June fumarolic plumes rose as high as 1 km above the crater; the gases were strongly incandescent the night of 22-23 June.
Drone observations on 29 June 2017. According to an RSN:UCR-ICE report and meeting abstract (Ruiz and others, 2017), government officials flew a drone over the volcano on 29 June 2017. The observations showed profound changes in the morphology of the active crater since a previous overflight on 30 March 2016. In March 2016, the active crater exhibited internal landslides, an accumulation of materials at the foot of the W wall, and a ring of fumaroles surrounding a small opening that constituted the point of ash emission. The active crater was narrow and had an oblong shape, with a longer axis in the E-W direction.
During the recent overflight, the active crater was deeper and wider, elliptical, with its longest axis in the SW-NE direction, coincident with the preferential direction of explosions. In the N and NE sectors of the crater floor ash and blocks had accumulated. The most significant feature of the crater's central sector was an opening with a major axis of about 50 m across from which incandescent material was observed; the group believed this incandescence originated in the small lava lake from which passive ash emissions or small explosions arise. The authors stated that lava was present on the crater floor, forming a small lava pool (15 x 25 m).
Activity during July-December 2017. During 29 June-11 July seismicity was characterized by low-to-medium amplitude tremor and a small number of low-amplitude VT and LP events. Fumarolic plumes and occasional ash rose as high as 1 km above the West Crater fumaroles. Incandescence from the main crater was recorded at night. Minor ashfall and a sulfur odor was reported in areas of San José including Rancho Redondo, Goicoechea, Moravia, San Pedro Montes de Oca, Guadalupe, and Coronado, and in San Rafael and Barva (Heredia). Parque Nacional Volcán Turrialba staff reported that ash was deposited between La Silvia and La Picada farms. Events at 1325 on 10 July and 1545 on 11 July generated plumes that rose 300 and 500 m above the crater rim, respectively.
Daily explosions over 12-17 July produced gas and ash plumes that rose 200-500 m and generally drifted NW, W, and SW. Multiple events on 15 July caused ashfall in Sabanilla de Montes de Oca (30 km WSW), Ipis (27 km SW), El Carmen de Guadalupe, Purral (26 km WSW), Guadalupe (32 km WSW), and Tibás (35 km WSW). A sulfur dioxide odor was also reported in San José (36 km WSW), Tibás, Guadalupe, Escazú (42 km WSW), and Puriscal (65 km WSW). During 19-24 July fumarolic plumes rose as high as 500 m, and on most nights incandescence emanated from West Crater. The emissions contained ash during 20-22 July; minor ash fell in Coronado (San José) on 20 July, and in Sabanilla de Montes de Oca on 22 July.
Events on 26 July, 9 August (1607), 21 August (1012), 24 August (0715), 28 August (1025), 5 September (0820 and 1550), 11 September (0730), 13 September (0820 and 1555), 14 September (0600), 18 September (0703), 25 September (1112), and 26 September (0910) produced plumes that rose 100-500 m above the crater rim and drifted NW, SW, N, and W.
During 27 September-1 October and on 3 October, daily events generated plumes that rose as high as 1 km above the crater rim and drifted NW, W, SW, and S. On 30 September explosions ejected hot material out of West Crater and minor ashfall was reported in Coronado (San José). On 3 October, ash fell in Santa Cruz (7 km SE), Las Verbenas, Santa Teresita, Calle Vargas, Guayabito, and La Isabel.
Events on 6 October (0815), 9 October (1040), 11 October (0927), and 20 October (0825) produced plumes that rose 50-300 m above the crater rim and drifted NW and N. Events at 1030, 1105, and 1445 on 30 October generated ash plumes that rose 200-500 m above the crater rim and drifted NW, W, and SW. Ashfall was reported in the community of Pacayas (about 12 km SSW).
The Washington VAAC reported that an ash emission was observed in webcam images on 4 November; ash was not identified in satellite images, though weather cloud cover was increasing and may have obscured views. According to OVSICORI-UNA, another ash emission began before 0730 on 13 November and intensified around 0830, generating an ash plume that rose 500 m above the crater rim and drifted SW. A small event at 1319 on 1 December generated a weak ash plume that rose 50 m above the crater rim and drifted SW.
Reference. Ruiz, P., Mora, M., Soto, G.J., Vega, P., Barrantes, R., 2017. Geomorphological mapping using drones into the eruptive summit of Turrialba volcano, Costa Rica. University of Costa Rica. Abstract V23A-0455, AGU Fall meeting of American Geophysical Union, New Orleans, 12 Dec 2017.
Geologic Background. Turrialba, the easternmost of Costa Rica's Holocene volcanoes, is a large vegetated basaltic-to-dacitic stratovolcano located across a broad saddle NE of Irazú volcano overlooking the city of Cartago. The massive edifice covers an area of 500 km2. Three well-defined craters occur at the upper SW end of a broad 800 x 2200 m summit depression that is breached to the NE. Most activity originated from the summit vent complex, but two pyroclastic cones are located on the SW flank. Five major explosive eruptions have occurred during the past 3500 years. A series of explosive eruptions during the 19th century were sometimes accompanied by pyroclastic flows. Fumarolic activity continues at the central and SW summit craters.
Information Contacts: Observatorio Vulcanologico Sismologica de Costa Rica-Universidad Nacional (OVSICORI-UNA), Apartado 86-3000, Heredia, Costa Rica (URL: http://www.ovsicori.una.ac.cr/); Red Sismologica Nacional (RSN) a collaboration between a) the Sección de Sismología, Vulcanología y Exploración Geofísica de la Escuela Centroamericana de Geología de la Universidad de Costa Rica (UCR), and b) the Área de Amenazas y Auscultación Sismológica y Volcánica del Instituto Costarricense de Electricidad (ICE), Costa Rica (URL: http://www.rsn.ucr.ac.cr/); Washington Volcanic Ash Advisory Center (VAAC), Satellite Analysis Branch (SAB), NOAA/NESDIS OSPO, NOAA Science Center Room 401, 5200 Auth Rd, Camp Springs, MD 20746, USA (URL: www.ospo.noaa.gov/Products/atmosphere/vaac, archive at: http://www.ssd.noaa.gov/VAAC/archive.html).