Recently Published Bulletin Reports
Shishaldin (United States) New eruption with significant Strombolian explosions, ash plumes, and ashfall
Ioto (Japan) New eruption with discolored water, ejecta, and floating pumice during October-December 2023
Purace (Colombia) Gas-and-ash emission on 16 November 2023
Etna (Italy) Strombolian explosions, lava fountains, and lava flows during July-August 2023
Suwanosejima (Japan) Eruption plumes, crater incandescence, and occasional explosions during July-October 2023
Aira (Japan) Explosions, ash plumes, ash fall, and crater incandescence during July-October 2023
Nishinoshima (Japan) Gray emissions during October 2023
Kilauea (United States) Strong lava fountains, lava flows, and spatter at Halema’uma’u during January-September 2023
Tinakula (Solomon Islands) Continued lava flows and thermal activity during June through November 2023
Fuego (Guatemala) Daily explosions, gas-and-ash plumes, and block avalanches during August-November 2023
Santa Maria (Guatemala) Continuing lava effusion, explosions, ash plumes, and pyroclastic flows during August-November 2023
Karangetang (Indonesia) Incandescent avalanches, pyroclastic flows, and ash plumes during July-September 2023
Shishaldin (United States) — December 2023  Cite this Report
Shishaldin
United States
54.756°N, 163.97°W; summit elev. 2857 m
All times are local (unless otherwise noted)
New eruption with significant Strombolian explosions, ash plumes, and ashfall
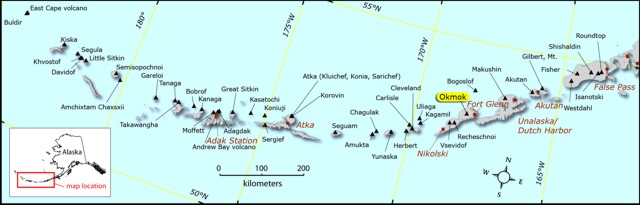
Shishaldin is located on the eastern half of Unimak Island, one of the Aleutian Islands. Frequent explosive activity, primarily consisting of Strombolian ash eruptions from the small summit crater, but sometimes producing lava flows, has been recorded since the 18th century. The previous eruption ended in May 2020 and was characterized by intermittent thermal activity, increased seismicity and surface temperatures, ash plumes, and ash deposits (BGVN 45:06). This report covers a new eruption during July through November 2023, which consisted of significant explosions, ash plumes, ashfall, and lava fountaining. Information comes from daily, weekly, and special reports from the Alaska Volcano Observatory (AVO) and various satellite data. AVO monitors the volcano using local seismic and infrasound sensors, satellite data, web cameras, and remote infrasound and lightning networks.
AVO reported that intermittent tremor and low-frequency earthquakes had gradually become more regular and consistent during 10-13 July. Strongly elevated surface temperatures at the summit were identified in satellite images during 10-13 July. On 11 July AVO raised the Aviation Color Code (ACC) to Yellow (the second color on a four-color scale) and Volcano Alert Level (VAL) to Advisory (the second level on a four-level scale) at 1439. Later in the day on 11 July summit crater incandescence was observed in webcam images. Observations of the summit suggested that lava was likely present at the crater, which prompted AVO to raise the ACC to Orange (the second highest color on a four-color scale) and the VAL to Watch (the second highest level on a four-level scale). The US Coast Guard conducted an overflight on 12 July and confirmed that lava was erupting from the summit. That same day, sulfur dioxide emissions were detected in satellite images.
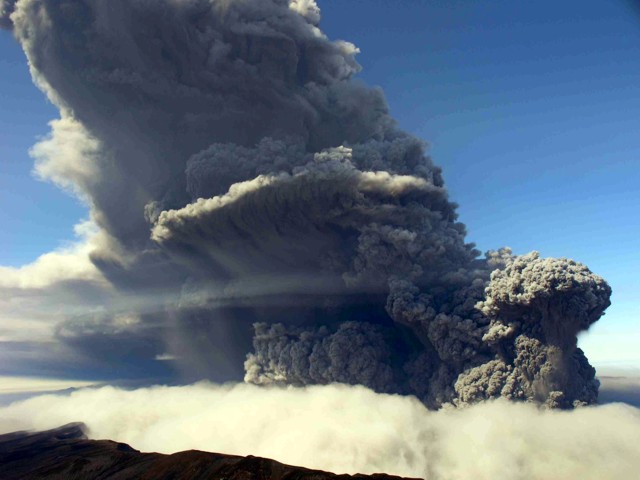
A significant explosion began at 0109 on 14 July that produced an ash plume that rose to 9-12 km altitude and drifted S over the Pacific Ocean (figure 43). Webcam images and photos taken around 0700 from a ship SW off Unimak Island showed small lahar deposits, which were the result of the interaction of hot pyroclastic material and snow and ice on the flanks. There was also ashfall on the SW and N flanks. A smaller explosion at 0710 generated an ash plume that rose to 4.5 km altitude. Webcam images and pilot reports showed continued low-level ash emissions during the morning, rising to less than 4.6 km altitude; those emissions included a small ash plume near the summit around 1030 resulting from a small explosion.
Seismic tremor amplitude began increasing at around 1700 on 15 July; strongly elevated surface temperatures were also reported. An ash plume rose to 4.6 km altitude and drifted SSE at 2100, based on a satellite image. A continuous ash plume during 2150 through 2330 rose to 5 km altitude and extended 125 km S. At 2357 AVO raised the ACC to Red (the highest color on a four-color scale) and the VAL to Warning (the highest level on a four-level scale), noting that seismicity remained elevated for more than six hours and explosion signals were frequently detected by regional infrasound (pressure sensor) networks. Explosions generated an ash plume that rose to 4.9 km altitude and drifted as far as 500 km SE. Activity throughout the night declined and by 0735 the ACC was lowered to Orange and the VAL to Watch. High-resolution satellite images taken on 16 July showed pyroclastic deposits extending as far as 3 km from the vent; these deposits generated lahars that extended further down the drainages on the flanks. Ash deposits were mainly observed on the SSE flank and extended to the shore of Unimak Island. During 16-17 July lava continued to erupt at the summit, which caused strongly elevated surface temperatures that were visible in satellite imagery.
Lava effusion increased at 0100 on 18 July, as noted in elevated surface temperatures identified in satellite data, increasing seismic tremor, and activity detected on regional infrasound arrays. A significant ash plume at 0700 rose to 7 km altitude and continued until 0830, eventually reaching 9.1 km altitude and drifting SSE (figure 44). As a result, the ACC was raised to Red and the VAL to Warning. By 0930 the main plume detached, but residual low-level ash emissions continued for several hours, remaining below 3 km altitude and drifting S. The eruption gradually declined and by 1208 the ACC was lowered to Orange and the VAL was lowered to Watch. High-resolution satellite images showed ash deposits on the SW flank and pyroclastic deposits on the N, E, and S flanks, extending as far as 3 km from the vent; lahars triggered by the eruption extended farther down the flanks (figure 45). Lava continued to erupt from the summit crater on 19 July.
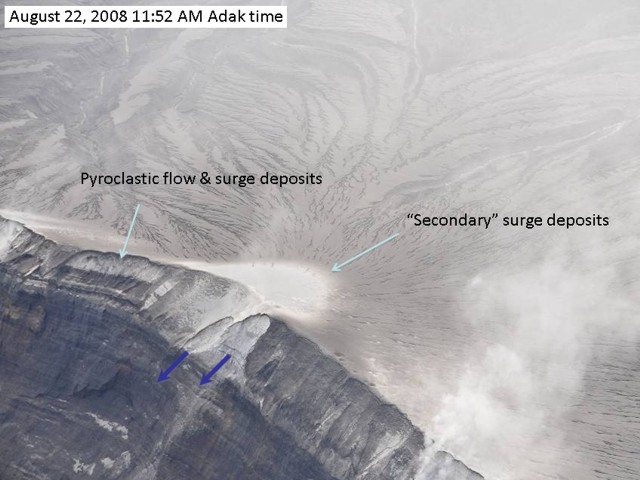
Elevated surface temperatures were detected in satellite images during 19-25 July, despite occasional weather cloud cover, which was consistent with increased lava effusion. During 22-23 July satellite observations acquired after the eruption from 18 July showed pyroclastic flow and lahar deposits extending as far as 3 km down the N, NW, and NE flanks and as far as 1.5 km down the S and SE flanks. Ash deposits covered the SW and NE flanks. No lava flows were observed outside the crater. On 22 July a sulfur dioxide plume was detected in satellite data midday that had an estimated mass of 10 kt. In a special notice issued at 1653 on 22 July AVO noted that eruptive activity had intensified over the previous six hours, which was characterized by an hours-long steady increase in seismic tremor, intermittent infrasound signals consistent with small explosions, and an increase in surface temperatures that were visible in satellite data. Pilots first reported low-level ash plumes at around 1900. At 2320 an ash plume had risen to 9 km altitude based on additional pilot reports and satellite images. The ACC was increased to Red and the VAL to Warning at 2343. Satellite images indicated growth of a significantly higher ash plume that rose to 11 km altitude continued until 0030 and drifted NE. During the early morning hours of 23 July ash plumes had declined to 4.6 k altitude. Seismic tremor peaked at 0030 on 23 July and began to rapidly decline at 0109; active ash emissions were no longer visible in satellite data by 0130. The ACC was lowered to Orange and the VAL to Watch at 0418; bursts of increased seismicity were recorded throughout the morning, but seismicity generally remained at low levels. Elevated surface temperatures were visible in satellite data until about 0600. On 24 July pilots reported seeing vigorous gas-and-steam plumes rising to about 3 km altitude; the plumes may have contained minor amounts of ash.
During 24-25 July low level seismicity and volcanic tremor were detected at low levels following the previous explosion on 23 July. Strongly elevated surface temperatures were observed at the summit crater in satellite data. Around 2200 on 25 July seismicity began to increase, followed by infrasound signals of explosions after 0200 on 26 July. An ash plume rose to 3 km altitude at 0500 and drifted ENE, along with an associated sulfur dioxide plume that drifted NE and had an estimated mass of 22 kt. Diffuse ash emissions were visible in satellite data and rose to 6.1-7.6 km altitude and extended 125 km from the volcano starting around 1130. These ash events were preceded by about seven hours of seismic tremor, infrasound detections of explosions, and five hours of increased surface temperatures visible in satellite data. Activity began to decline around 1327, which included low-frequency earthquakes and decreased volcanic tremor, and infrasound data no longer detected significant explosions. Surface temperatures remained elevated through the end of the month.
Seismicity, volcanic tremor, and ash emissions remained at low levels during early August. Satellite images on 1 August showed that some slumping had occurred on the E crater wall due to the recent explosive activity. Elevated surface temperatures continued, which was consistent with cooling lava. On 2 August small explosive events were detected, consistent with low-level Strombolian activity. Some episodes of volcanic tremor were reported, which reflected low-level ash emissions. Those ash emissions rose to less than 3 km altitude and drifted as far as 92.6 km N. Pilots that were located N of the volcano observed an ash plume that rose to 2.7 km altitude. Seismicity began to increase in intensity around 0900 on 3 August. Seismicity continued to increase throughout the day and through the night with strongly elevated surface temperatures, which suggested that lava was active at the surface.
An ash cloud that rose to 7.6-7.9 km altitude and drifted 60-75 km NE was visible in a satellite image at 0520 on 4 August. Pilots saw and reported the plume at 0836 (figure 46). By 0900 the plume had risen to 9.1 km altitude and extended over 100 km NE. AVO raised the ACC to Red and the VAL to Warning as a result. Seismic tremor levels peaked at 1400 and then sharply declined at 1500 to slightly elevated levels; the plume was sustained during the period of high tremor and drifted N and NE. The ACC was lowered to Orange and the VAL to Watch at 2055. During 5-14 August seismicity remained low and surface temperatures were elevated based on satellite data due to cooling lava. On 9 August a small lava flow was observed that extended from the crater rim to the upper NE flank. It had advanced to 55 m in length and appeared in satellite imagery on 11 August. Occasional gas-and-steam plumes were noted in webcam images. At 1827 AVO noted that seismic tremor had steadily increased during the afternoon and erupting lava was visible at the summit in satellite images.
Strong explosion signals were detected at 0200 on 15 August. An ash cloud that was visible in satellite data extended 100 km NE and may have risen as high as 11 km altitude around 0240. By 0335 satellite images showed the ash cloud rising to 7.6 km altitude and drifting NE. Significant seismicity and explosions were detected by the local AVO seismic and infrasound networks, and volcanic lightning was detected by the World Wide Lightning Location Network (WWLLN). A sulfur dioxide plume associated with the eruption drifted over the S Bering Sea and parts of Alaska and western Canada. Seismicity was significantly elevated during the eruption but had declined by 1322. A pilot reported that ash emissions continued, rising as high as 4.9 km altitude. Elevated surface temperatures detected in satellite data were caused by hot, eruptive material (pyroclastic debris and lava) that accumulated around the summit. Eruptive activity declined by 16 August and the associated sulfur dioxide plume had mostly dissipated; remnants continued to be identified in satellite images at least through 18 August. Surface temperatures remained elevated based on satellite images, indicating hot material on the upper parts of the volcano. Small explosions were detected in infrasound data on the morning of 19 August and were consistent with pilot reports of small, short-lived ash plumes that rose to about 4.3 km altitude. Low-level explosive activity was reported during 20-24 August, according to seismic and infrasound data, and weather clouds sometimes prevented views. Elevated surface temperatures were observed in satellite images, which indicated continued hot material on the upper parts of the volcano.
Seismic tremor began to increase at around 0300 on 25 August and was followed by elevated surface temperatures identified in satellite images, consistent with erupting lava. Small explosions were recorded in infrasound data. The ACC was raised to Red and the VAL to Warning at 1204 after a pilot reported an ash plume that rose to 9.1 km altitude. Seismicity peaked at 1630 and began to rapidly decline at around 1730. Ash plumes rose as high as 10 km altitude and drifted as far as 400 km NE. By 2020 the ash plumes had declined to 6.4 km altitude and continued to drift NE. Ash emissions were visible in satellite data until 0000 on 26 August and seismicity was at low levels. AVO lowered the ACC to Orange and the VAL to Watch at 0030. Minor explosive activity within the summit crater was detected during 26-28 August and strongly elevated surface temperatures were still visible in satellite imagery through the rest of the month. An AVO field crew working on Unimak Island observed a mass flow that descended the upper flanks beginning around 1720 on 27 August. The flow produced a short-lived ash cloud that rose to 4.5 km altitude and rapidly dissipated. The mass flow was likely caused by the collapse of spatter that accumulated on the summit crater rim.
Similar variable explosive activity was reported in September, although weather observations sometimes prevented observations. A moderate resolution satellite image from the afternoon of 1 September showed gas-and-steam emissions filling the summit crater and obscuring views of the vent. In addition, hot deposits from the previous 25-26 August explosive event were visible on the NE flank near the summit, based on a 1 September satellite image. On 2 and 4 September seismic and infrasound data showed signals of small, repetitive explosions. Variable gas-and-steam emissions from the summit were visible but there was no evidence of ash. Possible summit crater incandescence was visible in nighttime webcam images during 3-4 September.
Seismicity began to gradually increase at around 0300 on 5 September and activity escalated at around 0830. A pilot reported an ash plume that rose to 7.6 km altitude at 0842 and continued to rise as high as possibly 9.7 km altitude and drifted SSE based on satellite images (figure 47). The ACC was raised to Red and the VAL to Warning at 0900. In addition to strong tremor and sustained explosions, the eruption produced volcanic lightning that was detected by the WWLLN. Around 1100 seismicity decreased and satellite data confirmed that the altitude of the ash emissions had declined to 7.6 km altitude. By 1200 the lower-altitude portion of the ash plume had drifted 125 km E. Significant ash emissions ended by 1330 based on webcam images. The ACC was lowered to Orange and the VAL to Watch at 1440. Satellite images showed extensive pyroclastic debris flows on most of the flanks that extended 1.2-3.3 km from the crater rim.
During 6-13 September elevated surface temperatures continued to be observed in satellite data, seismicity remained elevated with weak but steady tremor, and small, low-frequency earthquakes and small explosions were reported, except on 12 September. On 6 September a low-level ash plume rose to 1.5-1.8 km altitude and drifted SSE. Occasional small and diffuse gas-and-steam emissions at the summit were visible in webcam images. Around 1800 on 13 September seismic tremor amplitudes began to increase, and small explosions were detected in seismic and infrasound data. Incandescent lava at the summit was seen in a webcam image taken at 0134 on 14 September during a period of elevated tremor. No ash emissions were reported during the period of elevated seismicity. Lava fountaining began around 0200, based on webcam images. Satellite-based radar observations showed that the lava fountaining activity led to the growth of a cone in the summit crater, which refilled most of the crater. By 0730 seismicity significantly declined and remained at low levels.
Seismic tremor began to increase around 0900 on 15 September and rapidly intensified. An explosive eruption began at around 1710, which prompted AVO to raise the ACC to Red and the VAL to Warning. Within about 30 minutes ash plumes drifted E below a weather cloud at 8.2 km altitude. The National Weather Service estimated that an ash-rich plume rose as high as 12.8 km altitude and produced volcanic lightning. The upper part of the ash plume detached from the vent around 1830 and drifted E, and was observed over the Gulf of Alaska. Around the same time, seismicity dramatically decreased. Trace ashfall was reported in the community of False Pass (38 km ENE) between 1800-2030 and also in King Cove and nearby marine waters. Activity declined at around 1830 although seismicity remained elevated, ash emissions, and ashfall continued until 2100. Lightning was again detected beginning around 1930, which suggested that ash emissions continued. Ongoing explosions were detected in infrasound data, at a lower level than during the most energetic phase of this event. Lightning was last detected at 2048. By 2124 the intensity of the eruption had decreased, and ash emissions were likely rising to less than 6.7 km altitude. Seismicity returned to pre-eruption levels. On 16 September the ACC was lowered to Orange and the VAL to Watch at 1244; the sulfur dioxide plume that was emitted from the previous eruption event was still visible over the northern Pacific Ocean. Elevated surface temperatures, gas-and-steam emissions from the vent, and new, small lahars were reported on the upper flanks based on satellite and webcam images. Minor deposits were reported on the flanks which were likely the result of collapse of previously accumulated lava near the summit crater.
Elevated seismicity with tremor, small earthquakes, and elevated surface temperatures were detected during 17-23 September. Minor gas-and-steam emissions were visible in webcam images. On 20 September small volcanic debris flows were reported on the upper flanks. On 21 September a small ash deposit was observed on the upper flanks extending to the NE based on webcam images. Seismic tremor increased significantly during 22-23 September. Regional infrasound sensors suggested that low-level eruptive activity was occurring within the summit crater by around 1800 on 23 September. Even though seismicity was at high levels, strongly elevated surface temperatures indicating lava at the surface were absent and no ash emissions were detected; weather clouds at 0.6-4.6 km altitude obscured views. At 0025 on 24 September AVO noted that seismicity continued at high levels and nearly continuous small infrasound signals began, likely from low-level eruptive activity. Strongly elevated surface temperatures were identified in satellite images by 0900 and persisted throughout the day; the higher temperatures along with infrasound and seismic data were consistent with lava erupting at the summit. Around 1700 similarly elevated surface temperatures were detected from the summit in satellite data, which suggested that more vigorous lava fountaining had started. Starting around 1800 low-level ash emissions rose to altitudes less than 4.6 km altitude and quickly dissipated.
Beginning at midnight on 25 September, a series of seismic signals consistent with volcanic flows were recorded on the N side of the volcano. A change in seismicity and infrasound signals occurred around 0535 and at 0540 a significant ash cloud formed and quickly reached 14 km altitude and drifted E along the Alaska Peninsula. The cloud generated at least 150 lightning strokes with thunder that could be heard by people in False Pass. Seismicity rapidly declined to near background levels around 0600. AVO increased the ACC to Red and the VAL to Warning at 0602. The ash cloud detached from the volcano at around 0700, rose to 11.6 km altitude, and drifted ESE. Trace to minor amounts of ashfall were reported by the communities of False Pass, King Cove, Cold Bay, and Sand Point around 0700. Ash emissions continued at lower altitudes of 6-7.6 km altitude at 0820. Small explosions at the vent area continued to be detected in infrasound data and likely represented low-level eruptive activity near the vent. Due to the significant decrease in seismicity and ash emissions the ACC was lowered to Orange and the VAL to Watch at 1234. Radar data showed significant collapses of the crater that occurred on 25 September. Satellite data also showed significant hot, degassing pyroclastic and lahar deposits on all flanks, including more extensive flows on the ENE and WSW sections below two new collapse scarps. Following the significant activity during 24-25 September, only low-level activity was observed. Seismicity decreased notably near the end of the strong activity on 25 September and continued to decrease through the end of the month, though tremor and small earthquakes were still reported. No explosive activity was detected in infrasound data through 2 October. Gas-and-steam emissions rose to 3.7 km altitude, as reported by pilots and seen in satellite images. Satellite data from 26 September showed that significant collapses had occurred at the summit crater and hot, steaming deposits from pyroclastic flows and lahars were present on all the flanks, particularly to the ENE and WSW. A small ash cloud was visible in webcam images on 27 September, likely from a collapse at the summit cone. High elevated surface temperatures were observed in satellite imagery during 27-28 September, which were likely the result of hot deposits on the flanks erupted on 25 September. Minor steaming at the summit crater and from an area on the upper flanks was visible in webcam images on 28 September.
During October, explosion events continued between periods of low activity. Seismicity significantly increased starting at around 2100 on 2 October; around the same time satellite images showed an increase in surface temperatures consistent with lava fountaining. Small, hot avalanches of rock and lava descended an unspecified flank. In addition, a distinct increase in infrasound, seismicity, and lightning detections was followed by an ash plume that rose to 12.2 km altitude and drifted S and E at 0520 on 3 October, based on satellite images. Nighttime webcam images showed incandescence due to lava fountaining at the summit and pyroclastic flows descending the NE flank. AVO reported that a notable explosive eruption started at 0547 and lasted until 0900 on 3 October, which prompted a rise in the ACC to Red and the VAL to Warning. Subsequent ash plumes rose to 6-7.6 km altitude by 0931. At 1036 the ACC was lowered back to Orange and the VAL to Watch since both seismic and infrasound data quieted substantially and were slightly above background levels. Gas-and-steam emissions were observed at the summit, based on webcam images. Trace amounts of ashfall were observed in Cold Bay. Resuspended ash was present at several kilometers altitude near the volcano. During the afternoon, low-level ash plumes were visible at the flanks, which appeared to be largely generated by rock avalanches off the summit crater following the explosive activity. These ash plumes rose to 3 km altitude and drifted W. Trace amounts of ashfall were reported by observers in Cold Bay and Unalaska and flights to these communities were disrupted by the ash cloud. Satellite images taken after the eruption showed evidence of pyroclastic flows and lahar deposits in drainages 2 km down the SW flank and about 3.2 km down the NE flank, and continued erosion of the crater rim. Small explosion craters at the end of the pyroclastic flows on the NE flank were noted for the first time, which may have resulted from gas-and-steam explosions when hot deposits interact with underlying ice.
During 4 October seismicity, including frequent small earthquakes, remained elevated, but was gradually declining. Ash plumes were produced for over eight hours until around 1400 that rose to below 3.7 km altitude. These ash plumes were primarily generated off the sides of the volcano where hot rock avalanches from the crater rim had entered drainages to the SW and NE. Two explosion craters were observed at the base of the NE deposits about 3.2 km from the crater rim. Webcam images showed the explosion craters were a source of persistent ash emissions; occasional collapse events also generated ash. Seismicity remained elevated with sulfur dioxide emissions that had a daily average of more than 1,000 tons per day, and frequent small earthquakes through the end of the month. Frequent elevated surface temperatures were identified in satellite images and gas-and-steam plumes were observed in webcam images, although weather conditions occasionally prevented clear views of the summit. Emissions were robust during 14-16 October and were likely generated by the interaction of hot material and snow and ice. During the afternoon of 21 October a strong gas-and-steam plume rose to 3-4.6 km altitude and extended 40 km WSW, based on satellite images and reports from pilots. On 31 October the ACC was lowered to Yellow and the VAL was lowered to Advisory.
Activity in November was characterized by elevated seismicity with ongoing seismic tremor and small, low-frequency earthquakes, elevated surface temperatures, and gas-and-steam emissions. There was an increase in seismic and infrasound tremor amplitudes starting at 1940 on 2 November. As a result, the ACC was again raised to Orange and the VAL was increased to Watch, although ash was not identified in satellite data. An ash cloud rose to 6.1 km altitude and drifted W according to satellite data at 2000. By 0831 on 3 November ash emissions were no longer visible in satellite images. On 6 and 9 November air pressure sensors detected signals consistent with small explosions. Small explosions were detected in infrasound data consistent with weak Strombolian activity on 19 and 21 November. Seismicity started to decrease on 21 November. On 25 November gas-and-steam emissions were emitted from the vent as well as from a scarp on the NE side of the volcano near the summit. A gas-and-steam plume extended about 50 km SSE and was observed in satellite and webcam images on 26 November. On 28 November small explosions were observed in seismic and local infrasound data and gas-and-steam emissions were visible from the summit and from the upper NE collapse scarp based on webcam images. Possible small explosions were observed in infrasound data on 30 November. Weakly elevated surface temperatures and a persistent gas-and-steam plume from the summit and collapse scarps on the upper flanks. A passing aircraft reported the gas-and-steam plume rose to 3-3.4 km altitude on 30 November, but no significant ash emissions were detected.
Satellite data. MODIS thermal anomaly data provided through MIROVA (Middle InfraRed Observation of Volcanic Activity) showed a strong pulse of thermal activity beginning in July 2023 that continued through November 2023 (figure 48). This strong activity was due to Strombolian explosions and lava fountaining events at the summit crater. According to data from MODVOLC thermal alerts, a total of 101 hotspots were detected near the summit crater in July (11-14, 16-19, 23-24 and 26), August (4, 25-26, and 29), September (5, 12, and 17), and October (3, 4, and 8). Infrared satellite data showed large lava flows descending primarily the northern and SE flanks during the reporting period (figure 49). Sulfur dioxide plumes often exceeded two Dobson Units (DUs) and drifted in different directions throughout the reporting period, based on satellite data from the TROPOMI instrument on the Sentinel-5P satellite (figure 50).
Geologic Background. The symmetrical glacier-covered Shishaldin in the Aleutian Islands is the westernmost of three large stratovolcanoes in the eastern half of Unimak Island. The Aleuts named the volcano Sisquk, meaning "mountain which points the way when I am lost." Constructed atop an older glacially dissected edifice, it is largely basaltic in composition. Remnants of an older edifice are exposed on the W and NE sides at 1,500-1,800 m elevation. There are over two dozen pyroclastic cones on its NW flank, which is covered by massive aa lava flows. Frequent explosive activity, primarily consisting of Strombolian ash eruptions from the small summit crater, but sometimes producing lava flows, has been recorded since the 18th century. A steam plume often rises from the summit crater.
Information Contacts: Alaska Volcano Observatory (AVO), a cooperative program of a) U.S. Geological Survey, 4200 University Drive, Anchorage, AK 99508-4667 USA (URL: https://avo.alaska.edu/), b) Geophysical Institute, University of Alaska, PO Box 757320, Fairbanks, AK 99775-7320, USA, and c) Alaska Division of Geological & Geophysical Surveys, 794 University Ave., Suite 200, Fairbanks, AK 99709, USA (URL: http://dggs.alaska.gov/); MIROVA (Middle InfraRed Observation of Volcanic Activity), a collaborative project between the Universities of Turin and Florence (Italy) supported by the Centre for Volcanic Risk of the Italian Civil Protection Department (URL: http://www.mirovaweb.it/); Hawai'i Institute of Geophysics and Planetology (HIGP) - MODVOLC Thermal Alerts System, School of Ocean and Earth Science and Technology (SOEST), Univ. of Hawai'i, 2525 Correa Road, Honolulu, HI 96822, USA (URL: http://modis.higp.hawaii.edu/); NASA Global Sulfur Dioxide Monitoring Page, Atmospheric Chemistry and Dynamics Laboratory, NASA Goddard Space Flight Center (NASA/GSFC), 8800 Greenbelt Road, Goddard, Maryland, USA (URL: https://so2.gsfc.nasa.gov/); Copernicus Browser, Copernicus Data Space Ecosystem, European Space Agency (URL: https://dataspace.copernicus.eu/browser/).
Ioto
Japan
24.751°N, 141.289°E; summit elev. 169 m
All times are local (unless otherwise noted)
New eruption with discolored water, ejecta, and floating pumice during October-December 2023
Ioto (Iwo-jima), located about 1,200 km S of Tokyo, lies within a 9-km-wide submarine caldera along the Izu-Bonin-Mariana volcanic arc. Previous eruptions date back to 1889 and have consisted of dominantly phreatic explosions, pumice deposits during 2001, and discolored water. A submarine eruption during July through December 2022 was characterized by discolored water, pumice deposits, and gas emissions (BGVN 48:01). This report covers a new eruption during October through December 2023, which consisted of explosions, black ejecta, discolored water, and floating pumice, based on information from the Japan Meteorological Association (JMA), the Japan Coast Guard (JCG), and satellite data.
JMA reported that an eruption had been occurring offshore of Okinahama on the SE side of the island since 21 October, which was characterized by volcanic tremor, according to the Japan Maritime Self-Defense Force (JMSDF) Iwo Jima Air Base (figure 22). According to an 18 October satellite image a plume of discolored water at the site of this new eruption extended NE (figure 23). During an overflight conducted on 30 October, a vent was identified about 1 km off the coast of Okinahama. Observers recorded explosions every few minutes that ejected dark material about 20 m above the ocean and as high as 150 m. Ejecta from the vent formed a black-colored island about 100 m in diameter, according to observations conducted from the air by the Earthquake Research Institute of the University of Tokyo in cooperation with the Mainichi newspaper (figure 24). Occasionally, large boulders measuring more than several meters in size were also ejected. Observations from the Advanced Land Observing Satellite Daichi-2 and Sentinel-2 satellite images also confirmed the formation of this island (figure 23). Brown discolored water and floating pumice were present surrounding the island.
The eruption continued during November. During an overflight on 3 November observers photographed the island and noted that material was ejected 169 m high, according to a news source. Explosions gradually became shorter, and, by the 3rd, they occurred every few seconds; dark and incandescent material were ejected about 800 m above the vent. On 4 November eruptions were accompanied by explosive sounds. Floating, brown-colored pumice was present in the water surrounding the island. There was a brief increase in the number of volcanic earthquakes during 8-14 November and 24-25 November. The eruption temporarily paused during 9-11 November and by 12 November eruptions resumed to the W of the island. On 10 November dark brown-to-dark yellow-green discolored water and a small amount of black floating material was observed (figure 25). A small eruption was reported on 18 November off the NE coast of the island, accompanied by white gas-and-steam plumes (figure 23). Another pause was recorded during 17-19 November, which then resumed on 20 November and continued erupting intermittently. According to a field survey conducted by the National Institute for Disaster Prevention Science and Technology on 19 November, a 30-m diameter crater was visible on the NE coast where landslides, hot water, and gray volcanic ash containing clay have occurred and been distributed previously. Erupted blocks about 10 cm in diameter were distributed about 90-120 m from the crater. JCG made observations during an overflight on 23 November and reported a phreatomagmatic eruption. Explosions at the main vent generated dark gas-and-ash plumes that rose to 200 m altitude and ejected large blocks that landed on the island and in the ocean (figure 26). Discolored water also surrounded the island. The size of the new island had grown to 450 m N-S x 200 m E-W by 23 November, according to JCG.
The eruption continued through 11 December, followed by a brief pause in activity, which then resumed on 31 December, according to JMA. Intermittent explosions produced 100-m-high black plumes at intervals of several minutes to 30 minutes during 1-10 December. Overflights were conducted on 4 and 15 December and reported that the water surrounding the new island was discolored to dark brown-to-dark yellow-green (figure 27). No floating material was reported during this time. In comparison to the observations made on 23 November, the new land had extended N and part of it had eroded away. In addition, analysis by the Geospatial Information Authority of Japan using SAR data from Daichi-2 also confirmed that the area of the new island continued to decrease between 4 and 15 December. Ejected material combined with wave erosion transformed the island into a “J” shape, 500-m-long and with the curved part about 200 m offshore of Ioto. The island was covered with brown ash and blocks, and the surrounding water was discolored to greenish-brown and contained an area of floating pumice. JCG reported from an overflight on 4 December that volcanic ash-like material found around the S vent on the NE part of the island was newly deposited since 10 November (figure 28). By 15 December the N part of the “J” shaped island had separated and migrated N, connecting to the Okinahama coast and the curved part of the “J” had eroded into two smaller islands (figure 27).
References. Ukawa, M., Fujita, E., Kobayashi, T., 2002, Recent volcanic activity of Iwo Jima and the 2001 eruption, Monthly Chikyu, Extra No. 39, 157-164.
Geologic Background. Ioto, in the Volcano Islands of Japan, lies within a 9-km-wide submarine caldera. The volcano is also known as Ogasawara-Iojima to distinguish it from several other "Sulfur Island" volcanoes in Japan. The triangular, low-elevation, 8-km-long island narrows toward its SW tip and has produced trachyandesitic and trachytic rocks that are more alkalic than those of other volcanoes in this arc. The island has undergone uplift for at least the past 700 years, accompanying resurgent doming of the caldera; a shoreline landed upon by Captain Cook's surveying crew in 1779 is now 40 m above sea level. The Motoyama plateau on the NE half of the island consists of submarine tuffs overlain by coral deposits and forms the island's high point. Many fumaroles are oriented along a NE-SW zone cutting through Motoyama. Numerous recorded phreatic eruptions, many from vents on the W and NW sides of the island, have accompanied the uplift.
Information Contacts: Japan Meteorological Agency (JMA), 1-3-4 Otemachi, Chiyoda-ku, Tokyo 100-8122, Japan (URL: http://www.jma.go.jp/jma/indexe.html); Japan Coast Guard (JCG) Volcano Database, Hydrographic and Oceanographic Department, 3-1-1, Kasumigaseki, Chiyoda-ku, Tokyo 100-8932, Japan (URL: https://www1.kaiho.mlit.go.jp/GIJUTSUKOKUSAI/kaiikiDB/kaiyo22-2.htm); Copernicus Browser, Copernicus Data Space Ecosystem, European Space Agency (URL: https://dataspace.copernicus.eu/browser/); Asahi, 5-3-2, Tsukiji, Chuo Ward, Tokyo, 104-8011, Japan (URL: https://www.asahi.com/ajw/articles/15048458).
Purace (Colombia) — December 2023 Cite this Report
Purace
Colombia
2.3095°N, 76.3948°W; summit elev. 4650 m
All times are local (unless otherwise noted)
Gas-and-ash emission on 16 November 2023
Puracé, located in Colombia, is a stratovolcano that contains a 500-m-wide summit crater. It is part of the Los Coconucos volcanic chain that is a NW-SE trending group of seven cones and craters. The most recent eruption occurred during March 2022 that was characterized by frequent seismicity and gas-and-steam emissions (BGVN 47:06). This report covers a brief eruption during November 2023 based on monthly reports from the Popayán Observatory, part of the Servicio Geologico Colombiano (SGC).
Activity during November 2022 through November 2023 primarily consisted of seismicity: VT-type events, LP-type events, HB-type events, and TR-type events (table 4). Maximum sulfur dioxide values were measured weekly and ranged from 259-5,854 tons per day (t/d) during November 2022 through April 2023. White gas-and-steam emissions were also occasionally reported.
SGC issued a report on 25 October that noted a significant increase in the number of earthquakes associated with rock fracturing. These earthquakes were located SE of the crater between Puracé and Piocollo at depths of 1-4 km. There were no reported variations in sulfur dioxide values, but SGC noted high carbon dioxide values, compared to those recorded in the first half of 2023.
SGC reported that at 1929 on 16 November the seismic network detected a signal that was possibly associated with a gas-and-ash emission, though it was not confirmed in webcam images due to limited visibility. On 17 November an observer confirmed ash deposits on the N flank. Webcam images showed an increase in degassing both inside the crater and from the NW flank, rising 700 m above the crater.
Table 4. Seismicity at Puracé during November 2022-November 2023. Volcano-tectonic (VT), long-period (LP), hybrid (HB), and tremor (TR) events are reported each month. Courtesy of SGC.
| Month |
Volcano-tectonic |
Long-period |
Hybrid |
Tremor |
| Nov 2022 |
429 |
2,023 |
5 |
831 |
| Dec 2022 |
423 |
1,390 |
9 |
834 |
| Jan 2023 |
719 |
1,622 |
0 |
957 |
| Feb 2023 |
598 |
1,701 |
2 |
1,124 |
| Mar 2023 |
331 |
2,408 |
147 |
607 |
| Apr 2023 |
614 |
4,427 |
33 |
148 |
| May 2023 |
620 |
3,717 |
170 |
109 |
| Jun 2023 |
467 |
3,293 |
86 |
148 |
| Jul 2023 |
1,116 |
5,809 |
183 |
542 |
| Aug 2023 |
692 |
2,927 |
94 |
321 |
| Sep 2023 |
887 |
1,505 |
82 |
848 |
| Oct 2023 |
2,373 |
2,949 |
135 |
692 |
| Nov 2023 |
1,212 |
2,302 |
69 |
293 |
Geologic Background. Puracé is an active andesitic volcano with a 600-m-diameter summit crater at the NW end of the Los Coconucos Volcanic Chain. This volcanic complex includes nine composite and five monogenetic volcanoes, extending from the Puracé crater more than 6 km SE to the summit of Pan de Azúcar stratovolcano. The dacitic massif which the complex is built on extends about 13 km NW-SE and 10 km NE-SW. Frequent small to moderate explosive eruptions reported since 1816 CE have modified the morphology of the summit crater, with the largest eruptions in 1849, 1869, and 1885.
Information Contacts: Servicio Geologico Colombiano (SGC), Diagonal 53 No. 34-53 - Bogotá D.C., Colombia (URL: https://www.sgc.gov.co/volcanes).
Etna
Italy
37.748°N, 14.999°E; summit elev. 3357 m
All times are local (unless otherwise noted)
Strombolian explosions, lava fountains, and lava flows during July-August 2023
Etna, located on the Italian island of Sicily, has had documented eruptions dating back to 1500 BCE. Activity typically originates from multiple cones at the summit, where several craters have formed and evolved. The currently active craters are Northeast Crater (NEC), Voragine (VOR), and Bocca Nuova (BN), and the Southeast Crater (SEC); VOR and BN were previously referred to as the “Central Crater”. The original Southeast crater formed in 1978, and a second eruptive site that opened on its SE flank in 2011 was named the New Southeast Crater (NSEC). Another eruptive site between the SEC and NSEC developed during early 2017 and was referred to as the "cono della sella" (saddle cone). The current eruption period began in November 2022 and has been characterized by intermittent Strombolian activity, lava flows, and ash plumes (BGVN 48:08). This report updates activity during July through October 2023, which includes primarily gas-and-steam emissions; during July and August Strombolian explosions, lava fountains, and lava flows were reported, based on weekly and special reports by the Osservatorio Etneo (OE), part of the Catania Branch of Italy's Istituo Nazionale di Geofisica e Vulcanologica (INGV) and satellite data.
Variable fumarolic degassing was reported at all summit craters (BN, VOR, NEC, and SEC) throughout the entire reporting period (table 15). The MIROVA (Middle InfraRed Observation of Volcanic Activity) volcano hotspot detection system based on the analysis of MODIS data showed frequent low-to-moderate power thermal anomalies during the reporting period (figure 399). During mid-August there was a pulse in activity that showed an increase in the power of the anomalies due to Strombolian activity, lava fountains, and lava flows. Infrared satellite imagery captured strong thermal anomalies at the central and southeast summit crater areas (figure 400). Accompanying thermal activity were occasional sulfur dioxide plumes that exceeded 2 Dobson Units (DUs) recorded by the TROPOMI instrument on the Sentinel-5P satellite (figure 401).
Table 15. Summary of activity at the four primary crater areas at the summit of Etna during July-October 2023. Information is from INGV weekly reports.
| Month |
Bocca Nuova (BN) |
Voragine (VOR) |
Northeast Crater (NEC) |
Southeast Crater (SEC) |
| Jul 2023 |
Continuous degassing. |
No observations. |
Weak gas emissions. |
Continuous degassing. Sporadic and weak-to-moderate ash emissions. Strombolian explosions. |
| Aug 2023 |
Continuous degassing. |
No observations. |
No observations. |
Continuous degassing. Occasional ash emissions. Strombolian activity, lava fountaining, and lava flows. |
| Sep 2023 |
Variable degassing. Crater incandescence. |
Weak fumarolic activity. |
Weak fumarolic activity. |
Variable degassing. |
| Oct 2023 |
Continuous degassing. |
Weak fumarolic activity. |
Weak fumarolic activity. |
Continuous degassing. |
Activity during July and August was relatively low and mainly consisted of degassing at the summit craters, particularly at SEC and BN. Cloudy weather prevented clear views of the summit during early July. During the night of 2 July some crater incandescence was visible at SEC. Explosive activity resumed at SEC during 9-10 July, which was characterized by sporadic and weak ash emissions that rapidly dispersed in the summit area (figure 402). INGV reported moderate Strombolian activity began at 2034 on 14 July and was confined to the inside of the crater and fed by a vent located in the E part of SEC. An ash emission was detected at 2037. A new vent opened on 15 July in the SE part of BN and began to produce continuous gas-and-steam emissions. During an inspection carried out on 28 July pulsating degassing, along with audible booms, were reported at two active vents in BN. Vigorous gas-and-steam emissions intermittently generated rings. On rare occasions, fine, reddish ash was emitted from BN1 and resuspended by the gas-and-steam emissions.
Around 2000 on 13 August INGV reported a sudden increase in volcanic tremor amplitude. Significant infrasonic activity coincided with the tremor increase. Incandescent flashes were visible through the cloud cover in webcam images of SEC (figure 403). Strombolian activity at SEC began to gradually intensify starting at 2040 as seismicity continued to increase. The Aviation Color Code (ACC) was raised to Yellow (the second lowest-level on a four-color scale) at 2126 and then to Orange (the second highest-level on a four-color scale) at 2129 due to above-background activity. The activity rapidly transitioned from Strombolian activity to lava fountains around 2333 that rose 300-400 m above the crater (figure 403). Activity was initially focused on the E vent of the crater, but then the vent located above the S flank of the cone also became active. A lava flow from this vent traveled SW into the drainage created on 10 February 2022, overlapping with previous flows from 10 and 21 February 2022 and 21 May 2023, moving between Monte Barbagallo and Monte Frumento Supino (figure 404). The lava flow was 350 m long, oriented NNE-SSW, and descended to an elevation of 2.8 km. Flows covered an area of 300,000 m2 and had an estimated volume of 900,000 m3. The ACC was raised to Red at 2241 based on strong explosive activity and ashfall in Rifugio Sapienza-Piano Vetore at 1.7 km elevation on the S flank. INGV reported that pyroclastic flows accompanied this activity.
Activity peaked between 0240 and 0330 on 14 August, when roughly 5-6 vents erupted lava fountains from the E to SW flank of SEC. The easternmost vents produced lava fountains that ejected material strongly to the E, which caused heavy fallout of incandescent pyroclastic material on the underlying flank, triggering small pyroclastic flows. This event was also accompanied by lightning both in the ash column and in the ash clouds that were generated by the pyroclastic flows. A fracture characterized by a series of collapse craters (pit craters) opened on the upper SW flank of SEC. An ash cloud rose a few kilometers above the crater and drifted S, causing ash and lapilli falls in Rifugio Sapienza and expanding toward Nicolosi, Mascalucia, Catania, and up to Syracuse. Ashfall resulted in operational problems at the Catania airport (50 km S), which lasted from 0238 until 2000. By 0420 the volcanic tremor amplitude values declined to background levels. After 0500 activity sharply decreased, although the ash cloud remained for several hours and drifted S. By late morning, activity had completely stopped. The ACC was lowered to Orange as volcanic ash was confined to the summit area. Sporadic, minor ash emissions continued throughout the day. At 1415 the ACC was lowered to Yellow and then to Green at 1417.
During the night of 14-15 August only occasional flashes were observed, which were more intense during avalanches of material inside the eruptive vents. Small explosions were detected at SEC at 2346 on 14 August and at 0900 on 26 August that each produced ash clouds which rapidly dispersed into the atmosphere (figure 405). According to a webcam image, an explosive event detected at 2344 at SEC generated a modest ash cloud that was rapidly dispersed by winds. The ACC was raised to Yellow at 2355 on 14 August due to increasing unrest and was lowered to Green at 0954 on 15 August.
Activity during September and October was relatively low and mainly characterized by variable degassing from BN and SEC. Intense, continuous, and pulsating degassing was accompanied by roaring sounds and flashes of incandescence at BN both from BN1 and the new pit crater that formed during late July (figure 406). The degassing from the new pit crater sometimes emitted vapor rings. Cloudy weather during 6-8 September prevented observations of the summit craters .
Geologic Background. Mount Etna, towering above Catania on the island of Sicily, has one of the world's longest documented records of volcanism, dating back to 1500 BCE. Historical lava flows of basaltic composition cover much of the surface of this massive volcano, whose edifice is the highest and most voluminous in Italy. The Mongibello stratovolcano, truncated by several small calderas, was constructed during the late Pleistocene and Holocene over an older shield volcano. The most prominent morphological feature of Etna is the Valle del Bove, a 5 x 10 km caldera open to the east. Two styles of eruptive activity typically occur, sometimes simultaneously. Persistent explosive eruptions, sometimes with minor lava emissions, take place from one or more summit craters. Flank vents, typically with higher effusion rates, are less frequently active and originate from fissures that open progressively downward from near the summit (usually accompanied by Strombolian eruptions at the upper end). Cinder cones are commonly constructed over the vents of lower-flank lava flows. Lava flows extend to the foot of the volcano on all sides and have reached the sea over a broad area on the SE flank.
Information Contacts: Sezione di Catania - Osservatorio Etneo, Istituto Nazionale di Geofisica e Vulcanologia (INGV), Sezione di Catania, Piazza Roma 2, 95123 Catania, Italy (URL: http://www.ct.ingv.it/it/); MIROVA (Middle InfraRed Observation of Volcanic Activity), a collaborative project between the Universities of Turin and Florence (Italy) supported by the Centre for Volcanic Risk of the Italian Civil Protection Department (URL: http://www.mirovaweb.it/); NASA Global Sulfur Dioxide Monitoring Page, Atmospheric Chemistry and Dynamics Laboratory, NASA Goddard Space Flight Center (NASA/GSFC), 8800 Greenbelt Road, Goddard MD 20771, USA (URL: https://so2.gsfc.nasa.gov/); Copernicus Browser, Copernicus Data Space Ecosystem, European Space Agency (URL: https://dataspace.copernicus.eu/browser/).
Suwanosejima (Japan) — December 2023 Cite this Report
Suwanosejima
Japan
29.638°N, 129.714°E; summit elev. 796 m
All times are local (unless otherwise noted)
Eruption plumes, crater incandescence, and occasional explosions during July-October 2023
Suwanosejima is an 8-km-long island that consists of a stratovolcano and two active summit craters, located in the northern Ryukyu Islands, Japan. Volcanism over the past century has been characterized by Strombolian explosions, ash plumes, and ashfall. The current eruption began in October 2004 and has more recently consisted of frequent eruption plumes, explosions, and incandescent ejecta (BGVN 48:07). This report covers similar activity of ash plumes, explosions, and crater incandescence during July through October 2023 using monthly reports from the Japan Meteorological Agency (JMA) and satellite data.
Thermal activity during the reporting period was relatively low; only one low-power thermal anomaly was detected during mid-July and one during early August, based on a MIROVA (Middle InfraRed Observation of Volcanic Activity) Log Radiative Power graph of the MODIS thermal anomaly data. On two clear weather days, a thermal anomaly was visible in infrared satellite images (figure 81).
Low-level activity was reported at the Otake crater during July and no explosions were detected. Eruption plumes rose as high as 1.8 km above the crater. On 13 July an ash plume rose 1.7 km above the crater rim, based on a webcam image. During the night of the 28th crater incandescence was visible in a webcam image. An eruptive event reported on 31 July produced an eruption plume that rose 2.1 km above the crater. Seismicity consisted of 11 volcanic earthquakes on the W flank, the number of which had decreased compared to June (28) and 68 volcanic earthquakes near the Otake crater, which had decreased from 722 in the previous month. According to observations conducted by the University of Tokyo Graduate School of Science, Kyoto University Disaster Prevention Research Institute, Toshima Village, and JMA, the amount of sulfur dioxide emissions released during the month was 400-800 tons per day (t/d).
Eruptive activity in the Otake crater continued during August and no explosions were reported. An eruptive event produced a plume that rose 1 km above the crater at 1447 on 12 August. Subsequent eruptive events were recorded at 0911 on 16 August, at 1303 on 20 August, and at 0317 on 21 August, which produced ash plumes that rose 1-1.1 km above the crater and drifted SE, SW, and W. On 22 August an ash plume was captured in a webcam image rising 1.4 km above the crater (figure 82). Multiple eruptive events were detected on 25 August at 0544, 0742, 0824, 1424, and 1704, which generated ash plumes that rose 1.1-1.2 km above the crater and drifted NE, W, and SW. On 28 August a small amount of ashfall was observed as far as 1.5 km from the crater. There were 17 volcanic earthquakes recorded on the W flank of the volcano and 79 recorded at the Otake crater during the month. The amount of sulfur dioxide emissions released during the month was 400-800 t/d.
Activity continued at the Otake crater during September. Occasionally, nighttime crater incandescence was observed in webcam images and ashfall was reported. An eruptive event at 1949 on 4 September produced an ash plume that rose 1 km above the crater and drifted SW. On 9 September several eruption events were detected at 0221, 0301, and 0333, which produced ash plumes that rose 1.1-1.4 km above the crater rim and drifted W; continuous ash emissions during 0404-0740 rose to a maximum height of 2 km above the crater rim (figure 83). More eruptive events were reported at 1437 on 10 September, at 0319 on 11 September, and at 0511 and 1228 on 15 September, which generated ash plumes that rose 1-1.8 km above the crater. During 25, 27, and 30 September, ash plumes rose as high as 1.3 km above the crater rim. JMA reported that large blocks were ejected as far as 300 m from the center of the crater. There were 18 volcanic earthquakes detected beneath the W flank and 82 volcanic earthquakes detected near the Otake crater. The amount of sulfur dioxide released during the month ranged from 600 to 1,600 t/d.
Activity during early-to-mid-October consisted of occasional explosions, a total number of 13, and ash plumes that rose as high as 1.9 km above the Otake crater rim on 29 October (figure 84). These explosions are the first to have occurred since June 2023. Continuous ash emissions were reported during 0510-0555 on 1 October. Explosions were recorded at 0304, 2141, and 2359 on 2 October, at 0112 on 3 October, and at 1326 on 6 October, which produced ash plumes that rose as high as 1 km above the crater rim and drifted SW and W. An explosion was noted at 0428 on 3 October, but emission details were unknown. A total of eight explosions were recorded by the seismic network at 1522 on 14 October, at 0337, 0433, 0555, 1008, and 1539 on 15 October, and at 0454 and 0517 on 16 October. Ash plumes from these explosions rose as high as 900 m above the crater and drifted SE. Eruptive events during 25-27 and 29-30 October generated plumes that rose as high as 1.9 km above the crater and drifted SE, S, and SW. Ash was deposited in Toshima village (3.5 km SSW). Eruptive activity occasionally ejected large volcanic blocks as far as 600 m from the crater. Nighttime crater incandescence was visible in webcams. Intermittent ashfall was reported as far as 1.5 km from the crater. There were 43 volcanic earthquakes detected on the W flank during the month, and 184 volcanic earthquakes detected near the Otake crater. The amount of sulfur dioxide emitted ranged between 400 and 900 t/d.
Geologic Background. The 8-km-long island of Suwanosejima in the northern Ryukyu Islands consists of an andesitic stratovolcano with two active summit craters. The summit is truncated by a large breached crater extending to the sea on the E flank that was formed by edifice collapse. One of Japan's most frequently active volcanoes, it was in a state of intermittent Strombolian activity from Otake, the NE summit crater, between 1949 and 1996, after which periods of inactivity lengthened. The largest recorded eruption took place in 1813-14, when thick scoria deposits covered residential areas, and the SW crater produced two lava flows that reached the western coast. At the end of the eruption the summit of Otake collapsed, forming a large debris avalanche and creating an open collapse scarp extending to the eastern coast. The island remained uninhabited for about 70 years after the 1813-1814 eruption. Lava flows reached the eastern coast of the island in 1884. Only about 50 people live on the island.
Information Contacts: Japan Meteorological Agency (JMA), 1-3-4 Otemachi, Chiyoda-ku, Tokyo 100-8122, Japan (URL: http://www.jma.go.jp/jma/indexe.html); MIROVA (Middle InfraRed Observation of Volcanic Activity), a collaborative project between the Universities of Turin and Florence (Italy) supported by the Centre for Volcanic Risk of the Italian Civil Protection Department (URL: http://www.mirovaweb.it/); Hawai'i Institute of Geophysics and Planetology (HIGP) - MODVOLC Thermal Alerts System, School of Ocean and Earth Science and Technology (SOEST), Univ. of Hawai'i, 2525 Correa Road, Honolulu, HI 96822, USA (URL: http://modis.higp.hawaii.edu/); Copernicus Browser, Copernicus Data Space Ecosystem, European Space Agency (URL: https://dataspace.copernicus.eu/browser/).
Aira
Japan
31.5772°N, 130.6589°E; summit elev. 1117 m
All times are local (unless otherwise noted)
Explosions, ash plumes, ash fall, and crater incandescence during July-October 2023
Aira caldera, located in the northern half of Kagoshima Bay, Japan, contains the post-caldera Sakurajima volcano. Eruptions typically originate from the Minamidake crater, and since the 8th century, ash deposits have been recorded in the city of Kagoshima (10 km W), one of Kyushu’s largest cities. The Minamidake summit cone and crater has had persistent activity since 1955; the Showa crater on the E flank has also been intermittently active since 2006. The current eruption period began during March 2017 and has recently been characterized by intermittent explosions, eruption plumes, and ashfall (BGVN 48:07). This report updates activity during July through October 2023 and describes explosive events, ash plumes, nighttime crater incandescence, and ashfall, according to monthly activity reports from the Japan Meteorological Agency (JMA) and satellite data.
Thermal activity remained at low levels during this reporting period, according to the MIROVA (Middle InfraRed Observation of Volcanic Activity) system (figure 149). There was a slight increase in the number of anomalies during September through October. Occasional thermal anomalies were visible in infrared satellite images mainly at the Minamidake crater (Vent A is located to the left and Vent B is located to the right) (figure 150).
Table 30. Number of monthly explosive events, days of ashfall, area of ash covered, and sulfur dioxide emissions from Sakurajima’s Minamidake crater at Aira during July-October 2023. Note that smaller ash events are not listed. Ashfall days were measured at Kagoshima Local Meteorological Observatory and ashfall amounts represent material covering all the Kagoshima Prefecture. Data courtesy of JMA monthly reports.
| Month |
Explosive events |
Days of ashfall |
Ashfall amount (g/m2) |
SO2 emissions (tons/day) |
| Jul 2023 |
3 |
0 |
0 |
1,600-3,200 |
| Aug 2023 |
3 |
10 |
7 |
1,800-3,300 |
| Sep 2023 |
3 |
7 |
3 |
1,600-2,300 |
| Oct 2023 |
33 |
8 |
61 |
2,200-4,200 |
JMA reported that during July, there were eight eruptions, three of which were explosion events in the Showa crater. Large blocks were ejected as far as 600 m from the Showa crater. Very small eruptions were occasionally reported at the Minamidake crater. Nighttime incandescence was observed in both the Showa and Minamidake crater. Explosions were reported on 16 July at 2314 and on 17 July at 1224 and at 1232 (figure 151). Resulting eruption plumes rose 700-2,500 m above the crater and drifted N. On 23 July the number of volcanic earthquakes on the SW flank of the volcano increased. A strong Mw 3.1 volcanic earthquake was detected at 1054 on 26 July. The number of earthquakes recorded throughout the month was 545, which markedly increased from 73 in June. No ashfall was observed at the Kagoshima Regional Meteorological Observatory during July. According to a field survey conducted during the month, the daily amount of sulfur dioxide emissions was 1,600-3,200 tons per day (t/d).
There were three eruptions reported at the Minamidake crater during August, each of which were explosive. The explosions occurred on 9 August at 0345, on 13 August at 2205, and on 31 August at 0640, which generated ash plumes that rose 800-2,000 m above the crater and drifted W. There were two eruptions detected at Showa crater; on 4 August at 2150 ejecta traveled 800 m from the Showa crater and associated eruption plumes rose 2.3 km above the crater. The explosion at 2205 on 13 August generated an ash plume that rose 2 km above the crater and was accompanied by large blocks that were ejected 600 m from the Minamidake crater (figure 152). Nighttime crater incandescence was visible in a high-sensitivity surveillance camera at both craters. Seismicity consisted of 163 volcanic earthquakes, 84 of which were detected on the SW flank. According to the Kagoshima Regional Meteorological Observatory there was a total of 7 g/m2 of ashfall over the course of 10 days during the month. According to a field survey, the daily amount of sulfur dioxide emitted was 1,800-3,300 t/d.
During September, four eruptions were reported, three of which were explosion events. These events occurred at 1512 on 9 September, at 0018 on 11 September, and at 2211 on 13 September. Resulting ash plumes generally rose 800-1,100 m above the crater. An explosion produced an ash plume at 2211 on 13 September that rose as high as 1.7 km above the crater. Large volcanic blocks were ejected 600 m from the Minamidake crater. Smaller eruptions were occasionally observed at the Showa crater. Nighttime crater incandescence was visible at the Minamidake crater. Seismicity was characterized by 68 volcanic earthquakes, 28 of which were detected beneath the SW flank. According to the Kagoshima Regional Meteorological Observatory there was a total of 3 g/m2 of ashfall over the course of seven days during the month. A field survey reported that the daily amount of sulfur dioxide emitted was 1,600-2,300 t/d.
Eruptive activity during October consisted of 69 eruptions, 33 of which were described as explosive. These explosions occurred during 4 and 11-21 October and generated ash plumes that rose 500-3,600 m above the crater and drifted S, E, SE, and N. On 19 October at 1648 an explosion generated an ash plume that rose 3.6 km above the crater (figure 153). No eruptions were reported in the Showa crater; white gas-and-steam emissions rose 100 m above the crater from a vent on the N flank. Nighttime incandescence was observed at the Minamidake crater. On 24 October an eruption was reported from 0346 through 0430, which included an ash plume that rose 3.4 km above the crater. Ejected blocks traveled 1.2 km from the Minamidake crater. Following this eruption, small amounts of ashfall were observed from Arimura (4.5 km SE) and a varying amount in Kurokami (4 km E) (figure 154). The number of recorded volcanic earthquakes during the month was 190, of which 14 were located beneath the SW flank. Approximately 61 g/m2 of ashfall was reported over eight days of the month. According to a field survey, the daily amount of sulfur dioxide emitted was 2,200-4,200 t/d.
Geologic Background. The Aira caldera in the northern half of Kagoshima Bay contains the post-caldera Sakurajima volcano, one of Japan's most active. Eruption of the voluminous Ito pyroclastic flow accompanied formation of the 17 x 23 km caldera about 22,000 years ago. The smaller Wakamiko caldera was formed during the early Holocene in the NE corner of the caldera, along with several post-caldera cones. The construction of Sakurajima began about 13,000 years ago on the southern rim and built an island that was joined to the Osumi Peninsula during the major explosive and effusive eruption of 1914. Activity at the Kitadake summit cone ended about 4,850 years ago, after which eruptions took place at Minamidake. Frequent eruptions since the 8th century have deposited ash on the city of Kagoshima, located across Kagoshima Bay only 8 km from the summit. The largest recorded eruption took place during 1471-76.
Information Contacts: Japan Meteorological Agency (JMA), 1-3-4 Otemachi, Chiyoda-ku, Tokyo 100-8122, Japan (URL: http://www.jma.go.jp/jma/indexe.html); MIROVA (Middle InfraRed Observation of Volcanic Activity), a collaborative project between the Universities of Turin and Florence (Italy) supported by the Centre for Volcanic Risk of the Italian Civil Protection Department (URL: http://www.mirovaweb.it/); Copernicus Browser, Copernicus Data Space Ecosystem, European Space Agency (URL: https://dataspace.copernicus.eu/browser/).
Nishinoshima (Japan) — November 2023 Cite this Report
Nishinoshima
Japan
27.247°N, 140.874°E; summit elev. 100 m
All times are local (unless otherwise noted)
Gray emissions during October 2023
Nishinoshima is a small island in the Ogasawara Arc, about 1,000 km S of Tokyo, Japan. It contains prominent submarine peaks to the S, W, and NE. Recorded eruptions date back to 1973, with the current eruption period beginning in October 2022. Eruption plumes and fumarolic activity characterize recent activity (BGVN 48:10). This report covers the end of the eruption for September through October 2023, based on information from monthly reports of the Japan Meteorological Agency (JMA) monthly reports, and satellite data.
No eruptive activity was reported during September 2023, although JMA noted that the surface temperature was slightly elevated compared to the surrounding area since early March 2023. The Japan Coast Guard (JCG) conducted an overflight on 20 September and reported white gas-and-steam plumes rising 3 km above the central crater of the pyroclastic cone, as well as multiple white gas-and-steam emissions emanating from the N, E, and S flanks of the crater to the coastline. In addition, dark reddish brown-to-green discolored water was distributed around almost the entire circumference of the island.
Similar low-level activity was reported during October. Multiple white gas-and-steam emissions rose from the N, E, and S flanks of the central crater of the pyroclastic cone and along the coastline; these emissions were more intense compared to the previous overflight observations. Dark reddish brown-to-green discolored water remained visible around the circumference of the island. On 4 October aerial observations by JCG showed a small eruption consisting of continuous gas-and-steam emissions emanating from the central crater, with gray emissions rising to 1.5 km altitude (figure 129). According to observations from the marine weather observation vessel Keifu Maru on 26 October, white gas-and-steam emissions persisted from the center of the pyroclastic cone, as well as from the NW, SW, and SE coasts of the island for about five minutes. Slightly discolored water was visible up to about 1 km.
Frequent low-to-moderate power thermal anomalies were recorded in the MIROVA graph (Middle InfraRed Observation of Volcanic Activity) during September (figure 130). Occasional anomalies were detected during October, and fewer during November through December. A thermal anomaly was visible in the crater using infrared satellite imagery on 6, 8, 11, 16, 18, 21, and 23 September and 8, 13, 21, 26, and 28 October (figure 131).
Geologic Background. The small island of Nishinoshima was enlarged when several new islands coalesced during an eruption in 1973-74. Multiple eruptions that began in 2013 completely covered the previous exposed surface and continued to enlarge the island. The island is the summit of a massive submarine volcano that has prominent peaks to the S, W, and NE. The summit of the southern cone rises to within 214 m of the ocean surface 9 km SSE.
Information Contacts: Japan Meteorological Agency (JMA), 1-3-4 Otemachi, Chiyoda-ku, Tokyo 100-8122, Japan (URL: http://www.jma.go.jp/jma/indexe.html); MIROVA (Middle InfraRed Observation of Volcanic Activity), a collaborative project between the Universities of Turin and Florence (Italy) supported by the Centre for Volcanic Risk of the Italian Civil Protection Department (URL: http://www.mirovaweb.it/); Copernicus Browser, Copernicus Data Space Ecosystem, European Space Agency (URL: https://dataspace.copernicus.eu/browser/).
Kilauea (United States) — October 2023 Cite this Report
Kilauea
United States
19.421°N, 155.287°W; summit elev. 1222 m
All times are local (unless otherwise noted)
Strong lava fountains, lava flows, and spatter at Halema’uma’u during January-September 2023
Kīlauea is on the island of Hawai’i and overlaps the E flank of the Mauna Loa volcano. Its East Rift Zone (ERZ) has been intermittently active for at least 2,000 years. An extended eruption period began in January 1983 and was characterized by open lava lakes and lava flows from the summit caldera and the East Rift Zone. During May 2018 magma migrated into the Lower East Rift Zone (LERZ) and opened 24 fissures along a 6-km-long NE-trending fracture zone that produced lava flows traveling in multiple directions. As lava emerged from the fissures, the lava lake at Halema'uma'u drained and explosions sent ash plumes to several kilometers altitude (BGVN 43:10).
The current eruption period started during September 2021 and has been characterized by low-level lava effusions in the active Halema’uma’u lava lake (BGVN 48:01). This report covers three notable eruption periods during February, June, and September 2023 consisting of lava fountaining, lava flows, and spatter during January through September 2023 using information from daily reports, volcanic activity notices, and abundant photo, map, and video data from the US Geological Survey's (USGS) Hawaiian Volcano Observatory (HVO).
Activity during January 2023. Small earthquake swarms were recorded on 2 January 2023; increased seismicity and changes in the pattern of deformation were noted on the morning of 5 January. At around 1500 both the rate of deformation and seismicity drastically increased, which suggested magma movement toward the surface. HVO raised the Volcano Alert Level (VAL) to Watch (the second highest level on a four-level scale) and the Aviation Color Code (ACC) to Orange (the second highest color on a four-color scale) at 1520.
Multiple lava fountains and lava effusions from vents in the central eastern portion of the Halema’uma’u crater began on 5 January around 0434; activity was confined to the eastern half of the crater and within the basin of the western half of the crater, which was the focus of the eruption in 2021-2022 (figure 525). Incandescence was visible in webcam images at 1634 on 5 January, prompting HVO to raise the VAL to Warning (the highest level on a four-level scale) and the ACC to Red (the highest color on a four-color scale). Lava fountains initially rose as high as 50 m above the vent at the onset of the eruption (figure 526) but then declined to a more consistent 5-6 m height in the proceeding days. By 1930 that same day, lava had covered most of the crater floor (an area of about 1,200,000 m2) and the lava lake had a depth of 10 m. A higher-elevation island that formed during the initial phase of the December 2020 eruption remained exposed, appearing darker in images, along with a ring of older lava around the lava lake that was active prior to December 2022. Overnight during 5-6 January the lava fountains continued to rise 5 m high, and the lava effusion rate had slowed.
On 6 January at 0815 HVO lowered the VAL to Watch and the ACC to Orange due to the declining effusion rates. Sulfur dioxide emission rates ranged from 3,000-12,500 tonnes per day (t/d), the highest value of which was recorded on 6 January. Lava continued to erupt from the vents during 6-8 January, although the footprint of the active area had shrunk; a similar progression has been commonly observed during the early stages of recent eruptions at Halema’uma’u. On 9 January HVO reported one dominant lava fountain rising 6-7 m high in the E half of the crater. Lava flows built up the margins of the lake, causing the lake to be perched. On 10 January the eastern lava lake had an area of approximately 120,000 m2 that increased to 250,000 m2 by 17 January. During 13-31 January several small overflows occurred along the margins of the E lake. A smaller area of lava was active within the basin in the W half of the crater that had been the focus of activity during 2021-2022. On 19 January just after 0200 a small ooze-out was observed on the crater’s W edge.
Activity during February 2023. Activity continued in the E part of Halema’uma’u crater, as well as in a smaller basin in the W part of the 2021-2022 lava lake (figure 527). The E lava lake contained a single lava fountain and frequent overflows. HVO reported that during the morning of 1 February the large E lava lake began to cool and crust over in the center of the lake; two smaller areas of lava were observed on the N and S sides by the afternoon. The dominant lava fountain located in the S part of the lava lake paused for roughly 45 minutes at 2315 and resumed by midnight, rising 1-2 m. At 0100 on 2 February lava from the S part was effusing across the entire E lava lake area, covering the crusted over portion in the center of the lake and continuing across the majority of the previously measured 250,000 m2 by 0400. A small lava pond near the E lake produced an overflow around 0716 on 2 February. On 3 February some lava crust began to form against the N and E levees, which defined the 250,000 m2 eastern lava lake. The small S lava fountain remained active, rising 1-6 m high during 3-9 February; around 0400 on 5 February occasional bursts doubled the height of the lava fountain.
A large breakout occurred overnight during 2100 on 4 February to 0900 on 5 February on the N part of the crater floor, equal to or slightly larger in size than the E lava lake. A second, smaller lava fountain appeared in the same area of the E lava lake between 0300 and 0700 on 5 February and was temporarily active. This large breakout continued until 7 February. A small, brief breakout was reported in the S of the E lava lake around midnight on 7 February. In the W lake, as well as the smaller lava pond in the central portion of the crater floor, contained several overflows during 7-10 February and intermittent fountaining. Activity at the S small lava pond and the small S lava fountain within the E lake declined during 9-10 February. The lava pond in the central portion of the crater floor had nearly continuous, expansive flows during 10-13 February; channels from the small central lava pond seemed to flow into the larger E lake. During 13-18 February a small lava fountain was observed in the small lava pond in the central portion of the crater floor. Continuous overflows persisted during this time.
Activity in the eastern and central lakes began to decline in the late afternoon of 17 February. By 18 February HVO reported that the lava effusions had significantly declined, and that the eastern and central lakes were no longer erupting. The W lake in the basin remained active but at a greatly reduced level that continued to decline. HVO reported that this decrease in activity is attributed to notable deflationary tilt that began early on the morning of 17 February and lasted until early 19 February. By 19 February the W lake was mostly crusted over although some weak lava flows remained, which continued through 28 February. The sulfur dioxide emission rates ranged 250-2,800 t/d, the highest value of which was recorded on 6 February.
Activity during March 2023. The summit eruption at Halema’uma’u crater continued at greatly reduced levels compared to the previous two months. The E and central vents stopped effusing lava, and the W lava lake remained active with weak lava flows; the lake was mostly crusted over, although slowly circulating lava intermittently overturned the crust. By 6 March the lava lake in the W basin had stopped because the entire surface was crusted over. The only apparent surface eruptive activity during 5-6 March was minor ooze-outs of lava onto the crater floor, which had stopped by 7 March. Several hornitos on the crater floor still glowed through 12 March according to overnight webcam images, but they did not erupt any lava. A small ooze-out of lava was observed just after 1830 in the W lava lake on 8 March, which diminished overnight. The sulfur dioxide emission rate ranged from 155-321 t/d on 21 March. The VAL was lowered to Advisory, and the ACC was lowered to Yellow (the second lowest on a four-color scale) on 23 March due to a pause in the eruption since 7 March.
Activity during April-May 2023. The eruption at Halema’uma’u crater was paused; no lava effusions were visible on the crater floor. Sulfur dioxide emission rates ranged from 75-185 t/d, the highest of which was measured on 22 April. During May and June summit seismicity was elevated compared to seismicity that preceded the activity during January.
Activity during June 2023. Earthquake activity and changes in the patterns of ground deformation beneath the summit began during the evening of 6 June. The data indicated magma movement toward the surface, prompting HVO to raise the VAL to Watch and the ACC to Orange. At about 0444 on 7 June incandescence in Halema’uma’u crater was visible in webcam images, indicating that a new eruption had begun. HVO raised the VAL to Warning and the ACC to Red (the highest color on a four-color scale). Lava flowed from fissures that had opened on the crater floor. Multiple minor lava fountains were active in the central E portion of the Halema’uma’u crater, and one vent opened on the W wall of the caldera (figure 528). The eruptive vent on the SW wall of the crater continued to effuse into the lava lake in the far SW part of the crater (figure 529). The largest lava fountain consistently rose 15 m high; during the early phase of the eruption, fountain bursts rose as high as 60 m. Lava flows inundated much of the crater floor and added about 6 m depth of new lava within a few hours, covering approximately 10,000 m2. By 0800 on 7 June lava filled the crater floor to a depth of about 10 m. During 0800-0900 the sulfur dioxide emission rate was about 65,000 t/d. Residents of Pahala (30 km downwind of the summit) reported minor deposits of fine, gritty ash and Pele’s hair. A small spatter cone had formed at the vent on the SW wall by midday, and lava from the cone was flowing into the active lava lake. Fountain heights had decreased from the onset of the eruption and were 4-9 m high by 1600, with occasional higher bursts. Inflation switched to deflation and summit earthquake activity greatly diminished shortly after the eruption onset.
At 0837 on 8 June HVO lowered the VAL to Watch and the ACC to Orange because the initial high effusion rates had declined, and no infrastructure was threatened. The surface of the lava lake had dropped by about 2 m, likely due to gas loss by the morning of 8 June. The drop left a wall of cooled lava around the margins of the crater floor. Lava fountain heights decreased during 8-9 June but continued to rise to 10 m high. Active lava and vents covered much of the W half of Halema’uma’u crater in a broad, horseshoe-shape around a central, uplifted area (figure 530). The preliminary average effusion rate for the first 24 hours of the eruption was about 150 cubic meters per second, though the estimate did not account for vesiculated lava and variations in crater floor topography. The effusion rate during the very earliest phases of the eruption appeared significantly higher than the previous three summit eruptions based on the rapid coverage of the entire crater floor. An active lava lake, also referred to as the “western lava lake” was centered within the uplifted area and was fed by a vent in the NE corner. Two small active lava lakes were located just SE from the W lava lake and in the E portion of the crater floor.
During 8-9 June the lava in the central lava lake had a thickness of approximately 1.5 m, based on measurements from a laser rangefinder. During 9-12 June the height of the lava fountains decreased to 9 m high. HVO reported that the previously active lava lake in the E part of the crater appeared stagnant during 10-11 June. The surface of the W lake rose approximately 1 m overnight during 11-12 June, likely due to the construction of a levee around it. Only a few small fountains were active during 12-13 June; the extent of the active lava had retreated so that all activity was concentrated in the SW and central parts of Halema’uma’u crater. Intermittent spattering from the vent on the SW wall was visible in overnight webcam images during 13-18 June. On the morning of 14 June a weak lava effusion originated from near the western eruptive vent, but by 15 June there were no signs of continued activity. HVO reported that other eruptive vents in the SW lava lake had stopped during this time, following several days of waning activity; lava filled the lake by about 0.5 m. Lava circulation continued in the central lake and no active lava was reported in the northern or eastern parts of the crater. Around 0800 on 15 June the top of the SW wall spatter cone collapsed, which was followed by renewed and constant spattering from the top vent and a change in activity from the base vent; several new lava flows effused from the top of the cone, as well as from the pre-existing tube-fed flow from its base. Accumulation of lava on the floor resulted in a drop of the central basin relative to the crater floor, allowing several overflows from the SW lava lake to cascade into the basin during the night of 15 June into the morning of 16 June.
Renewed lava fountaining was reported at the eruptive vent on the SW side of the crater during 16-19 June, which effused lava into the far SW part of the crater. This activity was described as vigorous during midday on 16 June; a group of observatory geologists estimated that the lava was consistently ejected at least 10 m high, with some spatter ejected even higher and farther. Deposits from the fountain further heightened and widened the spatter cone built around the original eruptive vent in the lower section of the crater wall. Multiple lava flows from the base of the cone were fed into the SW lava lake and onto the southwestern-most block from the 2018 collapse within Halema’uma’u on 17 June (figure 531); by 18 June they focused into a single flow feeding into the SW lava lake. On the morning of 19 June a second lava flow from the base of the eruptive cone advanced into the SW lava lake.
Around 1600 on 19 June there was a rapid decline in lava fountaining and effusion at the eruptive vent on the SW side of the crater; vent activity had been vigorous up to that point (figure 532). Circulation in the lava lake also slowed, and the lava lake surface dropped by several meters. Overnight webcam images showed some previously eruptive lava still flowing onto the crater floor, which continued until those flows began to cool. By 21 June no lava was erupting in Halema’uma’u crater. Overnight webcam images during 29-30 June showed some incandescence from previously erupted lava flows as they continued to cool. Seismicity in the crater declined to low levels. Sulfur dioxide emission rates ranged 160-21,000 t/d throughout the month, the highest measurement of which was recorded on 8 June. On 30 June the VAL was lowered to Advisory (the second level on a four-level scale) and the ACC was lowered to Yellow. Gradual inflation was detected at summit tiltmeters during 19-30 June.
Activity during July-August 2023. During July, the eruption paused; no lava was erupting in Halema’uma’u crater. Nighttime webcam images showed some incandescence from previously erupted lava as it continued to cool on the crater floor. During the week of 14 August HVO reported that the rate in seismicity increased, with 467 earthquakes of Mw 3.2 and smaller occurring. Sulfur dioxide emission rates remained low, ranging from 75-86 t/d, the highest of which was recorded on 10 and 15 August. On 15 August beginning at 0730 and lasting for several hours, a swarm of approximately 50 earthquakes were detected at a depth of 2-3 km below the surface and about 2 km long directly S of Halema’uma’u crater. HVO reported that this was likely due to magma movement in the S caldera region. During 0130-0500 and 1700-2100 on 21 August two small earthquake swarms of approximately 20 and 25 earthquakes, respectively, occurred at the same location and at similar depths. Another swarm of 50 earthquakes were recorded during 0430-0830 on 23 August. Elevated seismicity continued in the S area through the end of the month.
Activity during September 2023. Elevated seismicity persisted in the S summit with occasional small, brief seismic swarms. Sulfur dioxide measurements were relatively low and were 70 t/d on 8 September. About 150 earthquakes occurred during 9-10 September, and tiltmeter and Global Positioning System (GPS) data showed inflation in the S portion of the crater.
At 0252 on 10 September HVO raised the VAL to Watch and the ACC to Orange due to increased earthquake activity and changes in ground deformation that indicated magma moving toward the surface. At 1515 the summit eruption resumed in the E part of the caldera based on field reports and webcam images. Fissures opened on the crater floor and produced multiple minor lava fountains and flows (figure 533). The VAL and ACC were raised to Warning and Red, respectively. Gas-and-steam plumes rose from the fissures and drifted downwind. A line of eruptive vents stretched approximately 1.4 km from the E part of the crater into the E wall of the down dropped block by 1900. The lava fountains at the onset of the eruption had an estimated 50 m height, which later rose 20-25 m high. Lava erupted from fissures on the down dropped block and expanded W toward Halema’uma’u crater. Data from a laser rangefinder recorded about 2.5 m thick of new lava added to the W part of the crater. Sulfur dioxide emissions were elevated in the eruptive area during 1600-1500 on 10 September, measuring at least 100,000 t/d.
At 0810 on 11 September HVO lowered the VAL and ACC back to Watch and Orange due to the style of eruption and the fissure location had stabilized. The initial extremely high effusion rates had declined (but remained at high levels) and no infrastructure was threatened. An eruption plume, mainly comprised of sulfur dioxide and particulates, rose as high as 3 km altitude. Several lava fountains were active on the W side of the down dropped block during 11-15 September, while the easternmost vents on the down dropped block and the westernmost vents in the crater became inactive on 11 September (figure 534). The remaining vents spanned approximately 750 m and trended roughly E-W. The fed channelized lava effusions flowed N and W into Halema’uma’u. The E rim of the crater was buried by new lava flows; pahoehoe lava flows covered most of the crater floor except areas of higher elevation in the SW part of the crater. The W part of the crater filled about 5 m since the start of the eruption, according to data from a laser rangefinder during 11-12 September. Lava fountaining continued, rising as high as 15 m by the morning of 12 September. During the morning of 13 September active lava flows were moving on the N and E parts of the crater. The area N of the eruptive vents that had active lava on its surface became perched and was about 3 m higher than the surrounding ground surface. By the morning of 14 September active lava was flowing on the W part of the down dropped block and the NE parts of the crater. The distances of the active flows progressively decreased. Spatter had accumulated on the S (downwind) side of the vents, forming ramparts about 20 m high.
Vigorous spattering was restricted to the westernmost large spatter cone with fountains rising 10-15 m high. Minor spattering occurred within the cone to the E of the main cone, but HVO noted that the fountains remained mostly below the rim of the cone. Lava continued to effuse from these cones and likely from several others as well, traveled N and W, confined to the W part of the down-dropped block and the NE parts of Halema’uma’u. Numerous ooze-outs of lava were visible over other parts of the crater floor at night. Laser range-finder measurements taken of the W part of the crater during 14-15 September showed that lava filled the crater by 10 m since the start of the eruption. Sulfur dioxide emissions remained elevated after the onset of the eruption, ranging 20,000-190,000 t/d during the eruption activity, the highest of which occurred on 10 September.
Field crews observed the eruptive activity on 15 September; they reported a notable decrease or stop in activity at several vents. Webcam images showed little to no fountaining since 0700 on 16 September, though intermittent spattering continued from the westernmost large cone throughout the night of 15-16 September. Thermal images showed that lava continued to flow onto the crater floor. On 16 September HVO reported that the eruption stopped around 1200 and that there was no observable activity anywhere overnight or on the morning of 17 September. HVO field crews reported that active lava was no longer flowing onto Halema’uma’u crater floor and was restricted to a ponded area N of the vents on the down dropped block. They reported that spattering stopped around 1115 on 16 September. Nighttime webcam images showed some incandescence on the crater floor as lava continued to cool. Field observations supported by geophysical data showed that eruptive tremor in the summit region decreased over 15-16 September and returned to pre-eruption levels by 1700 on 16 September. Sulfur dioxide emissions were measured at a rate of 800 t/d on 16 September while the eruption was waning, and 200 t/d on 17 September, which were markedly lower compared to measurements taken the previous week of 20,000-190,000 t/d.
Geologic Background. Kilauea overlaps the E flank of the massive Mauna Loa shield volcano in the island of Hawaii. Eruptions are prominent in Polynesian legends; written documentation since 1820 records frequent summit and flank lava flow eruptions interspersed with periods of long-term lava lake activity at Halemaumau crater in the summit caldera until 1924. The 3 x 5 km caldera was formed in several stages about 1,500 years ago and during the 18th century; eruptions have also originated from the lengthy East and Southwest rift zones, which extend to the ocean in both directions. About 90% of the surface of the basaltic shield volcano is formed of lava flows less than about 1,100 years old; 70% of the surface is younger than 600 years. The long-term eruption from the East rift zone between 1983 and 2018 produced lava flows covering more than 100 km2, destroyed hundreds of houses, and added new coastline.
Information Contacts: Hawaiian Volcano Observatory (HVO), U.S. Geological Survey, PO Box 51, Hawai'i National Park, HI 96718, USA (URL: http://hvo.wr.usgs.gov/).
Tinakula (Solomon Islands) — December 2023 Cite this Report
Tinakula
Solomon Islands
10.386°S, 165.804°E; summit elev. 796 m
All times are local (unless otherwise noted)
Continued lava flows and thermal activity during June through November 2023
Tinakula is a remote 3.5 km-wide island in the Solomon Islands, located 640 km ESE of the capital, Honiara. The current eruption period began in December 2018 and has more recently been characterized by intermittent lava flows and thermal activity (BGVN 48:06). This report covers similar activity during June through November 2023 using satellite data.
During clear weather days (20 July, 23 September, 23 October, and 12 November), infrared satellite imagery showed lava flows that mainly affected the W side of the island and were sometimes accompanied by gas-and-steam emissions (figure 54). The flow appeared more intense during July and September compared to October and November. According to the MODVOLC thermal alerts, there were a total of eight anomalies detected on 19 and 21 July, 28 and 30 October, and 16 November. Infrared MODIS satellite data processed by MIROVA (Middle InfraRed Observation of Volcanic Activity) detected a small cluster of thermal activity occurring during late July, followed by two anomalies during August, two during September, five during October, and five during November (figure 55).
Geologic Background. The small 3.5-km-wide island of Tinakula is the exposed summit of a massive stratovolcano at the NW end of the Santa Cruz islands. It has a breached summit crater that extends from the summit to below sea level. Landslides enlarged this scarp in 1965, creating an embayment on the NW coast. The Mendana cone is located on the SE side. The dominantly andesitic volcano has frequently been observed in eruption since the era of Spanish exploration began in 1595. In about 1840, an explosive eruption apparently produced pyroclastic flows that swept all sides of the island, killing its inhabitants. Recorded eruptions have frequently originated from a cone constructed within the large breached crater. These have left the upper flanks and the steep apron of lava flows and volcaniclastic debris within the breach unvegetated.
Information Contacts: MIROVA (Middle InfraRed Observation of Volcanic Activity), a collaborative project between the Universities of Turin and Florence (Italy) supported by the Centre for Volcanic Risk of the Italian Civil Protection Department (URL: http://www.mirovaweb.it/); Hawai'i Institute of Geophysics and Planetology (HIGP) - MODVOLC Thermal Alerts System, School of Ocean and Earth Science and Technology (SOEST), Univ. of Hawai'i, 2525 Correa Road, Honolulu, HI 96822, USA (URL: http://modis.higp.hawaii.edu/); Copernicus Browser, Copernicus Data Space Ecosystem, European Space Agency (URL: https://dataspace.copernicus.eu/browser/).
Fuego (Guatemala) — December 2023 Cite this Report
Fuego
Guatemala
14.4748°N, 90.8806°W; summit elev. 3799 m
All times are local (unless otherwise noted)
Daily explosions, gas-and-ash plumes, and block avalanches during August-November 2023
Fuego is one of three large stratovolcanoes overlooking the city of Antigua, Guatemala. It has been erupting since January 2002, with observed eruptions dating back to 1531 CE. Typical activity is characterized by ashfall, pyroclastic flows, lava flows, and lahars. Frequent explosions with ash emissions, block avalanches, and lava flows have been reported since 2018. More recently, activity has been characterized by multiple explosions and ash plumes each day, ashfall, block avalanches, and pyroclastic flows (BGVN 48:09). This report describes similar activity of explosions, gas-and-ash plumes, and block avalanches during August through November 2023 based on daily reports from the Instituto Nacional de Sismologia, Vulcanología, Meteorología e Hidrologia (INSIVUMEH) and various satellite data.
Multiple explosions each day were reported during August through November 2023 that produced ash plumes that rose to 4.9 km altitude and drifted as far as 30 km in different directions. The explosions also caused rumbling sounds of varying intensities, with shock waves that vibrated the roofs and windows of homes near the volcano. Incandescent pulses of material rose as high as 350 m above the crater, accompanied by block avalanches that descended multiple drainages. Light ashfall was often reported in nearby communities (table 29). MIROVA (Middle InfraRed Observation of Volcanic Activity) analysis of MODIS satellite data showed intermittent low-to-moderate power thermal activity during the reporting period (figure 175). A total of seven MODVOLC thermal alerts were issued on 11 August, 1, 13, and 23 September, and 10, 17, and 18 November. On clear weather days thermal anomalies were also visible in infrared satellite imagery in the summit crater (figure 176).
Table 29. Activity at Fuego during August through November 2023 included multiple explosions every hour. Ash emissions rose as high as 4.9 km altitude and drifted in multiple directions as far as 30 km, causing ashfall in many communities around the volcano. Data from daily INSIVUMEH reports.
| Month |
Explosions per hour |
Maximum ash plume altitude (km) |
Ash plume direction and distance (km) |
Drainages affected by block avalanches |
Communities reporting ashfall |
| Aug 2023 |
1-11 |
4.8 |
W, NW, SW, N, NE, and E 8-30 km |
Ceniza, Santa Teresa, Seca, Taniluyá, Las Lajas, El Jute, Trinidad, and Honda |
Panimaché, Morelia, Santa Sofía, Yepocapa, Finca Palo Verde, Sangre de Cristo, Acatenango, Aldeas, El Porvenir, La Reunión, San Miguel Dueñas, Cuidad Vieja, Antigua, Quisaché, and El Sendero |
| Sep 2023 |
3-11 |
4.8 |
SW, W, NW, S, and SE 10-30 km |
Seca, Taniluyá, Ceniza, Las Lajas, Honda, Santa Teresa, Trinidad, and El Jute |
Panimaché I and II, Morelia, Palo Verde, Sangre de Cristo, Yepocapa, El Porvenir, Aldeas, Santa Sofía, Montellano, El Socorro, La Rochela, La Asunción, San Andrés Osuna, Guadalupe, and La Trinidad |
| Oct 2023 |
2-10 |
4.9 |
W, SW, S, NW, N, NE, and SE 10-30 km |
Ceniza, Santa Teresa, Taniluyá, Trinidad, Seca, El Jute, Las Lajas, and Honda |
Aldeas, Panimaché I and II, Morelia, Santa Sofía, El Porvenir, Sangre de Cristo, Yepocapa, Yucales, Palo Verde, Acatenango, Patzicía, San Miguel Dueñas, Alotenango, La Soledad, El Campamento, La Rochela, Las Palmas, and Quisaché |
| Nov 2023 |
1-10 |
4.8 |
W, SW, S, E, SE, NW, and N 10-30 km |
Seca, Taniluyá, Ceniza, Las Lajas, EL Jute, Honda, Santa Teresa, and Trinidad |
Panimaché I and II, Morelia, Yepocapa, Santa Sofía, Aldeas, Sangre de Cristo, Palo Verde, El Porvenir, Yucales, La Rochela, San Andrés Osuna, Ceilán, Quisaché, Acatenango, and La Soledad |
Activity during August consisted of 1-11 explosions each day, which generated ash plumes that rose to 4-4.8 km altitude and drifted 8-30 km W, NW, SW, N, NE, and E. Fine ashfall was reported in Panimaché I and II (8 km SW), Morelia (9 km SW), Santa Sofía (12 km SW), Yepocapa (8 km NW), Finca Palo Verde (10 km WSW), Sangre de Cristo (8 km WSW), Acatenango (8 km E), Aldeas, El Porvenir (11 km SW), La Reunión (7 km SE), San Miguel Dueñas (10 km NE), Ciudad Vieja (13.5 km NE), Antigua (18 km NE), Quisaché (8 km NW), and El Sendero. The explosions sometimes ejected incandescent material 50-250 m above the crater and generated weak-to-moderate block avalanches that descended the Santa Teresa (W), Seca (W), Taniluyá (SW), Ceniza (SSW), Las Lajas (SE), El Jute (ESE), Trinidad (S), and Honda (E) drainages. Lahars were reported in the Ceniza drainage on 8-9, 16, 26-27, and 29 August, carrying fine and hot volcanic material, branches, tree trunks, and blocks measured 30 cm up to 1.5 m in diameter. Similar lahars affected the Las Lajas, El Jute, Seca, and El Mineral (W) drainages on 27 August.
Daily explosions ranged from 3-11 during September, which produced ash plumes that rose to 4-4.8 km altitude and drifted 10-30 km SW, W, NW, S, and SE. The explosions were accompanied by block avalanches that affected the Seca, Taniluyá, Ceniza, Las Lajas, Honda, Santa Teresa, Trinidad, and El Jute drainages and occasional incandescent ejecta rose 50-300 m above the crater. Fine ashfall was reported in Panimaché I and II, Morelia, Palo Verde, Sangre de Cristo, Yepocapa, El Porvenir, Aldeas, Santa Sofía, Montellano, El Socorro, La Rochela (8 km SSW), La Asunción (12 km SW), San Andrés Osuna (11 km SSW), Guadalupe, La Trinidad (S). Lahars triggered by rainfall were detected in the Ceniza drainage on 3-4, 8, 13-14, 17, 20-21, 24, 26, 29-30 September, which carried fine and hot volcanic material, branches, tree trunks, and blocks measuring 30 cm to 3 m in diameter. Similar lahars were also detected in the Seca, El Mineral, Las Lajas, and El Jute drainages on 27 September.
There were 2-10 explosions recorded each day during October, which produced ash plumes that rose to 4-4.9 km altitude and drifted 10-30 km W, SW, S, NW, N, NE, and SE. Incandescent pulses of material rose 50-350 m above the crater. Many of the explosions generated avalanches that descended the Ceniza, Santa Teresa, Taniluyá, Trinidad, Seca, El Jute, Las Lajas, and Honda drainages. Ashfall was reported in Aldeas, Panimaché I and II, Morelia, Santa Sofía, El Porvenir, Sangre de Cristo, Yepocapa, Yucales, Palo Verde, Acatenango, Patzicía, Alotenango, La Soledad (11 km N), El Campamento, La Rochela, Las Palmas, and Quisaché. Lahars continued to be observed on 2-5, 7, 9, 11, and 21-22 October, carrying fine and hot volcanic material, branches, tree trunks, and blocks measuring 30 cm to 3 m in diameter. Similar lahars were also reported in the Seca and Las Lajas drainage on 2 October and in the Las Lajas drainage on 4 October. On 4 October lahars overflowed the Ceniza drainage toward the Zarco and Mazate drainages, which flow from Las Palmas toward the center of Siquinalá, resulting from intense rainfall and the large volume of pyroclastic material in the upper part of the drainage. On 9 October a lahar was reported in the Seca and Las Lajas drainages, and lahars in the Las Lajas and El Jute drainages were reported on 11 October. A lahar on 22 October was observed in the Seca drainage, which interrupted transportation between San Pedro Yepocapa and the communities in Santa Sofía, Morelia, and Panimaché.
During November, 1-10 daily explosions were recorded, sometimes accompanied by avalanches, rumbling sounds, and shock waves. Gas-and-ash plumes rose 4.5-4.8 km altitude and extended 10-30 km W, SW, S, E, SE, NW, and N. Incandescent pulses of material rose 50-200 m above the crater. Fine ashfall was reported in Panimaché I and II, Morelia, Yepocapa, El Porvenir, Palo Verde, Santa Sofía, Aldeas, Sangre de Cristo, Yucales, La Rochela, San Andrés Osuna, Ceilán (9 km S), Quisaché, Acatenango, La Soledad. Avalanches of material descended the Seca, Taniluyá, Ceniza, Las Lajas, El Jute, Honda, Santa Teresa, and Trinidad drainages.
Geologic Background. Volcán Fuego, one of Central America's most active volcanoes, is also one of three large stratovolcanoes overlooking Guatemala's former capital, Antigua. The scarp of an older edifice, Meseta, lies between Fuego and Acatenango to the north. Construction of Meseta dates back to about 230,000 years and continued until the late Pleistocene or early Holocene. Collapse of Meseta may have produced the massive Escuintla debris-avalanche deposit, which extends about 50 km onto the Pacific coastal plain. Growth of the modern Fuego volcano followed, continuing the southward migration of volcanism that began at the mostly andesitic Acatenango. Eruptions at Fuego have become more mafic with time, and most historical activity has produced basaltic rocks. Frequent vigorous eruptions have been recorded since the onset of the Spanish era in 1524, and have produced major ashfalls, along with occasional pyroclastic flows and lava flows.
Information Contacts: Instituto Nacional de Sismologia, Vulcanologia, Meteorologia e Hydrologia (INSIVUMEH), Unit of Volcanology, Geologic Department of Investigation and Services, 7a Av. 14-57, Zona 13, Guatemala City, Guatemala (URL: http://www.insivumeh.gob.gt/ ); MIROVA (Middle InfraRed Observation of Volcanic Activity), a collaborative project between the Universities of Turin and Florence (Italy) supported by the Centre for Volcanic Risk of the Italian Civil Protection Department (URL: http://www.mirovaweb.it/); Hawai'i Institute of Geophysics and Planetology (HIGP) - MODVOLC Thermal Alerts System, School of Ocean and Earth Science and Technology (SOEST), Univ. of Hawai'i, 2525 Correa Road, Honolulu, HI 96822, USA (URL: http://modis.higp.hawaii.edu/); Copernicus Browser, Copernicus Data Space Ecosystem, European Space Agency (URL: https://dataspace.copernicus.eu/browser/).
Santa Maria (Guatemala) — December 2023 Cite this Report
Santa Maria
Guatemala
14.757°N, 91.552°W; summit elev. 3745 m
All times are local (unless otherwise noted)
Continuing lava effusion, explosions, ash plumes, and pyroclastic flows during August-November 2023
The Santiaguito lava dome complex of Guatemala’s Santa María volcano has been actively erupting since 1922. The lava dome complex lies within a large crater on the SW flank of Santa María that was formed during the 1902 eruption. Ash explosions, pyroclastic flows, and lava flows have emerged from Caliente, the youngest of the four vents in the complex for more than 40 years. A lava dome that appeared within Caliente’s summit crater in October 2016 has continued to grow, producing frequent block avalanches down the flanks. More recently, activity has been characterized by frequent explosions, lava flows, ash plumes, and pyroclastic flows (BGVN 48:09). This report covers activity during August through November 2023 based on information from Guatemala's INSIVUMEH (Instituto Nacional de Sismologia, Vulcanologia, Meterologia e Hidrologia) and various satellite data.
Activity during August consisted of weak-to-moderate explosions, avalanches of material, gas-and-ash plumes, and incandescence observed at night and in the early morning. Weak degassing plumes rose 300-600 m above the crater. Frequent explosions were detected at a rate of 1-2 per hour, which produced gas-and-ash plumes that rose 200-1,000 m above the crater and drifted W, NW, SW, S, E, and NE. Two active lava flows continued mainly in the Zanjón Seco (SW) and San Isidro (W) drainages. Incandescent block avalanches and occasional block-and-ash flows were reported on the W, S, E, SE, and SW flanks, as well as on the lava flows. On 26 and 29 August, fine ash plumes rose to 3.5 km altitude and drifted E and NE, causing ashfall in Belén (10 km S) and Calaguache (9 km S), as well as Santa María de Jesús (5 km SE) on 29 August.
Daily degassing, weak-to-moderate explosions, gas-and-ash plumes, and nighttime and early morning incandescence in the upper part of the dome continued during September. Explosions occurred at a rate of 1-2 per hour. Gas-and-ash plumes rose 200-1,000 m above the crater and drifted SW, W, SE, and NW. Block avalanches descended the SW, S, SE, and E flanks, often reaching the base of the Caliente dome. These avalanches were sometimes accompanied by short pyroclastic flows, resulting in fires in some vegetated areas. Block-and-ash flows descended all flanks of the Caliente dome on 16 and 24 September following the eruption of gas-and-ash plumes that rose 700-1,000 m above the crater. Gray ash was primarily deposited in the drainages.
Continuous gas-and-steam emissions occurred in October, along with weak-to-moderate explosions, block avalanches, crater incandescence, and an active lava flow on the WSW flank. Explosions occurred at a rate of 1-4 per hour, that generated gas-and-ash plumes rose 200-1,000 m above the crater and drifted in different directions. Block avalanches traveled down the SW, S, SE, and E flanks, sometimes accompanied by small pyroclastic flows. On 21 and 25 October as many as 50 explosions occurred over the course of 24 hours.
Similar activity persisted during November, with frequent explosions, crater incandescence, and block avalanches. The active lava flow persisted on the WSW flank. Weak-to-moderate explosions occurred at a rate of 1-4 per hour. Incandescence was observed at night and in the early morning. Gas-and-ash emissions rose 700-900 m above the crater and drifted W, SW, S, and NW. Block avalanches were reported on the SW, W, S, SE, and E flanks, which deposited gray ash material in the drainages, sometimes reaching the base of the Caliente dome. Those avalanches were sometimes accompanied by small pyroclastic flows that reached the base of the dome on the W, SW, and S flanks. Ashfall was reported in Las Marías (10 km S), El Viejo Palmar (12 km SSW), El Patrocinio, and San Marcos (8 km SW) on 18 and 22 November. On 26 and 30 November ashfall was reported in San Marcos and Loma Linda Palajunoj (7 km SW).
The MIROVA (Middle InfraRed Observation of Volcanic Activity) graph showed frequent moderate-power thermal anomalies during the reporting period (figure 140). A total of 26 MODVOLC thermal alerts were issued on 6, 7, 7, 15, 16, and 21 August, 15 and 23 September, 19, 26, 27, and 29 October, and 2, 7, 11, 27, 28, and 29 November. Clouds covered the summit of the volcano on most days, so thermal anomalies could not be identified in most Sentinel infrared satellite images.
Geologic Background. Symmetrical, forest-covered Santa María volcano is part of a chain of large stratovolcanoes that rise above the Pacific coastal plain of Guatemala. The sharp-topped, conical profile is cut on the SW flank by a 1.5-km-wide crater. The oval-shaped crater extends from just below the summit to the lower flank, and was formed during a catastrophic eruption in 1902. The renowned Plinian eruption of 1902 that devastated much of SW Guatemala followed a long repose period after construction of the large basaltic andesite stratovolcano. The massive dacitic Santiaguito lava-dome complex has been growing at the base of the 1902 crater since 1922. Compound dome growth at Santiaguito has occurred episodically from four vents, with activity progressing E towards the most recent, Caliente. Dome growth has been accompanied by almost continuous minor explosions, with periodic lava extrusion, larger explosions, pyroclastic flows, and lahars.
Information Contacts: Instituto Nacional de Sismologia, Vulcanologia, Meteorologia e Hydrologia (INSIVUMEH), Unit of Volcanology, Geologic Department of Investigation and Services, 7a Av. 14-57, Zona 13, Guatemala City, Guatemala (URL: http://www.insivumeh.gob.gt/); MIROVA (Middle InfraRed Observation of Volcanic Activity), a collaborative project between the Universities of Turin and Florence (Italy) supported by the Centre for Volcanic Risk of the Italian Civil Protection Department (URL: http://www.mirovaweb.it/); Hawai'i Institute of Geophysics and Planetology (HIGP) - MODVOLC Thermal Alerts System, School of Ocean and Earth Science and Technology (SOEST), Univ. of Hawai'i, 2525 Correa Road, Honolulu, HI 96822, USA (URL: http://modis.higp.hawaii.edu/); Copernicus Browser, Copernicus Data Space Ecosystem, European Space Agency (URL: https://dataspace.copernicus.eu/browser/).
Karangetang (Indonesia) — November 2023 Cite this Report
Karangetang
Indonesia
2.781°N, 125.407°E; summit elev. 1797 m
All times are local (unless otherwise noted)
Incandescent avalanches, pyroclastic flows, and ash plumes during July-September 2023
Karangetang (also known as Api Siau), at the northern end of the island of Siau, Indonesia, contains five summit craters along a N-S line. More than 40 eruptions have been recorded since 1675; recent eruptions have included frequent explosive activity, sometimes accompanied by pyroclastic flows and lahars. Lava dome growth has occurred in the summit craters and collapses of lava flow fronts have also produced pyroclastic flows. The two active summit craters are Kawah Dua (the N crater) and Kawah Utama (the S crater, also referred to as the “Main Crater”). The most recent eruption began in early February 2023 and was characterized by lava flows, incandescent avalanches, and ash plumes (BGVN 48:07). This report covers similar activity through the end of the eruption during July through September 2023 using reports from Pusat Vulkanologi dan Mitigasi Bencana Geologi (PVMBG, also known as CVGHM, or the Center of Volcanology and Geological Hazard Mitigation), MAGMA Indonesia, the Darwin VAAC (Volcano Ash Advisory Center), and satellite data.
Webcam images occasionally showed crater incandescence and lava flows on the flanks of Main Crater during July. Near daily white gas-and-steam plumes rose 50-400 m above the crater and drifted in multiple directions. A webcam image taken at 1732 on 1 July suggested that a pyroclastic flow descended the SE flank, as evident from a linear plume of gas-and-ash rising along its path (figure 66). Incandescent material extended about 1 km down the S flank and about 600 m down the SSW and SW flank, based on a Sentinel satellite image taken on 2 July (figure 67). During the evening of 3 July a lava avalanche descended the Kahetang drainage (SE), extending 1-1.8 km, and the Timbelang and Beha drainages, extending 700-1,000 m. There were 53 earthquakes also detected that day. According to a news article from 6 July the lava avalanche from 2 July continued down the SW flank of Main Crater toward the Batang, Timbelang, and Beha Barat drainages for 1.5 km. An avalanche was also visible on the S flank, affecting the Batuawang and Kahetang drainages, and extending 1.8 km. Incandescent avalanches were reported during 8-9 July, traveling 1.8 km toward the Kahetang, Batuawang (S), and Timbelang drainages (figure 68). PVMBG issued two VONAs (Volcano Observatory Notices for Aviation) at 0759 and 0850 on 10 July, which reported two pyroclastic flows that traveled about 2 km toward the Kahetang drainage (figure 69). There were also 55 earthquakes detected on 10 July. As a result, 17 residents from Bolo Hamlet, Tarorane Village, East Siau District, Sitaro Islands Regency, North Sulawesi were evacuated.
An incandescent avalanche of material descended 1-1.8 km down the Kahetang drainage and 1 km down the Batang drainage on 14 July. During 18-29 July lava avalanches continued to move 1-1.8 km toward the Kahetang drainage, 700-1,000 m toward the Batuawang and Batang drainages, 700-1,000 m toward the Timbelang and Beha Barat drainage, and 1.5 km toward the West Beha drainage. Gray-and-white plumes accompanied the lava avalanches. During 20 July crater incandescence was visible in the gas-and-steam column 10-25 m above the crater. The Darwin VAAC reported that ash plumes rose to 2.4 km altitude at 1710 on 21 July, at 1530 on 22 July, and at 0850 on 23 July, which drifted NE and E. According to a news article, there were 1,189 earthquakes associated with lava avalanches recorded during 24-31 July.
Incandescent avalanches originating from Main Crater and extending SW, S, and SE persisted during August. Frequent white gas-and-steam plumes rose 25-350 m above the crater and drifted in different directions during August. Incandescent avalanches of material traveled S as far as 1.5 km down the Batuawang drainage, 1.8-1.9 km down the Kahetang drainage, and 2-2.1 km down the Keting drainage and SW 800-1,500 m down the Batang, Timbelang, and Beha Barat drainages. Occasional gray plumes accompanied this activity. According to a news article, 1,899 earthquakes associated with lava avalanches were recorded during 1-7 August. Incandescent ejecta from Main Crater was visible up to 10-25 m above the crater. Nighttime crater incandescence was visible in the N summit crater. There were 104 people evacuated from Tatahadeng and Tarorane during the first week of August, based on information from a news article that was published on 9 August. According to a news article published on 14 August the frequency of both earthquakes and lava avalanches decreased compared to the previous week; there were 731 earthquakes associated with avalanches detected during 8-15 August, and 215 during 24-31 August . Lava avalanches descending the Batang and Timbelang drainages continued through 24 August and the Batuawang, Kahetang, and Keting through 30 August. A news article published on 17 August reported pyroclastic flows due to collapsing accumulated material from lava flows.
Near-daily white gas-and-steam plumes rose 25-300 m above the crater and drifted in multiple directions during September. According to news articles, lava avalanches from Main Crater continued toward the Batuawang, Kahetang, and Keting drainages, reaching distances of 1-1.8 km. Lava avalanches also descended the Batang, Timbelang, and Beha Barat drainages as far as 1 km from Main Crater. Main Crater and N Crater incandescence were visible as high as 10 m above the crater. During 1-7 September the number of earthquakes associated with avalanches declined, although effusive activity continued. During 8-15 September lava effusion at Main Crater was not visible, although sounds of avalanches were sometimes intense, and rumbling was also occasionally heard. According to a news article published on 26 September, avalanches were no longer observed.
On 29 November PVMG lowered the Volcano Alert Level (VAL) to 2 (the second lowest level on a scale of 1-4) due to declining activity. Seismic data and visual observations indicated that effusion had decreased or stopped, and lava avalanches were no longer observed.
MIROVA (Middle InfraRed Observation of Volcanic Activity) analysis of MODIS satellite data showed strong thermal activity during July through August 2023, which was mainly characterized by incandescent avalanches of material and lava flows (figure 70). During August, the frequency and intensity of the thermal anomalies declined and remained relatively low through December. There was a brief gap in activity in late September. According to data recorded by the MODVOLC thermal algorithm, there were a total of 22 during July and 19 during August. Infrared satellite images showed summit crater incandescence at both the N and S craters and occasional incandescent avalanches of material affecting mainly the S flank (figure 67).
Geologic Background. Karangetang (Api Siau) volcano lies at the northern end of the island of Siau, about 125 km NNE of the NE-most point of Sulawesi. The stratovolcano contains five summit craters along a N-S line. It is one of Indonesia's most active volcanoes, with more than 40 eruptions recorded since 1675 and many additional small eruptions that were not documented (Neumann van Padang, 1951). Twentieth-century eruptions have included frequent explosive activity sometimes accompanied by pyroclastic flows and lahars. Lava dome growth has occurred in the summit craters; collapse of lava flow fronts have produced pyroclastic flows.
Information Contacts: Pusat Vulkanologi dan Mitigasi Bencana Geologi (PVMBG, also known as Indonesian Center for Volcanology and Geological Hazard Mitigation, CVGHM), Jalan Diponegoro 57, Bandung 40122, Indonesia (URL: http://www.vsi.esdm.go.id/); MAGMA Indonesia, Kementerian Energi dan Sumber Daya Mineral (URL: https://magma.esdm.go.id/v1); Badan Nasional Penanggulangan Bencana (BNPB), National Disaster Management Agency, Graha BNPB - Jl. Scout Kav.38, East Jakarta 13120, Indonesia (URL: http://www.bnpb.go.id/); Darwin Volcanic Ash Advisory Centre (VAAC), Bureau of Meteorology, Northern Territory Regional Office, PO Box 40050, Casuarina, NT 0811, Australia (URL: http://www.bom.gov.au/info/vaac/); MIROVA (Middle InfraRed Observation of Volcanic Activity), a collaborative project between the Universities of Turin and Florence (Italy) supported by the Centre for Volcanic Risk of the Italian Civil Protection Department (URL: http://www.mirovaweb.it/); Hawai'i Institute of Geophysics and Planetology (HIGP) - MODVOLC Thermal Alerts System, School of Ocean and Earth Science and Technology (SOEST), Univ. of Hawai'i, 2525 Correa Road, Honolulu, HI 96822, USA (URL: http://modis.higp.hawaii.edu/); Copernicus Browser, Copernicus Data Space Ecosystem, European Space Agency (URL: https://dataspace.copernicus.eu/browser/); Antara News, Jalan Antara Kav. 53-61 Pasar Baru, Jakarta Pusat 10710, Indonesia (URL: antaranews.com).
Search Bulletin Archive by Publication Date
Select a month and year from the drop-downs and click "Show Issue" to have that issue displayed in this tab.
The default month and year is the latest issue available.
Bulletin of the Global Volcanism Network - Volume 33, Number 07 (July 2008)
Cleveland (United States)
Eruption on 21 July 2008; lava flows and ash plumes
Karymsky (Russia)
Ongoing explosions that began in 1996 continued through September 2008
Kasatochi (United States)
Devastating SO2-rich ash eruption began on 7 August 2008
Kelud (Indonesia)
Lava dome reached 35 million cubic meters; eruptions ceased in mid-May
Montagu Island (United Kingdom)
Eruption of Mount Belinda ceased by late 2007
Okmok (United States)
Mid-July to mid-August 2008: abundant tremor and ash plumes to ~11 km altitude
Rincon de la Vieja (Costa Rica)
Tremor durations from minutes to over an hour during June-April 2008
Tara, Batu (Indonesia)
Frequent ash plumes continued during March-August 2008
Cleveland (United States) — July 2008 Cite this Report
Cleveland
United States
52.825°N, 169.944°W; summit elev. 1730 m
All times are local (unless otherwise noted)
Eruption on 21 July 2008; lava flows and ash plumes
Minor explosions were reported from Cleveland volcano on 15 and 29 February 2008 Cleveland (BGVN 33:02); such events have been typical during the last several years. This report discusses subsequent behavior and observations into late August, including thermal anomalies, explosions, ash plumes, and an inferred lava flow.
AVO noted that during the two weeks prior to 9 May 2008, an increasing number of thermal anomalies were visible on satellite imagery. On 7 May, a small ash plume rose to an altitude of below 4.6 km. Also, around the same time, a ship N of Nikolski on Umnak Island (~ 75 km ENE) reported receiving a dusting of ash (figure 6).
During June and early July 2008, satellite and webcam views were mostly obscured by clouds and fog, and AVO received no reports of eruptive activity. Satellite analysts noted a minor thermal anomaly on 8 June.
On 21 July, AVO raised the alert level/aviation color code for Cleveland to Watch/Orange based on reports from pilots and observers on fishing boats. Reports from fishing boats indicated that an eruption started at about 1200 and ash near sea level may have drifted NW. Pilots reported that an ash-and-steam plume rose to altitudes of ~ 4.6-5.2 km and drifted SE.
Satellite imagery for 22 July revealed a steam plume possibly containing some ash drifting more than 50 km ESE. It reached altitudes of 3-6 km. Thermal anomalies led analysts to infer a possible lava flow. Also, in harmony with this interpretation, on 22 July the MODVOLC algorithm registered its first alert thus far in 2008 (3 pixels) and near-daily alerts followed as late as 29 July (table 2).
Table 2. Thermal anomalies ("alerts") at Cleveland registered by the MODIS satellite as processed by the MODVOLC algorithm during the interval 1 January-9 September 2008. The only recent alerts during that interval were during the period of 22-29 July. Courtesy of Hawai'i Institute of Geophysics and Planetology (HIGP) Thermal Alerts System.
| Date (UTC) |
Time (UTC) |
Pixels |
Satellite |
| 22 Jul 2008 |
1255 |
3 |
Aqua |
| 23 Jul 2008 |
0010 |
3 |
Aqua |
| 24 Jul 2008 |
0840 |
2 |
Terra |
| 24 Jul 2008 |
1245 |
3 |
Aqua |
| 24 Jul 2008 |
1420 |
5 |
Aqua |
| 27 Jul 2008 |
1315 |
1 |
Aqua |
| 27 Jul 2008 |
2240 |
1 |
Terra |
| 29 Jul 2008 |
0855 |
1 |
Terra |
AVO reported that satellite views were hindered on 23 July due to cloud cover. On 24 July, a low-level ash plume and a strong thermal anomaly were noted near the summit. This thermal anomaly again suggested the presence of an active lava flow. The MODIS measurements shown in table 2 for 24 July indicated several thermal anomalies to the W of the cone and pixels that are displaced downslope, E of the cone, several almost reaching the ocean. The thermal anomalies continued to be detected during 26-28 July, and possible ash plumes drifted SE, E, and NE at altitudes of 3-6.1 km during 27-29 July.
According to David Schneider of AVO, the MODVOLC algorithm has a higher trigger threshold than an analyst and MODVOLC also has fewer observations each day since it only uses MODIS satellite data. AVO uses MODIS, AVHRR, and GOES satellites to reduce the chance of missing thermal anomalies due to cloud cover. Both MODVOLC and AVO use mid-IR data (in the 3.0 to 3.5 micron range) to detect high temperature thermal anomalies.
AVO reported that thermal anomalies detected at Cleveland's summit by various satellites during 30 July-5 August 2008 also suggested the presence of an active lava flow. The anomaly on 30 July extended about 6-9 km. On 31 July, a diffuse plume drifted less than 20 km NE, N, and NW at an altitude of 6.1 km. The plume was seen from an airplane on 1 August.
On 5 August, thermal anomalies appeared on the W, S, and SE flanks. They possibly indicated the presence of pyroclastic flows or hot lahars. On 6 August 2008, AVO reported that the thermal anomalies noted at Cleveland's summit and on the W, S, and SE flanks had decreased in intensity since first noted on 21 July, indicating that the lava flows slowed or stopped. The hazard status was lowered to Yellow/Advisory. During 7-10 August 2008, a weak thermal anomaly at Cleveland's summit was intermittently visible when not obscured by clouds and drifting ash from Kasatochi (~ 390 km WSW).
On 11 August, thermal anomalies on satellite imagery again indicated that lava flowed down the flanks. On 12 August an ash plume rose to an altitude of 7.6 km and drifted 100 km SW. Cloud cover prevented satellite observations during 13-26 August, although a possible thermal anomaly was present on 24 August. On 11 August the hazard status rose to Orange/Watch, but on 25 August it dropped to Yellow/Advisory.
Geologic Background. The beautifully symmetrical Mount Cleveland stratovolcano is situated at the western end of the uninhabited Chuginadak Island. It lies SE across Carlisle Pass strait from Carlisle volcano and NE across Chuginadak Pass strait from Herbert volcano. Joined to the rest of Chuginadak Island by a low isthmus, Cleveland is the highest of the Islands of the Four Mountains group and is one of the most active of the Aleutian Islands. The native name, Chuginadak, refers to the Aleut goddess of fire, who was thought to reside on the volcano. Numerous large lava flows descend the steep-sided flanks. It is possible that some 18th-to-19th century eruptions attributed to Carlisle should be ascribed to Cleveland (Miller et al., 1998). In 1944 it produced the only known fatality from an Aleutian eruption. Recent eruptions have been characterized by short-lived explosive ash emissions, at times accompanied by lava fountaining and lava flows down the flanks.
Information Contacts: Alaska Volcano Observatory (AVO), a cooperative program of the U.S. Geological Survey, 4200 University Drive, Anchorage, AK 99508-4667, USA (URL: http://www.avo.alaska.edu/), the Geophysical Institute, University of Alaska, PO Box 757320, Fairbanks, AK 99775-7320, USA, and the Alaska Division of Geological and Geophysical Surveys, 794 University Ave., Suite 200, Fairbanks, AK 99709, USA; Hawai'i Institute of Geophysics and Planetology (HIGP) Thermal Alerts System, School of Ocean and Earth Science and Technology (SOEST), Univ. of Hawai'i, 2525 Correa Road, Honolulu, HI 96822, USA (URL: http://modis.higp.hawaii.edu/).
Karymsky
Russia
54.049°N, 159.443°E; summit elev. 1513 m
All times are local (unless otherwise noted)
Ongoing explosions that began in 1996 continued through September 2008
Karymsky stratovolcano, one of most active of the Eastern Volcanic Zone of the Kamchatka arc, began an eruptive cycle in January 1996 lasting through at least September 2008. This report covers activity from June 2008 to September 2008 (figure 15).
During June-September, there were alternating periods of strengthening and weakening activity. Ash plumes were emitted and hot avalanches repeatedly descended the flanks. Seismic events usually had local magnitudes (ML) less than 2.5. Local shallow earthquakes were associated with crater explosions. Satellite data registered thermal anomalies usually on the crater, suggesting the eruption of hot magmatic material such as a lava flow or fragmental avalanches. An increase in the anomaly to 4-7 pixels usually accompanied a lava flow. Code Orange days during the reporting period occurred on the following days (table 4).
Table 4. Thermal anomalies at Karymsky from NOAA-15 satellite images and visual observations for the interval from June to September 2008. Courtesy of Kamchatka Branch of the Geophysical Service of the Russian Academy of Sciences (KB GS RAS).
| Date(s) |
Thermal Anomaly (pixels) |
Comments |
| 27 Aug 2008 |
-- |
Local shallow earthquakes; ash plume 2.9-3.2 km altitude |
| 28 Aug 2008 |
4 |
Local shallow earthquakes; ash plume 2.6-3.0 km altitude |
| 29 Aug 2008 |
4 |
Local shallow earthquakes; ash plume 3.0-3.8 km altitude |
| 31 Aug 2008 |
1 |
Local shallow earthquakes; ash plume 3.0 km altitude |
| 01 Sep 2008 |
-- |
Local shallow earthquakes; ash plume 3.3 km altitude |
| 08 Sep 2008 |
-- |
Local shallow earthquakes; ash plumes reaching 2.2-3.2 km altitude |
| 13 Sep 2008 |
2 |
Local shallow earthquakes |
| 14 Sep 2008 |
2 |
Local shallow earthquakes; ash plume 2.9 km altitude |
Geologic Background. Karymsky, the most active volcano of Kamchatka's eastern volcanic zone, is a symmetrical stratovolcano constructed within a 5-km-wide caldera that formed during the early Holocene. The caldera cuts the south side of the Pleistocene Dvor volcano and is located outside the north margin of the large mid-Pleistocene Polovinka caldera, which contains the smaller Akademia Nauk and Odnoboky calderas. Most seismicity preceding Karymsky eruptions originated beneath Akademia Nauk caldera, located immediately south. The caldera enclosing Karymsky formed about 7600-7700 radiocarbon years ago; construction of the stratovolcano began about 2000 years later. The latest eruptive period began about 500 years ago, following a 2300-year quiescence. Much of the cone is mantled by lava flows less than 200 years old. Historical eruptions have been vulcanian or vulcanian-strombolian with moderate explosive activity and occasional lava flows from the summit crater.
Information Contacts: Kamchatka Volcanic Eruptions Response Team (KVERT), Aleksey Ozerov, Institute of Volcanology and Seismology, Far East Division, Russian Academy of Sciences, Piip Ave. 9, Petropavlovsk-Kamchatsky, 683006, Russia (URL: http://www.kscnet.ru/ivs/); Kamchatka Branch of the Geophysical Service of the Russian Academy of Sciences (KB GS RAS), Sergey Senukov, Russia (URL: http://www.emsd.ru/).
Kasatochi (United States) — July 2008 Cite this Report
Kasatochi
United States
52.177°N, 175.508°W; summit elev. 314 m
All times are local (unless otherwise noted)
Devastating SO2-rich ash eruption began on 7 August 2008
Kasatochi, which apparently had not erupted during the last century, erupted explosively with little warning on 7 August 2008. The island is generally uninhabited, ~ 3 km in diameter, and lies ~ 800 km W of the tip of the Alaska Peninsula (figures 1 and 2). The eruptive history of this volcano includes several unconfirmed eruptions in the 1800's, and a small confirmed eruption in 1760. Much of the information in this report was taken from the Alaska Volcano Observatory (AVO) website or provided by John Eichelberger of the U.S. Geological Survey (USGS). No seismic or other geophysical monitoring instrumentation is present on Kasatochi. Seismic networks reside on neighboring islands, such as Great Sitkin Island ~ 40 km W.
The first indication of activity on Kasatochi was around 2 August 2008, when a U.S. Fish and Wildlife Service (USFWS) field crew of two biologists on the island experienced continual small tremors. On 6 August, for a period of about 12 hours during the morning and afternoon, the AVO noted a rapid increase in earthquakes on the island. On the evening of 6 August, AVO elevated the aviation color code/volcano alert level to Yellow/Advisory.
By 7 August 2008, the number and magnitude of earthquakes increased, accompanied by volcanic tremor. Earthquakes as large as M 5.6 were detected. On the morning of 7 August, the field crew reported periods of continuous ground shaking lasting 5-10 min, as well as numerous rockfalls and a strong sulfur odor. Between approximately 1400 and 2035, three major explosions occurred. According to satellite data, ash reached an altitude of at least 13.7 km in the vicinity of Kasatochi, and drifted SSW.
The two biologists (Ray Buchheit and Chris Ford) were conducting a summer-long study of seabirds and living in a cabin on the island. According to Rozell (2008), the two were rescued by a charter boat captain only hours prior to the 7 August eruptions. After the earthquakes and other signs on the morning of 7 August, the biologists radioed their contact in Adak to explain the situation. The two fueled up their skiff and were prepared to jump in and follow a GPS course to Great Sitkin Island, heading across rough seas ~ 40 km W. But the refuge staff chartered a larger boat from Adak, which succeeded in getting the biologists off the island and to safety.
Between 2100 and 2300 on 7 August, observers from a ship near Kasatochi reported ashfall with tephra up to pebble size. They noted spectacular lightning, thunder, and total darkness during this time. In response to this eruptive activity, AVO elevated the aviation color code/volcano alert level to Orange/Watch and then to Red/Warning.
Ash emissions became continuous following the last of the three explosive events of 7 August, and (downward looking) satellite imagery disclosed a continuous ash cloud bent in a counterclockwise spiral. By 8 August, that plume had extended SE for more than 950 km at an altitude exceeding 10.7 km (figure 3).
The eruption continued through 8 August and satellite imagery continued to detect a plume from Kasatochi until slightly after midnight on 9 August. By the morning of 9 August, seismicity declined and ash emissions were not observed in either satellite data or from pilots or passing mariners. The drifting SO2 plume was seen on satellite imagery 1,850 km ESE of the volcano. The plume was elongated NE-SW over a distance of 1,200 km.
During the days after 9 August, eruptive activity declined gradually. Seismic activity persisted at least through 5 September. The ash cloud produced during the previous week had detached and spread out over North America and was beginning to extend over parts of the North Atlantic. The distribution of gases and aerosols no longer appeared as a single intact cloud.
According to news reports on 10 and 11 August, Alaska Airlines had cancelled over 40 flights into and out of Alaska because of the ash plume. One report from Reuters stated that Alaska Airlines cancelled 44 flights. Those cancellations affected more than 5,200 passengers. According to an Anchorage Daily News report on 10 August, a member of Alaska Airlines staff was reported as saying, "The entire state is unflyable." The total number of flights cancelled by this and other carriers is unknown.
Occasional earthquakes and periods of tremor continued to be recorded. During 17-19 August, the smell of sulfur was reported from Adak, about 85 km SW of Kasatochi Island. Active fumaroles and hot pyroclastic-flow deposits over much of the volcano were observed on 22-23 August by visiting scientists (see below). On September 3 and 4, passing mariners observed vigorous steam and gas plumes rising above the crater and extending up to ~ 30 km downwind. On 4 September, the aviation color code/volcano alert level was reduced to Yellow/Advisory.
Sulfur dioxide measurements. On the days following the eruptions, the Ozone Monitoring Instrument (OMI) on NASA's Aura satellite tracked a dense cloud that contained about 1.5 megatons (million tons) of sulfur dioxide (SO2). This was one of the largest volcanic SO2 clouds scientists have observed from satellite measurements since the 1991 Pinatubo eruption in the Philippines. However, some fraction may be due to increased instrument sensitivity achieved since that time.
The three panels comprising figure 4 depict the early distribution of Kasatochi's SO2 plumes. The 8 August 2008 OMI image shows a highly-concentrated SO2 distribution E and SE. By 10 August the SO2 cloud had become elongate and sinuous, and had detached from the source. It extended S and SW but a long NW projection reached mainland Canada where it spread N and S to Alaska and Washington state. The zones of greatest SO2 concentration on 12 August appeared near the Yukon-Alaskan border. Areas of lower concentrations were complex but covered much of Canada and adjacent coastal areas at least as far as Greenland. A small outlier (not shown on map) was also present between Greenland and Iceland. The detached trailing edge resided over the N Pacific but farther S than in previous images.
Post-eruption visit. On 22-23 August 2008, Chris Waythomas (USGS/AVO) and Ray Bucheit (USFWS) visited the volcano. They observed numerous active fumeroles and hot pyroclastic-flow deposits. The entire island had been swept by surges and pyroclastic flows. Pyroclastic-flow, -surge, and fall deposits, in places containing boulders up to 2 m across, formed a new shoreline well beyond the pre-existing sea cliffs (figure 5). The visitors found no signs of life remaining on the island. The island's isolated ecosystem, which had been monitored by USFWS since the 1930s, had been totally destroyed.
Figure 6 shows the extent of island's new shoreline and the new crater rim compared to the island's pre-eruption morphology. Newly deposited material extended the shoreline in a low-lying band around most parts of the island, in some places, ~ 300 m outboard of the pre-existing sea cliffs. In general, the crater rim expanded, particularly on the W side where it enlarged by ~ 200 m. A crater lake remained; and vents in the S crater were identified. During the visit, fresh slumps were apparent in fresh deposits perched on the crater rim and smaller "secondary" surge deposits were identified (figure 7).
Thermal anomalies. According to David Schneider of AVO, thermal anomalies at Kasatochi were visible using a combination of MODIS, AVHRR, and GOES satellite sensors; increasing the number of satellite observations per day reduces the chance of missing anomalies due to cloud cover. The Hawai'i Institute of Geophysics and Planetology (HIGP) Thermal Alerts System measured no MODIS/MODVOLC thermal anomalies at Kasatochi during August and early September 2008. AVO measured thermal anomalies through breaks in the clouds on 5 September 2008 and during a relatively clear day on 7 September.
Reference. Rozell, N., 2008, Tiny Aleutian island has big impact: Alaska Science Forum, Article 1920, 13 August 2008 (URL: http://www.gi.alaska.edu/ScienceForum/ASF19/1920.html). (The Alaska Science Forum is a public service provided by the Geophysical Institute, University of Alaska Fairbanks, in cooperation with the UAF research community.)
Geologic Background. Located at the northern end of a shallow submarine ridge trending perpendicular to the Aleutian arc, Kasatochi is small 2.7 x 3.3 km island volcano with a 750-m-wide summit crater lake. The summit reaches only about 300 m elevation, and the lake surface lies less than about 60 m above the sea. A lava dome is located on the NW flank at about 150 m elevation. The asymmetrical island is steeper on the northern side than the southern, and the crater lies north of the center of the island. Reports of activity from the heavily eroded Koniuji volcano to the east probably refer to eruptions from Kasatochi. A lava flow may have been emplaced during the first recorded eruption in 1760. A major explosive eruption in 2008 produced pyroclastic flows and surges that swept into the sea, extending the island's shoreline.
Information Contacts: Alaska Volcano Observatory (AVO), a cooperative program of the U.S. Geological Survey, 4200 University Drive, Anchorage, AK 99508-4667, USA; Geophysical Institute, University of Alaska, PO Box 757320, Fairbanks, AK 99775-7320, USA; and Alaska Division of Geological & Geophysical Surveys, 794 University Ave., Suite 200, Fairbanks, AK 99709, USA (URL: http://www.avo.alaska.edu/); Hawai'i Institute of Geophysics and Planetology (HIGP) Thermal Alerts System, School of Ocean and Earth Science and Technology (SOEST), Univ. of Hawai'i, 2525 Correa Road, Honolulu, HI 96822, USA (URL: http://modis.higp.hawaii.edu/); NASA Earth Observatory (URL: http://earthobservatory.nasa.gov/NaturalHazards/); Simon Carn, Joint Center for Earth Systems Technology, University of Maryland Baltimore County (URL: https://so2.gsfc.nasa.gov/); Portland Business Journal (URL: http://portland.bizjournals.com/portland); Reuters (URL: http://www.reuters.com/).
Kelud
Indonesia
7.935°S, 112.314°E; summit elev. 1730 m
All times are local (unless otherwise noted)
Lava dome reached 35 million cubic meters; eruptions ceased in mid-May
According to Alain Bernard, the lava dome that extruded in late 2007 (BGVN 33:03) continued to increase in size until it covered much of the crater lake and it rose to overwhelm the drainage inlets. Bernard noted that dome growth had seemingly ceased by April 2008. Around that time (but at unstated date), VSI made initial estimates of the dome's dimensions as 200 m high, 400 m wide, with a volume of 35 x 106 m3.
The lake was almost gone by the middle of May 2008. The temperature of flow of waters at the end of the drainage tunnel (~ 960 m away from the dome) has been reported to be higher than in the crater lake, 66.7°C. Both phreatic and magmatic degassing was very minor. A very small amount of ash was emitted, and there were no lahars
On 12 May 2008, the eruption status was downgraded to Green, a level indicating that either no significant eruption is expected or that fewer than 100,000 people within 100 km of the volcano would be affected by activity.
Geologic Background. The relatively inconspicuous Kelud stratovolcano contains a summit crater lake that has been the source of some of Indonesia's most deadly eruptions. A cluster of summit lava domes cut by numerous craters has given the summit a very irregular profile. Satellitic cones and lava domes are also located low on the E, W, and SSW flanks. Eruptive activity has in general migrated in a clockwise direction around the summit vent complex. More than 30 eruptions have been recorded since 1000 CE. The ejection of water from the crater lake during the typically short but violent eruptions has created pyroclastic flows and lahars that have caused widespread fatalities and destruction. After more than 5,000 people were killed during an eruption in 1919, an engineering project to drain the crater lake lowered the surface by more than 50 m. The 1951 eruption deepened the crater by 70 m, leaving 50 million cubic meters of water after the damaged drainage tunnels were repaired. Following more than 200 deaths in the 1966 eruption, a new deeper tunnel was constructed, and the lake's volume before the 1990 eruption was only about 1 million cubic meters.
Information Contacts: Alain Bernard, Free University of Brussels, CP 160/02, 50, avenue F, Roosevelt, 1050 Brussels, Belgium (URL: http://www.ulb.ac.be/sciences/cvl/); Volcanological Survey of Indonesia, Center of Volcanology and Geological Hazard Mitigation, Saut Simatupang, 57, Bandung 40122, Indonesia (URL: http://vsi.esdm.go.id/).
Montagu Island (United Kingdom) — July 2008 Cite this Report
Montagu Island
United Kingdom
58.445°S, 26.374°W; summit elev. 1370 m
All times are local (unless otherwise noted)
Eruption of Mount Belinda ceased by late 2007
MODVOLC thermal alerts and a recent ASTER image indicate that the eruption of Mount Belinda, on Montagu Island, which began in 2001, has ceased. There have been no MODVOLC alerts over the volcano since September 2007 (BGVN 33:03) and a cloud-free ASTER thermal image from 19 July 2008 confirms the absence of a thermal anomaly at the summit of Mount Belinda.
The eruption, the first recorded historical activity at the volcano, began in October 2001 and probably ceased in September 2007, amounting to almost six years of persistent activity. The activity was characterized by low-level ash emission from the summit of Mount Belinda, an intra-caldera cone. At least three effusive events produced lava flows that cut into the island's ice cover. The largest effusive event, in September 2005, created a flow which traveled 3.5 km to reach the sea, creating a 500 m wide delta on the N shore. This delta remained on a July 2008 ASTER image (figure 20).
Geologic Background. The largest of the South Sandwich Islands, Montagu consists of a massive shield volcano cut by a 6-km-wide ice-filled summit caldera. The summit of the 11 x 15 km island rises about 3,000 m from the sea floor between Bristol and Saunders Islands. Around 90% of the island is ice-covered; glaciers extending to the sea typically form vertical ice cliffs. The name Mount Belinda has been applied both to the high point at the southern end of the summit caldera and to the young central cone. Mount Oceanite, an isolated peak at the SE tip of the island, was the source of lava flows exposed at Mathias Point and Allen Point. There was no record of Holocene activity until MODIS satellite data, beginning in late 2001, revealed thermal anomalies consistent with lava lake activity. Apparent plumes and single anomalous pixels were observed intermittently on AVHRR images from March 1995 to February 1998, possibly indicating earlier volcanic activity.
Information Contacts: Matt Patrick, Hawaiian Volcano Observatory (HVO), U.S. Geological Survey, PO Box 51, Hawai'i National Park, HI 96718, USA (URL: https://volcanoes.usgs.gov/observatories/hvo/); John Smellie, British Antarctic Survey, Natural Environment Research Council, High Cross, Madingly Road, Cambridge CB3 0ET, United Kingdom (URL: https://www.bas.ac.uk/).
Okmok (United States) — July 2008 Cite this Report
Okmok
United States
53.43°N, 168.13°W; summit elev. 1073 m
All times are local (unless otherwise noted)
Mid-July to mid-August 2008: abundant tremor and ash plumes to ~11 km altitude
This report discusses the important explosive eruption of Okmok (figure 3) that began on 12 July 2008 (BGVN 33:06) and summarizes the period from mid-July to mid-August 2008. Vigorous eruptions continued with many plumes over 4 km altitude and some as tall as ~ 11 km. The information in this report is mostly compiled from daily and weekly AVO postings. Remote sensing data showed vigorous eruption plumes that spread over North America; these plumes were unusually complex and well-documented in photographs by pilots, including some over Montana (USA), thousands of kilometers from the volcano. Other powerful eruptions in the region included those at Cleveland and an SO2-rich eruption from Kasatoshi. Near Okmok, cloud cover often restricted views.
On 19 July seismicity increased markedly and reached a level commonly associated with vigorous ash emissions. The seismic data was consistent with explosive ash plumes and an image (AAVHRR thermal IR (Channel 4)) indicated cloud temperatures of -50°C, suggesting an altitude of at least 9.1 km.
Satellite imagery from 20 July revealed an ash plume ~ 20 km from Okmok drifting SE at 3.7 km altitude. Nearly continuous volcanic tremor changed to tremor of a more episodic character, and the overall seismic intensity declined. Additional ash plumes observed on satellite imagery and spotted by pilots rose to altitudes of 4.6-6.1 km. On this day a photograph taken from an Alaska Airlines jet captured an impressive plume from Okmok from 11.3 km (37,000 ft) altitude (figure 4).
Aerial photographs and video footage was collected by AVO staff and others on 20 and 21 July. It confirmed the presence of multiple vigorous vents on the caldera floor.
The flights on 21 July revealed Okmok ash on the snow at Makushin volcano. During 21-22 July, ash plumes continued to be present and rose to altitudes of 6.1-9.1 km and drifted SE. Okmok's seismicity remained episodic, but well above background. On 23 July, tremor that was episodic in duration shifted to nearly continuous and grew to mid-level amplitudes. Although cloud cover obscured views of Okmok that day, previously emitted ash plumes were visible to the ESE. On 24 July, a thermal anomaly was possibly present on satellite imagery. Lahar damage to bridges and roads in Fort Glenn was evident. Around this time, the sailing vessel "Minnow" endured ashfall during a 30-minute interval. The thickness of ash deposited was not disclosed, but ash removal required five hours of cleaning.
Seismic amplitude increased on 25 July. Based on pilot reports and observations of satellite imagery, AVO reported that ash plumes rose to altitudes of 10.7-12.2 km.
On 26 July, seismicity decreased and satellite imagery indicated that ash plumes rose to altitudes of 6.1-6.7 km. Seismicity increased again on 27 July. Satellite imagery possibly indicated another thermal anomaly; a possible plume at an altitude of less than 3 km was also noted.
Two photos (figures 5 and 6) illustrate the new delta resulting from fresh ash deposits eroded and carried to the mouth of Crater Creek. The first photo was taken 27 July, the second, 2 August.
On 28 July, tremor decreased. Ash plumes at altitudes of 8.2-10.7 km drifted E and SE. Tremor shifted from nearly continuous to episodic. Later that day and on 29 July, discrete plumes containing some ash rose to altitudes of 6.1-10.7 km and drifted E to SE.
According to pilot reports and analysis of satellite imagery for 30 July, ash plumes then rose to altitudes of 4.6-6.1 km and drifted W. Seismicity alternated between periods of continuous and pulsating tremor. On 31 July, ash plume at altitudes of 9.1-9.8 km were seen on satellite images. On 31 July, reports from a fishing boat 11.3 km N indicated visibility had ceased due to ashfall. The National Weather Service issued an ashfall advisory for Umnak Island and Unalaska/Dutch Harbor that remained in effect until 2400 on 1 August.
Strong volcanic tremor on 2 August prompted AVO to raise the Volcano Alert Level and the Aviation Color Code to the highest level. Cloudy conditions prevented satellite observations. Later that day, AVO geologists in the area reported that ash-and-steam plumes rose to minimum altitude of 6.1 km. The seismicity then decreased. Next, observers in Fort Glenn on Umnak Island reported smelling sulfur and seeing a larger ash plume than earlier that day. The plume drifted ESE.
AVO scientists observed the eruption during a visit on 2 and 3 August. They saw significant ashfall accumulated in the caldera and on the upper flanks. Lahars and lahar deltas had formed in drainages from the SE to the NE flank (figure 7). Continuous ash jets escaped from three or more vents in the NE sector of the caldera.
Figure 8 shows a view of a 3 August eruption, as seen from a commercial airliner. The plume was also seen midday on 3 August (figure 9). On that day, both helicopter and ground-based observers indicated an ash plume at lower altitude along with a steam plume at higher altitude. Satellite imagery revealed ash plumes at altitudes of 9.1-10.7 km drifting SSW.
On 4 August, ashfall reported in the settlement of Nikolski (80 km SW) had accumulated to a depth of 3 mm. During 4-5 August, satellite imagery and pilot observations indicated that ash plumes rose to altitudes of 3-7.6 km and drifted SW and W.
Elevated seismicity occurred during 6-8 August, and declined on 9 August. According to satellite imagery for 9-10 August, there were steam plumes possibly containing ash rising up to 4.6 km altitude. On 11 August, steam plumes rose to less than 6.1 km altitude and drifted SE. Ash plumes that rose to around a hundred meters above the crater were reported by an observer in Nikolski. These plumes were not detected on satellite imagery due to cloud cover. On 12 August, a pilot reported an ash plume at an altitude of 4.6 km.
AVO reported that a new vent was active on 13 August. Emissions that day, possibly from multiple vents, were rich in both ash and steam. Low-level steam-and-ash plumes were visible on satellite imagery drifting SE at altitudes of 3-4.6 km. During 14-17 August satellite observations were hindered due to cloud cover; seismic levels fluctuated, possibly indicating that steam-and-ash emissions continued. During 18-19 August, ash plumes were seen on satellite imagery at altitudes of 3-4.6 km.
No thermal anomalies related to Okmok were measured by MODIS satellites during January-August 2008.
Geologic Background. The basaltic Okmok shield volcano forms the NE end of Umnak Island in the Aleutian Islands. The summit of the low, 35-km-wide volcano is cut by two overlapping 10-km-wide calderas formed during eruptions about 12,000 and 2,050 years ago when dacitic pyroclastic flows reached the coast. More than 60 tephra layers from Okmok have been found overlying the 12,000-year-old caldera-forming tephra layer. Numerous cones and lava domes are present on the flanks down to the coast, including the SE-flank Mount Tulik, which is almost 200 m higher than the caldera rim. Some of the post-caldera cones show evidence of wave-cut lake terraces; more recent cones were formed after the caldera lake, once 150 m deep, disappeared. Eruptions have been reported since 1805 from cinder cones within the caldera, where there are also hot springs and fumaroles.
Information Contacts: Alaska Volcano Observatory (AVO), a cooperative program of the U.S. Geological Survey, 4200 University Drive, Anchorage, AK 99508-4667, USA (URL: http://www.avo.alaska.edu/), the Geophysical Institute, University of Alaska, PO Box 757320, Fairbanks, AK 99775-7320, USA, and the Alaska Division of Geological and Geophysical Surveys, 794 University Ave., Suite 200, Fairbanks, AK 99709, USA.
Rincon de la Vieja (Costa Rica) — July 2008 Cite this Report
Rincon de la Vieja
Costa Rica
10.83°N, 85.324°W; summit elev. 1916 m
All times are local (unless otherwise noted)
Tremor durations from minutes to over an hour during June-April 2008
Activity at Rincón de la Vieja was last reviewed in May 2007 (BGVN 32:10), when low-level fumarolic activity was noted. During June 2007, the seismographic station 5 km to the SW of the crater registered seven low-frequency earthquakes and three low-frequency tremors. The first tremor occurred on 12 June and lasted 2 hours and eight minutes; the second and third occurred on 27 and 28 June and they lasted 37 minutes and 38 minutes, respectively.
The July earthquake activity was consistent with June; 6 low frequency quakes were recorded. Again, tremor activity occurred on 28 and 29 July, the first lasted 35 minutes and the second lasted 17 minutes. Little activity was noted during August and September, and October activity consisted only of tremors. On 23 October, the tremor lasted 37 minutes, and on 24 October it lasted 25 minutes.
No significant seismicity was recorded during the first three weeks of November. The seismic recording instrument went out of service from 22 November through December and January.
During February, 2008, 44 low-frequency earthquakes were registered in two groups; the first on 6 and 7 February and the second between 17 and 23 February.
Technical difficulties in March precluded a complete record of seismic activity; however, when recording was available, 116 low frequency earthquakes were noted.
Technical problems persisted in April, however during the first part of the month there was a low-frequency earthquake and 1.16 hours of tremor. Two deep earthquakes were also noted; the first registering M 3.5 at a depth of 11 km and the second M 2.9 at a 25 km depth.
Geologic Background. Rincón de la Vieja, the largest volcano in NW Costa Rica, is a remote volcanic complex in the Guanacaste Range. The volcano consists of an elongated, arcuate NW-SE-trending ridge constructed within the 15-km-wide early Pleistocene Guachipelín caldera, whose rim is exposed on the south side. Sometimes known as the "Colossus of Guanacaste," it has an estimated volume of 130 km3 and contains at least nine major eruptive centers. Activity has migrated to the SE, where the youngest-looking craters are located. The twin cone of Santa María volcano, the highest peak of the complex, is located at the eastern end of a smaller, 5-km-wide caldera and has a 500-m-wide crater. A Plinian eruption producing the 0.25 km3 Río Blanca tephra about 3,500 years ago was the last major magmatic eruption. All subsequent eruptions, including numerous historical eruptions possibly dating back to the 16th century, have been from the prominent active crater containing a 500-m-wide acid lake located ENE of Von Seebach crater.
Information Contacts: E. Fernández, E. Duarte, R. Van der Laat, M. Martinez, W. Sáenz, V. Barboza, Observatorio Vulcanologico Sismologica de Costa Rica-Universidad Nacional (OVSICORI-UNA), Apartado 86-3000, Heredia, Costa Rica (URL: http://www.ovsicori.una.ac.cr/).
Batu Tara (Indonesia) — July 2008 Cite this Report
Batu Tara
Indonesia
7.791°S, 123.585°E; summit elev. 633 m
All times are local (unless otherwise noted)
Frequent ash plumes continued during March-August 2008
Our last report on Batu Tara (BGVN 33:02), also known as Palau Komba, covered eruptive activity from 13 October 2007 through 12 March 2008. Satellite imagery during that period revealed near daily thermal anomalies and frequent plumes, at least some of which were ash-bearing. Ash or ash-and-steam plumes continued to be seen between 12 March and 25 August 2008 (table 1).
Table 1. Ash or ash-and-steam plume activity from Batu Tara, based on observations of satellite imagery and pilot reports. Courtesy of the Darwin Volcanic Ash Advisory Centre (VAAC).
| Date |
Plume top altitude (km) |
Drift direction(s) |
Remarks |
| 12 Mar 2008 |
2.1 |
SE |
-- |
| 13 Apr 2008 |
2.4 |
NW |
-- |
| 14 Apr 2008 |
2.4 |
NW, W |
-- |
| 20-21 Apr 2008 |
-- |
-- |
-- |
| 25-26 Apr 2008 |
-- |
-- |
-- |
| 03 May 2008 |
3 |
NW |
-- |
| 07 May 2008 |
3 |
NW |
-- |
| 11-13 May 2008 |
1.8 |
NW, W |
Thermal anomaly on 12-13 May |
| 29 May-1 Jun 2008 |
1.8-3 |
WNW, NW |
Thermal anomaly on 1 June |
| 14-15 Jun 2008 |
2.1 |
NW |
Thermal anomaly on 14 June |
| 19-22 Jun 2008 |
1.5 |
NW, W |
Thermal anomaly on 20 June |
| 28 Jun 2008 |
1.8 |
W, WNW |
-- |
| 30 Jun 2008 |
1.8 |
W, WNW |
-- |
| 01 Jul 2008 |
1.8 |
W, WNW |
-- |
| 02-05 Jul 2008 |
1.8 |
W, NW |
-- |
| 08-09 Jul 2008 |
1.8 |
W, NW |
-- |
| 09-15 Jul 2008 |
1.8 |
WNW |
Thermal anomaly on 9 July |
| 16-18 Jul 2008 |
1.8 |
W |
Thermal anomaly on 16 July |
| 24-29 Jul 2008 |
1.5-3.7 |
WSW, W, NW, N |
-- |
| 30-31 Jul 2008 |
1.5 |
W |
-- |
| 06-08 Aug 2008 |
1.5 |
W, NW |
-- |
| 10-11 Aug 2008 |
1.5 |
W, NW |
-- |
| 14-17 Aug 2008 |
1.5 |
W |
-- |
| 25 Aug 2008 |
1.1-1.5 |
W |
Also see Tristan Burley's observations in text. |
Tristram Burley, a marine geophysicist, was on the 67-m-long motor vessel MV Bergen Surveyor passing 24 km to the N of Batu Tara on 25 August (figures 3 and 4). He observed six distinct eruptions of ash plumes from the westernmost area of the summit crater during a 45-minute period. The plumes were produced periodically roughly every 7 minutes. They rose to an estimated 350-750 m above the summit and drifted W. The N side of the island, the only part visible to him, showed no visible evidence of either lava flows or pyroclastic density currents accompanying the eruption plumes.
Geologic Background. The small isolated island of Batu Tara in the Flores Sea ~50 km N of Lembata (fomerly Lomblen) Island and the main volcanic arc. A scarp on the eastern side reaches the sea, and vegetation covers the other flanks to within 50 m of the summit. This volcano is noted for its potassic leucite-bearing basanitic and tephritic rocks. The first recorded eruption, during 1847-52, produced explosions and a lava flow.
Information Contacts: Darwin Volcanic Ash Advisory Centre, Bureau of Meteorology, Commonwealth of Australia (URL: http://www.bom.gov.au/info/vaac); Tristram Burley, Benfield UCL Hazard Research Centre, Department of Earth Sciences, UCL, 136 Gower Street (Lewis Building), London, WC1E 6BT UK (URL: https://www.ucl.ac.uk/hazardcentre).