Recently Published Bulletin Reports
Agung (Indonesia) Three eruptive events reported in April, May, and December 2022
Tengger Caldera (Indonesia) Minor ash emission in December 2023; persistent weak thermal anomaly in the Bromo crater
Saunders (United Kingdom) Persistent thermal anomalies from the summit crater lava lake during February 2023-January 2024
Shishaldin (United States) New eruption with significant Strombolian explosions, ash plumes, and ashfall
Ioto (Japan) New eruption with discolored water, ejecta, and floating pumice during October-December 2023
Purace (Colombia) Gas-and-ash emission on 16 November 2023
Suwanosejima (Japan) Eruption plumes, crater incandescence, and occasional explosions during July-October 2023
Etna (Italy) Strombolian explosions, lava fountains, and lava flows during July-August 2023
Aira (Japan) Explosions, ash plumes, ash fall, and crater incandescence during July-October 2023
Nishinoshima (Japan) Gray emissions during October 2023
Kilauea (United States) Strong lava fountains, lava flows, and spatter at Halema’uma’u during January-September 2023
Tinakula (Solomon Islands) Continued lava flows and thermal activity during June through November 2023
Agung (Indonesia) — January 2024  Cite this Report
Agung
Indonesia
8.343°S, 115.508°E; summit elev. 2997 m
All times are local (unless otherwise noted)
Three eruptive events reported in April, May, and December 2022
Mount Agung, located on the E end of the island of Bali, Indonesia, rises above the SE rim of the Batur caldera. The summit area extends 1.5 km E-W, with the highest point on the W and a steep-walled 800-m-wide crater on the E. Recorded eruptions date back to the early 19th century. A large and deadly explosive and effusive eruption occurred during 1963-64, which was characterized by voluminous ashfall, pyroclastic flows, and lahars that caused extensive damage and many fatalities. More recent activity was documented during November 2017-June 2019 that consisted of multiple explosions, significant ash plumes, lava flows at the summit crater, and incandescent ejecta. This report covers activity reported during April-May 2022 and December 2022 based on data from the Darwin Volcanic Ash Advisory Center (VAAC).
Activity during 2022 was relatively low and mainly consisted of a few ash plumes during April-May and December. An ash plume on 3 April rising to 3.7 km altitude (700 m above the summit) and drifting N was reported in a Darwin VAAC notice based on a ground report, with ash seen in HIMAWARI-8 visible imagery. Another ash plume was reported at 1120 on 27 May that rose to 5.5 km altitude (2.5 m above the summit); the plume was not visible in satellite or webcam images due to weather clouds. An eruption was reported based on seismic data at 0840 on 13 December, with an estimated plume altitude of 3.7 km; however, no ash was seen using satellite imagery in clear conditions before weather clouds obscured the summit.
Geologic Background. Symmetrical Agung stratovolcano, Bali's highest and most sacred mountain, towers over the eastern end of the island. The volcano, whose name means "Paramount," rises above the SE rim of the Batur caldera, and the northern and southern flanks extend to the coast. The summit area extends 1.5 km E-W, with the high point on the W and a steep-walled 800-m-wide crater on the E. The Pawon cone is located low on the SE flank. Only a few eruptions dating back to the early 19th century have been recorded in historical time. The 1963-64 eruption, one of the largest in the 20th century, produced voluminous ashfall along with devastating pyroclastic flows and lahars that caused extensive damage and many fatalities.
Information Contacts: Darwin Volcanic Ash Advisory Centre (VAAC), Bureau of Meteorology, Northern Territory Regional Office, PO Box 40050, Casuarina, NT 0811, Australia (URL: http://www.bom.gov.au/info/vaac/).
Tengger Caldera (Indonesia) — February 2024 Cite this Report
Tengger Caldera
Indonesia
7.942°S, 112.95°E; summit elev. 2329 m
All times are local (unless otherwise noted)
Minor ash emission in December 2023; persistent weak thermal anomaly in the Bromo crater
Tengger Caldera, located at the N end of a volcanic massif in Indonesia’s East Java, consists of five overlapping stratovolcanoes. The youngest and only active cone in the 16-km-wide caldera is Bromo, which typically produces gas-and-steam plumes, occasional ash plumes and explosions, and weak thermal signals (BGVN 44:05, 47:01). This report covers activity during January 2022-December 2023, consisting of mostly white gas-and-steam emissions and persistent weak thermal anomalies. Information was provided by the Pusat Vulkanologi dan Mitigasi Bencana Geologi (PVMBG, also known as Indonesian Center for Volcanology and Geological Hazard Mitigation, CVGHM) and satellite imagery. The Alert Level remained at 2 (on a scale of 1-4), and visitors were warned to stay at least 1 km from the crater.
Activity was generally low during the reporting period, similar to that in 2021. According to almost daily images from MAGMA Indonesia (a platform developed by PVMBG), white emissions and plumes rose from 50 to 900 m above the main crater during this period (figure 24). During several days in March and June 2022, white plumes reached heights of 1-1.2 km above the crater.
After an increase in activity at 2114 on 3 February 2023, a PVMBG team that was sent to observe white emissions rising as high as 300 m during 9-12 February and heard rumbling noises. A sulfur dioxide odor was also strong near the crater and measurements indicated that levels were above the healthy (non-hazardous) threshold of 5 parts per million; differential optical absorption spectroscopy (DOAS) measurements indicated an average flux of 190 metric tons per day on 11 February. Incandescence originating from a large fumarole in the NNW part of the crater was visible at night. The team observed that vegetation on the E caldera wall was yellow and withered. The seismic network recorded continuous tremor and deep and shallow volcanic earthquakes.
According to a PVMBG press release, activity increased on 13 December 2023 with white, gray, and brown emissions rising as high as 900 m above Bromo’s crater rim and drifting in multiple directions (figure 25). The report noted that tremor was continuous and was accompanied in December by three volcanic earthquakes. Deformation data indicated inflation in December. There was no observable difference in the persistent thermal anomaly in the crater between 11 and 16 December 2023.
All clear views of the Bromo crater throughout this time, using Sentinel-2 infrared satellite images, showed a weak persistent thermal anomaly; none of the anomalies were strong enough to cause MODVOLC Thermal Alerts. A fire in the SE part of the caldera in early September 2023 resulted in a brief period of strong thermal anomalies.
Geologic Background. The 16-km-wide Tengger caldera is located at the northern end of a volcanic massif extending from Semeru volcano. The massive volcanic complex dates back to about 820,000 years ago and consists of five overlapping stratovolcanoes, each truncated by a caldera. Lava domes, pyroclastic cones, and a maar occupy the flanks of the massif. The Ngadisari caldera at the NE end of the complex formed about 150,000 years ago and is now drained through the Sapikerep valley. The most recent of the calderas is the 9 x 10 km wide Sandsea caldera at the SW end of the complex, which formed incrementally during the late Pleistocene and early Holocene. An overlapping cluster of post-caldera cones was constructed on the floor of the Sandsea caldera within the past several thousand years. The youngest of these is Bromo, one of Java's most active and most frequently visited volcanoes.
Information Contacts: Pusat Vulkanologi dan Mitigasi Bencana Geologi (PVMBG, also known as Indonesian Center for Volcanology and Geological Hazard Mitigation, CVGHM), Jalan Diponegoro 57, Bandung 40122, Indonesia (URL: http://www.vsi.esdm.go.id/); MAGMA Indonesia, Kementerian Energi dan Sumber Daya Mineral (URL: https://magma.esdm.go.id/v1); Copernicus Browser, Copernicus Data Space Ecosystem, European Space Agency (URL: https://dataspace.copernicus.eu/browser/); Hawai'i Institute of Geophysics and Planetology (HIGP) - MODVOLC Thermal Alerts System, School of Ocean and Earth Science and Technology (SOEST), Univ. of Hawai'i, 2525 Correa Road, Honolulu, HI 96822, USA (URL: http://modis.higp.hawaii.edu/).
Saunders (United Kingdom) — February 2024 Cite this Report
Saunders
United Kingdom
57.8°S, 26.483°W; summit elev. 843 m
All times are local (unless otherwise noted)
Persistent thermal anomalies from the summit crater lava lake during February 2023-January 2024
Saunders is one of eleven islands that comprise the South Sandwich Islands in the South Atlantic. The active Mount Michael volcano has been in almost continuous eruption since November 2014 (BGVN 48:02). Recent activity has resulted in intermittent thermal anomalies and gas-and-steam emissions (BGVN 47:03, 48:02). Visits are infrequent due to its remote location, and cloud cover often prevents satellite observations. Satellite thermal imagery and visual observation of incandescence during a research expedition in 2019 (BGVN 28:02 and 44:08) and a finding confirmed by a National Geographic Society research team that summited Michael in November 2022 reported the presence of a lava lake.
Although nearly constant cloud cover during February 2023 through January 2024 greatly limited satellite observations, thermal anomalies from the lava lake in the summit crater were detected on clear days, especially around 20-23 August 2023. Anomalies similar to previous years (eg. BGVN 48:02) were seen in both MIROVA (Middle InfraRed Observation of Volcanic Activity) data from MODIS instruments and in Sentinel 2 infrared imagery. The only notable sulfur dioxide plume detected near Saunders was on 25 September 2023, with the TROPOMI instrument aboard the Sentinel-5P satellite.
Geologic Background. Saunders Island consists of a large central volcanic edifice intersected by two seamount chains, as shown by bathymetric mapping (Leat et al., 2013). The young Mount Michael stratovolcano dominates the glacier-covered island, while two submarine plateaus, Harpers Bank and Saunders Bank, extend north. The symmetrical Michael has a 500-m-wide summit crater and a remnant of a somma rim to the SE. Tephra layers visible in ice cliffs surrounding the island are evidence of recent eruptions. Ash clouds were reported from the summit crater in 1819, and an effusive eruption was inferred to have occurred from a N-flank fissure around the end of the 19th century and beginning of the 20th century. A low ice-free lava platform, Blackstone Plain, is located on the north coast, surrounding a group of former sea stacks. A cluster of cones on the SE flank, the Ashen Hills, appear to have been modified since 1820 (LeMasurier and Thomson, 1990). Analysis of satellite imagery available since 1989 (Gray et al., 2019; MODVOLC) suggests frequent eruptive activity (when weather conditions allow), volcanic clouds, steam plumes, and thermal anomalies indicative of a persistent, or at least frequently active, lava lake in the summit crater. Due to this observational bias, there has been a presumption when defining eruptive periods that activity has been ongoing unless there is no evidence for at least 10 months.
Information Contacts: MIROVA (Middle InfraRed Observation of Volcanic Activity), a collaborative project between the Universities of Turin and Florence (Italy) supported by the Centre for Volcanic Risk of the Italian Civil Protection Department (URL: http://www.mirovaweb.it/); NASA Global Sulfur Dioxide Monitoring Page, Atmospheric Chemistry and Dynamics Laboratory, NASA Goddard Space Flight Center (NASA/GSFC), 8800 Greenbelt Road, Goddard MD 20771, USA (URL: https://so2.gsfc.nasa.gov/); Copernicus Browser (URL: https://dataspace.copernicus.eu/browser).
Shishaldin (United States) — December 2023 Cite this Report
Shishaldin
United States
54.756°N, 163.97°W; summit elev. 2857 m
All times are local (unless otherwise noted)
New eruption with significant Strombolian explosions, ash plumes, and ashfall
Shishaldin is located on the eastern half of Unimak Island, one of the Aleutian Islands. Frequent explosive activity, primarily consisting of Strombolian ash eruptions from the small summit crater, but sometimes producing lava flows, has been recorded since the 18th century. The previous eruption ended in May 2020 and was characterized by intermittent thermal activity, increased seismicity and surface temperatures, ash plumes, and ash deposits (BGVN 45:06). This report covers a new eruption during July through November 2023, which consisted of significant explosions, ash plumes, ashfall, and lava fountaining. Information comes from daily, weekly, and special reports from the Alaska Volcano Observatory (AVO) and various satellite data. AVO monitors the volcano using local seismic and infrasound sensors, satellite data, web cameras, and remote infrasound and lightning networks.
AVO reported that intermittent tremor and low-frequency earthquakes had gradually become more regular and consistent during 10-13 July. Strongly elevated surface temperatures at the summit were identified in satellite images during 10-13 July. On 11 July AVO raised the Aviation Color Code (ACC) to Yellow (the second color on a four-color scale) and Volcano Alert Level (VAL) to Advisory (the second level on a four-level scale) at 1439. Later in the day on 11 July summit crater incandescence was observed in webcam images. Observations of the summit suggested that lava was likely present at the crater, which prompted AVO to raise the ACC to Orange (the second highest color on a four-color scale) and the VAL to Watch (the second highest level on a four-level scale). The US Coast Guard conducted an overflight on 12 July and confirmed that lava was erupting from the summit. That same day, sulfur dioxide emissions were detected in satellite images.
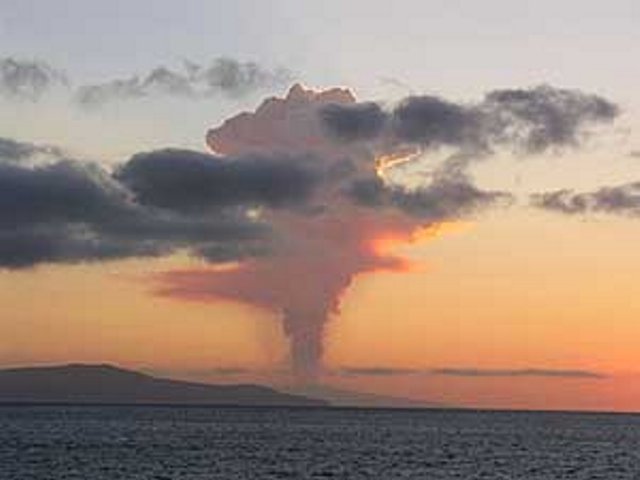
A significant explosion began at 0109 on 14 July that produced an ash plume that rose to 9-12 km altitude and drifted S over the Pacific Ocean (figure 43). Webcam images and photos taken around 0700 from a ship SW off Unimak Island showed small lahar deposits, which were the result of the interaction of hot pyroclastic material and snow and ice on the flanks. There was also ashfall on the SW and N flanks. A smaller explosion at 0710 generated an ash plume that rose to 4.5 km altitude. Webcam images and pilot reports showed continued low-level ash emissions during the morning, rising to less than 4.6 km altitude; those emissions included a small ash plume near the summit around 1030 resulting from a small explosion.
Seismic tremor amplitude began increasing at around 1700 on 15 July; strongly elevated surface temperatures were also reported. An ash plume rose to 4.6 km altitude and drifted SSE at 2100, based on a satellite image. A continuous ash plume during 2150 through 2330 rose to 5 km altitude and extended 125 km S. At 2357 AVO raised the ACC to Red (the highest color on a four-color scale) and the VAL to Warning (the highest level on a four-level scale), noting that seismicity remained elevated for more than six hours and explosion signals were frequently detected by regional infrasound (pressure sensor) networks. Explosions generated an ash plume that rose to 4.9 km altitude and drifted as far as 500 km SE. Activity throughout the night declined and by 0735 the ACC was lowered to Orange and the VAL to Watch. High-resolution satellite images taken on 16 July showed pyroclastic deposits extending as far as 3 km from the vent; these deposits generated lahars that extended further down the drainages on the flanks. Ash deposits were mainly observed on the SSE flank and extended to the shore of Unimak Island. During 16-17 July lava continued to erupt at the summit, which caused strongly elevated surface temperatures that were visible in satellite imagery.
Lava effusion increased at 0100 on 18 July, as noted in elevated surface temperatures identified in satellite data, increasing seismic tremor, and activity detected on regional infrasound arrays. A significant ash plume at 0700 rose to 7 km altitude and continued until 0830, eventually reaching 9.1 km altitude and drifting SSE (figure 44). As a result, the ACC was raised to Red and the VAL to Warning. By 0930 the main plume detached, but residual low-level ash emissions continued for several hours, remaining below 3 km altitude and drifting S. The eruption gradually declined and by 1208 the ACC was lowered to Orange and the VAL was lowered to Watch. High-resolution satellite images showed ash deposits on the SW flank and pyroclastic deposits on the N, E, and S flanks, extending as far as 3 km from the vent; lahars triggered by the eruption extended farther down the flanks (figure 45). Lava continued to erupt from the summit crater on 19 July.
Elevated surface temperatures were detected in satellite images during 19-25 July, despite occasional weather cloud cover, which was consistent with increased lava effusion. During 22-23 July satellite observations acquired after the eruption from 18 July showed pyroclastic flow and lahar deposits extending as far as 3 km down the N, NW, and NE flanks and as far as 1.5 km down the S and SE flanks. Ash deposits covered the SW and NE flanks. No lava flows were observed outside the crater. On 22 July a sulfur dioxide plume was detected in satellite data midday that had an estimated mass of 10 kt. In a special notice issued at 1653 on 22 July AVO noted that eruptive activity had intensified over the previous six hours, which was characterized by an hours-long steady increase in seismic tremor, intermittent infrasound signals consistent with small explosions, and an increase in surface temperatures that were visible in satellite data. Pilots first reported low-level ash plumes at around 1900. At 2320 an ash plume had risen to 9 km altitude based on additional pilot reports and satellite images. The ACC was increased to Red and the VAL to Warning at 2343. Satellite images indicated growth of a significantly higher ash plume that rose to 11 km altitude continued until 0030 and drifted NE. During the early morning hours of 23 July ash plumes had declined to 4.6 k altitude. Seismic tremor peaked at 0030 on 23 July and began to rapidly decline at 0109; active ash emissions were no longer visible in satellite data by 0130. The ACC was lowered to Orange and the VAL to Watch at 0418; bursts of increased seismicity were recorded throughout the morning, but seismicity generally remained at low levels. Elevated surface temperatures were visible in satellite data until about 0600. On 24 July pilots reported seeing vigorous gas-and-steam plumes rising to about 3 km altitude; the plumes may have contained minor amounts of ash.
During 24-25 July low level seismicity and volcanic tremor were detected at low levels following the previous explosion on 23 July. Strongly elevated surface temperatures were observed at the summit crater in satellite data. Around 2200 on 25 July seismicity began to increase, followed by infrasound signals of explosions after 0200 on 26 July. An ash plume rose to 3 km altitude at 0500 and drifted ENE, along with an associated sulfur dioxide plume that drifted NE and had an estimated mass of 22 kt. Diffuse ash emissions were visible in satellite data and rose to 6.1-7.6 km altitude and extended 125 km from the volcano starting around 1130. These ash events were preceded by about seven hours of seismic tremor, infrasound detections of explosions, and five hours of increased surface temperatures visible in satellite data. Activity began to decline around 1327, which included low-frequency earthquakes and decreased volcanic tremor, and infrasound data no longer detected significant explosions. Surface temperatures remained elevated through the end of the month.
Seismicity, volcanic tremor, and ash emissions remained at low levels during early August. Satellite images on 1 August showed that some slumping had occurred on the E crater wall due to the recent explosive activity. Elevated surface temperatures continued, which was consistent with cooling lava. On 2 August small explosive events were detected, consistent with low-level Strombolian activity. Some episodes of volcanic tremor were reported, which reflected low-level ash emissions. Those ash emissions rose to less than 3 km altitude and drifted as far as 92.6 km N. Pilots that were located N of the volcano observed an ash plume that rose to 2.7 km altitude. Seismicity began to increase in intensity around 0900 on 3 August. Seismicity continued to increase throughout the day and through the night with strongly elevated surface temperatures, which suggested that lava was active at the surface.
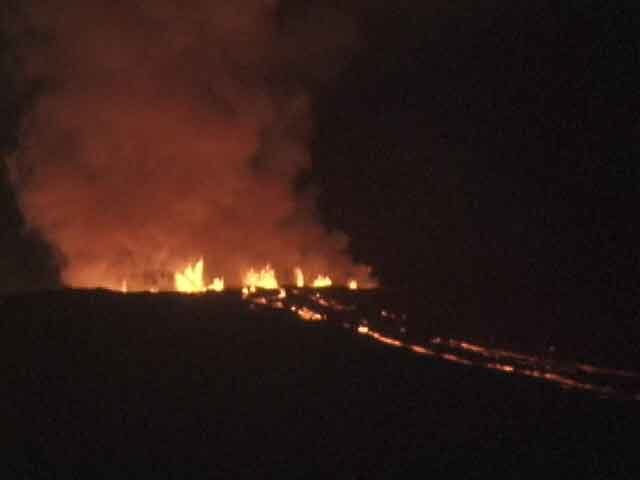
An ash cloud that rose to 7.6-7.9 km altitude and drifted 60-75 km NE was visible in a satellite image at 0520 on 4 August. Pilots saw and reported the plume at 0836 (figure 46). By 0900 the plume had risen to 9.1 km altitude and extended over 100 km NE. AVO raised the ACC to Red and the VAL to Warning as a result. Seismic tremor levels peaked at 1400 and then sharply declined at 1500 to slightly elevated levels; the plume was sustained during the period of high tremor and drifted N and NE. The ACC was lowered to Orange and the VAL to Watch at 2055. During 5-14 August seismicity remained low and surface temperatures were elevated based on satellite data due to cooling lava. On 9 August a small lava flow was observed that extended from the crater rim to the upper NE flank. It had advanced to 55 m in length and appeared in satellite imagery on 11 August. Occasional gas-and-steam plumes were noted in webcam images. At 1827 AVO noted that seismic tremor had steadily increased during the afternoon and erupting lava was visible at the summit in satellite images.
Strong explosion signals were detected at 0200 on 15 August. An ash cloud that was visible in satellite data extended 100 km NE and may have risen as high as 11 km altitude around 0240. By 0335 satellite images showed the ash cloud rising to 7.6 km altitude and drifting NE. Significant seismicity and explosions were detected by the local AVO seismic and infrasound networks, and volcanic lightning was detected by the World Wide Lightning Location Network (WWLLN). A sulfur dioxide plume associated with the eruption drifted over the S Bering Sea and parts of Alaska and western Canada. Seismicity was significantly elevated during the eruption but had declined by 1322. A pilot reported that ash emissions continued, rising as high as 4.9 km altitude. Elevated surface temperatures detected in satellite data were caused by hot, eruptive material (pyroclastic debris and lava) that accumulated around the summit. Eruptive activity declined by 16 August and the associated sulfur dioxide plume had mostly dissipated; remnants continued to be identified in satellite images at least through 18 August. Surface temperatures remained elevated based on satellite images, indicating hot material on the upper parts of the volcano. Small explosions were detected in infrasound data on the morning of 19 August and were consistent with pilot reports of small, short-lived ash plumes that rose to about 4.3 km altitude. Low-level explosive activity was reported during 20-24 August, according to seismic and infrasound data, and weather clouds sometimes prevented views. Elevated surface temperatures were observed in satellite images, which indicated continued hot material on the upper parts of the volcano.
Seismic tremor began to increase at around 0300 on 25 August and was followed by elevated surface temperatures identified in satellite images, consistent with erupting lava. Small explosions were recorded in infrasound data. The ACC was raised to Red and the VAL to Warning at 1204 after a pilot reported an ash plume that rose to 9.1 km altitude. Seismicity peaked at 1630 and began to rapidly decline at around 1730. Ash plumes rose as high as 10 km altitude and drifted as far as 400 km NE. By 2020 the ash plumes had declined to 6.4 km altitude and continued to drift NE. Ash emissions were visible in satellite data until 0000 on 26 August and seismicity was at low levels. AVO lowered the ACC to Orange and the VAL to Watch at 0030. Minor explosive activity within the summit crater was detected during 26-28 August and strongly elevated surface temperatures were still visible in satellite imagery through the rest of the month. An AVO field crew working on Unimak Island observed a mass flow that descended the upper flanks beginning around 1720 on 27 August. The flow produced a short-lived ash cloud that rose to 4.5 km altitude and rapidly dissipated. The mass flow was likely caused by the collapse of spatter that accumulated on the summit crater rim.
Similar variable explosive activity was reported in September, although weather observations sometimes prevented observations. A moderate resolution satellite image from the afternoon of 1 September showed gas-and-steam emissions filling the summit crater and obscuring views of the vent. In addition, hot deposits from the previous 25-26 August explosive event were visible on the NE flank near the summit, based on a 1 September satellite image. On 2 and 4 September seismic and infrasound data showed signals of small, repetitive explosions. Variable gas-and-steam emissions from the summit were visible but there was no evidence of ash. Possible summit crater incandescence was visible in nighttime webcam images during 3-4 September.
Seismicity began to gradually increase at around 0300 on 5 September and activity escalated at around 0830. A pilot reported an ash plume that rose to 7.6 km altitude at 0842 and continued to rise as high as possibly 9.7 km altitude and drifted SSE based on satellite images (figure 47). The ACC was raised to Red and the VAL to Warning at 0900. In addition to strong tremor and sustained explosions, the eruption produced volcanic lightning that was detected by the WWLLN. Around 1100 seismicity decreased and satellite data confirmed that the altitude of the ash emissions had declined to 7.6 km altitude. By 1200 the lower-altitude portion of the ash plume had drifted 125 km E. Significant ash emissions ended by 1330 based on webcam images. The ACC was lowered to Orange and the VAL to Watch at 1440. Satellite images showed extensive pyroclastic debris flows on most of the flanks that extended 1.2-3.3 km from the crater rim.
During 6-13 September elevated surface temperatures continued to be observed in satellite data, seismicity remained elevated with weak but steady tremor, and small, low-frequency earthquakes and small explosions were reported, except on 12 September. On 6 September a low-level ash plume rose to 1.5-1.8 km altitude and drifted SSE. Occasional small and diffuse gas-and-steam emissions at the summit were visible in webcam images. Around 1800 on 13 September seismic tremor amplitudes began to increase, and small explosions were detected in seismic and infrasound data. Incandescent lava at the summit was seen in a webcam image taken at 0134 on 14 September during a period of elevated tremor. No ash emissions were reported during the period of elevated seismicity. Lava fountaining began around 0200, based on webcam images. Satellite-based radar observations showed that the lava fountaining activity led to the growth of a cone in the summit crater, which refilled most of the crater. By 0730 seismicity significantly declined and remained at low levels.
Seismic tremor began to increase around 0900 on 15 September and rapidly intensified. An explosive eruption began at around 1710, which prompted AVO to raise the ACC to Red and the VAL to Warning. Within about 30 minutes ash plumes drifted E below a weather cloud at 8.2 km altitude. The National Weather Service estimated that an ash-rich plume rose as high as 12.8 km altitude and produced volcanic lightning. The upper part of the ash plume detached from the vent around 1830 and drifted E, and was observed over the Gulf of Alaska. Around the same time, seismicity dramatically decreased. Trace ashfall was reported in the community of False Pass (38 km ENE) between 1800-2030 and also in King Cove and nearby marine waters. Activity declined at around 1830 although seismicity remained elevated, ash emissions, and ashfall continued until 2100. Lightning was again detected beginning around 1930, which suggested that ash emissions continued. Ongoing explosions were detected in infrasound data, at a lower level than during the most energetic phase of this event. Lightning was last detected at 2048. By 2124 the intensity of the eruption had decreased, and ash emissions were likely rising to less than 6.7 km altitude. Seismicity returned to pre-eruption levels. On 16 September the ACC was lowered to Orange and the VAL to Watch at 1244; the sulfur dioxide plume that was emitted from the previous eruption event was still visible over the northern Pacific Ocean. Elevated surface temperatures, gas-and-steam emissions from the vent, and new, small lahars were reported on the upper flanks based on satellite and webcam images. Minor deposits were reported on the flanks which were likely the result of collapse of previously accumulated lava near the summit crater.
Elevated seismicity with tremor, small earthquakes, and elevated surface temperatures were detected during 17-23 September. Minor gas-and-steam emissions were visible in webcam images. On 20 September small volcanic debris flows were reported on the upper flanks. On 21 September a small ash deposit was observed on the upper flanks extending to the NE based on webcam images. Seismic tremor increased significantly during 22-23 September. Regional infrasound sensors suggested that low-level eruptive activity was occurring within the summit crater by around 1800 on 23 September. Even though seismicity was at high levels, strongly elevated surface temperatures indicating lava at the surface were absent and no ash emissions were detected; weather clouds at 0.6-4.6 km altitude obscured views. At 0025 on 24 September AVO noted that seismicity continued at high levels and nearly continuous small infrasound signals began, likely from low-level eruptive activity. Strongly elevated surface temperatures were identified in satellite images by 0900 and persisted throughout the day; the higher temperatures along with infrasound and seismic data were consistent with lava erupting at the summit. Around 1700 similarly elevated surface temperatures were detected from the summit in satellite data, which suggested that more vigorous lava fountaining had started. Starting around 1800 low-level ash emissions rose to altitudes less than 4.6 km altitude and quickly dissipated.
Beginning at midnight on 25 September, a series of seismic signals consistent with volcanic flows were recorded on the N side of the volcano. A change in seismicity and infrasound signals occurred around 0535 and at 0540 a significant ash cloud formed and quickly reached 14 km altitude and drifted E along the Alaska Peninsula. The cloud generated at least 150 lightning strokes with thunder that could be heard by people in False Pass. Seismicity rapidly declined to near background levels around 0600. AVO increased the ACC to Red and the VAL to Warning at 0602. The ash cloud detached from the volcano at around 0700, rose to 11.6 km altitude, and drifted ESE. Trace to minor amounts of ashfall were reported by the communities of False Pass, King Cove, Cold Bay, and Sand Point around 0700. Ash emissions continued at lower altitudes of 6-7.6 km altitude at 0820. Small explosions at the vent area continued to be detected in infrasound data and likely represented low-level eruptive activity near the vent. Due to the significant decrease in seismicity and ash emissions the ACC was lowered to Orange and the VAL to Watch at 1234. Radar data showed significant collapses of the crater that occurred on 25 September. Satellite data also showed significant hot, degassing pyroclastic and lahar deposits on all flanks, including more extensive flows on the ENE and WSW sections below two new collapse scarps. Following the significant activity during 24-25 September, only low-level activity was observed. Seismicity decreased notably near the end of the strong activity on 25 September and continued to decrease through the end of the month, though tremor and small earthquakes were still reported. No explosive activity was detected in infrasound data through 2 October. Gas-and-steam emissions rose to 3.7 km altitude, as reported by pilots and seen in satellite images. Satellite data from 26 September showed that significant collapses had occurred at the summit crater and hot, steaming deposits from pyroclastic flows and lahars were present on all the flanks, particularly to the ENE and WSW. A small ash cloud was visible in webcam images on 27 September, likely from a collapse at the summit cone. High elevated surface temperatures were observed in satellite imagery during 27-28 September, which were likely the result of hot deposits on the flanks erupted on 25 September. Minor steaming at the summit crater and from an area on the upper flanks was visible in webcam images on 28 September.
During October, explosion events continued between periods of low activity. Seismicity significantly increased starting at around 2100 on 2 October; around the same time satellite images showed an increase in surface temperatures consistent with lava fountaining. Small, hot avalanches of rock and lava descended an unspecified flank. In addition, a distinct increase in infrasound, seismicity, and lightning detections was followed by an ash plume that rose to 12.2 km altitude and drifted S and E at 0520 on 3 October, based on satellite images. Nighttime webcam images showed incandescence due to lava fountaining at the summit and pyroclastic flows descending the NE flank. AVO reported that a notable explosive eruption started at 0547 and lasted until 0900 on 3 October, which prompted a rise in the ACC to Red and the VAL to Warning. Subsequent ash plumes rose to 6-7.6 km altitude by 0931. At 1036 the ACC was lowered back to Orange and the VAL to Watch since both seismic and infrasound data quieted substantially and were slightly above background levels. Gas-and-steam emissions were observed at the summit, based on webcam images. Trace amounts of ashfall were observed in Cold Bay. Resuspended ash was present at several kilometers altitude near the volcano. During the afternoon, low-level ash plumes were visible at the flanks, which appeared to be largely generated by rock avalanches off the summit crater following the explosive activity. These ash plumes rose to 3 km altitude and drifted W. Trace amounts of ashfall were reported by observers in Cold Bay and Unalaska and flights to these communities were disrupted by the ash cloud. Satellite images taken after the eruption showed evidence of pyroclastic flows and lahar deposits in drainages 2 km down the SW flank and about 3.2 km down the NE flank, and continued erosion of the crater rim. Small explosion craters at the end of the pyroclastic flows on the NE flank were noted for the first time, which may have resulted from gas-and-steam explosions when hot deposits interact with underlying ice.
During 4 October seismicity, including frequent small earthquakes, remained elevated, but was gradually declining. Ash plumes were produced for over eight hours until around 1400 that rose to below 3.7 km altitude. These ash plumes were primarily generated off the sides of the volcano where hot rock avalanches from the crater rim had entered drainages to the SW and NE. Two explosion craters were observed at the base of the NE deposits about 3.2 km from the crater rim. Webcam images showed the explosion craters were a source of persistent ash emissions; occasional collapse events also generated ash. Seismicity remained elevated with sulfur dioxide emissions that had a daily average of more than 1,000 tons per day, and frequent small earthquakes through the end of the month. Frequent elevated surface temperatures were identified in satellite images and gas-and-steam plumes were observed in webcam images, although weather conditions occasionally prevented clear views of the summit. Emissions were robust during 14-16 October and were likely generated by the interaction of hot material and snow and ice. During the afternoon of 21 October a strong gas-and-steam plume rose to 3-4.6 km altitude and extended 40 km WSW, based on satellite images and reports from pilots. On 31 October the ACC was lowered to Yellow and the VAL was lowered to Advisory.
Activity in November was characterized by elevated seismicity with ongoing seismic tremor and small, low-frequency earthquakes, elevated surface temperatures, and gas-and-steam emissions. There was an increase in seismic and infrasound tremor amplitudes starting at 1940 on 2 November. As a result, the ACC was again raised to Orange and the VAL was increased to Watch, although ash was not identified in satellite data. An ash cloud rose to 6.1 km altitude and drifted W according to satellite data at 2000. By 0831 on 3 November ash emissions were no longer visible in satellite images. On 6 and 9 November air pressure sensors detected signals consistent with small explosions. Small explosions were detected in infrasound data consistent with weak Strombolian activity on 19 and 21 November. Seismicity started to decrease on 21 November. On 25 November gas-and-steam emissions were emitted from the vent as well as from a scarp on the NE side of the volcano near the summit. A gas-and-steam plume extended about 50 km SSE and was observed in satellite and webcam images on 26 November. On 28 November small explosions were observed in seismic and local infrasound data and gas-and-steam emissions were visible from the summit and from the upper NE collapse scarp based on webcam images. Possible small explosions were observed in infrasound data on 30 November. Weakly elevated surface temperatures and a persistent gas-and-steam plume from the summit and collapse scarps on the upper flanks. A passing aircraft reported the gas-and-steam plume rose to 3-3.4 km altitude on 30 November, but no significant ash emissions were detected.
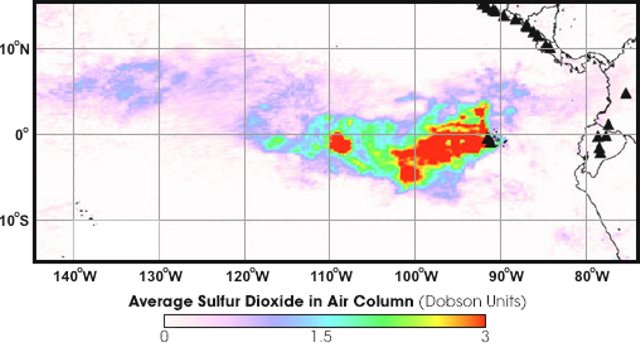
Satellite data. MODIS thermal anomaly data provided through MIROVA (Middle InfraRed Observation of Volcanic Activity) showed a strong pulse of thermal activity beginning in July 2023 that continued through November 2023 (figure 48). This strong activity was due to Strombolian explosions and lava fountaining events at the summit crater. According to data from MODVOLC thermal alerts, a total of 101 hotspots were detected near the summit crater in July (11-14, 16-19, 23-24 and 26), August (4, 25-26, and 29), September (5, 12, and 17), and October (3, 4, and 8). Infrared satellite data showed large lava flows descending primarily the northern and SE flanks during the reporting period (figure 49). Sulfur dioxide plumes often exceeded two Dobson Units (DUs) and drifted in different directions throughout the reporting period, based on satellite data from the TROPOMI instrument on the Sentinel-5P satellite (figure 50).
Geologic Background. The symmetrical glacier-covered Shishaldin in the Aleutian Islands is the westernmost of three large stratovolcanoes in the eastern half of Unimak Island. The Aleuts named the volcano Sisquk, meaning "mountain which points the way when I am lost." Constructed atop an older glacially dissected edifice, it is largely basaltic in composition. Remnants of an older edifice are exposed on the W and NE sides at 1,500-1,800 m elevation. There are over two dozen pyroclastic cones on its NW flank, which is covered by massive aa lava flows. Frequent explosive activity, primarily consisting of Strombolian ash eruptions from the small summit crater, but sometimes producing lava flows, has been recorded since the 18th century. A steam plume often rises from the summit crater.
Information Contacts: Alaska Volcano Observatory (AVO), a cooperative program of a) U.S. Geological Survey, 4200 University Drive, Anchorage, AK 99508-4667 USA (URL: https://avo.alaska.edu/), b) Geophysical Institute, University of Alaska, PO Box 757320, Fairbanks, AK 99775-7320, USA, and c) Alaska Division of Geological & Geophysical Surveys, 794 University Ave., Suite 200, Fairbanks, AK 99709, USA (URL: http://dggs.alaska.gov/); MIROVA (Middle InfraRed Observation of Volcanic Activity), a collaborative project between the Universities of Turin and Florence (Italy) supported by the Centre for Volcanic Risk of the Italian Civil Protection Department (URL: http://www.mirovaweb.it/); Hawai'i Institute of Geophysics and Planetology (HIGP) - MODVOLC Thermal Alerts System, School of Ocean and Earth Science and Technology (SOEST), Univ. of Hawai'i, 2525 Correa Road, Honolulu, HI 96822, USA (URL: http://modis.higp.hawaii.edu/); NASA Global Sulfur Dioxide Monitoring Page, Atmospheric Chemistry and Dynamics Laboratory, NASA Goddard Space Flight Center (NASA/GSFC), 8800 Greenbelt Road, Goddard, Maryland, USA (URL: https://so2.gsfc.nasa.gov/); Copernicus Browser, Copernicus Data Space Ecosystem, European Space Agency (URL: https://dataspace.copernicus.eu/browser/).
Ioto
Japan
24.751°N, 141.289°E; summit elev. 169 m
All times are local (unless otherwise noted)
New eruption with discolored water, ejecta, and floating pumice during October-December 2023
Ioto (Iwo-jima), located about 1,200 km S of Tokyo, lies within a 9-km-wide submarine caldera along the Izu-Bonin-Mariana volcanic arc. Previous eruptions date back to 1889 and have consisted of dominantly phreatic explosions, pumice deposits during 2001, and discolored water. A submarine eruption during July through December 2022 was characterized by discolored water, pumice deposits, and gas emissions (BGVN 48:01). This report covers a new eruption during October through December 2023, which consisted of explosions, black ejecta, discolored water, and floating pumice, based on information from the Japan Meteorological Association (JMA), the Japan Coast Guard (JCG), and satellite data.
JMA reported that an eruption had been occurring offshore of Okinahama on the SE side of the island since 21 October, which was characterized by volcanic tremor, according to the Japan Maritime Self-Defense Force (JMSDF) Iwo Jima Air Base (figure 22). According to an 18 October satellite image a plume of discolored water at the site of this new eruption extended NE (figure 23). During an overflight conducted on 30 October, a vent was identified about 1 km off the coast of Okinahama. Observers recorded explosions every few minutes that ejected dark material about 20 m above the ocean and as high as 150 m. Ejecta from the vent formed a black-colored island about 100 m in diameter, according to observations conducted from the air by the Earthquake Research Institute of the University of Tokyo in cooperation with the Mainichi newspaper (figure 24). Occasionally, large boulders measuring more than several meters in size were also ejected. Observations from the Advanced Land Observing Satellite Daichi-2 and Sentinel-2 satellite images also confirmed the formation of this island (figure 23). Brown discolored water and floating pumice were present surrounding the island.
The eruption continued during November. During an overflight on 3 November observers photographed the island and noted that material was ejected 169 m high, according to a news source. Explosions gradually became shorter, and, by the 3rd, they occurred every few seconds; dark and incandescent material were ejected about 800 m above the vent. On 4 November eruptions were accompanied by explosive sounds. Floating, brown-colored pumice was present in the water surrounding the island. There was a brief increase in the number of volcanic earthquakes during 8-14 November and 24-25 November. The eruption temporarily paused during 9-11 November and by 12 November eruptions resumed to the W of the island. On 10 November dark brown-to-dark yellow-green discolored water and a small amount of black floating material was observed (figure 25). A small eruption was reported on 18 November off the NE coast of the island, accompanied by white gas-and-steam plumes (figure 23). Another pause was recorded during 17-19 November, which then resumed on 20 November and continued erupting intermittently. According to a field survey conducted by the National Institute for Disaster Prevention Science and Technology on 19 November, a 30-m diameter crater was visible on the NE coast where landslides, hot water, and gray volcanic ash containing clay have occurred and been distributed previously. Erupted blocks about 10 cm in diameter were distributed about 90-120 m from the crater. JCG made observations during an overflight on 23 November and reported a phreatomagmatic eruption. Explosions at the main vent generated dark gas-and-ash plumes that rose to 200 m altitude and ejected large blocks that landed on the island and in the ocean (figure 26). Discolored water also surrounded the island. The size of the new island had grown to 450 m N-S x 200 m E-W by 23 November, according to JCG.
The eruption continued through 11 December, followed by a brief pause in activity, which then resumed on 31 December, according to JMA. Intermittent explosions produced 100-m-high black plumes at intervals of several minutes to 30 minutes during 1-10 December. Overflights were conducted on 4 and 15 December and reported that the water surrounding the new island was discolored to dark brown-to-dark yellow-green (figure 27). No floating material was reported during this time. In comparison to the observations made on 23 November, the new land had extended N and part of it had eroded away. In addition, analysis by the Geospatial Information Authority of Japan using SAR data from Daichi-2 also confirmed that the area of the new island continued to decrease between 4 and 15 December. Ejected material combined with wave erosion transformed the island into a “J” shape, 500-m-long and with the curved part about 200 m offshore of Ioto. The island was covered with brown ash and blocks, and the surrounding water was discolored to greenish-brown and contained an area of floating pumice. JCG reported from an overflight on 4 December that volcanic ash-like material found around the S vent on the NE part of the island was newly deposited since 10 November (figure 28). By 15 December the N part of the “J” shaped island had separated and migrated N, connecting to the Okinahama coast and the curved part of the “J” had eroded into two smaller islands (figure 27).
References. Ukawa, M., Fujita, E., Kobayashi, T., 2002, Recent volcanic activity of Iwo Jima and the 2001 eruption, Monthly Chikyu, Extra No. 39, 157-164.
Geologic Background. Ioto, in the Volcano Islands of Japan, lies within a 9-km-wide submarine caldera. The volcano is also known as Ogasawara-Iojima to distinguish it from several other "Sulfur Island" volcanoes in Japan. The triangular, low-elevation, 8-km-long island narrows toward its SW tip and has produced trachyandesitic and trachytic rocks that are more alkalic than those of other volcanoes in this arc. The island has undergone uplift for at least the past 700 years, accompanying resurgent doming of the caldera; a shoreline landed upon by Captain Cook's surveying crew in 1779 is now 40 m above sea level. The Motoyama plateau on the NE half of the island consists of submarine tuffs overlain by coral deposits and forms the island's high point. Many fumaroles are oriented along a NE-SW zone cutting through Motoyama. Numerous recorded phreatic eruptions, many from vents on the W and NW sides of the island, have accompanied the uplift.
Information Contacts: Japan Meteorological Agency (JMA), 1-3-4 Otemachi, Chiyoda-ku, Tokyo 100-8122, Japan (URL: http://www.jma.go.jp/jma/indexe.html); Japan Coast Guard (JCG) Volcano Database, Hydrographic and Oceanographic Department, 3-1-1, Kasumigaseki, Chiyoda-ku, Tokyo 100-8932, Japan (URL: https://www1.kaiho.mlit.go.jp/GIJUTSUKOKUSAI/kaiikiDB/kaiyo22-2.htm); Copernicus Browser, Copernicus Data Space Ecosystem, European Space Agency (URL: https://dataspace.copernicus.eu/browser/); Asahi, 5-3-2, Tsukiji, Chuo Ward, Tokyo, 104-8011, Japan (URL: https://www.asahi.com/ajw/articles/15048458).
Purace (Colombia) — December 2023 Cite this Report
Purace
Colombia
2.3095°N, 76.3948°W; summit elev. 4650 m
All times are local (unless otherwise noted)
Gas-and-ash emission on 16 November 2023
Puracé, located in Colombia, is a stratovolcano that contains a 500-m-wide summit crater. It is part of the Los Coconucos volcanic chain that is a NW-SE trending group of seven cones and craters. The most recent eruption occurred during March 2022 that was characterized by frequent seismicity and gas-and-steam emissions (BGVN 47:06). This report covers a brief eruption during November 2023 based on monthly reports from the Popayán Observatory, part of the Servicio Geologico Colombiano (SGC).
Activity during November 2022 through November 2023 primarily consisted of seismicity: VT-type events, LP-type events, HB-type events, and TR-type events (table 4). Maximum sulfur dioxide values were measured weekly and ranged from 259-5,854 tons per day (t/d) during November 2022 through April 2023. White gas-and-steam emissions were also occasionally reported.
SGC issued a report on 25 October that noted a significant increase in the number of earthquakes associated with rock fracturing. These earthquakes were located SE of the crater between Puracé and Piocollo at depths of 1-4 km. There were no reported variations in sulfur dioxide values, but SGC noted high carbon dioxide values, compared to those recorded in the first half of 2023.
SGC reported that at 1929 on 16 November the seismic network detected a signal that was possibly associated with a gas-and-ash emission, though it was not confirmed in webcam images due to limited visibility. On 17 November an observer confirmed ash deposits on the N flank. Webcam images showed an increase in degassing both inside the crater and from the NW flank, rising 700 m above the crater.
Table 4. Seismicity at Puracé during November 2022-November 2023. Volcano-tectonic (VT), long-period (LP), hybrid (HB), and tremor (TR) events are reported each month. Courtesy of SGC.
| Month |
Volcano-tectonic |
Long-period |
Hybrid |
Tremor |
| Nov 2022 |
429 |
2,023 |
5 |
831 |
| Dec 2022 |
423 |
1,390 |
9 |
834 |
| Jan 2023 |
719 |
1,622 |
0 |
957 |
| Feb 2023 |
598 |
1,701 |
2 |
1,124 |
| Mar 2023 |
331 |
2,408 |
147 |
607 |
| Apr 2023 |
614 |
4,427 |
33 |
148 |
| May 2023 |
620 |
3,717 |
170 |
109 |
| Jun 2023 |
467 |
3,293 |
86 |
148 |
| Jul 2023 |
1,116 |
5,809 |
183 |
542 |
| Aug 2023 |
692 |
2,927 |
94 |
321 |
| Sep 2023 |
887 |
1,505 |
82 |
848 |
| Oct 2023 |
2,373 |
2,949 |
135 |
692 |
| Nov 2023 |
1,212 |
2,302 |
69 |
293 |
Geologic Background. Puracé is an active andesitic volcano with a 600-m-diameter summit crater at the NW end of the Los Coconucos Volcanic Chain. This volcanic complex includes nine composite and five monogenetic volcanoes, extending from the Puracé crater more than 6 km SE to the summit of Pan de Azúcar stratovolcano. The dacitic massif which the complex is built on extends about 13 km NW-SE and 10 km NE-SW. Frequent small to moderate explosive eruptions reported since 1816 CE have modified the morphology of the summit crater, with the largest eruptions in 1849, 1869, and 1885.
Information Contacts: Servicio Geologico Colombiano (SGC), Diagonal 53 No. 34-53 - Bogotá D.C., Colombia (URL: https://www.sgc.gov.co/volcanes).
Suwanosejima (Japan) — December 2023 Cite this Report
Suwanosejima
Japan
29.638°N, 129.714°E; summit elev. 796 m
All times are local (unless otherwise noted)
Eruption plumes, crater incandescence, and occasional explosions during July-October 2023
Suwanosejima is an 8-km-long island that consists of a stratovolcano and two active summit craters, located in the northern Ryukyu Islands, Japan. Volcanism over the past century has been characterized by Strombolian explosions, ash plumes, and ashfall. The current eruption began in October 2004 and has more recently consisted of frequent eruption plumes, explosions, and incandescent ejecta (BGVN 48:07). This report covers similar activity of ash plumes, explosions, and crater incandescence during July through October 2023 using monthly reports from the Japan Meteorological Agency (JMA) and satellite data.
Thermal activity during the reporting period was relatively low; only one low-power thermal anomaly was detected during mid-July and one during early August, based on a MIROVA (Middle InfraRed Observation of Volcanic Activity) Log Radiative Power graph of the MODIS thermal anomaly data. On two clear weather days, a thermal anomaly was visible in infrared satellite images (figure 81).
Low-level activity was reported at the Otake crater during July and no explosions were detected. Eruption plumes rose as high as 1.8 km above the crater. On 13 July an ash plume rose 1.7 km above the crater rim, based on a webcam image. During the night of the 28th crater incandescence was visible in a webcam image. An eruptive event reported on 31 July produced an eruption plume that rose 2.1 km above the crater. Seismicity consisted of 11 volcanic earthquakes on the W flank, the number of which had decreased compared to June (28) and 68 volcanic earthquakes near the Otake crater, which had decreased from 722 in the previous month. According to observations conducted by the University of Tokyo Graduate School of Science, Kyoto University Disaster Prevention Research Institute, Toshima Village, and JMA, the amount of sulfur dioxide emissions released during the month was 400-800 tons per day (t/d).
Eruptive activity in the Otake crater continued during August and no explosions were reported. An eruptive event produced a plume that rose 1 km above the crater at 1447 on 12 August. Subsequent eruptive events were recorded at 0911 on 16 August, at 1303 on 20 August, and at 0317 on 21 August, which produced ash plumes that rose 1-1.1 km above the crater and drifted SE, SW, and W. On 22 August an ash plume was captured in a webcam image rising 1.4 km above the crater (figure 82). Multiple eruptive events were detected on 25 August at 0544, 0742, 0824, 1424, and 1704, which generated ash plumes that rose 1.1-1.2 km above the crater and drifted NE, W, and SW. On 28 August a small amount of ashfall was observed as far as 1.5 km from the crater. There were 17 volcanic earthquakes recorded on the W flank of the volcano and 79 recorded at the Otake crater during the month. The amount of sulfur dioxide emissions released during the month was 400-800 t/d.
Activity continued at the Otake crater during September. Occasionally, nighttime crater incandescence was observed in webcam images and ashfall was reported. An eruptive event at 1949 on 4 September produced an ash plume that rose 1 km above the crater and drifted SW. On 9 September several eruption events were detected at 0221, 0301, and 0333, which produced ash plumes that rose 1.1-1.4 km above the crater rim and drifted W; continuous ash emissions during 0404-0740 rose to a maximum height of 2 km above the crater rim (figure 83). More eruptive events were reported at 1437 on 10 September, at 0319 on 11 September, and at 0511 and 1228 on 15 September, which generated ash plumes that rose 1-1.8 km above the crater. During 25, 27, and 30 September, ash plumes rose as high as 1.3 km above the crater rim. JMA reported that large blocks were ejected as far as 300 m from the center of the crater. There were 18 volcanic earthquakes detected beneath the W flank and 82 volcanic earthquakes detected near the Otake crater. The amount of sulfur dioxide released during the month ranged from 600 to 1,600 t/d.
Activity during early-to-mid-October consisted of occasional explosions, a total number of 13, and ash plumes that rose as high as 1.9 km above the Otake crater rim on 29 October (figure 84). These explosions are the first to have occurred since June 2023. Continuous ash emissions were reported during 0510-0555 on 1 October. Explosions were recorded at 0304, 2141, and 2359 on 2 October, at 0112 on 3 October, and at 1326 on 6 October, which produced ash plumes that rose as high as 1 km above the crater rim and drifted SW and W. An explosion was noted at 0428 on 3 October, but emission details were unknown. A total of eight explosions were recorded by the seismic network at 1522 on 14 October, at 0337, 0433, 0555, 1008, and 1539 on 15 October, and at 0454 and 0517 on 16 October. Ash plumes from these explosions rose as high as 900 m above the crater and drifted SE. Eruptive events during 25-27 and 29-30 October generated plumes that rose as high as 1.9 km above the crater and drifted SE, S, and SW. Ash was deposited in Toshima village (3.5 km SSW). Eruptive activity occasionally ejected large volcanic blocks as far as 600 m from the crater. Nighttime crater incandescence was visible in webcams. Intermittent ashfall was reported as far as 1.5 km from the crater. There were 43 volcanic earthquakes detected on the W flank during the month, and 184 volcanic earthquakes detected near the Otake crater. The amount of sulfur dioxide emitted ranged between 400 and 900 t/d.
Geologic Background. The 8-km-long island of Suwanosejima in the northern Ryukyu Islands consists of an andesitic stratovolcano with two active summit craters. The summit is truncated by a large breached crater extending to the sea on the E flank that was formed by edifice collapse. One of Japan's most frequently active volcanoes, it was in a state of intermittent Strombolian activity from Otake, the NE summit crater, between 1949 and 1996, after which periods of inactivity lengthened. The largest recorded eruption took place in 1813-14, when thick scoria deposits covered residential areas, and the SW crater produced two lava flows that reached the western coast. At the end of the eruption the summit of Otake collapsed, forming a large debris avalanche and creating an open collapse scarp extending to the eastern coast. The island remained uninhabited for about 70 years after the 1813-1814 eruption. Lava flows reached the eastern coast of the island in 1884. Only about 50 people live on the island.
Information Contacts: Japan Meteorological Agency (JMA), 1-3-4 Otemachi, Chiyoda-ku, Tokyo 100-8122, Japan (URL: http://www.jma.go.jp/jma/indexe.html); MIROVA (Middle InfraRed Observation of Volcanic Activity), a collaborative project between the Universities of Turin and Florence (Italy) supported by the Centre for Volcanic Risk of the Italian Civil Protection Department (URL: http://www.mirovaweb.it/); Hawai'i Institute of Geophysics and Planetology (HIGP) - MODVOLC Thermal Alerts System, School of Ocean and Earth Science and Technology (SOEST), Univ. of Hawai'i, 2525 Correa Road, Honolulu, HI 96822, USA (URL: http://modis.higp.hawaii.edu/); Copernicus Browser, Copernicus Data Space Ecosystem, European Space Agency (URL: https://dataspace.copernicus.eu/browser/).
Etna
Italy
37.748°N, 14.999°E; summit elev. 3357 m
All times are local (unless otherwise noted)
Strombolian explosions, lava fountains, and lava flows during July-August 2023
Etna, located on the Italian island of Sicily, has had documented eruptions dating back to 1500 BCE. Activity typically originates from multiple cones at the summit, where several craters have formed and evolved. The currently active craters are Northeast Crater (NEC), Voragine (VOR), and Bocca Nuova (BN), and the Southeast Crater (SEC); VOR and BN were previously referred to as the “Central Crater”. The original Southeast crater formed in 1978, and a second eruptive site that opened on its SE flank in 2011 was named the New Southeast Crater (NSEC). Another eruptive site between the SEC and NSEC developed during early 2017 and was referred to as the "cono della sella" (saddle cone). The current eruption period began in November 2022 and has been characterized by intermittent Strombolian activity, lava flows, and ash plumes (BGVN 48:08). This report updates activity during July through October 2023, which includes primarily gas-and-steam emissions; during July and August Strombolian explosions, lava fountains, and lava flows were reported, based on weekly and special reports by the Osservatorio Etneo (OE), part of the Catania Branch of Italy's Istituo Nazionale di Geofisica e Vulcanologica (INGV) and satellite data.
Variable fumarolic degassing was reported at all summit craters (BN, VOR, NEC, and SEC) throughout the entire reporting period (table 15). The MIROVA (Middle InfraRed Observation of Volcanic Activity) volcano hotspot detection system based on the analysis of MODIS data showed frequent low-to-moderate power thermal anomalies during the reporting period (figure 399). During mid-August there was a pulse in activity that showed an increase in the power of the anomalies due to Strombolian activity, lava fountains, and lava flows. Infrared satellite imagery captured strong thermal anomalies at the central and southeast summit crater areas (figure 400). Accompanying thermal activity were occasional sulfur dioxide plumes that exceeded 2 Dobson Units (DUs) recorded by the TROPOMI instrument on the Sentinel-5P satellite (figure 401).
Table 15. Summary of activity at the four primary crater areas at the summit of Etna during July-October 2023. Information is from INGV weekly reports.
| Month |
Bocca Nuova (BN) |
Voragine (VOR) |
Northeast Crater (NEC) |
Southeast Crater (SEC) |
| Jul 2023 |
Continuous degassing. |
No observations. |
Weak gas emissions. |
Continuous degassing. Sporadic and weak-to-moderate ash emissions. Strombolian explosions. |
| Aug 2023 |
Continuous degassing. |
No observations. |
No observations. |
Continuous degassing. Occasional ash emissions. Strombolian activity, lava fountaining, and lava flows. |
| Sep 2023 |
Variable degassing. Crater incandescence. |
Weak fumarolic activity. |
Weak fumarolic activity. |
Variable degassing. |
| Oct 2023 |
Continuous degassing. |
Weak fumarolic activity. |
Weak fumarolic activity. |
Continuous degassing. |
Activity during July and August was relatively low and mainly consisted of degassing at the summit craters, particularly at SEC and BN. Cloudy weather prevented clear views of the summit during early July. During the night of 2 July some crater incandescence was visible at SEC. Explosive activity resumed at SEC during 9-10 July, which was characterized by sporadic and weak ash emissions that rapidly dispersed in the summit area (figure 402). INGV reported moderate Strombolian activity began at 2034 on 14 July and was confined to the inside of the crater and fed by a vent located in the E part of SEC. An ash emission was detected at 2037. A new vent opened on 15 July in the SE part of BN and began to produce continuous gas-and-steam emissions. During an inspection carried out on 28 July pulsating degassing, along with audible booms, were reported at two active vents in BN. Vigorous gas-and-steam emissions intermittently generated rings. On rare occasions, fine, reddish ash was emitted from BN1 and resuspended by the gas-and-steam emissions.
Around 2000 on 13 August INGV reported a sudden increase in volcanic tremor amplitude. Significant infrasonic activity coincided with the tremor increase. Incandescent flashes were visible through the cloud cover in webcam images of SEC (figure 403). Strombolian activity at SEC began to gradually intensify starting at 2040 as seismicity continued to increase. The Aviation Color Code (ACC) was raised to Yellow (the second lowest-level on a four-color scale) at 2126 and then to Orange (the second highest-level on a four-color scale) at 2129 due to above-background activity. The activity rapidly transitioned from Strombolian activity to lava fountains around 2333 that rose 300-400 m above the crater (figure 403). Activity was initially focused on the E vent of the crater, but then the vent located above the S flank of the cone also became active. A lava flow from this vent traveled SW into the drainage created on 10 February 2022, overlapping with previous flows from 10 and 21 February 2022 and 21 May 2023, moving between Monte Barbagallo and Monte Frumento Supino (figure 404). The lava flow was 350 m long, oriented NNE-SSW, and descended to an elevation of 2.8 km. Flows covered an area of 300,000 m2 and had an estimated volume of 900,000 m3. The ACC was raised to Red at 2241 based on strong explosive activity and ashfall in Rifugio Sapienza-Piano Vetore at 1.7 km elevation on the S flank. INGV reported that pyroclastic flows accompanied this activity.
Activity peaked between 0240 and 0330 on 14 August, when roughly 5-6 vents erupted lava fountains from the E to SW flank of SEC. The easternmost vents produced lava fountains that ejected material strongly to the E, which caused heavy fallout of incandescent pyroclastic material on the underlying flank, triggering small pyroclastic flows. This event was also accompanied by lightning both in the ash column and in the ash clouds that were generated by the pyroclastic flows. A fracture characterized by a series of collapse craters (pit craters) opened on the upper SW flank of SEC. An ash cloud rose a few kilometers above the crater and drifted S, causing ash and lapilli falls in Rifugio Sapienza and expanding toward Nicolosi, Mascalucia, Catania, and up to Syracuse. Ashfall resulted in operational problems at the Catania airport (50 km S), which lasted from 0238 until 2000. By 0420 the volcanic tremor amplitude values declined to background levels. After 0500 activity sharply decreased, although the ash cloud remained for several hours and drifted S. By late morning, activity had completely stopped. The ACC was lowered to Orange as volcanic ash was confined to the summit area. Sporadic, minor ash emissions continued throughout the day. At 1415 the ACC was lowered to Yellow and then to Green at 1417.
During the night of 14-15 August only occasional flashes were observed, which were more intense during avalanches of material inside the eruptive vents. Small explosions were detected at SEC at 2346 on 14 August and at 0900 on 26 August that each produced ash clouds which rapidly dispersed into the atmosphere (figure 405). According to a webcam image, an explosive event detected at 2344 at SEC generated a modest ash cloud that was rapidly dispersed by winds. The ACC was raised to Yellow at 2355 on 14 August due to increasing unrest and was lowered to Green at 0954 on 15 August.
Activity during September and October was relatively low and mainly characterized by variable degassing from BN and SEC. Intense, continuous, and pulsating degassing was accompanied by roaring sounds and flashes of incandescence at BN both from BN1 and the new pit crater that formed during late July (figure 406). The degassing from the new pit crater sometimes emitted vapor rings. Cloudy weather during 6-8 September prevented observations of the summit craters .
Geologic Background. Mount Etna, towering above Catania on the island of Sicily, has one of the world's longest documented records of volcanism, dating back to 1500 BCE. Historical lava flows of basaltic composition cover much of the surface of this massive volcano, whose edifice is the highest and most voluminous in Italy. The Mongibello stratovolcano, truncated by several small calderas, was constructed during the late Pleistocene and Holocene over an older shield volcano. The most prominent morphological feature of Etna is the Valle del Bove, a 5 x 10 km caldera open to the east. Two styles of eruptive activity typically occur, sometimes simultaneously. Persistent explosive eruptions, sometimes with minor lava emissions, take place from one or more summit craters. Flank vents, typically with higher effusion rates, are less frequently active and originate from fissures that open progressively downward from near the summit (usually accompanied by Strombolian eruptions at the upper end). Cinder cones are commonly constructed over the vents of lower-flank lava flows. Lava flows extend to the foot of the volcano on all sides and have reached the sea over a broad area on the SE flank.
Information Contacts: Sezione di Catania - Osservatorio Etneo, Istituto Nazionale di Geofisica e Vulcanologia (INGV), Sezione di Catania, Piazza Roma 2, 95123 Catania, Italy (URL: http://www.ct.ingv.it/it/); MIROVA (Middle InfraRed Observation of Volcanic Activity), a collaborative project between the Universities of Turin and Florence (Italy) supported by the Centre for Volcanic Risk of the Italian Civil Protection Department (URL: http://www.mirovaweb.it/); NASA Global Sulfur Dioxide Monitoring Page, Atmospheric Chemistry and Dynamics Laboratory, NASA Goddard Space Flight Center (NASA/GSFC), 8800 Greenbelt Road, Goddard MD 20771, USA (URL: https://so2.gsfc.nasa.gov/); Copernicus Browser, Copernicus Data Space Ecosystem, European Space Agency (URL: https://dataspace.copernicus.eu/browser/).
Aira
Japan
31.5772°N, 130.6589°E; summit elev. 1117 m
All times are local (unless otherwise noted)
Explosions, ash plumes, ash fall, and crater incandescence during July-October 2023
Aira caldera, located in the northern half of Kagoshima Bay, Japan, contains the post-caldera Sakurajima volcano. Eruptions typically originate from the Minamidake crater, and since the 8th century, ash deposits have been recorded in the city of Kagoshima (10 km W), one of Kyushu’s largest cities. The Minamidake summit cone and crater has had persistent activity since 1955; the Showa crater on the E flank has also been intermittently active since 2006. The current eruption period began during March 2017 and has recently been characterized by intermittent explosions, eruption plumes, and ashfall (BGVN 48:07). This report updates activity during July through October 2023 and describes explosive events, ash plumes, nighttime crater incandescence, and ashfall, according to monthly activity reports from the Japan Meteorological Agency (JMA) and satellite data.
Thermal activity remained at low levels during this reporting period, according to the MIROVA (Middle InfraRed Observation of Volcanic Activity) system (figure 149). There was a slight increase in the number of anomalies during September through October. Occasional thermal anomalies were visible in infrared satellite images mainly at the Minamidake crater (Vent A is located to the left and Vent B is located to the right) (figure 150).
Table 30. Number of monthly explosive events, days of ashfall, area of ash covered, and sulfur dioxide emissions from Sakurajima’s Minamidake crater at Aira during July-October 2023. Note that smaller ash events are not listed. Ashfall days were measured at Kagoshima Local Meteorological Observatory and ashfall amounts represent material covering all the Kagoshima Prefecture. Data courtesy of JMA monthly reports.
| Month |
Explosive events |
Days of ashfall |
Ashfall amount (g/m2) |
SO2 emissions (tons/day) |
| Jul 2023 |
3 |
0 |
0 |
1,600-3,200 |
| Aug 2023 |
3 |
10 |
7 |
1,800-3,300 |
| Sep 2023 |
3 |
7 |
3 |
1,600-2,300 |
| Oct 2023 |
33 |
8 |
61 |
2,200-4,200 |
JMA reported that during July, there were eight eruptions, three of which were explosion events in the Showa crater. Large blocks were ejected as far as 600 m from the Showa crater. Very small eruptions were occasionally reported at the Minamidake crater. Nighttime incandescence was observed in both the Showa and Minamidake crater. Explosions were reported on 16 July at 2314 and on 17 July at 1224 and at 1232 (figure 151). Resulting eruption plumes rose 700-2,500 m above the crater and drifted N. On 23 July the number of volcanic earthquakes on the SW flank of the volcano increased. A strong Mw 3.1 volcanic earthquake was detected at 1054 on 26 July. The number of earthquakes recorded throughout the month was 545, which markedly increased from 73 in June. No ashfall was observed at the Kagoshima Regional Meteorological Observatory during July. According to a field survey conducted during the month, the daily amount of sulfur dioxide emissions was 1,600-3,200 tons per day (t/d).
There were three eruptions reported at the Minamidake crater during August, each of which were explosive. The explosions occurred on 9 August at 0345, on 13 August at 2205, and on 31 August at 0640, which generated ash plumes that rose 800-2,000 m above the crater and drifted W. There were two eruptions detected at Showa crater; on 4 August at 2150 ejecta traveled 800 m from the Showa crater and associated eruption plumes rose 2.3 km above the crater. The explosion at 2205 on 13 August generated an ash plume that rose 2 km above the crater and was accompanied by large blocks that were ejected 600 m from the Minamidake crater (figure 152). Nighttime crater incandescence was visible in a high-sensitivity surveillance camera at both craters. Seismicity consisted of 163 volcanic earthquakes, 84 of which were detected on the SW flank. According to the Kagoshima Regional Meteorological Observatory there was a total of 7 g/m2 of ashfall over the course of 10 days during the month. According to a field survey, the daily amount of sulfur dioxide emitted was 1,800-3,300 t/d.
During September, four eruptions were reported, three of which were explosion events. These events occurred at 1512 on 9 September, at 0018 on 11 September, and at 2211 on 13 September. Resulting ash plumes generally rose 800-1,100 m above the crater. An explosion produced an ash plume at 2211 on 13 September that rose as high as 1.7 km above the crater. Large volcanic blocks were ejected 600 m from the Minamidake crater. Smaller eruptions were occasionally observed at the Showa crater. Nighttime crater incandescence was visible at the Minamidake crater. Seismicity was characterized by 68 volcanic earthquakes, 28 of which were detected beneath the SW flank. According to the Kagoshima Regional Meteorological Observatory there was a total of 3 g/m2 of ashfall over the course of seven days during the month. A field survey reported that the daily amount of sulfur dioxide emitted was 1,600-2,300 t/d.
Eruptive activity during October consisted of 69 eruptions, 33 of which were described as explosive. These explosions occurred during 4 and 11-21 October and generated ash plumes that rose 500-3,600 m above the crater and drifted S, E, SE, and N. On 19 October at 1648 an explosion generated an ash plume that rose 3.6 km above the crater (figure 153). No eruptions were reported in the Showa crater; white gas-and-steam emissions rose 100 m above the crater from a vent on the N flank. Nighttime incandescence was observed at the Minamidake crater. On 24 October an eruption was reported from 0346 through 0430, which included an ash plume that rose 3.4 km above the crater. Ejected blocks traveled 1.2 km from the Minamidake crater. Following this eruption, small amounts of ashfall were observed from Arimura (4.5 km SE) and a varying amount in Kurokami (4 km E) (figure 154). The number of recorded volcanic earthquakes during the month was 190, of which 14 were located beneath the SW flank. Approximately 61 g/m2 of ashfall was reported over eight days of the month. According to a field survey, the daily amount of sulfur dioxide emitted was 2,200-4,200 t/d.
Geologic Background. The Aira caldera in the northern half of Kagoshima Bay contains the post-caldera Sakurajima volcano, one of Japan's most active. Eruption of the voluminous Ito pyroclastic flow accompanied formation of the 17 x 23 km caldera about 22,000 years ago. The smaller Wakamiko caldera was formed during the early Holocene in the NE corner of the caldera, along with several post-caldera cones. The construction of Sakurajima began about 13,000 years ago on the southern rim and built an island that was joined to the Osumi Peninsula during the major explosive and effusive eruption of 1914. Activity at the Kitadake summit cone ended about 4,850 years ago, after which eruptions took place at Minamidake. Frequent eruptions since the 8th century have deposited ash on the city of Kagoshima, located across Kagoshima Bay only 8 km from the summit. The largest recorded eruption took place during 1471-76.
Information Contacts: Japan Meteorological Agency (JMA), 1-3-4 Otemachi, Chiyoda-ku, Tokyo 100-8122, Japan (URL: http://www.jma.go.jp/jma/indexe.html); MIROVA (Middle InfraRed Observation of Volcanic Activity), a collaborative project between the Universities of Turin and Florence (Italy) supported by the Centre for Volcanic Risk of the Italian Civil Protection Department (URL: http://www.mirovaweb.it/); Copernicus Browser, Copernicus Data Space Ecosystem, European Space Agency (URL: https://dataspace.copernicus.eu/browser/).
Nishinoshima (Japan) — November 2023 Cite this Report
Nishinoshima
Japan
27.247°N, 140.874°E; summit elev. 100 m
All times are local (unless otherwise noted)
Gray emissions during October 2023
Nishinoshima is a small island in the Ogasawara Arc, about 1,000 km S of Tokyo, Japan. It contains prominent submarine peaks to the S, W, and NE. Recorded eruptions date back to 1973, with the current eruption period beginning in October 2022. Eruption plumes and fumarolic activity characterize recent activity (BGVN 48:10). This report covers the end of the eruption for September through October 2023, based on information from monthly reports of the Japan Meteorological Agency (JMA) monthly reports, and satellite data.
No eruptive activity was reported during September 2023, although JMA noted that the surface temperature was slightly elevated compared to the surrounding area since early March 2023. The Japan Coast Guard (JCG) conducted an overflight on 20 September and reported white gas-and-steam plumes rising 3 km above the central crater of the pyroclastic cone, as well as multiple white gas-and-steam emissions emanating from the N, E, and S flanks of the crater to the coastline. In addition, dark reddish brown-to-green discolored water was distributed around almost the entire circumference of the island.
Similar low-level activity was reported during October. Multiple white gas-and-steam emissions rose from the N, E, and S flanks of the central crater of the pyroclastic cone and along the coastline; these emissions were more intense compared to the previous overflight observations. Dark reddish brown-to-green discolored water remained visible around the circumference of the island. On 4 October aerial observations by JCG showed a small eruption consisting of continuous gas-and-steam emissions emanating from the central crater, with gray emissions rising to 1.5 km altitude (figure 129). According to observations from the marine weather observation vessel Keifu Maru on 26 October, white gas-and-steam emissions persisted from the center of the pyroclastic cone, as well as from the NW, SW, and SE coasts of the island for about five minutes. Slightly discolored water was visible up to about 1 km.
Frequent low-to-moderate power thermal anomalies were recorded in the MIROVA graph (Middle InfraRed Observation of Volcanic Activity) during September (figure 130). Occasional anomalies were detected during October, and fewer during November through December. A thermal anomaly was visible in the crater using infrared satellite imagery on 6, 8, 11, 16, 18, 21, and 23 September and 8, 13, 21, 26, and 28 October (figure 131).
Geologic Background. The small island of Nishinoshima was enlarged when several new islands coalesced during an eruption in 1973-74. Multiple eruptions that began in 2013 completely covered the previous exposed surface and continued to enlarge the island. The island is the summit of a massive submarine volcano that has prominent peaks to the S, W, and NE. The summit of the southern cone rises to within 214 m of the ocean surface 9 km SSE.
Information Contacts: Japan Meteorological Agency (JMA), 1-3-4 Otemachi, Chiyoda-ku, Tokyo 100-8122, Japan (URL: http://www.jma.go.jp/jma/indexe.html); MIROVA (Middle InfraRed Observation of Volcanic Activity), a collaborative project between the Universities of Turin and Florence (Italy) supported by the Centre for Volcanic Risk of the Italian Civil Protection Department (URL: http://www.mirovaweb.it/); Copernicus Browser, Copernicus Data Space Ecosystem, European Space Agency (URL: https://dataspace.copernicus.eu/browser/).
Kilauea (United States) — October 2023 Cite this Report
Kilauea
United States
19.421°N, 155.287°W; summit elev. 1222 m
All times are local (unless otherwise noted)
Strong lava fountains, lava flows, and spatter at Halema’uma’u during January-September 2023
Kīlauea is on the island of Hawai’i and overlaps the E flank of the Mauna Loa volcano. Its East Rift Zone (ERZ) has been intermittently active for at least 2,000 years. An extended eruption period began in January 1983 and was characterized by open lava lakes and lava flows from the summit caldera and the East Rift Zone. During May 2018 magma migrated into the Lower East Rift Zone (LERZ) and opened 24 fissures along a 6-km-long NE-trending fracture zone that produced lava flows traveling in multiple directions. As lava emerged from the fissures, the lava lake at Halema'uma'u drained and explosions sent ash plumes to several kilometers altitude (BGVN 43:10).
The current eruption period started during September 2021 and has been characterized by low-level lava effusions in the active Halema’uma’u lava lake (BGVN 48:01). This report covers three notable eruption periods during February, June, and September 2023 consisting of lava fountaining, lava flows, and spatter during January through September 2023 using information from daily reports, volcanic activity notices, and abundant photo, map, and video data from the US Geological Survey's (USGS) Hawaiian Volcano Observatory (HVO).
Activity during January 2023. Small earthquake swarms were recorded on 2 January 2023; increased seismicity and changes in the pattern of deformation were noted on the morning of 5 January. At around 1500 both the rate of deformation and seismicity drastically increased, which suggested magma movement toward the surface. HVO raised the Volcano Alert Level (VAL) to Watch (the second highest level on a four-level scale) and the Aviation Color Code (ACC) to Orange (the second highest color on a four-color scale) at 1520.
Multiple lava fountains and lava effusions from vents in the central eastern portion of the Halema’uma’u crater began on 5 January around 0434; activity was confined to the eastern half of the crater and within the basin of the western half of the crater, which was the focus of the eruption in 2021-2022 (figure 525). Incandescence was visible in webcam images at 1634 on 5 January, prompting HVO to raise the VAL to Warning (the highest level on a four-level scale) and the ACC to Red (the highest color on a four-color scale). Lava fountains initially rose as high as 50 m above the vent at the onset of the eruption (figure 526) but then declined to a more consistent 5-6 m height in the proceeding days. By 1930 that same day, lava had covered most of the crater floor (an area of about 1,200,000 m2) and the lava lake had a depth of 10 m. A higher-elevation island that formed during the initial phase of the December 2020 eruption remained exposed, appearing darker in images, along with a ring of older lava around the lava lake that was active prior to December 2022. Overnight during 5-6 January the lava fountains continued to rise 5 m high, and the lava effusion rate had slowed.
On 6 January at 0815 HVO lowered the VAL to Watch and the ACC to Orange due to the declining effusion rates. Sulfur dioxide emission rates ranged from 3,000-12,500 tonnes per day (t/d), the highest value of which was recorded on 6 January. Lava continued to erupt from the vents during 6-8 January, although the footprint of the active area had shrunk; a similar progression has been commonly observed during the early stages of recent eruptions at Halema’uma’u. On 9 January HVO reported one dominant lava fountain rising 6-7 m high in the E half of the crater. Lava flows built up the margins of the lake, causing the lake to be perched. On 10 January the eastern lava lake had an area of approximately 120,000 m2 that increased to 250,000 m2 by 17 January. During 13-31 January several small overflows occurred along the margins of the E lake. A smaller area of lava was active within the basin in the W half of the crater that had been the focus of activity during 2021-2022. On 19 January just after 0200 a small ooze-out was observed on the crater’s W edge.
Activity during February 2023. Activity continued in the E part of Halema’uma’u crater, as well as in a smaller basin in the W part of the 2021-2022 lava lake (figure 527). The E lava lake contained a single lava fountain and frequent overflows. HVO reported that during the morning of 1 February the large E lava lake began to cool and crust over in the center of the lake; two smaller areas of lava were observed on the N and S sides by the afternoon. The dominant lava fountain located in the S part of the lava lake paused for roughly 45 minutes at 2315 and resumed by midnight, rising 1-2 m. At 0100 on 2 February lava from the S part was effusing across the entire E lava lake area, covering the crusted over portion in the center of the lake and continuing across the majority of the previously measured 250,000 m2 by 0400. A small lava pond near the E lake produced an overflow around 0716 on 2 February. On 3 February some lava crust began to form against the N and E levees, which defined the 250,000 m2 eastern lava lake. The small S lava fountain remained active, rising 1-6 m high during 3-9 February; around 0400 on 5 February occasional bursts doubled the height of the lava fountain.
A large breakout occurred overnight during 2100 on 4 February to 0900 on 5 February on the N part of the crater floor, equal to or slightly larger in size than the E lava lake. A second, smaller lava fountain appeared in the same area of the E lava lake between 0300 and 0700 on 5 February and was temporarily active. This large breakout continued until 7 February. A small, brief breakout was reported in the S of the E lava lake around midnight on 7 February. In the W lake, as well as the smaller lava pond in the central portion of the crater floor, contained several overflows during 7-10 February and intermittent fountaining. Activity at the S small lava pond and the small S lava fountain within the E lake declined during 9-10 February. The lava pond in the central portion of the crater floor had nearly continuous, expansive flows during 10-13 February; channels from the small central lava pond seemed to flow into the larger E lake. During 13-18 February a small lava fountain was observed in the small lava pond in the central portion of the crater floor. Continuous overflows persisted during this time.
Activity in the eastern and central lakes began to decline in the late afternoon of 17 February. By 18 February HVO reported that the lava effusions had significantly declined, and that the eastern and central lakes were no longer erupting. The W lake in the basin remained active but at a greatly reduced level that continued to decline. HVO reported that this decrease in activity is attributed to notable deflationary tilt that began early on the morning of 17 February and lasted until early 19 February. By 19 February the W lake was mostly crusted over although some weak lava flows remained, which continued through 28 February. The sulfur dioxide emission rates ranged 250-2,800 t/d, the highest value of which was recorded on 6 February.
Activity during March 2023. The summit eruption at Halema’uma’u crater continued at greatly reduced levels compared to the previous two months. The E and central vents stopped effusing lava, and the W lava lake remained active with weak lava flows; the lake was mostly crusted over, although slowly circulating lava intermittently overturned the crust. By 6 March the lava lake in the W basin had stopped because the entire surface was crusted over. The only apparent surface eruptive activity during 5-6 March was minor ooze-outs of lava onto the crater floor, which had stopped by 7 March. Several hornitos on the crater floor still glowed through 12 March according to overnight webcam images, but they did not erupt any lava. A small ooze-out of lava was observed just after 1830 in the W lava lake on 8 March, which diminished overnight. The sulfur dioxide emission rate ranged from 155-321 t/d on 21 March. The VAL was lowered to Advisory, and the ACC was lowered to Yellow (the second lowest on a four-color scale) on 23 March due to a pause in the eruption since 7 March.
Activity during April-May 2023. The eruption at Halema’uma’u crater was paused; no lava effusions were visible on the crater floor. Sulfur dioxide emission rates ranged from 75-185 t/d, the highest of which was measured on 22 April. During May and June summit seismicity was elevated compared to seismicity that preceded the activity during January.
Activity during June 2023. Earthquake activity and changes in the patterns of ground deformation beneath the summit began during the evening of 6 June. The data indicated magma movement toward the surface, prompting HVO to raise the VAL to Watch and the ACC to Orange. At about 0444 on 7 June incandescence in Halema’uma’u crater was visible in webcam images, indicating that a new eruption had begun. HVO raised the VAL to Warning and the ACC to Red (the highest color on a four-color scale). Lava flowed from fissures that had opened on the crater floor. Multiple minor lava fountains were active in the central E portion of the Halema’uma’u crater, and one vent opened on the W wall of the caldera (figure 528). The eruptive vent on the SW wall of the crater continued to effuse into the lava lake in the far SW part of the crater (figure 529). The largest lava fountain consistently rose 15 m high; during the early phase of the eruption, fountain bursts rose as high as 60 m. Lava flows inundated much of the crater floor and added about 6 m depth of new lava within a few hours, covering approximately 10,000 m2. By 0800 on 7 June lava filled the crater floor to a depth of about 10 m. During 0800-0900 the sulfur dioxide emission rate was about 65,000 t/d. Residents of Pahala (30 km downwind of the summit) reported minor deposits of fine, gritty ash and Pele’s hair. A small spatter cone had formed at the vent on the SW wall by midday, and lava from the cone was flowing into the active lava lake. Fountain heights had decreased from the onset of the eruption and were 4-9 m high by 1600, with occasional higher bursts. Inflation switched to deflation and summit earthquake activity greatly diminished shortly after the eruption onset.
At 0837 on 8 June HVO lowered the VAL to Watch and the ACC to Orange because the initial high effusion rates had declined, and no infrastructure was threatened. The surface of the lava lake had dropped by about 2 m, likely due to gas loss by the morning of 8 June. The drop left a wall of cooled lava around the margins of the crater floor. Lava fountain heights decreased during 8-9 June but continued to rise to 10 m high. Active lava and vents covered much of the W half of Halema’uma’u crater in a broad, horseshoe-shape around a central, uplifted area (figure 530). The preliminary average effusion rate for the first 24 hours of the eruption was about 150 cubic meters per second, though the estimate did not account for vesiculated lava and variations in crater floor topography. The effusion rate during the very earliest phases of the eruption appeared significantly higher than the previous three summit eruptions based on the rapid coverage of the entire crater floor. An active lava lake, also referred to as the “western lava lake” was centered within the uplifted area and was fed by a vent in the NE corner. Two small active lava lakes were located just SE from the W lava lake and in the E portion of the crater floor.
During 8-9 June the lava in the central lava lake had a thickness of approximately 1.5 m, based on measurements from a laser rangefinder. During 9-12 June the height of the lava fountains decreased to 9 m high. HVO reported that the previously active lava lake in the E part of the crater appeared stagnant during 10-11 June. The surface of the W lake rose approximately 1 m overnight during 11-12 June, likely due to the construction of a levee around it. Only a few small fountains were active during 12-13 June; the extent of the active lava had retreated so that all activity was concentrated in the SW and central parts of Halema’uma’u crater. Intermittent spattering from the vent on the SW wall was visible in overnight webcam images during 13-18 June. On the morning of 14 June a weak lava effusion originated from near the western eruptive vent, but by 15 June there were no signs of continued activity. HVO reported that other eruptive vents in the SW lava lake had stopped during this time, following several days of waning activity; lava filled the lake by about 0.5 m. Lava circulation continued in the central lake and no active lava was reported in the northern or eastern parts of the crater. Around 0800 on 15 June the top of the SW wall spatter cone collapsed, which was followed by renewed and constant spattering from the top vent and a change in activity from the base vent; several new lava flows effused from the top of the cone, as well as from the pre-existing tube-fed flow from its base. Accumulation of lava on the floor resulted in a drop of the central basin relative to the crater floor, allowing several overflows from the SW lava lake to cascade into the basin during the night of 15 June into the morning of 16 June.
Renewed lava fountaining was reported at the eruptive vent on the SW side of the crater during 16-19 June, which effused lava into the far SW part of the crater. This activity was described as vigorous during midday on 16 June; a group of observatory geologists estimated that the lava was consistently ejected at least 10 m high, with some spatter ejected even higher and farther. Deposits from the fountain further heightened and widened the spatter cone built around the original eruptive vent in the lower section of the crater wall. Multiple lava flows from the base of the cone were fed into the SW lava lake and onto the southwestern-most block from the 2018 collapse within Halema’uma’u on 17 June (figure 531); by 18 June they focused into a single flow feeding into the SW lava lake. On the morning of 19 June a second lava flow from the base of the eruptive cone advanced into the SW lava lake.
Around 1600 on 19 June there was a rapid decline in lava fountaining and effusion at the eruptive vent on the SW side of the crater; vent activity had been vigorous up to that point (figure 532). Circulation in the lava lake also slowed, and the lava lake surface dropped by several meters. Overnight webcam images showed some previously eruptive lava still flowing onto the crater floor, which continued until those flows began to cool. By 21 June no lava was erupting in Halema’uma’u crater. Overnight webcam images during 29-30 June showed some incandescence from previously erupted lava flows as they continued to cool. Seismicity in the crater declined to low levels. Sulfur dioxide emission rates ranged 160-21,000 t/d throughout the month, the highest measurement of which was recorded on 8 June. On 30 June the VAL was lowered to Advisory (the second level on a four-level scale) and the ACC was lowered to Yellow. Gradual inflation was detected at summit tiltmeters during 19-30 June.
Activity during July-August 2023. During July, the eruption paused; no lava was erupting in Halema’uma’u crater. Nighttime webcam images showed some incandescence from previously erupted lava as it continued to cool on the crater floor. During the week of 14 August HVO reported that the rate in seismicity increased, with 467 earthquakes of Mw 3.2 and smaller occurring. Sulfur dioxide emission rates remained low, ranging from 75-86 t/d, the highest of which was recorded on 10 and 15 August. On 15 August beginning at 0730 and lasting for several hours, a swarm of approximately 50 earthquakes were detected at a depth of 2-3 km below the surface and about 2 km long directly S of Halema’uma’u crater. HVO reported that this was likely due to magma movement in the S caldera region. During 0130-0500 and 1700-2100 on 21 August two small earthquake swarms of approximately 20 and 25 earthquakes, respectively, occurred at the same location and at similar depths. Another swarm of 50 earthquakes were recorded during 0430-0830 on 23 August. Elevated seismicity continued in the S area through the end of the month.
Activity during September 2023. Elevated seismicity persisted in the S summit with occasional small, brief seismic swarms. Sulfur dioxide measurements were relatively low and were 70 t/d on 8 September. About 150 earthquakes occurred during 9-10 September, and tiltmeter and Global Positioning System (GPS) data showed inflation in the S portion of the crater.
At 0252 on 10 September HVO raised the VAL to Watch and the ACC to Orange due to increased earthquake activity and changes in ground deformation that indicated magma moving toward the surface. At 1515 the summit eruption resumed in the E part of the caldera based on field reports and webcam images. Fissures opened on the crater floor and produced multiple minor lava fountains and flows (figure 533). The VAL and ACC were raised to Warning and Red, respectively. Gas-and-steam plumes rose from the fissures and drifted downwind. A line of eruptive vents stretched approximately 1.4 km from the E part of the crater into the E wall of the down dropped block by 1900. The lava fountains at the onset of the eruption had an estimated 50 m height, which later rose 20-25 m high. Lava erupted from fissures on the down dropped block and expanded W toward Halema’uma’u crater. Data from a laser rangefinder recorded about 2.5 m thick of new lava added to the W part of the crater. Sulfur dioxide emissions were elevated in the eruptive area during 1600-1500 on 10 September, measuring at least 100,000 t/d.
At 0810 on 11 September HVO lowered the VAL and ACC back to Watch and Orange due to the style of eruption and the fissure location had stabilized. The initial extremely high effusion rates had declined (but remained at high levels) and no infrastructure was threatened. An eruption plume, mainly comprised of sulfur dioxide and particulates, rose as high as 3 km altitude. Several lava fountains were active on the W side of the down dropped block during 11-15 September, while the easternmost vents on the down dropped block and the westernmost vents in the crater became inactive on 11 September (figure 534). The remaining vents spanned approximately 750 m and trended roughly E-W. The fed channelized lava effusions flowed N and W into Halema’uma’u. The E rim of the crater was buried by new lava flows; pahoehoe lava flows covered most of the crater floor except areas of higher elevation in the SW part of the crater. The W part of the crater filled about 5 m since the start of the eruption, according to data from a laser rangefinder during 11-12 September. Lava fountaining continued, rising as high as 15 m by the morning of 12 September. During the morning of 13 September active lava flows were moving on the N and E parts of the crater. The area N of the eruptive vents that had active lava on its surface became perched and was about 3 m higher than the surrounding ground surface. By the morning of 14 September active lava was flowing on the W part of the down dropped block and the NE parts of the crater. The distances of the active flows progressively decreased. Spatter had accumulated on the S (downwind) side of the vents, forming ramparts about 20 m high.
Vigorous spattering was restricted to the westernmost large spatter cone with fountains rising 10-15 m high. Minor spattering occurred within the cone to the E of the main cone, but HVO noted that the fountains remained mostly below the rim of the cone. Lava continued to effuse from these cones and likely from several others as well, traveled N and W, confined to the W part of the down-dropped block and the NE parts of Halema’uma’u. Numerous ooze-outs of lava were visible over other parts of the crater floor at night. Laser range-finder measurements taken of the W part of the crater during 14-15 September showed that lava filled the crater by 10 m since the start of the eruption. Sulfur dioxide emissions remained elevated after the onset of the eruption, ranging 20,000-190,000 t/d during the eruption activity, the highest of which occurred on 10 September.
Field crews observed the eruptive activity on 15 September; they reported a notable decrease or stop in activity at several vents. Webcam images showed little to no fountaining since 0700 on 16 September, though intermittent spattering continued from the westernmost large cone throughout the night of 15-16 September. Thermal images showed that lava continued to flow onto the crater floor. On 16 September HVO reported that the eruption stopped around 1200 and that there was no observable activity anywhere overnight or on the morning of 17 September. HVO field crews reported that active lava was no longer flowing onto Halema’uma’u crater floor and was restricted to a ponded area N of the vents on the down dropped block. They reported that spattering stopped around 1115 on 16 September. Nighttime webcam images showed some incandescence on the crater floor as lava continued to cool. Field observations supported by geophysical data showed that eruptive tremor in the summit region decreased over 15-16 September and returned to pre-eruption levels by 1700 on 16 September. Sulfur dioxide emissions were measured at a rate of 800 t/d on 16 September while the eruption was waning, and 200 t/d on 17 September, which were markedly lower compared to measurements taken the previous week of 20,000-190,000 t/d.
Geologic Background. Kilauea overlaps the E flank of the massive Mauna Loa shield volcano in the island of Hawaii. Eruptions are prominent in Polynesian legends; written documentation since 1820 records frequent summit and flank lava flow eruptions interspersed with periods of long-term lava lake activity at Halemaumau crater in the summit caldera until 1924. The 3 x 5 km caldera was formed in several stages about 1,500 years ago and during the 18th century; eruptions have also originated from the lengthy East and Southwest rift zones, which extend to the ocean in both directions. About 90% of the surface of the basaltic shield volcano is formed of lava flows less than about 1,100 years old; 70% of the surface is younger than 600 years. The long-term eruption from the East rift zone between 1983 and 2018 produced lava flows covering more than 100 km2, destroyed hundreds of houses, and added new coastline.
Information Contacts: Hawaiian Volcano Observatory (HVO), U.S. Geological Survey, PO Box 51, Hawai'i National Park, HI 96718, USA (URL: http://hvo.wr.usgs.gov/).
Tinakula (Solomon Islands) — December 2023 Cite this Report
Tinakula
Solomon Islands
10.386°S, 165.804°E; summit elev. 796 m
All times are local (unless otherwise noted)
Continued lava flows and thermal activity during June through November 2023
Tinakula is a remote 3.5 km-wide island in the Solomon Islands, located 640 km ESE of the capital, Honiara. The current eruption period began in December 2018 and has more recently been characterized by intermittent lava flows and thermal activity (BGVN 48:06). This report covers similar activity during June through November 2023 using satellite data.
During clear weather days (20 July, 23 September, 23 October, and 12 November), infrared satellite imagery showed lava flows that mainly affected the W side of the island and were sometimes accompanied by gas-and-steam emissions (figure 54). The flow appeared more intense during July and September compared to October and November. According to the MODVOLC thermal alerts, there were a total of eight anomalies detected on 19 and 21 July, 28 and 30 October, and 16 November. Infrared MODIS satellite data processed by MIROVA (Middle InfraRed Observation of Volcanic Activity) detected a small cluster of thermal activity occurring during late July, followed by two anomalies during August, two during September, five during October, and five during November (figure 55).
Geologic Background. The small 3.5-km-wide island of Tinakula is the exposed summit of a massive stratovolcano at the NW end of the Santa Cruz islands. It has a breached summit crater that extends from the summit to below sea level. Landslides enlarged this scarp in 1965, creating an embayment on the NW coast. The Mendana cone is located on the SE side. The dominantly andesitic volcano has frequently been observed in eruption since the era of Spanish exploration began in 1595. In about 1840, an explosive eruption apparently produced pyroclastic flows that swept all sides of the island, killing its inhabitants. Recorded eruptions have frequently originated from a cone constructed within the large breached crater. These have left the upper flanks and the steep apron of lava flows and volcaniclastic debris within the breach unvegetated.
Information Contacts: MIROVA (Middle InfraRed Observation of Volcanic Activity), a collaborative project between the Universities of Turin and Florence (Italy) supported by the Centre for Volcanic Risk of the Italian Civil Protection Department (URL: http://www.mirovaweb.it/); Hawai'i Institute of Geophysics and Planetology (HIGP) - MODVOLC Thermal Alerts System, School of Ocean and Earth Science and Technology (SOEST), Univ. of Hawai'i, 2525 Correa Road, Honolulu, HI 96822, USA (URL: http://modis.higp.hawaii.edu/); Copernicus Browser, Copernicus Data Space Ecosystem, European Space Agency (URL: https://dataspace.copernicus.eu/browser/).
Search Bulletin Archive by Publication Date
Select a month and year from the drop-downs and click "Show Issue" to have that issue displayed in this tab.
The default month and year is the latest issue available.
Bulletin of the Global Volcanism Network - Volume 30, Number 10 (October 2005)
Arenal (Costa Rica)
Frequent pyroclastic flows from crater C since August 2004
Endeavour Segment (Canada)
Intense earthquake swarm in February-March 2005
Lengai, Ol Doinyo (Tanzania)
Lava continues to spill over crater rim through much of 2005
Negra, Sierra (Ecuador)
Eruption ends 30 October; some lava on NE flank, more on E caldera floor
Northern EPR at 10.7°N (Undersea Features)
November 2003 visit finds evidence of very recent eruption
Pacaya (Guatemala)
Steam clouds and tremor in 2004; incandescence and lava flows in 2005
Santa Maria (Guatemala)
Partial dome collapses in 2004; explosions and ash columns in 2005
Arenal (Costa Rica) — October 2005 Cite this Report
Arenal
Costa Rica
10.463°N, 84.703°W; summit elev. 1670 m
All times are local (unless otherwise noted)
Frequent pyroclastic flows from crater C since August 2004
As described in the previous Arenal report (BGVN 29:08), on 6 July 2004 a series of pyroclastic flows descended the NE flank. These flows resulted from the collapse of the upper portions of a lava flow, and affected areas beyond those affected by pyroclastic flows during 1999-2003. Similar events have been common in recent years on the volcano's N and NE sides, as Crater C continued to emit gases, lava flows, and sporadic strombolian eruptions through 2004 and at least as late as November 2005. Throughout the period of this report (August 2004-September 2005) the lava flow that began to be emitted towards the NE flank in June 2004 remained active. Occasional blocks spalled off the N edge of the crater towards the NE. The NE and SE flanks continued to be affected by pyroclastic flows and acid rain. Crater D displayed fumarole activity from July 2004 through September 2005. The seismograph station VACR (2.9 km NE of the active Crater C) was out of service from 24 June 2004 until 20 August 2004. Table 24 summarizes the seismicity registered at VACR from August 2004 to September 2005.
Table 24. Seismic activity registered at Arenal's station VACR, August 2004 - September 2005. From 24 June to 20 August 2004 VACR was not operating. No data were reported for December 2004. Courtesy of OVSICORI-UNA.
| Month |
Eruption earthquakes |
Daily average |
LP Events |
Tremor (hours) |
Comments |
| Aug 2004 |
414 |
35 |
-- |
147 |
VACR not operating 24 Jun-20 Aug. |
| Sep 2004 |
1125 |
37 |
-- |
330 |
-- |
| Oct 2004 |
1155 |
37 |
32 |
293 |
-- |
| Nov 2004 |
584 |
34 |
-- |
153 |
-- |
| Dec 2004 |
-- |
-- |
-- |
-- |
-- |
| Jan 2005 |
540 |
22 |
5 |
357 |
VACR operated for 25 days. |
| Feb 2005 |
941 |
35 |
12 |
448 |
-- |
| Mar 2005 |
903 |
29 |
15 |
458 |
-- |
| Apr 2005 |
567 |
19 |
13 |
592 |
-- |
| May 2005 |
618 |
20 |
3 |
600 |
-- |
| Jun 2005 |
697 |
23 |
10 |
606 |
-- |
| Jul 2005 |
827 |
27 |
23 |
560 |
-- |
| Aug 2005 |
597 |
20 |
33 |
548 |
-- |
| Sep 2005 |
548 |
18 |
16 |
576 |
-- |
During July 2004-January 2005, pyroclastic flows were produced by the collapse of the active lava flow front. In August 2004 some eruptions generated ash columns higher than 500 m above Crater C.
Through most of February 2005 Arenal was hidden by storm clouds, but late in the month it could be observed that the lava flow formerly active on the NE flank had stopped, and no other active flow was seen. The number of eruptions and the amount of ejected pyroclastic material were both reduced in February, and few eruptions produced plumes as high as 500 m. The dome in Crater C continued to grow.
At the beginning of March a SW-trending lava flow was observed, and blocks were ejected to the W. During April 2005 this flow continued, and ejected blocks caused small fires in the surrounding vegetation. A new lava flow began on the SE flank, and blocks ejected to the S and SE again caused fires. In May and June 2005 the SW flow continued. In July the SW lava flow deposited blocks towards the SW, the W and the NW. The SE lava flow released small avalanches off its front and sides. Occasional eruptions produced ash columns higher than 500 m above Crater C.
In August 2005 the SE lava flow stopped. Few eruptions produced ash columns higher than 500 m above Crater C. During September 2005 the SW lava flow was active and deposited blocks to the SW, the W and the NW. The NE and SE flanks continued to be affected by the fall of pyroclastic material and acid rain.
Observatorio Vulcanológico y Sismológico de Costa Rica -Universidad Nacional (OVSICORI-UNA) reported that around 1500 on 2 November a pyroclastic flow was observed on the SE flank of Arenal. On 3 November researchers from OVSICORI-UNA visited the affected area and, contrary to what witnesses had reported, determined that the 2 November event took place on the W flank of the volcano. The mid-size pyroclastic flow produced gas, dust, and ash that were carried by strong winds towards the SE.
Despite the rainy and hazy conditions during the fieldwork it was possible to confirm the affected area and deposits. The movement of lava flows on the SW flank had been observed for the last several months. Materials descending from the summit bifurcate, covering a wide fan that ranges from the W to the SW flank. The main pyroclastic flow affected an area from the summit down to ~ 1000 m altitude. A smooth alley was carved in the steep walls of upper W flank by the transport of incandescent material. Most of the material was deposited in a distal zone 75 m wide, at the break in the steep upper cone slope.
Samples were taken from hot loose blocks spalled from the lava flow; one block was still at 154°C, and was accompanied by several other massive blocks that were fractured by rapid cooling and rough transport. There is evidence that the fine fall material was only deposited in the upper and middle part of the edifice towards the SE.
Given the sustained deposition of material in the area, visitors were advised to follow instructions and safety measures and adhere to the advice of the Park Rangers and tour guides.
Geologic Background. Conical Volcán Arenal is the youngest stratovolcano in Costa Rica and one of its most active. The 1670-m-high andesitic volcano towers above the eastern shores of Lake Arenal, which has been enlarged by a hydroelectric project. Arenal lies along a volcanic chain that has migrated to the NW from the late-Pleistocene Los Perdidos lava domes through the Pleistocene-to-Holocene Chato volcano, which contains a 500-m-wide, lake-filled summit crater. The earliest known eruptions of Arenal took place about 7000 years ago, and it was active concurrently with Cerro Chato until the activity of Chato ended about 3500 years ago. Growth of Arenal has been characterized by periodic major explosive eruptions at several-hundred-year intervals and periods of lava effusion that armor the cone. An eruptive period that began with a major explosive eruption in 1968 ended in December 2010; continuous explosive activity accompanied by slow lava effusion and the occasional emission of pyroclastic flows characterized the eruption from vents at the summit and on the upper western flank.
Information Contacts: Eliecer Duarte, Observatorio Vulcanológico y Sismológico de Costa Rica, Universidad Nacional (OVSICORI-UNA), Apartado 86-3000, Heredia, Costa Rica. (URL: http://www.ovsicori.una.ac.cr/).
Endeavour Segment (Canada) — October 2005 Cite this Report
Endeavour Segment
Canada
47.95°N, 129.1°W; summit elev. -2050 m
All times are local (unless otherwise noted)
Intense earthquake swarm in February-March 2005
At 1631 on 26 February 2005 (0031 UTC on 27 February), a hydroacoustic network detected the start of what became an intense earthquake swarm (Ridge 2000 TCS (Time Critical Studies) Oversight Committee, 2005). The source of the swarm was on the Endeavour segment of the northern Juan de Fuca Ridge (JdFR) (figure 1).
More than 3,740 earthquakes were detected over a 5.5-day period (figure 2). Event counts were as high as 50-70 per hour, which is similar in scale to event counts associated with sea-floor-spreading events on the ridge at both the Middle Valley segment in September 2001 and at the Endeavour segment in 1999. The hydroacoustic array is the Sound Surveillance System (SOSUS) of the National Oceanic and Atmospheric Administration (NOAA).
The preliminary location of the swarm's epicenters was 48°14.5'N, 128°57.6'W (figure 2), ~ 36 km NNE of the Main Endeavour vent field and a few kilometers E of the intersection of the Heck Seamounts with the JdFR axis. The sequence also produced three large earthquakes (mb 4.5, 4.8, and 4.9) detected by instruments of the National Earthquake Information Center (NEIC), the University of Washington, and the Pacific Northwest Seismograph Network (PNSN). The February-March 2005 seismic swarm also maintained an elevated, nearly constant rate of similar-magnitude earthquakes for several days, behavior consistent with magma intrusion and in contrast to the "mainshock-aftershock" sequence characteristic of tectonic events.
Research response personnel were on station by 6 March, just six days after notification of the seismic swarm, a task that often requires a lead time of over a year. Results from the response cruise indicate that it is unlikely that the February-March 2005 earthquake swarm (figure 3) induced any corresponding expression at the sea floor (i.e., eruption of a lava flow) or in the water column (i.e., formation of new hydrothermal venting, either chronic or event plumes).
In-situ and shipboard physical and chemical data from the three long tow-yo casts and seven vertical casts revealed no water-column signal that can be clearly associated with the recent earthquake swarm, whether magmatic or tectonic. Initial calculations of methane to hydrogen ratios from the Main Endeavour Field, and from Mothra, High Rise, or Salty Dawg vent fields along the Endeavour segment are comparable to historical (2003) values from vent fluids. No evidence of any temperature or optical anomalies was seen in the near-bottom camera tow data (CTD or MAPR) overlying an axial magma chamber reflector, close to the region of the February/March swarm. Camera images of the sea floor revealed no fresh basalt; rather, the entire camera tow track documented lavas with moderate to heavy sediment cover. Finally, no bathymetric anomalies were detected as the cruise scientists searched for evidence of new lava flows in the earthquake area by comparing before and after high-resolution multibeam bathymetry data. The earthquake swarm was thus thought to reflect a magmatic intrusion that failed to generate measurable changes in the sea floor or an intrusive magmatic event that did not reach sufficiently shallow crustal depths to lead to extrusion (eruptive flows) or stimulate venting at new or existing vent fields as discernable via surface-ship sampling.
References. Ridge 2000 TCS (Time Critical Studies) Oversight Committee, 2005, Recent detected events on the Juan de Fuca Ridge, Status report on time critical studies: Ridge 2000 Events, v. 3 (Spring 2005), p. 14-15.
Davis, E.E., and Currie, R.G., 1993, Geophysical observations of the northern Juan de Fuca Ridge system: Lessons in sea-floor spreading: Canadian Journal of Earth Sciences, v. 30 (2), p. 278-300.
Geologic Background. The Endeavour Segment (or Ridge) lies near the northern end of the Juan de Fuca Ridge, W of the coast of Washington and SW of Vancouver Island. The northern end is offset to the east with respect to the West Valley Segment, which extends north to the triple junction with the Sovanco Fracture Zone and the Nootka Fault. The 90-km-long, NNE-SSW-trending segment lies at a depth of more than 2,000 m and is the site of vigorous high-temperature hydrothermal vent systems that were discovered in 1981. Five major vent fields that include sulfide chimneys and black smoker vents are spaced at about 2-km intervals in a 1-km-wide axial valley at the center of the ridge. Preliminary uranium-series dates of Holocene age were obtained on basaltic lava flows, and other younger "zero-age" flows were sampled. Seismic swarms were detected in 1991 and 2005.
Information Contacts: Pacific Marine Environmental Laboratory (PMEL), National Oceanic and Atmospheric Agency (NOAA), 7600 Sand Point Way NE, Building 3, Seattle, WA 98115-6349, and Hatfield Marine Science Center, 2115 SE Oregon State University Drive, Newport, OR 97365 (URL: https://www.pmel.noaa.gov/eoi/); Robert Dziak, NOAA PMEL, Hatfield Marine Science Center, 2115 SE Oregon State University Drive, Newport, OR 97365.
Ol Doinyo Lengai (Tanzania) — October 2005 Cite this Report
Ol Doinyo Lengai
Tanzania
2.764°S, 35.914°E; summit elev. 2962 m
All times are local (unless otherwise noted)
Lava continues to spill over crater rim through much of 2005
Vigorous eruptive activity was observed in July 2004, and visitors in January 2005 noted that a new crater rim overflow area had developed along the N rim (see report and map in BGVN 30:04). The mountain guide for Martin Haigh reported on 15 May that last lava flows had occurred in March.
Activity during 3-5 July 2005. During 3-5 July 2005 Bernard Marty and others visited the crater to conduct gas sampling. His report follows.
At the time of arrival (0800 on 3 July), sporadic lava flows of the aa type were emitted from a vent at the base of T56B, which was itself disrupted by an explosion, leaving an open cavity about 15 m in diameter. The lava was flowing toward the E overflow, but never reached the crater rim. At about 1130, lava was spilling violently from T58B and flowing towards the E overflow.
Sampling had to be interrupted at T46 due to the risk of a sudden lava flood in the sampling area, a real possibility if the thin W wall of T58B fractured following thermal erosion of the wall by molten lava in the lava lake. One hundred meters S of T46, close to the base of T47, a deep hole ~ 1.5 m diameter and bordered by lava splashes emitted a piercing sound. A pahoehoe lava flow was emitting high temperature gases with no visible steam.
A lava pond, not directly observed but for which bubble explosions were clearly visible, was discharging surges of lava towards the E rim while the adjacent T58C cone, now higher than T58B, was discharging high-velocity gases that occasionally splashed lava. The eruption lasted all day and the following night, with variations from steady-state outpouring with lower degassing, to bursts of large bubbles with enhanced lava emission. By the afternoon of 4 July the lava, which was then overflowing the E slope of the volcano, ignited a bush fire. The lava emission rate was estimated at about 0.3 m3/s, with a speed of ~ 2 m/s in the flat area toward the volcano's flank.
At 0500 on 5 July lava flows suddenly invaded the mountain camp's kitchen area to a depth of one meter. Fortunately no one was hurt, but the episode illustrated that there was no safe area within the N crater.
Activity during 19 July-9 August 2005. During 19 July-9 August a team of observers led by Fred Belton camped in the inactive S crater. They submitted the following report of the active N crater as viewed from the SE crater rim.
Activity during the past year was confined to the crater's central portion. Since its initial violent eruption from a hole in the crater floor on 15 July 2004, T58C has grown to a height of ~ 12 m and is at the time of this report the second highest cone in the crater, tall and narrow with large blocks scattered about the crater floor below, indicating that it has undergone some flank collapses in the preceding months. T49B has grown significantly taller since July 2004 and is the tallest feature in the crater, rising at least 15 m above its base.
T56B, which has remained open to the SE since July 2004, has grown a small cone on its SE flank. The new cone, which has not been named because it is so high on the flank of T56B, is being undermined by a large tunnel. The tunnel begins at the SE base of the small unnamed cone and extends under it to the open vent of T56B. Clearly the tunnel was a recent active feature, and the tunnel entrance appears to be the result of collapse during or after an eruption.
T58B contained a large and deep (10-12 m) open pit, which clearly indicated the presence of past lava-lake activity at two levels. The solid crust of a former lava lake about 4 m below the rim contained a hole near its center that opened into a much deeper chamber. At some point during the night of 4 August this deeper pit was filled by lava so that only the upper level remained.
T57B appeared unchanged from July 2004 until its S half was covered by a thick layer of fused spherical lapilli from a short but powerful eruption of T58C on 20-21 July (figure 85).
Spatter cones T40, T46, T47, T51, T45, T37, T37B, and the ash cones have continued to be gradually covered by lava flows from the active cone group in the central crater. In particular, T40, which was the primary active cone during much of 1999, is now well on its way to disappearing under the lava. Lava flows from the central cone area have continued to build up the height of the mound in the central crater so that several cones are easily visible from Engare Sero village. T53 (~ 80 m NW of T40) no longer existed. A deep hole in the crater floor, just N of T47 and surrounded by recent pahoehoe flows from T58B, is possibly all that remains of the summit vent of T39. The hole was degassing at a high temperature but did not show any evidence of recent effusive activity. An area in the E part of the crater, which is sheltered by outcroppings and sometimes used by campers, had been covered by a thick flow of slabby pahoehoe lava from T58B. A large amount of vegetation on the E flank of Lengai had also been burned by lava flowing through the E-crater-rim overflow (figure 86). Several locations on the N crater rim had become crossed by small lava flows.
Table 10 shows a multi-year set of measurements of the width of crater rim overflows. The N rim overflow was first measured on 7 August 2005.
Table 10. Measurements of the widths of lava overflowing the crater rim at Ol Doinyo Lengai. The values represent the arc length of the crater rim covered by lava flows on the various dates. Measurements were made by pacing the distance several times and averaging the results. The dashes mean that the overflow had not yet come into existence on the date indicated. The lengths of the flows beyond the crater rim are not shown on this table. Courtesy of Fred Belton and Chris Weber.
| Date |
NW overflow width |
E overflow width |
W overflow width |
N overflow width |
| Jul 2000 |
60 m |
38 m |
-- |
-- |
| 23 Jul 2001 |
106 m |
38 m |
-- |
-- |
| 05 Aug 2002 |
135 m |
39 m |
12 m |
-- |
| 02 Aug 2003 |
135 m |
44 m |
17 m |
-- |
| 07 Jul 2004 |
135 m |
44 m |
17 m |
-- |
| 16 Jul 2004 |
135 m |
47 m |
17 m |
-- |
| 07 Aug 2005 |
135 m |
72 m |
20 m |
~1 m at each of three locations |
Although there was no activity on 19 July, an unobserved eruption may have begun around 2300 on 20 July and probably ended by 0130 on 21 July, according to reports by a camping group in the W portion of the crater floor. The activity reached its peak between 0100 and 0130 and involved strong lava fountains from a vent about halfway up the E side of T58C. The fountains deposited a deep (at least 0.5 m) bed of lapilli around the base and on the S flank and top of cone T57B, and sent pahoehoe and aa flows to the E. One of the flows traveled tens of meters down Lengai's E slopes. The lapilli consisted mostly of hollow spheroids with diameters up to 1.2 cm. Many of the lapilli were fused, and sections of the field broke apart under their own weight, leaving a blocky, fissured surface.
On 21 July at 1511 lava flowed from T58B's active vent during a 12-minute eruption. At 2100 on the same day a third eruption sent strong surges of lava from the same vent and continued throughout the night. Atmospheric clouds prevented detailed observations, but clear conditions at 0500 on 22 July revealed that a large lava channel had formed just E of T58B and had been thermally eroded to a depth of more than one meter. Maximum flow rate during the eruption was estimated to be 0.5 m3/s. The eruption continued until about 1800 and deposited pahoehoe flows over a large part of the SE crater floor.
With the exception of a very minor lava flow from T58C at 1930 on 26 July and the brief (unobserved) appearance of a lava lake in T58B on the night of 4 August, no further activity occurred through 9 August. There were frequent sounds of lava at depth near the base of T58C and inside the open vent of T58B. The lava lake that briefly occupied T58B filled up its deep inner pit and then solidified, leaving a flat surface of new lava about 4 m below the lowest place on the cone's rim. During 4-9 August lava could be heard moving near the surface somewhere inside T58B's vent, but it never became visible. Observations ended at 0800 on 9 August 2005.
Activity during September and October 2005. Kees DeJong reported the following, which was posted on Belton's website: "We climbed Oldonyo Lengai 13 September 2005, arriving at the crater rim [at 0710]. Tourists that had camped in the crater said that eruptions began at midnight (and that there were no eruptions the previous days). Lava kept flowing until about [0846]; we left the crater at [1300] that day."
Photos that Kees made indicated that lava was flowing from about halfway up the side of T48B and across the crater floor toward the W, but that it was not a particularly large eruption. Earlier, probably on 11 September, a small amount of lava flowed down the N flank of T49B and a short distance across the crater floor. Other photos indicated (by comparing specific lava flows on the crater floor with the same lava flows in 7 August photos) a high probability that there were no lava flows at all between 9 August and 11 September. On 19 September Burra Gadiye reported to Roger Mitchell that he had seen no activity that day.
Anatoly Zaytsev climbed on 30 September and reported that they did not see eruptive activity during their visit (between 1100 and 1500). They did see some natrocarbonatite lavas with estimated ages of 2-3 weeks. These were probably the flows from 13 September described above.
Following a visit during 1-3 October, Jaco de Borst reported the following. "During the first of October there was also no activity, only 'smoke' from several cones and cracks. On the second of October there were several 'small' eruptions. In daylight and at night, the cone that was erupting was the biggest and close to the overflow where the trail reaches the crater. Lava only reached the foot of the cone [Belton noted that he was describing T49B]. We left in the morning of 3 October, I think at about 1000. When we left there was no activity... [other] than some noise and 'smoke.' The night eruptions we saw... I think [occurred] about 5 o'clock in the morning [on 3 October]."
Geologic Background. The symmetrical Ol Doinyo Lengai is the only volcano known to have erupted carbonatite tephras and lavas in historical time. The prominent stratovolcano, known to the Maasai as "The Mountain of God," rises abruptly above the broad plain south of Lake Natron in the Gregory Rift Valley. The cone-building stage ended about 15,000 years ago and was followed by periodic ejection of natrocarbonatitic and nephelinite tephra during the Holocene. Historical eruptions have consisted of smaller tephra ejections and emission of numerous natrocarbonatitic lava flows on the floor of the summit crater and occasionally down the upper flanks. The depth and morphology of the northern crater have changed dramatically during the course of historical eruptions, ranging from steep crater walls about 200 m deep in the mid-20th century to shallow platforms mostly filling the crater. Long-term lava effusion in the summit crater beginning in 1983 had by the turn of the century mostly filled the northern crater; by late 1998 lava had begun overflowing the crater rim.
Information Contacts: Christoph Weber, Volcano Expeditions International, Muehlweg 11, 74199 Untergruppenbach, Germany (URL: http://www.v-e-i.de/); Celia Nyamweru, Department of Anthropology, St. Lawrence University, Canton, NY 13617, USA (URL: http://blogs.stlawu.edu/lengai/); Frederick Belton, Developmental Studies Department, PO Box 16, Middle Tennessee State University, Murfreesboro, TN 37132, USA (URL: http://oldoinyolengai.pbworks.com/); Bernard Donth, Waldwiese 5, 66123 Saarbruecken, Germany.
Sierra Negra (Ecuador) — October 2005 Cite this Report
Sierra Negra
Ecuador
0.83°S, 91.17°W; summit elev. 1124 m
All times are local (unless otherwise noted)
Eruption ends 30 October; some lava on NE flank, more on E caldera floor
Our last report (BGVN 30:09) described the first five days of this eruption, and was taken largely from a valuable joint report of Ecuador's Instituto Geofísico and Parque Nacional Galápagos. Here we report information from several sources on these topics: (a) initial observations of the eruption, (b) caldera-floor deformation prior to the eruption, (c) observations of the eruption's progress during 26 to 30 October (when it ended), and (d) satellite infrared observations of thermal fluxes associated with the eruption.
Eruption's start and subsequent plumes. As noted previously (BGVN 30:09), the eruption began around 1730 on 22 October 2005, when an explosion was heard by many residents of the volcano's S flank. Satellite images showed no activity at 1715, but revealed a large eruption at 1745 local time (2345 UTC). The eruption cloud reached an estimated altitude of at least 15 km (50,000 ft) and was moving SW.
At about this time, passengers and crew on Lindblad Expeditions' 80 passenger vessel M/N Polaris had an excellent view of the eruptive plume (figure 5). Lucho Verdesoto, the expedition leader, reported that the ship was then at Cerro Dragon, Santa Cruz island. Sunset was at 1753. As night fell they sailed to a position ~ 18 km NE of the volcano, where they had clear views of flows descending the volcano's upper NE flank (figure 6).
Naturalist Carman Guzman wrote, "After sunset the show was fascinating so we decided to move the Polaris to a much closer location. After dinner, we were only eleven miles from the eruption itself. What a thrill! The darkness of the night enhanced the beauty of the fiery reds and oranges that were seen at the top of the caldera. We spent several hours enjoying this rare and fantastic event. Rivers of lava were running down the slopes of the volcano and enormous flames were lighting up the sky."
According to NASA MODIS imagery and VAAC/NOAA reports, on 25 October 2005 a large plume of gases and steam was observed in GOES 12 imagery for 1545 local time (2145 UTC). The plume extended ~ 460 km W and SW of the summit at an altitude of ~ 4.6 km. Figure 7 shows the average concentration of SO2 over the Sierra Negra plume as imaged by NASA's Aura satellite for the period 23 October-1 November.
Deformation monitoring. In the early stages of this eruption, Bill Chadwick (NOAA) submitted a report on pre-eruption deformation (figure 8). The plot shows both Synthetic Aperture Radar (InSAR) and GPS data on vertical deformation of the caldera floor. Chadwick wrote that he, Dennis Geist (University of Idaho), and Dan Johnson (University of Puget Sound, recently deceased) installed a 27 station GPS network at Sierra Negra in 2000, that was reoccupied in 2001 and 2002 (Geist and others, in press). With help from UNAVCO (a consortium supporting high-precision deformation measurements), the group then added a 6-station, continuous GPS network in 2002. Since then, there occurred a change from caldera subsidence to caldera uplift in March 2003. During this uplift, an M 4.6 earthquake on 16 April 2005 marked trapdoor faulting. The continuous GPS network measured a surface displacement of 85 cm within 10 seconds. Both this event and the previous case of trapdoor faulting in 1997-8-documented by satellite measurements using Interferometric Synthetic Aperture Radar (InSAR) (Amelung and others, 2000)-were preceded by over a meter of inflation (Jónsson and others, 2005). Both the 1997-98 and 2005 trapdoor movements occurred along the caldera floor's S side.
Aside from its immediate affects, the April 2005 earthquake left the later inflation rate unchanged. Caldera-centered uplift has continued since then without pause at about the same high rate. During the interval from March 2002 to April 2005 there was about ~ 1.2 m of uplift. Rates after the April 2005 earthquake are not plotted but were roughly the same as those during the interval March 2002-April 2005. The only other large earthquakes at Sierra Negra in the last year were an M 4.0 on 23 February 2005, which was associated with a small (2 cm) displacement near the trapdoor fault, an M 4.6 on 19 September 2005 that caused no obvious displacements, and an M 5.5, just 3 hours before the 22 October eruption started. The GPS data has not yet been processed.
Field descriptions of the eruption. The eruption began on 22 October with venting along a 2-km fissure near the caldera's N rim (figure 6). The fissure descended the caldera's inner wall at its E end. Flows were fed both northward down the outer N flank and southward onto the NE caldera floor. Although flows reached 5 km down the outer flank, flow into the caldera soon dominated, with strong channels descending inner caldera slopes before combining to form a wide aa flow banked against the caldera's E wall and moving steadily southward (see figures and discussion, BGVN 30:09).
Figure 9 is a photo taken by Greg Estes on 24 October. It highlights the vigorous venting and intracaldera flows at that point in the eruption. Figure 10, a post-eruption satellite photo, illustrates the broad pattern of still-cooling, erupted lavas (which appear as light colored areas on this 2 November thermal-infrared image). Although this may represent the best overview of the new lavas at this time, some of the thinnest flows or chilled flow features may not appear on this image.
By 26 October, fissure activity had narrowed to one major vent very near the N rim, but at 0830 on the 27th, eyewitness Godfrey Merlin reported that a second vent opened downslope and SE of the first. This new vent did not diminish the activity of the first, meaning that the total flux of erupting lava nearly doubled.
By about 1400 on the 27th, a team including Dennis Geist (University of Idaho), Terry Naumann (University of Alaska), and Karen Harpp (Colgate University) had arrived at the E caldera rim and began sending back a series of valuable reports. Their first report noted a major vent immediately below GPS station SN12 on the rim NE of the caldera's center. This vent emitted a large intracaldera aa flow.
Some active N-flank vents stood about 300-400 m NW of a station (GV01) on the caldera's N rim . There, two major vents fed lava fountains up to 50 m high. Most lava being erupted was flowing into the caldera, although some of the scoria from the fountains was falling outside the caldera and then forming a short, sluggish flow. Lava inside the caldera was cascading from the vents down the slope on the N edge of the caldera in 3 main channels, each 30-40 m across, with lava flowing at ~10 m/s (36 km/h) and in some cases over 10 m/s, and coalescing into a major aa flow to the S. On the caldera floor these channels merged into one big aa channel about 100 m wide that flowed more slowly both to the S, clockwise along the base of the E caldera wall, and into the moat along the S edge of the caldera floor. Pahoehoe outbreaks occurred along the margins of the major aa flow. New aa lava covered an estimated one-third of the caldera floor.
The report for 28 October noted that the eruption was still going strong. There were no significant new events on this day, but it appeared that the lava flux had increased because the vents looked wider and there seemed to be a lot more gas emitted. The lava continued to feed from the vents to the caldera floor in two large streams, each ~ 20 m across with lava traveling at 5-10 m/s, adding up to probably hundreds of millions of cubic meters of lava per day. The aa field continued to grow. The group reached the caldera floor and were able to sample both lava and tephra.
By 0700 on the 29th some of the vents had shut down and the two lava channels to the W (previously fed by the upper vent) stopped moving. The lower vent still emitted lava and fed one channel E of the others. The team estimated the channel to be ~10 m wide and moving ~5 m/s. Assuming a 2-m depth, the lava flux was 5 to 10 million cubic meters per day, about half that seen the morning of the 29th.
The emission rate continued to diminish throughout the 29th and by the evening it was only 10-20% of that seen on the 28th. In addition, the amount of gases emitted decreased such that the gas plume only rose ~1 km, whereas earlier plumes had risen to several kilometers. The lower vent was no longer fountaining continuously as it had on the 28th; instead the fountaining came in bursts at intervals of about 1-30 seconds. A lava lake sloshed around in the lower vent's crater; some lava escaped this crater along a breach in the crater rim. The upper vent (the one that shut off) was still incandescent with a lot of gas coming out, so it was possible that there was a lava lake there too.
The eruption appeared to end on the 30th. Glow was observed at 0200, but had ceased by 0400. The vents still emitted gas, but not fresh lava. However, it was possible that there was still N-flank activity. There were reports of lava flows there, and while it was certain that at least some of these flows were clastogenic (composed of spatter from fire fountains that accumulated and then began to flow), it was uncertain whether there were also actively erupting flank vents. The team remained separated from this area by hot lava, thwarting reconnaissance. Initial estimates of the coverage of the caldera floor were an area of ~14 km2. Assuming a 3-4 m average flow thickness, this was ~0.05 km3 (50,000,000 m3) of lava. There were obviously high error bars on this estimate, but it was clearly much less than the ~1 km3 extruded in the 1979 eruption.
MODVOLC Thermal Alerts. A large set of thermal hotspots in multispectral imagery was observed beginning late 22 October (local time and date) and continuing through 16 November 2005 (figure 11). Although MODVOLC data were missing for some days and reduced for others (presumably due to cloud cover screening the radiation from the satellite) these hot-spot pixels dramatically document the course of the eruption. Data on figure 11 appear consistent with in situ observations, in that by the second day, lava was at least 5 km down the outer N slope and covering much of the E caldera floor. By the 8th day (30 October), the outer slope flows had cooled significantly, but flows inside the caldera had continued their clockwise advance, filling all low points to the extreme SW corner of the caldera. Ten days later (9 November), the eruption had ended and only flows from the vents to the SE caldera floor were still emitting detectable heat. The last pixels observed, two above the original vent area on the N rim, were on 16 November.
References. Amelung, F., Jónsson, S., Zebker, H., and Segall, P., 2000, Widespread uplift and 'trapdoor' faulting on Galápagos volcanoes observed with radar interferometry: Nature, v. 407, p. 993-996.
Geist, D.J., Chadwick, W.W., Jr., and Johnson, D.J., in press, Results from new GPS monitoring networks at Fernandina and Sierra Negra volcanoes, Galápagos, 2000-2002: Journal of Volcanology and Geothermal Research (in press).
Jónsson, S., H. Zebker, and F. Amelung, 2005, On trapdoor faulting at Sierra Negra volcano, Galápagos; Journal of Volcanology and Geothermal Research, v. 144, p. 59-71.
Geologic Background. The broad shield volcano of Sierra Negra at the southern end of Isabela Island contains a shallow 7 x 10.5 km caldera that is the largest in the Galápagos Islands. Flank vents abound, including cinder cones and spatter cones concentrated along an ENE-trending rift system and tuff cones along the coast and forming offshore islands. Although it is the largest of the five major Isabela volcanoes, it has the flattest slopes, averaging less than 5° and diminishing to 2° near the coast. A sinuous 14-km-long, N-S-trending ridge occupies the west part of the caldera floor, which lies only about 100 m below its rim. The Volcán de Azufre fumarolic area lies within a graben between this ridge and the west caldera wall. Lava flows from a major eruption in 1979 extend all the way to the north coast from circumferential fissure vents on the upper northern flank.
Information Contacts: Lucho Verdesoto and Carman Guzman, M/NPolaris, Galápagos Islands, Ecuador; Francisco Dousdebes, Galápagos Expedition Manager, Metropolitan Touring, Ecuador; Lindblad Expeditions (URL: http://www.expeditions.com/); U.S. National Aeronautical and Space Administration (NASA) (URL: http://earthobservatory.nasa.gov/); Bill Chadwick, Cooperative Institute for Marine Resources Studies (CIMRS), National Oceanic and Atmospheric Agency (NOAA) Pacific Marine Environmental Laboratory (PMEL), Oregon State University, 2115 SE OSU Drive, Newport, OR 97365, USA; Dennis Geist, Department of Geological Sciences, University of Idaho, Moscow, ID 83844-3022 USA; Terry Naumann, Department of Geology, University of Alaska at Anchorage, Anchorage, AK 99598, USA (URL: https://www.uaa.alaska.edu/academics/college-of-arts-and-sciences/departments/geology/); Karen Harpp, Department of Geology, Colgate University, 408 Lathrop Hall, Hamilton, NY 13346, USA (URL: http://www.colgate.edu/facultysearch/FacultyDirectory/karen-harpp); MODVOLC Alerts Team, Hawaii Institute of Geophysics and Planetology (HIGP), University of Hawaii at Manoa, 1680 East-West Road, Post 602, Honolulu, HI 96822, USA (URL: http://modis.higp.hawaii.edu/).
Northern EPR at 10.7°N (Undersea Features) — October 2005 Cite this Report
Northern EPR at 10.7°N
Undersea Features
10.73°N, 103.58°W; summit elev. -2900 m
All times are local (unless otherwise noted)
November 2003 visit finds evidence of very recent eruption
In a recent publication, Rubin and van der Zander (2005) discuss radiometric methods for dating lavas as one means to establish eruption chronologies. Some of their techniques were applied to samples of fresh lava (erupted September-October 2003) found on the East Pacific Rise (EPR) at 10°44'N (Voight and others, 2004). This location lies ~ 1,900 km WNW of the Galápagos Islands. During a November 2003 biological sampling visit to the EPR at 10°44'N, divers in the submersible Alvin expected to be revisiting an established hydrothermal vent field. Instead, they found indicia all of which were consistent with a recent eruption, notably fresh lava, bacterial mats, and diffuse snow- blower vents issuing from lava collapses. The team acted immediately after the cruise by sending the lava samples to the University of Hawai`I for dating. Researchers there determined that an eruption had occurred within 1 to 2 months prior to the site visit. A hydrophone array (designated N-EPR) nominally monitored this part of the EPR since 1996, but not in real time. Unfortunately, the system failed to record data during the 2002-2004 interval due to a hardware problem.
Ages for lavas erupted within the past 1.5-2 years were determined with the 210Po-210Pb dating method (Rubin and others, 1994). To use this method, analyses should begin as soon as possible after samples are collected from suspected eruption locales. Radioactive disequilibrium is largest, and temporal resolution of the method is highest, immediately following eruption. According to Rubin and van der Zander (2005, p. 28) "Polonium is volatile at magmatic temperatures and degasses from magmas when they erupt. This creates an initial 210Po (half-life = 138.4 day) deficit relative to grand parental 210Pb in freshly erupted magmas. This deficit is subsequently erased with time via radioactive ingrowth toward secular equilibrium."
References. Rubin, K.H., Macdougall, J.D., and Perfit, M.R., 1994, 210Po-210Pb dating of recent volcanic eruptions on the seafloor: Nature, v. 368, p. 841-844.
Rubin, K., and van der Zander, I., 2005, Obtaining high-resolution chronologies of submarine lava eruptions: Better dating through radiochemistry: Ridge 2000 Events, v. 3 (Spring 2005), p. 28-30.
Voight, J. R., Zierenberg, R.A., McClain, J., and the Science Party: Batson, P., Beers, K., Daly, M., Dushman, B., Gollner, S., Govenar, B., Haney, T.A., Hourdez, S., Liow, L.H., Parker, C., Von Damm, K., Zekley, J., and Zelnio, K.A., 2004, FIELD cruise to the northern EPR: Discoveries made during biological investigations from 8°37'N to 12°48'N: Ridge 2000 Events, v. 2(1), p. 22-24.
Geologic Background. Divers in the submersible Alvin discovered an extremely fresh lava flow in an unexpected location at 10°44'N on the East Pacific Rise during an expedition in November 2003. The young flow was covered by bacterial mats, had large amounts of bacterial floc ("snow-blowers") issuing from diffuse vents, and was sparsely populated by small animals. Uranium-series dating indicated that the eruption had taken place within a time window only a few months to weeks prior to the observations. This segment of the East Pacific Rise, located just north of the Clipperton Transform Fault, is an area with an estimated low magma production rate.
Information Contacts: K. H. Rubin, Department of Geology and Geophysics, SOEST, University of Hawai`I, 1680 East West Road, Honolulu, HI 96822, USA.
Pacaya (Guatemala) — October 2005 Cite this Report
Pacaya
Guatemala
14.382°N, 90.601°W; summit elev. 2569 m
All times are local (unless otherwise noted)
Steam clouds and tremor in 2004; incandescence and lava flows in 2005
Frequent steam plumes through 2002 and 2003 indicated that Pacaya was active, although incandescence from the long-term lava lake ended after June 2001. During the latter half of October 2003 constant steam and abundant emissions of water and gas were being blown to the NNW and W of the volcano (BGVN 28:10). All of the following information is derived from the reports of Instituto Nacional de Sismologia, Vulcanologia, Meteorologia e Hydrologia (INSIVUMEH).
Throughout November and December 2003 and the first half of 2004, abundant clouds and columns of white and off-white gases and steam were expelled from Pacaya, generally reaching less than 400 m above the volcano and dispersing mostly to the W and SW; these were occasionally visible from Guatemala City, 30 km to the NNE.
During June, July, and August 2004, near-continuous tremor and frequent long-period earthquakes were recorded at seismograph station PCG (~ 1.4 km to the W of Pacaya). On 14 June, weak incandescence was observed in the central crater of MacKenney Cone for the first time since August 2000. Pacaya continued to expel off-white smoke and/or steam which usually drifted to the S and SW and rose to 150-300 m above the volcano. On 19 July, ejection of small lava fragments began to form a cone in the bottom of the central crater of MacKenney Cone.
During September-November 2004, tremor increased somewhat (from ~ 2mm in June, July, and September to 4-7 mm in December), and white steam and/or gas plumes rose 300-500 m above MacKenney Cone. Incandescence was observed throughout this time and lava clasts were expelled from the MacKenney Cone on 7-9 December.
On 3 January 2005, small expulsions of incandescent lava clasts rose from the central crater, and a narrow lava flow from the S rim of the crater reached 75-100 m down the flank. Station PCG continued to register tremor, and incandescence and white plumes persisted. On 10 January, lava flowed ~ 30 m from the SW rim of the central crater of MacKenney Cone. On 12 January, two lava flows, one to the S ( ~ 125 m) and one to the SW (~ 50 m) left the central crater. Observers saw incandescent lava fragments rising <10 m above the mouth of the intra-crater cone, and "smoke" whiffs rising from the MacKenney Cone. During the last 5 days of January 2005, numerous small lava flows descended the S and SW flanks of the volcano.
During February, March, and April 2005, incandescence, tremor, and minor lava flows continued. On 2 February observers reported that avalanches from the lava flow fronts during the previous days formed a debris fan covering about 2/3 of the SW flank. On 28 February expulsion of incandescent lava fragments reached heights of 10-50 m for brief periods. On 1 March INSIVUMEH recommended that park officials prevent tourists from climbing Pacaya because of avalanches, lava expulsion, and gas emissions. In March and April explosions of lava reached 100 m in height, and smoke/gas emissions continued.
Lava emission continued during May. On 4 May, three flows were active, extending up to 100 m down the SW flank and 150 m W in the direction of Cerro Chino. On 9 May two active flows from the base of the intracrater cone reached 200 m down the W flank. Plumes from the MacKenney Cone rose as high as 800 m above the crater. Ejection of incandescent material continued throughout the month. Lava flows moving to the SW and W in the direction of Cerro Chino reached lengths of 150-250 m.
During early June, incandescent lava clasts were ejected as high as ~ 75 m above Pacaya's crater. An intra-crater lava flow extended ~ 300 m from the SW base of the central cone. On 6 June, a lava flow traveled ~ 200 m down the volcano's W flank. By 27 June a lava flow extended ~ 300 m down the SW flank. A white steam column rose ~ 150 m over the central crater and drifted SW. Incandescent lava expulsions reached heights of 15-50 m. On the night of 27 June two rivers of lava, 75 and 150 m long, were observed in front of Cerro Chino. Constant expulsions of pyroclastic material rose 20-30 m above the crater.
Lava flows in July traveled 200-300 m down the SW flank. Small plumes emitted from the volcano's central crater rose to low altitudes. Avalanches of incandescent volcanic blocks produced small ash clouds to low levels.
During 7-11 September, occasional Strombolian activity occurred. Volcanic bombs from two craters rose up to 30 m above their rims. Incandescence from lava flows on the SE flank was visible on several nights.
Geologic Background. Eruptions from Pacaya are frequently visible from Guatemala City, the nation's capital. This complex basaltic volcano was constructed just outside the southern topographic rim of the 14 x 16 km Pleistocene Amatitlán caldera. A cluster of dacitic lava domes occupies the southern caldera floor. The post-caldera Pacaya massif includes the older Pacaya Viejo and Cerro Grande stratovolcanoes and the currently active Mackenney stratovolcano. Collapse of Pacaya Viejo between 600 and 1,500 years ago produced a debris-avalanche deposit that extends 25 km onto the Pacific coastal plain and left an arcuate scarp inside which the modern Pacaya volcano (Mackenney cone) grew. The NW-flank Cerro Chino crater was last active in the 19th century. During the past several decades, activity has consisted of frequent Strombolian eruptions with intermittent lava flow extrusion that has partially filled in the caldera moat and covered the flanks of Mackenney cone, punctuated by occasional larger explosive eruptions that partially destroy the summit.
Information Contacts: Instituto Nacional de Sismologia, Vulcanologia, Meteorologia e Hydrologia (INSIVUMEH), 7a Av. 14-57, Zona 13, Guatemala City, Guatemala (URL: http://www.insivumeh.gob.gt/); Washington Volcanic Ash Advisory Center (VAAC), Satellite Analysis Branch (SAB), NOAA/NESDIS E/SP23, NOAA Science Center Room 401, 5200 Auth Road, Camp Springs, MD 20746, USA (URL: http://www.ospo.noaa.gov/Products/atmosphere/vaac/).
Santa Maria (Guatemala) — October 2005 Cite this Report
Santa Maria
Guatemala
14.757°N, 91.552°W; summit elev. 3745 m
All times are local (unless otherwise noted)
Partial dome collapses in 2004; explosions and ash columns in 2005
Prior to the period covered by this report, recent activity at Santa María was characterized by weak-to-moderate explosions producing ash, crater-rim collapses and avalanches of block lava and ash, pyroclastic flows, and an active lava flow (BGVN 28:10). Activity was similar from October 2003 to June 2004, consisting mostly of explosions from Santiaguito, a lava-dome complex that includes the Caliente vent. The explosions produced ash plumes, and there were numerous block-lava-and-ash avalanches from Caliente collapses (BGVN 29:06). From July 2004 until October 2005, these types of activity continued.
Activity during July-September 2004. During July to September 2004, weak-to-moderate explosions at Santiaguito produced plumes to a maximum height of ~ 1.5 km above the volcano. Frequent avalanches of volcanic material including blocks and ash traveled SE and SW down Caliente cone. In early September 2004, several weak-to-moderate explosions produced ash clouds to a maximum height of 2 km above the volcano. Partial collapses of the lava dome caused pyroclastic flows to travel down the volcano's NE and SW flanks. On 27 September, several avalanches of volcanic material from active lava-flow fronts traveled SW.
Activity during October 2004. During October 2004 moderate explosions produced ash-and-gas plumes that rose to a maximum altitude of 9 km. Explosions on 4 October produced small pyroclastic flows to the SW. On 11 October, a partial lava-dome collapse to the SW produced a pyroclastic flow that traveled toward the Nimá Segundo River. An ash cloud formed that rose to a height of ~ 500 m and covered most of the dome complex. The collapse was preceded by an explosion that produced an ash-and-gas cloud to ~ 1.5 km above the volcano. Small explosions on 12 October produced small lava-dome collapses to the SW that generated avalanches of lava blocks and ash.
Small lahars traveled down San Isidro ravine on 14 and 15 October. A small collapse of the SW edge of the lava dome in the Caliente crater produced a pyroclastic flow on 17 October. The flow traveled down the S flank and produced a steam-and-ash plume to a height of ~ 800 m upon contact with dammed water. Instituto Nacional de Sismologia, Vulcanologia, Meteorologia, e Hidrologia (INSIVUMEH) reported that this collapse, like those that occurred on previous days and weeks, was associated with a new cycle of magmatic injection. The Washington VAAC reported that hot spots and plumes possibly containing ash were occasionally visible on satellite imagery on 21 October; imagery on 31 October showed a possible ash-bearing plume at ~ 4.5 km altitude.
Activity during November 2004. During November, weak-to-moderate explosions produced gas-and-ash plumes to ~ 1 km above the volcano. Many explosions were accompanied by block-and-ash avalanches from the NE and SW edges of Caliente dome. The Washington VAAC reported that satellite imagery on 3 November showed a possible ash-bearing plume at a height of ~ 5 km altitude. On 12 November, the collapse of a small sector of the SW edge of the Caliente dome produced a pyroclastic flow. On 14 November at 2012, a tectonic earthquake caused a lava-flow collapse SW of the Caliente dome, triggering a pyroclastic flow that descended to the head of San Isidro ravine, an area of abundant accumulation of pyroclastic material and a known area for lahar initiation. During December, weak-to-moderate explosions produced plumes to a maximum height of 1.3 km above the crater. Frequent block-lava avalanches traveled down the SW flank of Caliente dome. A moderate explosion on 4 December caused a partial lava-dome collapse and a pyroclastic flow that traveled SW. On 22 December small collapses occurred from lava-flow fronts on the SW side of Caliente dome. According to the Washington VAAC, ash plumes were visible on satellite imagery on several days during 22-27 December.
Activity during January-October 2005.During January 2005, frequent explosions (table 2) produced columns of gray and white ash up to 2 km in height, ash fall in towns near the volcano and frequent blocky avalanches. Early in the month, avalanches of incandescent blocks were released from lava flow fronts towards the NE and SE flanks of Santiaguito.
Table 2. Explosions recorded at the Santiaguito cone of Santa María in January 2005. Missing dates were not reported. Courtesy of INSIVUMEH.
| Date |
Number of Explosions |
| 04 Jan 2005 |
93 |
| 07 Jan 2005 |
62 |
| 10 Jan 2005 |
31 |
| 11 Jan 2005 |
20 |
| 12 Jan 2005 |
14 |
| 13 Jan 2005 |
13 |
| 14 Jan 2005 |
15 |
| 24 Jan 2005 |
16 |
| 25 Jan 2005 |
56 |
| 26 Jan 2005 |
16 |
| 27 Jan 2005 |
52 |
| 28 Jan 2005 |
65 |
During February 2005, frequent explosions and avalanches continued. On 10 February 2005 the Washington VAAC reported that satellite imagery showed a plume of ash and steam moving SW from the summit and ash extending 55 km after an eruption around 0645. A continuous plume of ash and steam was emitted after an eruption around 0745 and ash extended around 230 km from the summit moving at 2-50 km/hour.
During March 2005, several weak-to-moderate explosions produced ash plumes to a maximum height of ~ 1.3 km above the dome. Avalanches of volcanic blocks traveled down the E and SW flanks of Caliente dome. On 16 March, small amounts of fine ash fell in Xepax, Xecavioc, Llanos de Pinal, Las Majadas, and Quetzaltenango. During 19-20 March, ash fell to the E in the town of Zunil.
During 21-25 April several explosions at Santiaguito produced ash plumes that rose to ~ 1.2 km above the dome. Lava avalanches occurred down the SW flank of Caliente dome. Explosions on 25 April produced pyroclastic flows that traveled S down Caliente.
Continuing explosive activity from Santiaguito during 4-9 May sent ash columns as high as 1.3 km above the vent. Small collapses at the Caliente dome generated pyroclastic flows 500-3,000 m long. Constant avalanches were reported on 10 May from the lava-flow front and the Caliente dome, along with one small ash explosion. Minor explosions on 13 May sent gray ash plumes 400-600 m high. Avalanches from the SW-flank lava flow continued. Explosions during 17-20 May produced ash clouds to ~ 1 km above the volcano; ash fell 7-10 km from Caliente dome.
During the first week of June 2005, moderate explosions produced plumes that rose to ~ 1.2 km above the volcano. On 2 June, the partial collapse of the lava dome in the crater of Caliente dome generated a pyroclastic flow that traveled ~ 4 km SW. On 22-24 June explosion columns reached ~ 900 m above the crater and extended several kilometers to the SSW and W. On 27 June, in the region of Palajunoj on the SW flank, constant avalanches of lava blocks were observed. During 6-18 July, weak-to-moderate explosions continued , with plumes rising to ~ 1.3 km above the volcano. Throughout July avalanches of volcanic material were produced at the front of an active lava flow, and from the SW edge of Caliente dome.
August and early September reports were unavailable, but during 7-11 September, small-to-moderate explosions at Santiaguito produced plumes that rose to a maximum height of ~ 1.5 km above the volcano on 8 September. On 7 September, a moderate lahar traveled down the volcano's flank. About a dozen pyroclastic flows, and avalanches of volcanic material occurred from the SW edge of the lava dome, and from the front of lava deposits on the SW flank of Caliente dome.
On 26 October 2005 a small eruption produced an ash plume that drifted SW to the Pacific and was recorded on MODIS satellite imagery (figure 33). The Washington VAAC reported a hot spot that lasted for about 6 hours with an estimated plume height of 4.5 km. On 28 October a plume rose to an altitude of ~ 4.9 km.
Geologic Background. Symmetrical, forest-covered Santa María volcano is part of a chain of large stratovolcanoes that rise above the Pacific coastal plain of Guatemala. The sharp-topped, conical profile is cut on the SW flank by a 1.5-km-wide crater. The oval-shaped crater extends from just below the summit to the lower flank, and was formed during a catastrophic eruption in 1902. The renowned Plinian eruption of 1902 that devastated much of SW Guatemala followed a long repose period after construction of the large basaltic andesite stratovolcano. The massive dacitic Santiaguito lava-dome complex has been growing at the base of the 1902 crater since 1922. Compound dome growth at Santiaguito has occurred episodically from four vents, with activity progressing E towards the most recent, Caliente. Dome growth has been accompanied by almost continuous minor explosions, with periodic lava extrusion, larger explosions, pyroclastic flows, and lahars.
Information Contacts: Instituto Nacional de Sismologia, Vulcanologia, Meteorologia e Hidrologia (INSIVUMEH), Unit of Volcanology, Geologic Department of Investigation and Services, 7a Av. 14-57, Zona 13, Guatemala City, Guatemala (URL: http://www.insivumeh.gob.gt/); Washington Volcanic Ash Advisory Center (VAAC), Satellite Analysis Branch (SAB), NOAA/NESDIS E/SP23, NOAA Science Center Room 401, 5200 Auth Road, Camp Springs, MD 20746, USA (URL: http://www.ospo.noaa.gov/Products/atmosphere/vaac/); NASA Earth Observatory (URL: http://earthobservatory.nasa.gov/).