Recently Published Bulletin Reports
Erebus (Antarctica) Lava lake remains active; most thermal alerts recorded since 2019
Rincon de la Vieja (Costa Rica) Frequent phreatic explosions during July-December 2023
Bezymianny (Russia) Explosion on 18 October 2023 sends ash plume 8 km high; lava flows and incandescent avalanches
Kilauea (United States) Low-level lava effusions in the lava lake at Halema’uma’u during July-December 2022
Nyamulagira (DR Congo) Lava flows and thermal activity during May-October 2023
Bagana (Papua New Guinea) Explosions, ash plumes, ashfall, and lava flows during April-September 2023
Mayon (Philippines) Lava flows, pyroclastic flows, ash emissions, and seismicity during April-September 2023
Nishinoshima (Japan) Eruption plumes and gas-and-steam plumes during May-August 2023
Krakatau (Indonesia) White gas-and-steam plumes and occasional ash plumes during May-August 2023
Villarrica (Chile) Strombolian activity, gas-and-ash emissions, and crater incandescence during April-September 2023
Merapi (Indonesia) Frequent incandescent avalanches during April-September 2023
Ebeko (Russia) Moderate explosive activity with ash plumes continued during June-November 2023
Erebus (Antarctica) — January 2024  Cite this Report
Erebus
Antarctica
77.53°S, 167.17°E; summit elev. 3794 m
All times are local (unless otherwise noted)
Lava lake remains active; most thermal alerts recorded since 2019
The lava lake in the summit crater of Erebus has been active since at least 1972. Located in Antarctica overlooking the McMurdo Station on Ross Island, it is the southernmost active volcano on the planet. Because of the remote location, activity is primarily monitored by satellites. This report covers activity during 2023.
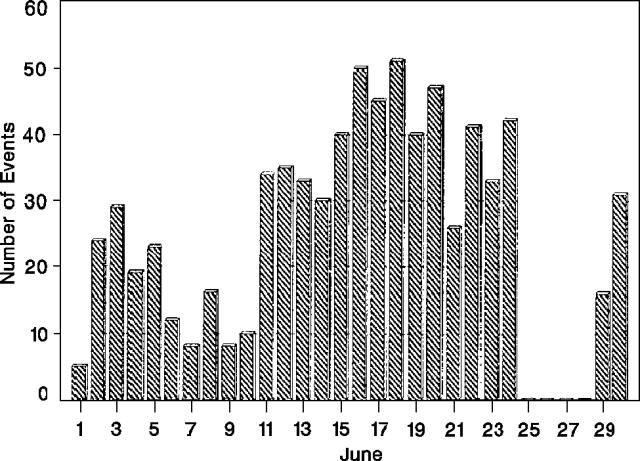
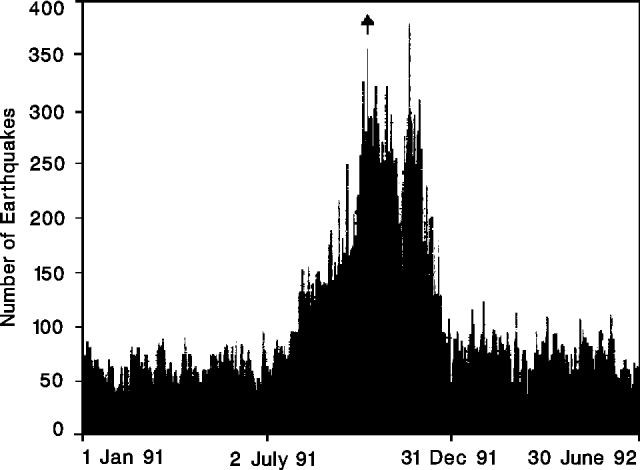
The number of thermal alerts recorded by the Hawai'i Institute of Geophysics and Planetology’s MODVOLC Thermal Alerts System increased considerably in 2023 compared to the years 2020-2022 (table 9). In contrast to previous years, the MODIS instruments aboard the Aqua and Terra satellites captured data from Erebus every month during 2023. Consistent with previous years, the lowest number of anomalous pixels were recorded in January, November, and December.
Table 9. Number of monthly MODIS-MODVOLC thermal alert pixels recorded at Erebus during 2017-2023. See BGVN 42:06 for data from 2000 through 2016. The table was compiled using data provided by the HIGP – MODVOLC Thermal Alerts System.
| Year |
Jan |
Feb |
Mar |
Apr |
May |
Jun |
Jul |
Aug |
Sep |
Oct |
Nov |
Dec |
SUM |
| 2017 |
0 |
21 |
9 |
0 |
0 |
1 |
11 |
61 |
76 |
52 |
0 |
3 |
234 |
| 2018 |
0 |
21 |
58 |
182 |
55 |
17 |
137 |
172 |
103 |
29 |
0 |
0 |
774 |
| 2019 |
2 |
21 |
162 |
151 |
55 |
56 |
75 |
53 |
29 |
19 |
1 |
0 |
624 |
| 2020 |
0 |
2 |
16 |
18 |
4 |
4 |
1 |
3 |
18 |
3 |
1 |
6 |
76 |
| 2021 |
0 |
9 |
1 |
0 |
2 |
56 |
46 |
47 |
35 |
52 |
5 |
3 |
256 |
| 2022 |
1 |
13 |
55 |
22 |
15 |
32 |
39 |
19 |
31 |
11 |
0 |
0 |
238 |
| 2023 |
2 |
33 |
49 |
82 |
41 |
32 |
70 |
64 |
42 |
17 |
5 |
11 |
448 |
Sentinel-2 infrared images showed one or two prominent heat sources within the summit crater, accompanied by adjacent smaller sources, similar to recent years (see BGVN 46:01, 47:02, and 48:01). A unique image was obtained on 25 November 2023 by the OLI-2 (Operational Land Imager-2) on Landsat 9, showing the upper part of the volcano surrounded by clouds (figure 32).
Geologic Background. Mount Erebus, the world's southernmost historically active volcano, overlooks the McMurdo research station on Ross Island. It is the largest of three major volcanoes forming the crudely triangular Ross Island. The summit of the dominantly phonolitic volcano has been modified by one or two generations of caldera formation. A summit plateau at about 3,200 m elevation marks the rim of the youngest caldera, which formed during the late-Pleistocene and within which the modern cone was constructed. An elliptical 500 x 600 m wide, 110-m-deep crater truncates the summit and contains an active lava lake within a 250-m-wide, 100-m-deep inner crater; other lava lakes are sometimes present. The glacier-covered volcano was erupting when first sighted by Captain James Ross in 1841. Continuous lava-lake activity with minor explosions, punctuated by occasional larger Strombolian explosions that eject bombs onto the crater rim, has been documented since 1972, but has probably been occurring for much of the volcano's recent history.
Information Contacts: Hawai'i Institute of Geophysics and Planetology (HIGP) - MODVOLC Thermal Alerts System, School of Ocean and Earth Science and Technology (SOEST), Univ. of Hawai'i, 2525 Correa Road, Honolulu, HI 96822, USA (URL: http://modis.higp.hawaii.edu/); Copernicus Browser, Copernicus Data Space Ecosystem, European Space Agency (URL: https://dataspace.copernicus.eu/browser/); NASA Earth Observatory, EOS Project Science Office, NASA Goddard Space Flight Center, Goddard, Maryland, USA (URL: https://earthobservatory.nasa.gov/images/152134/erebus-breaks-through).
Rincon de la Vieja (Costa Rica) — January 2024 Cite this Report
Rincon de la Vieja
Costa Rica
10.83°N, 85.324°W; summit elev. 1916 m
All times are local (unless otherwise noted)
Frequent phreatic explosions during July-December 2023
Rincón de la Vieja is a volcanic complex in Costa Rica with a hot convecting acid lake that exhibits frequent weak phreatic explosions, gas-and-steam emissions, and occasional elevated sulfur dioxide levels (BGVN 45:10, 46:03, 46:11). The current eruption period began June 2021. This report covers activity during July-December 2023 and is based on weekly bulletins and occasional daily reports from the Observatorio Vulcanologico Sismologica de Costa Rica-Universidad Nacional (OVSICORI-UNA).
Numerous weak phreatic explosions continued during July-December 2023, along with gas-and-steam emissions and plumes that rose as high as 3 km above the crater rim. Many weekly OVSICORI-UNA bulletins included the previous week's number of explosions and emissions (table 9). For many explosions, the time of explosion was given (table 10). Frequent seismic activity (long-period earthquakes, volcano-tectonic earthquakes, and tremor) accompanied the phreatic activity.
Table 9. Number of reported weekly phreatic explosions and gas-and-steam emissions at Rincón de la Vieja, July-December 2023. Counts are reported for the week before the Weekly Bulletin date; not all reports included these data. Courtesy of OVSICORI-UNA.
| OVSICORI Weekly Bulletin |
Number of explosions |
Number of emissions |
| 28 Jul 2023 |
6 |
14 |
| 4 Aug 2023 |
10 |
12 |
| 1 Sep 2023 |
13 |
11 |
| 22 Sep 2023 |
12 |
13 |
| 29 Sep 2023 |
6 |
11 |
| 6 Oct 2023 |
12 |
5 |
| 13 Oct 2023 |
7 |
9 |
| 20 Oct 2023 |
1 |
15 |
| 27 Oct 2023 |
3 |
23 |
| 3 Nov 2023 |
3 |
10 |
| 17 Nov 2023 |
0 |
Some |
| 24 Nov 2023 |
0 |
14 |
| 8 Dec 2023 |
4 |
16 |
| 22 Dec 2023 |
8 |
18 |
Table 10. Summary of activity at Rincón de la Vieja during July-December 2023. Weak phreatic explosions and gas emissions are noted where the time of explosion was indicated in the weekly or daily bulletins. Height of plumes or emissions are distance above the crater rim. Courtesy of OVSICORI-UNA.
| Date |
Time |
Description of Activity |
| 1 Jul 2023 |
0156 |
Explosion. |
| 2 Jul 2023 |
0305 |
Explosion. |
| 4 Jul 2023 |
0229, 0635 |
Event at 0635 produced a gas-and-steam plume that rose 700 m and drifted W; seen by residents in Liberia (21 km SW). |
| 9 Jul 2023 |
1843 |
Explosion. |
| 21 Jul 2023 |
0705 |
Explosion. |
| 26 Jul 2023 |
1807 |
Explosion. |
| 28 Jul 2023 |
0802 |
Explosion generated a gas-and-steam plume that rose 500 m. |
| 30 Jul 2023 |
1250 |
Explosion. |
| 31 Jul 2023 |
2136 |
Explosion. |
| 11 Aug 2023 |
0828 |
Explosion. |
| 18 Aug 2023 |
1304 |
Explosion. |
| 21 Aug 2023 |
1224 |
Explosion generated gas-and-steam plumes rose 500-600 m. |
| 22 Aug 2023 |
0749 |
Explosion generated gas-and-steam plumes rose 500-600 m. |
| 24 Aug 2023 |
1900 |
Explosion. |
| 25 Aug 2023 |
0828 |
Event produced a steam-and-gas plume that rose 3 km and drifted NW. |
| 27-28 Aug 2023 |
0813 |
Four small events; the event at 0813 on 28 August lasted two minutes and generated a steam-and-gas plume that rose 2.5 km. |
| 1 Sep 2023 |
1526 |
Explosion generated plume that rose 2 km and ejected material onto the flanks. |
| 2-3 Sep 2023 |
- |
Small explosions detected in infrasound data. |
| 4 Sep 2023 |
1251 |
Gas-and-steam plume rose 1 km and drifted W. |
| 7 Nov 2023 |
1113 |
Explosion. |
| 8 Nov 2023 |
0722 |
Explosion. |
| 12 Nov 2023 |
0136 |
Small gas emissions. |
| 14 Nov 2023 |
0415 |
Small gas emissions. |
According to OVSICORI-UNA, during July-October the average weekly sulfur dioxide (SO2) flux ranged from 68 to 240 tonnes/day. However, in mid-November the flux increased to as high as 334 tonnes/day, the highest value measured in recent years. The high SO2 flux in mid-November was also detected by the TROPOMI instrument on the Sentinel-5P satellite (figure 43).
Geologic Background. Rincón de la Vieja, the largest volcano in NW Costa Rica, is a remote volcanic complex in the Guanacaste Range. The volcano consists of an elongated, arcuate NW-SE-trending ridge constructed within the 15-km-wide early Pleistocene Guachipelín caldera, whose rim is exposed on the south side. Sometimes known as the "Colossus of Guanacaste," it has an estimated volume of 130 km3 and contains at least nine major eruptive centers. Activity has migrated to the SE, where the youngest-looking craters are located. The twin cone of Santa María volcano, the highest peak of the complex, is located at the eastern end of a smaller, 5-km-wide caldera and has a 500-m-wide crater. A Plinian eruption producing the 0.25 km3 Río Blanca tephra about 3,500 years ago was the last major magmatic eruption. All subsequent eruptions, including numerous historical eruptions possibly dating back to the 16th century, have been from the prominent active crater containing a 500-m-wide acid lake located ENE of Von Seebach crater.
Information Contacts: Observatorio Vulcanológico Sismológica de Costa Rica-Universidad Nacional (OVSICORI-UNA), Apartado 86-3000, Heredia, Costa Rica (URL: http://www.ovsicori.una.ac.cr/); NASA Global Sulfur Dioxide Monitoring Page, Atmospheric Chemistry and Dynamics Laboratory, NASA Goddard Space Flight Center (NASA/GSFC), 8800 Greenbelt Road, Goddard MD 20771, USA (URL: https://so2.gsfc.nasa.gov/).
Bezymianny (Russia) — November 2023 Cite this Report
Bezymianny
Russia
55.972°N, 160.595°E; summit elev. 2882 m
All times are local (unless otherwise noted)
Explosion on 18 October 2023 sends ash plume 8 km high; lava flows and incandescent avalanches
Bezymianny, located on Russia’s Kamchatka Peninsula, has had eruptions since 1955 characterized by dome growth, explosions, pyroclastic flows, ash plumes, and ashfall. Activity during November 2022-April 2023 included gas-and-steam emissions, lava dome collapses generating avalanches, and persistent thermal activity. Similar eruptive activity continued from May through October 2023, described here based on information from weekly and daily reports of the Kamchatka Volcano Eruptions Response Team (KVERT), notices from Tokyo VAAC (Volcanic Ash Advisory Center), and from satellite data.
Overall activity decreased after the strong period of activity in late March through April 2023, which included ash explosions during 29 March and 7-8 April 2023 that sent plumes as high as 10-12 km altitude, along with dome growth and lava flows (BGVN 48:05). This reduced activity can be seen in the MIROVA thermal detection system graph (figure 56), which was consistent with data from the MODVOLC thermal detection system and with Sentinel-2 satellite images that showed persistent hotspots in the summit crater when conditions allowed observations. A renewed period of strong activity began in mid-October 2023.
Activity increased significantly on 17 October 2023 when large collapses began during 0700-0830 on the E flanks of the lava dome and continued to after 0930 the next day (figure 57). Ash plumes rose to an altitude of 4.5-5 km, extending 220 km NNE by 18 October. A large explosion at 1630 on 18 October produced an ash plume that rose to an altitude of 11 km (8 km above the summit) and drifted NNE and then NW, extending 900 km NW within two days at an altitude of 8 km. Minor ashfall was noted in Kozyrevsk (45 km WNW). At 0820 on 20 October an ash plume was identified in satellite images drifting 100 km ENE at altitudes of 4-4.5 km.
Lava flows and hot avalanches from the dome down the SE flank continued over the next few days, including 23 October when clear conditions allowed good observations (figures 58 and 59). A large thermal anomaly was observed over the volcano through 24 October, and in the summit crater on 30 October (figure 60). Strong fumarolic activity continued, with numerous avalanches and occasional incandescence. By the last week of October, volcanic activity had decreased to a level consistent with that earlier in the reporting period.
Aviation warnings were frequently updated during 17-20 October. KVERT issued a Volcano Observatory Notice for Aviation (VONA) on 17 October at 1419 and 1727 (0219 and 0527 UTC) raising the Aviation Color Code (ACC) from Yellow to Orange (second highest level). The next day, KVERT issued a VONA at 1705 (0505 UTC) raising the ACC to Red (highest level) but lowered it back to Orange at 2117 (0917 UTC). After another decrease to Yellow and back to Orange, the ACC was reduced to Yellow on 20 October at 1204 (0004 UTC). In addition, the Tokyo VAAC issued a series of Volcanic Ash Advisories beginning on 16 October and continuing through 30 October.
Geologic Background. The modern Bezymianny, much smaller than its massive neighbors Kamen and Kliuchevskoi on the Kamchatka Peninsula, was formed about 4,700 years ago over a late-Pleistocene lava-dome complex and an edifice built about 11,000-7,000 years ago. Three periods of intensified activity have occurred during the past 3,000 years. The latest period, which was preceded by a 1,000-year quiescence, began with the dramatic 1955-56 eruption. This eruption, similar to that of St. Helens in 1980, produced a large open crater that was formed by collapse of the summit and an associated lateral blast. Subsequent episodic but ongoing lava-dome growth, accompanied by intermittent explosive activity and pyroclastic flows, has largely filled the 1956 crater.
Information Contacts: Kamchatka Volcanic Eruptions Response Team (KVERT), Far Eastern Branch, Russian Academy of Sciences, 9 Piip Blvd., Petropavlovsk-Kamchatsky, 683006, Russia (URL: http://www.kscnet.ru/ivs/kvert/); Kamchatka Volcanological Station, Kamchatka Branch of Geophysical Survey, (KB GS RAS), Klyuchi, Kamchatka Krai, Russia (URL: http://volkstat.ru/); Tokyo Volcanic Ash Advisory Center (VAAC), 1-3-4 Otemachi, Chiyoda-ku, Tokyo 100-8122, Japan (URL: http://ds.data.jma.go.jp/svd/vaac/data/); Hawai'i Institute of Geophysics and Planetology (HIGP) - MODVOLC Thermal Alerts System, School of Ocean and Earth Science and Technology (SOEST), Univ. of Hawai'i, 2525 Correa Road, Honolulu, HI 96822, USA (URL: http://modis.higp.hawaii.edu/); MIROVA (Middle InfraRed Observation of Volcanic Activity), a collaborative project between the Universities of Turin and Florence (Italy) supported by the Centre for Volcanic Risk of the Italian Civil Protection Department (URL: http://www.mirovaweb.it/); Copernicus Browser, Copernicus Data Space Ecosystem, European Space Agency (URL: https://dataspace.copernicus.eu/browser/).chr
Kilauea (United States) — January 2023 Cite this Report
Kilauea
United States
19.421°N, 155.287°W; summit elev. 1222 m
All times are local (unless otherwise noted)
Low-level lava effusions in the lava lake at Halema’uma’u during July-December 2022
Kīlauea is the southeastern-most volcano in Hawaii and overlaps the E flank of the Mauna Loa volcano. Its East Rift Zone (ERZ) has been intermittently active for at least 2,000 years. An extended eruption period began in January 1983 and was characterized by open lava lakes and lava flows from the summit caldera and the East Rift Zone. During May 2018 magma migrated into the Lower East Rift Zone (LERZ) and opened 24 fissures along a 6-km-long NE-trending fracture zone that produced lava flows traveling in multiple directions. As lava emerged from the fissures, the lava lake at Halema'uma'u drained and explosions sent ash plumes to several kilometers altitude (BGVN 43:10).
The current eruption period started during September 2021 and has recently been characterized by lava effusions, spatter, and sulfur dioxide emissions in the active Halema’uma’u lava lake (BGVN 47:08). Lava effusions, some spatter, and sulfur dioxide emissions have continued during this reporting period of July through December 2022 using daily reports, volcanic activity notices, and abundant photo, map, and video data from the US Geological Survey's (USGS) Hawaiian Volcano Observatory (HVO).
Summary of activity during July-December 2022. Low-level effusions have continued at the western vent of the Halema’uma’u crater during July through early December 2022. Occasional weak ooze-outs (also called lava break outs) would occur along the margins of the crater floor. The overall level of the active lava lake throughout the reporting period gradually increased due to infilling, however it stagnated in mid-September (table 13). During September through November, activity began to decline, though lava effusions persisted at the western vent. By 9 December, the active part of the lava lake had completely crusted over, and incandescence was no longer visible.
Table 13. Summary of measurements taken during overflights at Kīlauea that show a gradual increase in the active lava lake level and the volume of lava effused since 29 September 2021. Lower activity was reported during September-October. Data collected during July-December 2022. Courtesy of HVO.
| Date: |
Level of the active lava lake (m): |
Cumulative volume of lava effused (million cubic meters): |
| 7 Jul 2022 |
130 |
95 |
| 19 Jul 2022 |
133 |
98 |
| 4 Aug 2022 |
136 |
102 |
| 16 Aug 2022 |
137 |
104 |
| 12 Sep 2022 |
143 |
111 |
| 5 Oct 2022 |
143 |
111 |
| 28 Oct 2022 |
143 |
111 |
Activity during July 2022. Lava effusions were reported from the western vent in the Halema’uma’u crater, along with occasional weak ooze-outs along the margins of the crater floor. The height of the lava lake was variable due to deflation-inflation tilt events; for example, the lake level dropped approximately 3-4 m during a summit deflation-inflation event reported on 1 July. Webcam images taken during the night of 6-12 July showed intermittent low-level spattering at the western vent that rose less than 10 m above the vent (figure 519). Measurements made during an overflight on 7 July indicated that the crater floor was infilled about 130 m and that 95 million cubic meters of lava had been effused since 29 September 2021. A single, relatively small lava ooze-out was active to the S of the lava lake. Around midnight on 8 July there were two brief periods of lava overflow onto the lake margins. On 9 July lava ooze-outs were reported near the SE and NE edges of the crater floor and during 10-11 July they occurred near the E, NE, and NW edges. On 16 July crater incandescence was reported, though the ooze-outs and spattering were not visible. On 18 July overnight webcam images showed incandescence in the western vent complex and two ooze-outs were reported around 0000 and 0200 on 19 July. By 0900 there were active ooze-outs along the SW edge of the crater floor. Measurements made from an overflight on 19 July indicated that the crater floor was infilled about 133 m and 98 million cubic meters of lava had erupted since 29 September 2021 (figure 520). On 20 July around 1600 active ooze-outs were visible along the N edge of the crater, which continued through the next day. Extensive ooze-outs occurred along the W margin during 24 July until 1900; on 26 July minor ooze-outs were noted along the N margin. Minor spattering was visible on 29 July along the E margin of the lake. The sulfur dioxide emission rates ranged 650-2,800 tons per day (t/d), the higher of which was measured on 8 July (figure 519).
Activity during August 2022. The eruption continued in the Halema’uma’u crater at the western vent. According to HVO the lava in the active lake remained at the level of the bounding levees. Occasional minor ooze-outs were observed along the margins of the crater floor. Strong nighttime crater incandescence was visible after midnight on 6 August over the western vent cone. During 6-7 August scattered small lava lobes were active along the crater floor and incandescence persisted above the western vent through 9 August. During 7-9 August HVO reported a single lava effusion source was active along the NW margin of the crater floor. Measurements from an overflight on 4 August indicated that the crater floor was infilled about 136 m total and that 102 million cubic meters of lava had been erupted since the start of the eruption. Lava breakouts were reported along the N, NE, E, S, and W margins of the crater during 10-16 August. Another overflight survey conducted on 16 August indicated that the crater floor infilled about 137 m and 104 million cubic meters of lava had been erupted since September 2021. Measured sulfur dioxide emissions rates ranged 1,150-2,450 t/d, the higher of which occurred on 8 August.
Activity during September 2022. During September, lava effusion continued from the western vent into the active lava lake and onto the crater floor. Intermittent minor ooze-outs were reported through the month. A small ooze-out was visible on the W crater floor margin at 0220 on 2 September, which showed decreasing surface activity throughout the day, but remained active through 3 September. On 3 September around 1900 a lava outbreak occurred along the NW margin of the crater floor but had stopped by the evening of 4 September. Field crews monitoring the summit lava lake on 9 September observed spattering on the NE margin of the lake that rose no higher than 10 m, before falling back onto the lava lake crust (figure 521). Overflight measurements on 12 September indicated that the crater floor was infilled a total of 143 m and 111 million cubic meters of lava had been erupted since September 2021. Extensive breakouts in the W and N part of the crater floor were reported at 1600 on 20 September and continued into 26 September. The active part of the lava lake dropped by 10 m while other parts of the crater floor dropped by several meters. Summit tiltmeters recorded a summit seismic swarm of more than 80 earthquakes during 1500-1800 on 21 September, which occurred about 1.5 km below Halema’uma’u; a majority of these were less than Mw 2. By 22 September the active part of the lava lake was infilled about 2 m. On 23 September the western vent areas exhibited several small spatter cones with incandescent openings, along with weak, sporadic spattering (figure 522). The sulfur dioxide emission rate ranged from 930 t/d to 2,000 t/d, the higher of which was measured on 6 September.
Activity during October 2022. Activity during October declined slightly compared to previous months, though lava effusions persisted from the western vent into the active lava lake and onto the crater floor during October (figure 523). Slight variations in the lava lake were noted throughout the month. HVO reported that around 0600 on 3 October the level of the lava lake has lowered slightly. Overflight measurements taken on 5 October indicated that the crater floor was infilled a total of about 143 m and that 111 million cubic meters of lava had been effused since September 2021. During 6-7 October the lake gradually rose 0.5 m. Sulfur dioxide measurements made on 22 October had an emission rate of 700 t/d. Another overflight taken on 28 October showed that there was little to no change in the elevation of the crater floor: the crater floor was infilled a total of 143 m and 111 million cubic meters of lava had erupted since the start of the eruption.
Activity during November 2022. Activity remained low during November, though HVO reported that lava from the western vent continued to effuse into the active lava lake and onto the crater floor throughout the month. The rate of sulfur dioxide emissions during November ranged from 300-600 t/d, the higher amount of which occurred on 9 November.
Activity during December 2022. Similar low activity was reported during December, with lava effusing from the western vent into the active lava lake and onto the crater floor. During 4-5 December the active part of the lava lake was slightly variable in elevation and fluctuated within 1 m. On 9 December HVO reported that lava was no longer erupting from the western vent in the Halema’uma’u crater and that sulfur dioxide emissions had returned to near pre-eruption background levels; during 10-11 December, the lava lake had completely crusted over, and no incandescence was visible (figure 524). Time lapse camera images covering the 4-10 December showed that the crater floor showed weak deflation and no inflation. Some passive events of crustal overturning were reported during 14-15 December, which brought fresh incandescent lava to the lake surface. The sulfur dioxide emission rate was approximately 200 t/d on 14 December. A smaller overturn event on 17 December and another that occurred around 0000 and into the morning of 20 December were also detected. A small seismic swarm was later detected on 30 December.
Geologic Background. Kilauea overlaps the E flank of the massive Mauna Loa shield volcano in the island of Hawaii. Eruptions are prominent in Polynesian legends; written documentation since 1820 records frequent summit and flank lava flow eruptions interspersed with periods of long-term lava lake activity at Halemaumau crater in the summit caldera until 1924. The 3 x 5 km caldera was formed in several stages about 1,500 years ago and during the 18th century; eruptions have also originated from the lengthy East and Southwest rift zones, which extend to the ocean in both directions. About 90% of the surface of the basaltic shield volcano is formed of lava flows less than about 1,100 years old; 70% of the surface is younger than 600 years. The long-term eruption from the East rift zone between 1983 and 2018 produced lava flows covering more than 100 km2, destroyed hundreds of houses, and added new coastline.
Information Contacts: Hawaiian Volcano Observatory (HVO), U.S. Geological Survey, PO Box 51, Hawai'i National Park, HI 96718, USA (URL: http://hvo.wr.usgs.gov/).
Nyamulagira (DR Congo) — November 2023 Cite this Report
Nyamulagira
DR Congo
1.408°S, 29.2°E; summit elev. 3058 m
All times are local (unless otherwise noted)
Lava flows and thermal activity during May-October 2023
Nyamulagira (also known as Nyamuragira) is a shield volcano in the Democratic Republic of Congo with the summit truncated by a small 2 x 2.3 km caldera with walls up to about 100 m high. Documented eruptions have occurred within the summit caldera, as well as from numerous flank fissures and cinder cones. The current eruption period began in April 2018 and has more recently been characterized by summit crater lava flows and thermal activity (BGVN 48:05). This report describes lava flows and variable thermal activity during May through October 2023, based on information from the Observatoire Volcanologique de Goma (OVG) and various satellite data.
Lava lake activity continued during May. The MIROVA (Middle InfraRed Observation of Volcanic Activity) system recorded moderate-to-strong thermal activity throughout the reporting period; activity was more intense during May and October and relatively weaker from June through September (figure 95). The MODVOLC thermal algorithm, detected a total of 209 thermal alerts. There were 143 hotspots detected during May, eight during June, nine during September, and 49 during October. This activity was also reflected in infrared satellite images, where a lava flow was visible in the NW part of the crater on 7 May and strong activity was seen in the center of the crater on 4 October (figure 96). Another infrared satellite image taken on 12 May showed still active lava flows along the NW margin of the crater. According to OVG lava effusions were active during 7-29 May and moved to the N and NW parts of the crater beginning on 9 May. Strong summit crater incandescence was visible from Goma (27 km S) during the nights of 17, 19, and 20 May (figure 97). On 17 May there was an increase in eruptive activity, which peaked at 0100 on 20 May. Notable sulfur dioxide plumes drifted NW and W during 19-20 May (figure 98). Drone footage acquired in partnership with the USGS (United States Geological Survey) on 20 May captured images of narrow lava flows that traveled about 100 m down the W flank (figure 99). Data from the Rumangabo seismic station indicated a decreasing trend in activity during 17-21 May. Although weather clouds prevented clear views of the summit, a strong thermal signature on the NW flank was visible in an infrared satellite image on 22 May, based on an infrared satellite image. On 28 May the lava flows on the upper W flank began to cool and solidify. By 29 May seismicity returned to levels similar to those recorded before the 17 May increase. Lava effusion continued but was confined to the summit crater; periodic crater incandescence was observed.
Low-level activity was noted during June through October. On 1 June OVG reported that seismicity remained at lower levels and that crater incandescence had been absent for three days, though infrared satellite imagery showed continued lava effusion in the summit crater. The lava flows on the flanks covered an estimated 0.6 km2. Satellite imagery continued to show thermal activity confined to the lava lake through October (figure 96), although no lava flows or significant sulfur dioxide emissions were reported.
Geologic Background. Africa's most active volcano, Nyamulagira (also known as Nyamuragira), is a massive high-potassium basaltic shield about 25 km N of Lake Kivu and 13 km NNW of the steep-sided Nyiragongo volcano. The summit is truncated by a small 2 x 2.3 km caldera that has walls up to about 100 m high. Documented eruptions have occurred within the summit caldera, as well as from the numerous flank fissures and cinder cones. A lava lake in the summit crater, active since at least 1921, drained in 1938, at the time of a major flank eruption. Recent lava flows extend down the flanks more than 30 km from the summit as far as Lake Kivu; extensive lava flows from this volcano have covered 1,500 km2 of the western branch of the East African Rift.
Information Contacts: Observatoire Volcanologique de Goma (OVG), Departement de Geophysique, Centre de Recherche en Sciences Naturelles, Lwiro, D.S. Bukavu, DR Congo; Hawai'i Institute of Geophysics and Planetology (HIGP) - MODVOLC Thermal Alerts System, School of Ocean and Earth Science and Technology (SOEST), Univ. of Hawai'i, 2525 Correa Road, Honolulu, HI 96822, USA (URL: http://modis.higp.hawaii.edu/); MIROVA (Middle InfraRed Observation of Volcanic Activity), a collaborative project between the Universities of Turin and Florence (Italy) supported by the Centre for Volcanic Risk of the Italian Civil Protection Department (URL: http://www.mirovaweb.it/); NASA Global Sulfur Dioxide Monitoring Page, Atmospheric Chemistry and Dynamics Laboratory, NASA Goddard Space Flight Center (NASA/GSFC), 8800 Greenbelt Road, Goddard, Maryland, USA (URL: https://so2.gsfc.nasa.gov/); Copernicus Browser, Copernicus Data Space Ecosystem, European Space Agency (URL: https://dataspace.copernicus.eu/browser/); Charles Balagizi, Goma Volcano Observatory, Departement de Geophysique, Centre de Recherche en Sciences Naturelles, Lwiro, D.S. Bukavu, DR Congo.
Bagana (Papua New Guinea) — October 2023 Cite this Report
Bagana
Papua New Guinea
6.137°S, 155.196°E; summit elev. 1855 m
All times are local (unless otherwise noted)
Explosions, ash plumes, ashfall, and lava flows during April-September 2023
The remote volcano of Bagana is located in central Bougainville Island, Papua New Guinea. Recorded eruptions date back to 1842 and activity has consisted of effusive activity that has built a small lava dome in the summit crater and occasional explosions that produced pyroclastic flows. The most recent eruption has been ongoing since February 2000 and has produced occasional explosions, ash plumes, and lava flows. More recently, activity has been characterized by ongoing effusive activity and ash emissions (BGVN 48:04). This report updates activity from April through September 2023 that has consisted of explosions, ash plumes, ashfall, and lava flows, using information from the Darwin Volcanic Ash Advisory Center (VAAC) and satellite data.
An explosive eruption was reported on 7 July that generated a large gas-and-ash plume to high altitudes and caused significant ashfall in local communities; the eruption plume had reached upper tropospheric (16-18 km altitude) altitudes by 2200, according to satellite images. Sulfur dioxide plumes were detected in satellite images on 8 July and indicated that the plume was likely a mixture of gas, ice, and ash. A report issued by the Autonomous Bougainville Government (ABG) (Torokina District, Education Section) on 10 July noted that significant ash began falling during 2000-2100 on 7 July and covered most areas in the Vuakovi, Gotana (9 km SW), Koromaketo, Laruma (25 km W) and Atsilima (27 km NW) villages. Pyroclastic flows also occurred, according to ground-based reports; small deposits confined to one drainage were inspected by RVO during an overflight on 17 July and were confirmed to be from the 7 July event. Ashfall continued until 10 July and covered vegetation, which destroyed bushes and gardens and contaminated rivers and streams.
RVO reported another eruption on 14 July. The Darwin VAAC stated that an explosive event started around 0830 on 15 July and produced an ash plume that rose to 16.5 km altitude by 1000 and drifted N, according to satellite images. The plume continued to drift N and remained visible through 1900, and by 2150 it had dissipated.
Ashfall likely from both the 7 and 15 July events impacted about 8,111 people in Torokina (20 km SW), including Tsito/Vuakovi, Gotana, Koromaketo, Kenaia, Longkogari, Kenbaki, Piva (13 km SW), and Atsinima, and in the Tsitovi district, according to ABG. Significant ashfall was also reported in Ruruvu (22 km N) in the Wakunai District of Central Bougainville, though the thickness of these deposits could not be confirmed. An evacuation was called for the villages in Wakunai, where heavy ashfall had contaminated water sources; the communities of Ruruvu, Togarau, Kakarapaia, Karauturi, Atao, and Kuritaturi were asked to evacuate to a disaster center at the Wakunai District Station, and communities in Torokina were asked to evacuate to the Piva District station. According to a news article, more than 7,000 people needed temporary accommodations, with about 1,000 people in evacuation shelters. Ashfall had deposited over a broad area, contaminating water supplies, affecting crops, and collapsing some roofs and houses in rural areas. Schools were temporarily shut down. Intermittent ash emissions continued through the end of July and drifted NNW, NW, and SW. Fine ashfall was reported on the coast of Torokina, and ash plumes also drifted toward Laruma and Atsilima.
A small explosive eruption occurred at 2130 on 28 July that ejected material from the crater vents, according to reports from Torokina, in addition to a lava flow that contained two lobes. A second explosion was detected at 2157. Incandescence from the lava flow was visible from Piva as it descended the W flank around 2000 on 29 July (figure 47). The Darwin VAAC reported that a strong thermal anomaly was visible in satellite images during 30-31 July and that ash emissions rose to 2.4 km altitude and drifted WSW on 30 July. A ground report from RVO described localized emissions at 0900 on 31 July.
The Darwin VAAC reported that ash plumes were identified in satellite imagery at 0800 and 1220 on 12 August and rose to 2.1 km and 3 km altitude and drifted NW and W, respectively. A news report stated that aid was sent to more than 6,300 people that were adversely affected by the eruption. Photos taken during 17-19 August showed ash emissions rising no higher than 1 km above the summit and drifting SE. A small explosion generated an ash plume during the morning of 19 August. Deposits from small pyroclastic flows were also captured in the photos. Satellite images captured lava flows and pyroclastic flow deposits. Two temporary seismic stations were installed near Bagana on 17 August at distances of 7 km WSW (Vakovi station) and 11 km SW (Kepox station). The Kepox station immediately started to record continuous, low-frequency background seismicity.
Satellite data. Little to no thermal activity was detected during April through mid-July 2023; only one anomaly was recorded during early April and one during early June, according to MIROVA (Middle InfraRed Observation of Volcanic Activity) data (figure 48). Thermal activity increased in both power and frequency during mid-July through September, although there were still some short gaps in detected activity. MODVOLC also detected increased thermal activity during August; thermal hotspots were detected a total of five times on 19, 20, and 27 August. Weak thermal anomalies were also captured in infrared satellite images on clear weather days throughout the reporting period on 7, 12, and 17 April, 27 May, 1, 6, 16, and 31 July, and 19 September (figure 48); a strong thermal anomaly was visible on 31 July. Distinct sulfur dioxide plumes that drifted generally NW were intermittently captured by the TROPOMI instrument on the Sentinel-5P satellite and sometimes exceeded two Dobson Units (DUs) (figure 49).
Geologic Background. Bagana volcano, in a remote portion of central Bougainville Island, is frequently active. This massive symmetrical cone was largely constructed by an accumulation of viscous andesitic lava flows. The entire edifice could have been constructed in about 300 years at its present rate of lava production. Eruptive activity is characterized by non-explosive effusion of viscous lava that maintains a small lava dome in the summit crater, although occasional explosive activity produces pyroclastic flows. Lava flows with tongue-shaped lobes up to 50 m thick and prominent levees descend the flanks on all sides.
Information Contacts: Rabaul Volcano Observatory (RVO), Geohazards Management Division, Department of Mineral Policy and Geohazards Management (DMPGM), PO Box 3386, Kokopo, East New Britain Province, Papua New Guinea; Darwin Volcanic Ash Advisory Centre (VAAC), Bureau of Meteorology, Northern Territory Regional Office, PO Box 40050, Casuarina, NT 0811, Australia (URL: http://www.bom.gov.au/info/vaac/); MIROVA (Middle InfraRed Observation of Volcanic Activity), a collaborative project between the Universities of Turin and Florence (Italy) supported by the Centre for Volcanic Risk of the Italian Civil Protection Department (URL: http://www.mirovaweb.it/); Hawai'i Institute of Geophysics and Planetology (HIGP) - MODVOLC Thermal Alerts System, School of Ocean and Earth Science and Technology (SOEST), Univ. of Hawai'i, 2525 Correa Road, Honolulu, HI 96822, USA (URL: http://modis.higp.hawaii.edu/); NASA Global Sulfur Dioxide Monitoring Page, Atmospheric Chemistry and Dynamics Laboratory, NASA Goddard Space Flight Center (NASA/GSFC), 8800 Greenbelt Road, Goddard, Maryland, USA (URL: https://so2.gsfc.nasa.gov/); Copernicus Browser, Copernicus Data Space Ecosystem, European Space Agency (URL: https://dataspace.copernicus.eu/browser/); Autonomous Bougainville Government, P.O Box 322, Buka, AROB, PNG (URL: https://abg.gov.pg/); Andrew Tupper (Twitter: @andrewcraigtupp); Simon Carn, Geological and Mining Engineering and Sciences, Michigan Technological University, 1400 Townsend Drive, Houghton, MI 49931, USA (URL: http://www.volcarno.com/, Twitter: @simoncarn); Radio NZ (URL: https://www.rnz.co.nz/news/pacific/494464/more-than-7-000-people-in-bougainville-need-temporary-accommodation-after-eruption); USAID, 1300 Pennsylvania Ave, NW, Washington DC 20004, USA (URL: https://www.usaid.gov/pacific-islands/press-releases/aug-08-2023-united-states-provides-immediate-emergency-assistance-support-communities-affected-mount-bagana-volcanic-eruptions).
Mayon (Philippines) — October 2023 Cite this Report
Mayon
Philippines
13.257°N, 123.685°E; summit elev. 2462 m
All times are local (unless otherwise noted)
Lava flows, pyroclastic flows, ash emissions, and seismicity during April-September 2023
Mayon is located in the Philippines and has steep upper slopes capped by a small summit crater. Historical eruptions date back to 1616 CE that have been characterized by Strombolian eruptions, lava flows, pyroclastic flows, and mudflows. Eruptions mostly originated from a central conduit. Pyroclastic flows and mudflows have commonly descended many of the approximately 40 drainages that surround the volcano. The most recent eruption occurred during June through October 2022 and consisted of lava dome growth and gas-and-steam emissions (BGVN 47:12). A new eruption was reported during late April 2023 and has included lava flows, pyroclastic density currents, ash emissions, and seismicity. This report covers activity during April through September 2023 based on daily bulletins from the Philippine Institute of Volcanology and Seismology (PHIVOLCS).
During April through September 2023, PHIVOLCS reported near-daily rockfall events, frequent volcanic earthquakes, and sulfur dioxide measurements. Gas-and-steam emissions rose 100-900 m above the crater and drifted in different directions. Nighttime crater incandescence was often visible during clear weather and was accompanied by incandescent avalanches of material. Activity notably increased during June when lava flows were reported on the S, SE, and E flanks (figure 52). The MIROVA graph (Middle InfraRed Observation of Volcanic Activity) showed strong thermal activity coincident with these lava flows, which remained active through September (figure 53). According to the MODVOLC thermal algorithm, a total of 110 thermal alerts were detected during the reporting period: 17 during June, 40 during July, 27 during August, and 26 during September. During early June, pyroclastic density currents (PDCs) started to occur more frequently.
Low activity was reported during much of April and May; gas-and-steam emissions rose 100-900 m above the crater and generally drifted in different directions. A total of 52 rockfall events and 18 volcanic earthquakes were detected during April and 147 rockfall events and 13 volcanic events during May. Sulfur dioxide flux measurements ranged between 400-576 tons per day (t/d) during April, the latter of which was measured on 29 April and between 162-343 t/d during May, the latter of which was measured on 13 May.
Activity during June increased, characterized by lava flows, pyroclastic density currents (PDCs), crater incandescence and incandescent rockfall events, gas-and-steam emissions, and continued seismicity. Weather clouds often prevented clear views of the summit, but during clear days, moderate gas-and-steam emissions rose 100-2,500 m above the crater and drifted in multiple directions. A total of 6,237 rockfall events and 288 volcanic earthquakes were detected. The rockfall events often deposited material on the S and SE flanks within 700-1,500 m of the summit crater and ash from the events drifted SW, S, SE, NE, and E. Sulfur dioxide emissions ranged between 149-1,205 t/d, the latter of which was measured on 10 June. Short-term observations from EDM and electronic tiltmeter monitoring indicated that the upper slopes were inflating since February 2023. Longer-term ground deformation parameters based on EDM, precise leveling, continuous GPS, and electronic tilt monitoring indicated that the volcano remained inflated, especially on the NW and SE flanks. At 1000 on 5 June the Volcano Alert Level (VAL) was raised to 2 (on a 0-5 scale). PHIVOLCS noted that although low-level volcanic earthquakes, ground deformation, and volcanic gas emissions indicated unrest, the steep increase in rockfall frequency may indicate increased dome activity.
A total of 151 dome-collapse PDCs occurred during 8-9 and 11-30 June, traveled 500-2,000 m, and deposited material on the S flank within 2 km of the summit crater. During 8-9 June the VAL was raised to 3. At approximately 1947 on 11 June lava flow activity was reported; two lobes traveled within 500 m from the crater and deposited material on the S (Mi-isi), SE (Bonga), and E (Basud) flanks. Weak seismicity accompanied the lava flow and slight inflation on the upper flanks. This lava flow remained active through 30 June, moving down the S and SE flank as far as 2.5 km and 1.8 km, respectively and depositing material up to 3.3 km from the crater. During 15-16 June traces of ashfall from the PDCs were reported in Sitio Buga, Nabonton, City of Ligao and Purok, and San Francisco, Municipality of Guinobatan. During 28-29 June there were two PDCs generated by the collapse of the lava flow front, which generated a light-brown ash plume 1 km high. Satellite monitors detected significant concentrations of sulfur dioxide beginning on 29 June. On 30 June PDCs primarily affected the Basud Gully on the E flank, the largest of which occurred at 1301 and lasted eight minutes, based on the seismic record. Four PDCs generated between 1800 and 2000 that lasted approximately four minutes each traveled 3-4 km on the E flank and generated an ash plume that rose 1 km above the crater and drifted N and NW. Ashfall was recorded in Tabaco City.
Similar strong activity continued during July; slow lava effusion remained active on the S and SE flanks and traveled as far as 2.8 km and 2.8 km, respectively and material was deposited as far as 4 km from the crater. There was a total of 6,983 rockfall events and 189 PDCs that affected the S, SE, and E flanks. The volcano network detected a total of 2,124 volcanic earthquakes. Continuous gas-and-steam emissions rose 200-2,000 m above the crater and drifted in multiple directions. Sulfur dioxide emissions averaged 792-4,113 t/d, the latter of which was measured on 28 July. During 2-4 July three PDCs were generated from the collapse of the lava flow and resulting light brown plumes rose 200-300 m above the crater. Continuous tremor pulses were reported beginning at 1547 on 3 July through 7 July at 1200, at 2300 on 8 July and going through 0300 on 10 July, and at 2300 on 16 July, as recorded by the seismic network. During 6-9 July there were 10 lava flow-collapse-related PDCs that generated light brown plumes 300-500 m above the crater. During 10-11 July light ashfall was reported in some areas of Mabinit, Legazpi City, Budiao and Salvacion, Daraga, and Camalig, Albay. By 18 July the lava flow advanced 600 m on the E flank as well.
During 1733 on 18 July and 0434 on 19 July PHIVOLCS reported 30 “ashing” events, which are degassing events accompanied by audible thunder-like sounds and entrained ash at the crater, which produced short, dark plumes that drifted SW. These events each lasted 20-40 seconds, and plume heights ranged from 150-300 m above the crater, as recorded by seismic, infrasound, visual, and thermal monitors. Three more ashing events occurred during 19-20 July. Short-term observations from electronic tilt and GPS monitoring indicate deflation on the E lower flanks in early July and inflation on the NW middle flanks during the third week of July. Longer-term ground deformation parameters from EDM, precise leveling, continuous GPS, and electronic tilt monitoring indicated that the volcano was still generally inflated relative to baseline levels. A short-lived lava pulse lasted 28 seconds at 1956 on 21 July, which was accompanied by seismic and infrasound signals. By 22 July, the only lava flow that remained active was on the SE flank, and continued to extend 3.4 km, while those on the S and E flanks weakened markedly. One ashing event was detected during 30-31 July, whereas there were 57 detected during 31 July-1 August; according to PHIVOLCS beginning at approximately 1800 on 31 July eruptive activity was dominated by phases of intermittent ashing, as well as increased in the apparent rates of lava effusion from the summit crater. The ashing phases consisted of discrete events recorded as low-frequency volcanic earthquakes (LFVQ) typically 30 seconds in duration, based on seismic and infrasound signals. Gray ash plume rose 100 m above the crater and generally drifted NE. Shortly after these ashing events began, new lava began to effuse rapidly from the crater, feeding the established flowed on the SE, E, and E flanks and generating frequent rockfall events.
Intensified unrest persisted during August. There was a total of 4,141 rockfall events, 2,881 volcanic earthquakes, which included volcanic tremor events, 32 ashing events, and 101 PDCs detected throughout the month. On clear weather days, gas-and-steam emissions rose 300-1,500 m above the crater and drifted in different directions (figure 54). Sulfur dioxide emissions averaged 735-4,756 t/d, the higher value of which was measured on 16 August. During 1-2 August the rate of lava effusion decreased, but continued to feed the flows on the SE, S, and E flanks, maintaining their advances to 3.4 km, 2.8 km, and 1.1 km from the crater, respectively (figure 55). Rockfall and PDCs generated by collapses at the lava flow margins and from the summit dome deposited material within 4 km of the crater. During 3-4 August there were 10 tremor events detected that lasted 1-4 minutes. Short-lived lava pulse lasted 35 seconds and was accompanied by seismic and infrasound signals at 0442 on 6 August. Seven collapses were recorded at the front of the lava flow during 12-14 August.
During September, similar activity of slow lava effusion, PDCs, gas-and-steam emissions, and seismicity continued. There was a total of 4,452 rockfall events, 329 volcanic earthquakes, which included volcanic tremor events, two ashing events, and 85 PDCs recorded throughout the month. On clear weather days, gas-and-steam emissions rose 100-1,500 m above the crater and drifted in multiple directions. Sulfur dioxide emissions averaged 609-2,252 t/d, the higher average of which was measured on 6 September. Slow lava effusion continued advancing on the SE, S, and E flanks, maintaining lengths of 3.4 km, 2.8 km, and 1.1 km, respectively. Rockfall and PDC events generated by collapses along the lava flow margins and at the summit dome deposited material within 4 km of the crater.
Geologic Background. Symmetrical Mayon, which rises above the Albay Gulf NW of Legazpi City, is the most active volcano of the Philippines. The steep upper slopes are capped by a small summit crater. Recorded eruptions since 1616 CE range from Strombolian to basaltic Plinian, with cyclical activity beginning with basaltic eruptions, followed by longer periods of andesitic lava flows. Eruptions occur predominately from the central conduit and have also produced lava flows that travel far down the flanks. Pyroclastic density currents and mudflows have commonly swept down many of the approximately 40 ravines that radiate from the summit and have often damaged populated lowland areas. A violent eruption in 1814 killed more than 1,200 people and devastated several towns.
Information Contacts: Philippine Institute of Volcanology and Seismology (PHIVOLCS), Department of Science and Technology, University of the Philippines Campus, Diliman, Quezon City, Philippines (URL: http://www.phivolcs.dost.gov.ph/); MIROVA (Middle InfraRed Observation of Volcanic Activity), a collaborative project between the Universities of Turin and Florence (Italy) supported by the Centre for Volcanic Risk of the Italian Civil Protection Department (URL: http://www.mirovaweb.it/); Hawai'i Institute of Geophysics and Planetology (HIGP) - MODVOLC Thermal Alerts System, School of Ocean and Earth Science and Technology (SOEST), Univ. of Hawai'i, 2525 Correa Road, Honolulu, HI 96822, USA (URL: http://modis.higp.hawaii.edu/); Copernicus Browser, Copernicus Data Space Ecosystem, European Space Agency (URL: https://dataspace.copernicus.eu/browser/); William Rogers, Legazpi City, Albay Province, Philippines.
Nishinoshima (Japan) — October 2023 Cite this Report
Nishinoshima
Japan
27.247°N, 140.874°E; summit elev. 100 m
All times are local (unless otherwise noted)
Eruption plumes and gas-and-steam plumes during May-August 2023
Nishinoshima, located about 1,000 km S of Tokyo, is a small island in the Ogasawara Arc in Japan. The island is the summit of a massive submarine volcano that has prominent submarine peaks to the S, W, and NE. Eruptions date back to 1973 and the current eruption period began in October 2022. Recent activity has consisted of small ash plumes and fumarolic activity (BGVN 48:07). This report covers activity during May through August 2023, using information from monthly reports of the Japan Meteorological Agency (JMA) monthly reports and satellite data.
Activity during May through June was relatively low. The Japan Coast Guard (JCG) did overflights on 14 and 22 June and reported white gas-and-steam emissions rising 600 m and 1,200 m from the central crater of the pyroclastic cone, respectively (figure 125). In addition, multiple white gas-and-steam emissions rose from the inner rim of the W side of the crater and from the SE flank of the pyroclastic cone. Discolored brown-to-green water was observed around almost the entire perimeter of the island; on 22 June light green discolored water was observed off the S coast of the island.
Observations from the Himawari meteorological satellite confirmed an eruption on 9 and 10 July. An eruption plume rose 1.6 km above the crater and drifted N around 1300 on 9 July. Satellite images acquired at 1420 and 2020 on 9 July and at 0220 on 10 July showed continuing emissions that rose 1.3-1.6 km above the crater and drifted NE and N. The Tokyo VAAC reported that an ash plume seen by a pilot and identified in a satellite image at 0630 on 21 July rose to 3 km altitude and drifted S.
Aerial observations conducted by JCG on 8 August showed a white-and-gray plume rising from the central crater of the pyroclastic cone, and multiple white gas-and-steam emissions were rising from the inner edge of the western crater and along the NW-SE flanks of the island (figure 126). Brown-to-green discolored water was also noted around the perimeter of the island.
Intermittent low-to-moderate power thermal anomalies were recorded in the MIROVA graph (Middle InfraRed Observation of Volcanic Activity), showing an increase in both frequency and power beginning in July (figure 127). This increase in activity coincides with eruptive activity on 9 and 10 July, characterized by eruption plumes. According to the MODVOLC thermal alert algorithm, one thermal hotspot was recorded on 20 July. Weak thermal anomalies were also detected in infrared satellite imagery, accompanied by strong gas-and-steam plumes (figure 128).
Geologic Background. The small island of Nishinoshima was enlarged when several new islands coalesced during an eruption in 1973-74. Multiple eruptions that began in 2013 completely covered the previous exposed surface and continued to enlarge the island. The island is the summit of a massive submarine volcano that has prominent peaks to the S, W, and NE. The summit of the southern cone rises to within 214 m of the ocean surface 9 km SSE.
Information Contacts: Japan Meteorological Agency (JMA), 1-3-4 Otemachi, Chiyoda-ku, Tokyo 100-8122, Japan (URL: http://www.jma.go.jp/jma/indexe.html); Tokyo Volcanic Ash Advisory Center (VAAC), 1-3-4 Otemachi, Chiyoda-ku, Tokyo 100-8122, Japan (URL: http://ds.data.jma.go.jp/svd/vaac/data/); MIROVA (Middle InfraRed Observation of Volcanic Activity), a collaborative project between the Universities of Turin and Florence (Italy) supported by the Centre for Volcanic Risk of the Italian Civil Protection Department (URL: http://www.mirovaweb.it/); Copernicus Browser, Copernicus Data Space Ecosystem, European Space Agency (URL: https://dataspace.copernicus.eu/browser/).
Krakatau (Indonesia) — October 2023 Cite this Report
Krakatau
Indonesia
6.1009°S, 105.4233°E; summit elev. 285 m
All times are local (unless otherwise noted)
White gas-and-steam plumes and occasional ash plumes during May-August 2023
Krakatau is located in the Sunda Strait between Java and Sumatra, Indonesia. Caldera collapse during the catastrophic 1883 eruption destroyed Danan and Perbuwatan cones and left only a remnant of Rakata. The post-collapse cone of Anak Krakatau (Child of Krakatau) was constructed within the 1883 caldera at a point between the former Danan and Perbuwatan cones; it has been the site of frequent eruptions since 1927. The current eruption period began in May 2021 and has recently consisted of Strombolian eruptions and ash plumes (BGVN 48:07). This report describes lower levels of activity consisting of ash and white gas-and-steam plumes during May through August 2023, based on information provided by the Indonesian Center for Volcanology and Geological Hazard Mitigation, referred to as Pusat Vulkanologi dan Mitigasi Bencana Geologi (PVMBG), MAGMA Indonesia, and satellite data.
Activity was relatively low during May and June. Daily white gas-and-steam emissions rose 25-200 m above the crater and drifted in different directions. Five ash plumes were detected at 0519 on 10 May, 1241 on 11 May, 0920 on 12 May, 2320 on 12 May, and at 0710 on 13 May, and rose 1-2.5 km above the crater and drifted SW. A webcam image taken on 12 May showed ejection of incandescent material above the vent. A total of nine ash plumes were detected during 6-11 June: at 1434 and 00220 on 6 and 7 June the ash plumes rose 500 m above the crater and drifted NW, at 1537 on 8 June the ash plume rose 1 km above the crater and drifted SW, at 0746 and at 0846 on 9 June the ash plumes rose 800 m and 3 km above the crater and drifted SW, respectively, at 0423, 1431, and 1750 on 10 June the ash plumes rose 2 km, 1.5 km, and 3.5 km above the crater and drifted NW, respectively, and at 0030 on 11 June an ash plume rose 2 km above the crater and drifted NW. Webcam images taken on 10 and 11 June at 0455 and 0102, respectively, showed incandescent material ejected above the vent. On 19 June an ash plume at 0822 rose 1.5 km above the crater and drifted SE.
Similar low activity of white gas-and-steam emissions and few ash plumes were reported during July and August. Daily white gas-and-steam emissions rose 25-300 m above the crater and drifted in multiple directions. Three ash plumes were reported at 0843, 0851, and 0852 on 20 July that rose 500-2,000 m above the crater and drifted NW.
The MIROVA (Middle InfraRed Observation of Volcanic Activity) graph of MODIS thermal anomaly data showed intermittent low-to-moderate power thermal anomalies during May through August 2023 (figure 140). Although activity was often obscured by weather clouds, a thermal anomaly was visible in an infrared satellite image of the crater on 12 May, accompanied by an eruption plume that drifted SW (figure 141).
Geologic Background. The renowned Krakatau (frequently mis-named as Krakatoa) volcano lies in the Sunda Strait between Java and Sumatra. Collapse of an older edifice, perhaps in 416 or 535 CE, formed a 7-km-wide caldera. Remnants of that volcano are preserved in Verlaten and Lang Islands; subsequently the Rakata, Danan, and Perbuwatan cones were formed, coalescing to create the pre-1883 Krakatau Island. Caldera collapse during the catastrophic 1883 eruption destroyed Danan and Perbuwatan, and left only a remnant of Rakata. This eruption caused more than 36,000 fatalities, most as a result of tsunamis that swept the adjacent coastlines of Sumatra and Java. Pyroclastic surges traveled 40 km across the Sunda Strait and reached the Sumatra coast. After a quiescence of less than a half century, the post-collapse cone of Anak Krakatau (Child of Krakatau) was constructed within the 1883 caldera at a point between the former Danan and Perbuwatan cones. Anak Krakatau has been the site of frequent eruptions since 1927.
Information Contacts: Pusat Vulkanologi dan Mitigasi Bencana Geologi (PVMBG, also known as Indonesian Center for Volcanology and Geological Hazard Mitigation, CVGHM), Jalan Diponegoro 57, Bandung 40122, Indonesia (URL: http://www.vsi.esdm.go.id/); MAGMA Indonesia, Kementerian Energi dan Sumber Daya Mineral (URL: https://magma.esdm.go.id/v1); MIROVA (Middle InfraRed Observation of Volcanic Activity), a collaborative project between the Universities of Turin and Florence (Italy) supported by the Centre for Volcanic Risk of the Italian Civil Protection Department (URL: http://www.mirovaweb.it/); Copernicus Browser, Copernicus Data Space Ecosystem, European Space Agency (URL: https://dataspace.copernicus.eu/browser/).
Villarrica (Chile) — October 2023 Cite this Report
Villarrica
Chile
39.42°S, 71.93°W; summit elev. 2847 m
All times are local (unless otherwise noted)
Strombolian activity, gas-and-ash emissions, and crater incandescence during April-September 2023
Villarrica, in central Chile, consists of a 2-km-wide caldera that formed about 3,500 years ago and is located at the base of the presently active cone at the NW margin of a 6-km-wide caldera. Historical eruptions eruptions date back to 1558 and have been characterized by mild-to-moderate explosive activity with occasional lava effusions. The current eruption period began in December 2014 and has recently consisted of nighttime crater incandescence, ash emissions, and seismicity (BGVN 48:04). This report covers activity during April through September 2023 and describes occasional Strombolian activity, gas-and-ash emissions, and nighttime crater incandescence. Information for this report primarily comes from the Southern Andes Volcano Observatory (Observatorio Volcanológico de Los Andes del Sur, OVDAS), part of Chile's National Service of Geology and Mining (Servicio Nacional de Geología y Minería, SERNAGEOMIN) and satellite data.
Seismicity during April consisted of long period (LP) events and tremor (TRE); a total of 9,413 LP-type events and 759 TR-type events were detected throughout the month. Nighttime crater incandescence persisted and was visible in the degassing column. Sulfur dioxide data was obtained using Differential Absorption Optical Spectroscopy Equipment (DOAS) that showed an average value of 1,450 ± 198 tons per day (t/d) during 1-15 April and 1,129 ± 201 t/d during 16-30 April, with a maximum daily value of 2,784 t/d on 9 April. Gas-and-steam emissions of variable intensities rose above the active crater as high as 1.3 km above the crater on 13 April. Strombolian explosions were not observed and there was a slight decrease in the lava lake level.
There were 14,123 LP-type events and 727 TR-type events detected during May. According to sulfur dioxide measurements taken with DOAS equipment, the active crater emitted an average value of 1,826 ± 482 t/d during 1-15 May and 912 ± 41 t/d during 16-30 May, with a daily maximum value of 5,155 t/d on 13 May. Surveillance cameras showed continuous white gas-and-steam emissions that rose as high as 430 m above the crater on 27 May. Nighttime incandescence illuminated the gas column less than 300 m above the crater rim was and no pyroclastic emissions were reported. A landslide was identified on 13 May on the E flank of the volcano 50 m from the crater rim and extending 300 m away; SERNAGEOMIN noted that this event may have occurred on 12 May. During the morning of 27 and 28 May minor Strombolian explosions characterized by incandescent ejecta were recorded at the crater rim; the last reported Strombolian explosions had occurred at the end of March.
Seismic activity during June consisted of five volcano-tectonic (VT)-type events, 21,606 LP-type events, and 2,085 TR-type events. The average value of sulfur dioxide flux obtained by DOAS equipment was 1,420 ± 217 t/d during 1-15 June and 2,562 ± 804 t/d, with a maximum daily value of 4,810 t/d on 17 June. White gas-and-steam emissions rose less than 480 m above the crater; frequent nighttime crater incandescence was reflected in the degassing plume. On 12 June an emission rose 100 m above the crater and drifted NNW. On 15 June one or several emissions resulted in ashfall to the NE as far as 5.5 km from the crater, based on a Skysat satellite image. Several Strombolian explosions occurred within the crater; activity on 15 June was higher energy and ejected blocks 200-300 m on the NE slope. Surveillance cameras showed white gas-and-steam emissions rising 480 m above the crater on 16 June. On 19 and 24 June low-intensity Strombolian activity was observed, ejecting material as far as 200 m from the center of the crater to the E.
During July, seismicity included 29,319 LP-type events, 3,736 TR-type events, and two VT-type events. DOAS equipment recorded two days of sulfur dioxide emissions of 4,220 t/d and 1,009 t/d on 1 and 13 July, respectively. Constant nighttime incandescence was also recorded and was particularly noticeable when accompanied by eruptive columns on 12 and 16 July. Minor explosive events were detected in the crater. According to Skysat satellite images taken on 12, 13, and 16 July, ashfall deposits were identified 155 m S of the crater. According to POVI, incandescence was visible from two vents on the crater floor around 0336 on 12 July. Gas-and-ash emissions rose as high as 1.2 km above the crater on 13 July and drifted E and NW. A series of gas-and-steam pulses containing some ash deposited material on the upper E flank around 1551 on 13 July. During 16-31 July, average sulfur dioxide emissions of 1,679 ± 406 t/d were recorded, with a maximum daily value of 2,343 t/d on 28 July. Fine ash emissions were also reported on 16, 17, and 23 July.
Seismicity persisted during August, characterized by 27,011 LP-type events, 3,323 TR-type events, and three VT-type events. The average value of sulfur dioxide measurements taken during 1-15 August was 1,642 ± 270 t/d and 2,207 ± 4,549 t/d during 16-31 August, with a maximum daily value of 3,294 t/d on 27 August. Nighttime crater incandescence remained visible in degassing columns. White gas-and-steam emissions rose 480 m above the crater on 6 August. According to a Skysat satellite image from 6 August, ash accumulation was observed proximal to the crater and was mainly distributed toward the E slope. White gas-and-steam emissions rose 320 m above the crater on 26 August. Nighttime incandescence and Strombolian activity that generated ash emissions were reported on 27 August.
Seismicity during September was characterized by five VT-type events, 12,057 LP-type events, and 2,058 TR-type events. Nighttime incandescence persisted. On 2 September an ash emission rose 180 m above the crater and drifted SE at 1643 (figure 125) and a white gas-and-steam plume rose 320 m above the crater. According to the Buenos Aires VAAC, periods of continuous gas-and-ash emissions were visible in webcam images from 1830 on 2 September to 0110 on 3 September. Strombolian activity was observed on 2 September and during the early morning of 3 September, the latter event of which generated an ash emission that rose 60 m above the crater and drifted 100 m from the center of the crater to the NE and SW. Ashfall was reported to the SE and S as far as 750 m from the crater. The lava lake was active during 3-4 September and lava fountaining was visible for the first time since 26 March 2023, according to POVI. Fountains captured in webcam images at 2133 on 3 September and at 0054 on 4 September rose as high as 60 m above the crater rim and ejected material onto the upper W flank. Sulfur dioxide flux of 1,730 t/d and 1,281 t/d was measured on 3 and 4 September, respectively, according to data obtained by DOAS equipment.
Strong Strombolian activity and larger gas-and-ash plumes were reported during 18-20 September. On 18 September activity was also associated with energetic LP-type events and notable sulfur dioxide fluxes (as high as 4,277 t/d). On 19 September Strombolian activity and incandescence were observed. On 20 September at 0914 ash emissions rose 50 m above the crater and drifted SSE, accompanied by Strombolian activity that ejected material less than 100 m SSE, causing fall deposits on that respective flank. SERNAGEOMIN reported that a Planet Scope satellite image taken on 20 September showed the lava lake in the crater, measuring 32 m x 35 m and an area of 0.001 km2. Several ash emissions were recorded at 0841, 0910, 1251, 1306, 1312, 1315, and 1324 on 23 September and rose less than 150 m above the crater. The sulfur dioxide flux value was 698 t/d on 23 September and 1,097 t/d on 24 September. On 24 September the Volcanic Alert Level (VAL) was raised to Orange (the third level on a four-color scale). SENAPRED maintained the Alert Level at Yellow (the middle level on a three-color scale) for the communities of Villarrica, Pucón (16 km N), Curarrehue, and Panguipulli.
During 24-25 September there was an increase in seismic energy (observed at TR-events) and acoustic signals, characterized by 1 VT-type event, 213 LP-type events, and 124 TR-type events. Mainly white gas-and-steam emissions, in addition to occasional fine ash emissions were recorded. During the early morning of 25 September Strombolian explosions were reported and ejected material 250 m in all directions, though dominantly toward the NW. On 25 September the average value of sulfur dioxide flux was 760 t/d. Seismicity during 25-30 September consisted of five VT-type events, 1,937 LP-type events, and 456 TR-type events.
During 25-29 September moderate Strombolian activity was observed and ejected material as far as the crater rim. In addition, ash pulses lasting roughly 50 minutes were observed around 0700 and dispersed ENE. During 26-27 September a TR episode lasted 6.5 hours and was accompanied by discrete acoustic signals. Satellite images from 26 September showed a spatter cone on the crater floor with one vent that measured 10 x 14 m and a smaller vent about 35 m NE of the cone. SERNAGEOMIN reported an abundant number of bomb-sized blocks up to 150 m from the crater, as well as impact marks on the snow, which indicated explosive activity. A low-altitude ash emission was observed drifting NW around 1140 on 28 September, based on webcam images. Between 0620 and 0850 on 29 September an ash emission rose 60 m above the crater and drifted NW. During an overflight taken around 1000 on 29 September scientists observed molten material in the vent, a large accumulation of pyroclasts inside the crater, and energetic degassing, some of which contained a small amount of ash. Block-sized pyroclasts were deposited on the internal walls and near the crater, and a distal ash deposit was also visible. The average sulfur dioxide flux measured on 28 September was 344 t/d. Satellite images taken on 29 September ashfall was deposited roughly 3 km WNW from the crater and nighttime crater incandescence remained visible. The average sulfur dioxide flux value from 29 September was 199 t/d. On 30 September at 0740 a pulsating ash emission rose 1.1 km above the crater and drifted NNW (figure 126). Deposits on the S flank extended as far as 4.5 km from the crater rim, based on satellite images from 30 September.
Infrared MODIS satellite data processed by MIROVA (Middle InfraRed Observation of Volcanic Activity) showed intermittent thermal activity during April through September, with slightly stronger activity detected during late September (figure 127). Small clusters of thermal activity were detected during mid-June, early July, early August, and late September. According to the MODVOLC thermal alert system, a total of four thermal hotspots were detected on 7 July and 3 and 23 September. This activity was also intermittently captured in infrared satellite imagery on clear weather days (figure 128).
Geologic Background. The glacier-covered Villarrica stratovolcano, in the northern Lakes District of central Chile, is ~15 km south of the city of Pucon. A 2-km-wide caldera that formed about 3,500 years ago is located at the base of the presently active, dominantly basaltic to basaltic andesite cone at the NW margin of a 6-km-wide Pleistocene caldera. More than 30 scoria cones and fissure vents are present on the flanks. Plinian eruptions and pyroclastic flows that have extended up to 20 km from the volcano were produced during the Holocene. Lava flows up to 18 km long have issued from summit and flank vents. Eruptions documented since 1558 CE have consisted largely of mild-to-moderate explosive activity with occasional lava effusion. Glaciers cover 40 km2 of the volcano, and lahars have damaged towns on its flanks.
Information Contacts: Servicio Nacional de Geología y Minería (SERNAGEOMIN), Observatorio Volcanológico de Los Andes del Sur (OVDAS), Avda Sta María No. 0104, Santiago, Chile (URL: http://www.sernageomin.cl/); Proyecto Observación Villarrica Internet (POVI) (URL: http://www.povi.cl/); Sistema y Servicio Nacional de Prevención y Repuesta Ante Desastres (SENAPRED), Av. Beauchef 1671, Santiago, Chile (URL: https://web.senapred.cl/); Buenos Aires Volcanic Ash Advisory Center (VAAC), Servicio Meteorológico Nacional-Fuerza Aérea Argentina, 25 de mayo 658, Buenos Aires, Argentina (URL: http://www.smn.gov.ar/vaac/buenosaires/inicio.php); MIROVA (Middle InfraRed Observation of Volcanic Activity), a collaborative project between the Universities of Turin and Florence (Italy) supported by the Centre for Volcanic Risk of the Italian Civil Protection Department (URL: http://www.mirovaweb.it/); Hawai'i Institute of Geophysics and Planetology (HIGP) - MODVOLC Thermal Alerts System, School of Ocean and Earth Science and Technology (SOEST), Univ. of Hawai'i, 2525 Correa Road, Honolulu, HI 96822, USA (URL: http://modis.higp.hawaii.edu/); Copernicus Browser, Copernicus Data Space Ecosystem, European Space Agency (URL: https://dataspace.copernicus.eu/browser/).
Merapi (Indonesia) — October 2023 Cite this Report
Merapi
Indonesia
7.54°S, 110.446°E; summit elev. 2910 m
All times are local (unless otherwise noted)
Frequent incandescent avalanches during April-September 2023
Merapi, located just north of the major city of Yogyakarta in central Java, Indonesia, has had activity within the last 20 years characterized by pyroclastic flows and lahars accompanying growth and collapse of the steep-sided active summit lava dome. The current eruption period began in late December 2020 and has more recently consisted of ash plumes, intermittent incandescent avalanches of material, and pyroclastic flows (BGVN 48:04). This report covers activity during April through September 2023, based on information from Balai Penyelidikan dan Pengembangan Teknologi Kebencanaan Geologi (BPPTKG), the Center for Research and Development of Geological Disaster Technology, a branch of PVMBG which specifically monitors Merapi. Additional information comes from the Pusat Vulkanologi dan Mitigasi Bencana Geologi (PVMBG, also known as Indonesian Center for Volcanology and Geological Hazard Mitigation, CVGHM), MAGMA Indonesia, the Darwin Volcanic Ash Advisory Centre (VAAC), and various satellite data.
Activity during April through September 2023 primarily consisted of incandescent avalanches of material that mainly affected the SW and W flanks and traveled as far as 2.3 km from the summit (table 25) and white gas-and-steam emissions that rose 10-1,000 m above the crater.
Table 25. Monthly summary of avalanches and avalanche distances recorded at Merapi during April through September 2023. The number of reported avalanches does not include instances where possible avalanches were heard but could not be visually confirmed as a result of inclement weather. Data courtesy of BPPTKG (April-September 2023 daily reports).
| Month |
Average number of avalanches per day |
Distance avalanches traveled (m) |
| Apr 2023 |
19 |
1,200-2,000 |
| May 2023 |
22 |
500-2,000 |
| Jun 2023 |
18 |
1,200-2,000 |
| Jul 2023 |
30 |
300-2,000 |
| Aug 2023 |
25 |
400-2,300 |
| Sep 2023 |
23 |
600-2,000 |
BPPTKG reported that during April and May white gas-and-steam emissions rose 10-750 m above the crater, incandescent avalanches descended 500-2,000 m on the SW and W flanks (figure 135). Cloudy weather often prevented clear views of the summit, and sometimes avalanches could not be confirmed. According to a webcam image, a pyroclastic flow was visible on 17 April at 0531. During the week of 28 April and 4 May a pyroclastic flow was reported on the SW flank, traveling up to 2.5 km. According to a drone overflight taken on 17 May the SW lava dome volume was an estimated 2,372,800 cubic meters and the dome in the main crater was an estimated 2,337,300 cubic meters.
During June and July similar activity persisted with white gas-and-steam emissions rising 10-350 m above the crater and frequent incandescent avalanches that traveled 300-2,000 m down the SW, W, and S flanks (figure 136). Based on an analysis of aerial photos taken on 24 June the volume of the SW lava dome was approximately 2.5 million cubic meters. A pyroclastic flow was observed on 5 July that traveled 2.7 km on the SW flank. According to the Darwin VAAC multiple minor ash plumes were identified in satellite images on 19 July that rose to 3.7 km altitude and drifted S and SW. During 22, 25, and 26 July a total of 17 avalanches descended as far as 1.8 km on the S flank.
Frequent white gas-and-steam emissions continued during August and September, rising 10-450 m above the crater. Incandescent avalanches mainly affected the SW and W flanks and traveled 400-2,300 m from the vent (figure 137). An aerial survey conducted on 10 August was analyzed and reported that estimates of the SW dome volume was 2,764,300 cubic meters and the dome in the main crater was 2,369,800 cubic meters.
Frequent and moderate-power thermal activity continued throughout the reporting period, according to a MIROVA (Middle InfraRed Observation of Volcanic Activity) analysis of MODIS satellite data (figure 138). There was an increase in the number of detected anomalies during mid-May. The MODVOLC thermal algorithm recorded a total of 47 thermal hotspots: six during April, nine during May, eight during June, 15 during July, four during August, and five during September. Some of this activity was captured in infrared satellite imagery on clear weather days, sometimes accompanied by incandescent material on the SW flank (figure 139).
Geologic Background. Merapi, one of Indonesia's most active volcanoes, lies in one of the world's most densely populated areas and dominates the landscape immediately north of the major city of Yogyakarta. It is the youngest and southernmost of a volcanic chain extending NNW to Ungaran volcano. Growth of Old Merapi during the Pleistocene ended with major edifice collapse perhaps about 2,000 years ago, leaving a large arcuate scarp cutting the eroded older Batulawang volcano. Subsequent growth of the steep-sided Young Merapi edifice, its upper part unvegetated due to frequent activity, began SW of the earlier collapse scarp. Pyroclastic flows and lahars accompanying growth and collapse of the steep-sided active summit lava dome have devastated cultivated lands on the western-to-southern flanks and caused many fatalities.
Information Contacts: Balai Penyelidikan dan Pengembangan Teknologi Kebencanaan Geologi (BPPTKG), Center for Research and Development of Geological Disaster Technology (URL: http://merapi.bgl.esdm.go.id/, Twitter: @BPPTKG); MAGMA Indonesia, Kementerian Energi dan Sumber Daya Mineral (URL: https://magma.esdm.go.id/v1); Pusat Vulkanologi dan Mitigasi Bencana Geologi (PVMBG, also known as Indonesian Center for Volcanology and Geological Hazard Mitigation, CVGHM), Jalan Diponegoro 57, Bandung 40122, Indonesia (URL: http://www.vsi.esdm.go.id/); Darwin Volcanic Ash Advisory Centre (VAAC), Bureau of Meteorology, Northern Territory Regional Office, PO Box 40050, Casuarina, NT 0811, Australia (URL: http://www.bom.gov.au/info/vaac/); MIROVA (Middle InfraRed Observation of Volcanic Activity), a collaborative project between the Universities of Turin and Florence (Italy) supported by the Centre for Volcanic Risk of the Italian Civil Protection Department (URL: http://www.mirovaweb.it/); Hawai'i Institute of Geophysics and Planetology (HIGP) - MODVOLC Thermal Alerts System, School of Ocean and Earth Science and Technology (SOEST), Univ. of Hawai'i, 2525 Correa Road, Honolulu, HI 96822, USA (URL: http://modis.higp.hawaii.edu/); Copernicus Browser, Copernicus Data Space Ecosystem, European Space Agency (URL: https://dataspace.copernicus.eu/browser/); Øystein Lund Andersen (URL: https://www.oysteinlundandersen.com/, https://twitter.com/oysteinvolcano).
Ebeko
Russia
50.686°N, 156.014°E; summit elev. 1103 m
All times are local (unless otherwise noted)
Moderate explosive activity with ash plumes continued during June-November 2023
Ebeko, located on the N end of Paramushir Island in Russia’s Kuril Islands just S of the Kamchatka Peninsula, consists of three summit craters along a SSW-NNE line at the northern end of a complex of five volcanic cones. Observed eruptions date back to the late 18th century and have been characterized as small-to-moderate explosions from the summit crater, accompanied by intense fumarolic activity. The current eruptive period began in June 2022, consisting of frequent explosions, ash plumes, and thermal activity (BGVN 47:10, 48:06). This report covers similar activity during June-November 2023, based on information from the Kamchatka Volcanic Eruptions Response Team (KVERT) and satellite data.
Moderate explosive activity continued during June-November 2023 (figures 50 and 51). According to visual data from Severo-Kurilsk, explosions sent ash 2-3.5 km above the summit (3-4.5 km altitude) during most days during June through mid-September. Activity after mid-September was slightly weaker, with ash usually reaching less than 2 km above the summit. According to KVERT the volcano in October and November was, with a few exceptions, either quiet or obscured by clouds that prevented satellite observations. KVERT issued Volcano Observatory Notices for Aviation (VONA) on 8 and 12 June, 13 and 22 July, 3 and 21 August, and 31 October warning of potential aviation hazards from ash plumes drifting 3-15 km from the volcano. Based on satellite data, KVERT reported a persistent thermal anomaly whenever weather clouds permitted viewing.
Geologic Background. The flat-topped summit of the central cone of Ebeko volcano, one of the most active in the Kuril Islands, occupies the northern end of Paramushir Island. Three summit craters located along a SSW-NNE line form Ebeko volcano proper, at the northern end of a complex of five volcanic cones. Blocky lava flows extend west from Ebeko and SE from the neighboring Nezametnyi cone. The eastern part of the southern crater contains strong solfataras and a large boiling spring. The central crater is filled by a lake about 20 m deep whose shores are lined with steaming solfataras; the northern crater lies across a narrow, low barrier from the central crater and contains a small, cold crescentic lake. Historical activity, recorded since the late-18th century, has been restricted to small-to-moderate explosive eruptions from the summit craters. Intense fumarolic activity occurs in the summit craters, on the outer flanks of the cone, and in lateral explosion craters.
Information Contacts: Kamchatka Volcanic Eruptions Response Team (KVERT), Far Eastern Branch, Russian Academy of Sciences, 9 Piip Blvd., Petropavlovsk-Kamchatsky, 683006, Russia (URL: http://www.kscnet.ru/ivs/kvert/).
Search Bulletin Archive by Publication Date
Select a month and year from the drop-downs and click "Show Issue" to have that issue displayed in this tab.
The default month and year is the latest issue available.
Bulletin of the Global Volcanism Network - Volume 17, Number 06 (June 1992)
Managing Editor: Lindsay McClelland
Agrigan (United States)
Thermal activity but no seismicity or deformation
Aira (Japan)
Explosions and seismicity less frequent
Alamagan (United States)
Fumarolic activity but no shallow seismicity
Anatahan (United States)
Thermal activity but deformation unchanged
Arenal (Costa Rica)
Lava production and tephra ejection continue
Asosan (Japan)
Explosions follow increased seismicity and heating of crater lake
Asuncion (United States)
Strong steaming
Bogoslof (United States)
Steam and ash emission
Chichon, El (Mexico)
Frequent rockfalls and continued thermal activity
Clark (New Zealand)
New submarine volcano identified; no gas bubbling
Clear Lake Volcanic Field (United States)
50 small seismic events triggered by M 7.5 earthquake hundreds of km away
Colima (Mexico)
Rockfalls and thermal activity; large lahar deposit described
Etna (Italy)
Continued flank lava production
Farallon de Pajaros (United States)
Vigorous fuming
Galeras (Colombia)
Strong explosion destroys most of summit lava dome
Guguan (United States)
No gas emission
Irazu (Costa Rica)
Fumarolic activity and seismicity continue
Karangetang (Indonesia)
Some decline in explosive activity, lava production, and seismicity, but glowing rockfalls advance 1.5 km
Kilauea (United States)
Continued east rift lava production
Kozushima (Japan)
Earthquake and aftershocks
Langila (Papua New Guinea)
Strombolian explosions and lava flow
Lascar (Chile)
Satellite data show heat from lava dome
Lassen Volcanic Center (United States)
Seismicity apparently triggered by M 7.5 earthquake hundreds of kilometers away
Lengai, Ol Doinyo (Tanzania)
Lava ejection from small crater-floor vent
Long Valley (United States)
Abrupt increase in seismicity triggered by M 7.5 earthquake hundreds of kilometers away
Manam (Papua New Guinea)
Strong ash ejections; Strombolian explosions; lava and pyroclastic flows
Marapi (Indonesia)
Explosion kills one person and injures five others
Maug Islands (United States)
No activity evident
Medicine Lake (United States)
Seismicity apparently triggered by M 7.5 earthquake hundreds of kilometers away
Nyamulagira (DR Congo)
Continued lava production from fissure vents
Pagan (United States)
Recent small ash eruption; long-period earthquakes and tremor; inflation
Pinatubo (Philippines)
Lava dome extruded into caldera lake; small steam-and-ash ejections; lahars and secondary explosions
Poas (Costa Rica)
Vigorous gas emission in and around crater lake; continued seismicity
Rabaul (Papua New Guinea)
Uplift and seismicity increase slightly
Rincon de la Vieja (Costa Rica)
Continued fumarolic activity
Rumble III (New Zealand)
Gas bubbles detected; summit 140 m below surface
Rumble IV (New Zealand)
Gas bubbles detected; summit 450 m below surface
Rumble V (New Zealand)
New submarine volcano identified; rising gas bubbles
Sarigan (United States)
No activity evident
Shasta (United States)
No seismicity triggered by M 7.5 earthquake hundreds of kilometers away
Spurr (United States)
Details of 27 June eruptive cloud
Stromboli (Italy)
Small explosions and seismicity continue
Tangaroa (New Zealand)
New submarine volcano identified; no gas bubbling
Turrialba (Costa Rica)
Occasional seismicity
Unzendake (Japan)
Continued lava dome growth generates pyroclastic flows
Agrigan (United States) — June 1992 Cite this Report
Agrigan
United States
18.77°N, 145.67°E; summit elev. 965 m
All times are local (unless otherwise noted)
Thermal activity but no seismicity or deformation
A six-member team of USGS volcanologists visited the Commonwealth of the Northern Mariana Islands 11-27 May 1992 at the request of the CNMI Office of Civil Defense. The team observed all of the islands in the chain N of Saipan, installed a new seismic station at the base of frequently active Pagan, remeasured existing EDM networks, mapped the geology of Alamagan, sampled fumaroles and hot springs, and collected rocks and charcoal for radiocarbon dating. No volcanoes in the chain erupted during the observation period.
Remeasurement of five EDM lines on 15-16 May yielded no significant changes (>1 cm) since the network was established in September 1990. Two seismometers temporarily operated on the caldera floor recorded no local shallow seismicity. The temperature of the boiling spring in the caldera was 98°C, the same as in 1990. The volume of water issuing from the hot spring was less than in 1990, maybe because of seasonal rainfall variations. The highest measured fumarole temperature was 102°C, 4° higher than in 1990, perhaps related to a drop in the water table.
Geologic Background. The highest of the Marianas arc volcanoes, Agrigan contains a 500-m-deep, flat-floored caldera. The elliptical island is 8 km long; its summit is the top of a massive 4000-m-high submarine volcano. Deep radial valleys dissect the flanks of the thickly vegetated stratovolcano. The elongated caldera is 1 x 2 km wide and is breached to the NW, from where a prominent lava flow extends to the coast and forms a lava delta. The caldera floor is surfaced by fresh-looking lava flows and also contains two cones that may have formed during the only historical eruption in 1917. This eruption deposited large blocks and 3 m of ash and lapilli on a village on the SE coast, prompting its evacuation.
Information Contacts: R. Moore, USGS; R. Koyanagi, M. Sako, and F. Trusdell, HVO.
Aira
Japan
31.5772°N, 130.6589°E; summit elev. 1117 m
All times are local (unless otherwise noted)
Explosions and seismicity less frequent
Only two explosions occurred . . . in June, causing no damage. The month's highest ash clouds rose 2,000 m on 9 and 18 June. Two 9-hour swarms of volcanic earthquakes were recorded, a relatively low level of seismicity for the volcano.
Geologic Background. The Aira caldera in the northern half of Kagoshima Bay contains the post-caldera Sakurajima volcano, one of Japan's most active. Eruption of the voluminous Ito pyroclastic flow accompanied formation of the 17 x 23 km caldera about 22,000 years ago. The smaller Wakamiko caldera was formed during the early Holocene in the NE corner of the caldera, along with several post-caldera cones. The construction of Sakurajima began about 13,000 years ago on the southern rim and built an island that was joined to the Osumi Peninsula during the major explosive and effusive eruption of 1914. Activity at the Kitadake summit cone ended about 4,850 years ago, after which eruptions took place at Minamidake. Frequent eruptions since the 8th century have deposited ash on the city of Kagoshima, located across Kagoshima Bay only 8 km from the summit. The largest recorded eruption took place during 1471-76.
Information Contacts: JMA.
Alamagan (United States) — June 1992 Cite this Report
Alamagan
United States
17.6°N, 145.83°E; summit elev. 744 m
All times are local (unless otherwise noted)
Fumarolic activity but no shallow seismicity
A six-member team of USGS volcanologists visited the Commonwealth of the Northern Mariana Islands 11-27 May 1992 at the request of the CNMI Office of Civil Defense. The team observed all of the islands in the chain N of Saipan, installed a new seismic station at the base of frequently active Pagan, remeasured existing EDM networks, mapped the geology of Alamagan, sampled fumaroles and hot springs, and collected rocks and charcoal for radiocarbon dating.
[At Alamagan] the team measured a temperature of 72°C at one fumarole. No shallow earthquakes or volcanic tremor have been recorded on the Alamagan seismic station since it was installed in September 1990. Charcoal was collected that should date the youngest and one of the oldest eruptions.
Geologic Background. Alamagan is the emergent summit of a large stratovolcano in the central Mariana Islands with a roughly 350-m-deep summit crater east of the center of the island. The exposed cone is largely Holocene in age. A 1.6 x 1 km graben cuts the SW flank. An extensive basaltic andesite lava flow has extended the northern coast of the island, and a lava platform also occurs on the S flank. Pyroclastic-flow deposits erupted about 1000 years ago have been dated, but reports of historical eruptions were considered invalid (Moore and Trusdell, 1993).
Information Contacts: R. Moore, USGS; R. Koyanagi, M. Sako, and F. Trusdell, HVO.
Anatahan (United States) — June 1992 Cite this Report
Anatahan
United States
16.35°N, 145.67°E; summit elev. 790 m
All times are local (unless otherwise noted)
Thermal activity but deformation unchanged
A six-member team of USGS volcanologists visited the Commonwealth of the Northern Mariana Islands 11-27 May 1992 at the request of the CNMI Office of Civil Defense. The team observed all of the islands in the chain N of Saipan, installed a new seismic station at the base of frequently active Pagan, remeasured existing EDM networks, mapped the geology of Alamagan, sampled fumaroles and hot springs, and collected rocks and charcoal for radiocarbon dating. No volcanoes in the chain erupted during the observation period.
Remeasurement of the EDM network on 22 May showed no significant changes, consistent with the lack of shallow seismicity since September 1990. Boiling hot springs on the eastern crater floor and solfataras at the base of the nearby crater wall had maximum temperatures of 98°C.
Geologic Background. The elongate, 9-km-long island of Anatahan in the central Mariana Islands consists of a large stratovolcano with a 2.3 x 5 km compound summit caldera. The larger western portion of the caldera is 2.3 x 3 km wide, and its western rim forms the island's high point. Ponded lava flows overlain by pyroclastic deposits fill the floor of the western caldera, whose SW side is cut by a fresh-looking smaller crater. The 2-km-wide eastern portion of the caldera contained a steep-walled inner crater whose floor prior to the 2003 eruption was only 68 m above sea level. A submarine cone, named NE Anatahan, rises to within 460 m of the sea surface on the NE flank, and numerous other submarine vents are found on the NE-to-SE flanks. Sparseness of vegetation on the most recent lava flows had indicated that they were of Holocene age, but the first historical eruption did not occur until May 2003, when a large explosive eruption took place forming a new crater inside the eastern caldera.
Information Contacts: R. Moore, USGS; R. Koyanagi, M. Sako, and F. Trusdell, HVO.
Arenal
Costa Rica
10.463°N, 84.703°W; summit elev. 1670 m
All times are local (unless otherwise noted)
Lava production and tephra ejection continue
Lava production, tephra ejection, and fumarolic activity continued through mid-July. Most of the W-flank lava moved down a channel feeding the flow's S lobe, which moved into young forest on the WSW flank, an area that had been affected by the 1968 pyroclastic flows. Since mid-May, the S lobe's front had advanced almost 300 m, reaching 665 m elevation on 10 June and 650 m elevation by the 24th. As it advanced, the lava flow continued to start fires that burned well over a hectare of the surrounding woodland. Between 12 and 22 July, the flow front advanced at an average rate of ~20 m/day, reaching ~2.5 km from the new summit crater (C). The lava supply to the N lobe had dwindled, and its front had halted at 830 m elevation.
Explosions were stronger and more numerous in June than in May. Some caused rumbling that vibrated house windows in La Palma, 4 km N of the volcano. An impact crater 1 m in diameter and 30 cm deep was found at 780 m elevation on the W flank, and large blocks frequently reached slightly >1 km from the new summit crater (C) 12-22 July. Some ash columns rose >1 km above Crater C. The rate of explosions varied; during observations on 12 June, an explosion was heard every hour. Ashfall on the observation point at 780 m elevation, 1.8 km W of the active crater, accumulated more rapidly in the 4 weeks ending 10 June than in the succeeding 2 weeks (see table 5). Vegetation on the NE, E, and SE flanks continues to be affected by acid rain and tephra fall, as it has for more than 20 years. Fumarolic activity occurred from the remnants of the old summit crater (D).
Volcanic seismicity recorded at a station (Fortuna) 4 km E of the active crater averaged 30 events/day, with a maximum of 51 on 18 June (figure 48). Conspicuous tremor episodes occurred on 4, 6, 10, 17, and 30 June. The level of both seismic and pyroclastic activity decreased 12-22 July, as did the number of avalanches from the advancing lava flow front.
Geologic Background. Conical Volcán Arenal is the youngest stratovolcano in Costa Rica and one of its most active. The 1670-m-high andesitic volcano towers above the eastern shores of Lake Arenal, which has been enlarged by a hydroelectric project. Arenal lies along a volcanic chain that has migrated to the NW from the late-Pleistocene Los Perdidos lava domes through the Pleistocene-to-Holocene Chato volcano, which contains a 500-m-wide, lake-filled summit crater. The earliest known eruptions of Arenal took place about 7000 years ago, and it was active concurrently with Cerro Chato until the activity of Chato ended about 3500 years ago. Growth of Arenal has been characterized by periodic major explosive eruptions at several-hundred-year intervals and periods of lava effusion that armor the cone. An eruptive period that began with a major explosive eruption in 1968 ended in December 2010; continuous explosive activity accompanied by slow lava effusion and the occasional emission of pyroclastic flows characterized the eruption from vents at the summit and on the upper western flank.
Information Contacts: E. Fernández, J. Barquero, and V. Barboza, OVSICORI; G. Soto, ICE; M. Fernández, Univ de Costa Rica.
Asosan
Japan
32.8849°N, 131.085°E; summit elev. 1592 m
All times are local (unless otherwise noted)
Explosions follow increased seismicity and heating of crater lake
Eruptions that occurred from Crater 1 during the night of 30 June-1 July were the first [strong explosions] since . . . December 1990. The daily number of isolated volcanic tremor episodes began to increase in October 1991, and had reached ~100/day by the end of May. Isolated tremor episodes rapidly became more frequent in late June, and the amplitude of continuous tremor also increased through the month.
Ejections of mud and water from the lake in Crater 1 were first noted on 23 April and were sporadically observed later in April and in May. The ejections became more vigorous in late June, increasing in height from 5 m on 24 June to 20 m on the 26th, 50 m on the 29th, and 150 m on the 30th. Surface temperatures of the lake water increased from around 20°C in May 1991 to 78°C in June 1992. Steam plumes also grew to 1,000 m height in late June.
Strong tremor episodes were recorded during the night of 30 June-1 July. During fieldwork at noon on 1 July, the crater was quiet, but many blocks to 0.8 m across had been scattered to 100 m from the crater's NE rim. The eruptions were not seen or heard, but seismic and air-vibration records suggested that they may have occurred at 2349 on 30 June and 0316 on 1 July.
Tremor decreased in early July, but remained at higher levels than in mid-June. Ejections of mud and water to heights of a few tens of meters occurred sporadically through early July, but no additional strong mud/water ejections or eruptions were reported.
Because of the increasing activity, the area within 1 km of the crater was closed to tourists on 24 June, and remained closed as of mid-July.
Geologic Background. The 24-km-wide Asosan caldera was formed during four major explosive eruptions from 300,000 to 90,000 years ago. These produced voluminous pyroclastic flows that covered much of Kyushu. The last of these, the Aso-4 eruption, produced more than 600 km3 of airfall tephra and pyroclastic-flow deposits. A group of 17 central cones was constructed in the middle of the caldera, one of which, Nakadake, is one of Japan's most active volcanoes. It was the location of Japan's first documented historical eruption in 553 CE. The Nakadake complex has remained active throughout the Holocene. Several other cones have been active during the Holocene, including the Kometsuka scoria cone as recently as about 210 CE. Historical eruptions have largely consisted of basaltic to basaltic andesite ash emission with periodic strombolian and phreatomagmatic activity. The summit crater of Nakadake is accessible by toll road and cable car, and is one of Kyushu's most popular tourist destinations.
Information Contacts: JMA.
Asuncion (United States) — June 1992 Cite this Report
Asuncion
United States
19.671°N, 145.406°E; summit elev. 857 m
All times are local (unless otherwise noted)
Strong steaming
A six-member team of USGS volcanologists visited the Commonwealth of the Northern Mariana Islands 11-27 May 1992 at the request of the CNMI Office of Civil Defense. Vigorous steaming was occurring from several locations in the summit crater [of Asuncion] during observations from a helicopter on 18 May.
Geologic Background. A single large asymmetrical stratovolcano forms 3-km-wide Asuncion Island. The steeper NE flank terminates in high sea cliffs, while the gentler SW flanks have low-angle slopes bounded by sea cliffs only a few meters high. The southern flank is cut by a large landslide scar. The S and W flanks are covered by ash deposits. An explosive eruption in 1906 produced lava flows that descended about halfway down the W and SE flanks, but several other eruption reports are of uncertain validity.
Information Contacts: R. Moore, USGS; R. Koyanagi, M. Sako, and F. Trusdell, HVO.
Bogoslof (United States) — June 1992 Cite this Report
Bogoslof
United States
53.93°N, 168.03°W; summit elev. 150 m
All times are local (unless otherwise noted)
Steam and ash emission
A eruption . . . had begun by 6 July, when airplane pilots first reported steam and ash rising through low clouds. Similar activity was seen through the week, when satellite images revealed repeated plumes from Bogoslof. Pilots reported a cloud to ~3 km altitude on 14 July at 1815. Satellite images showed the plume extending roughly 100 km SE, to the S side of Unalaska Island. An image from 16 July at 1140 showed another plume extending ~100 km E to Unalaska. That day, a pilot saw a white plume rising to ~4 km altitude. An episode of vigorous steam and ash ejection began on 20 July at about 1700, and material had reached nearly 8 km asl by 1725, drifting NNE. A dark gray cloud that was ~15 km wide at 3 km altitude was moving NW from the volcano several hours later. Poor weather prevented subsequent observations, but satellite images showed no volcanic plumes rising above weather-cloud tops at ~6 km elevation. There have been no reports of ashfall. Cloudy weather has prevented direct observation of the island . . . .
Geologic Background. Bogoslof is the emergent summit of a submarine volcano that lies 40 km N of the main Aleutian arc. It rises 1,500 m above the Bering Sea floor. Repeated construction and destruction of lava domes at different locations during historical time has greatly modified the appearance of this "Jack-in-the-Box" volcano and has introduced a confusing nomenclature applied during frequent visits by exploring expeditions. The present triangular-shaped, 0.75 x 2 km island consists of remnants of lava domes emplaced from 1796 to 1992. Castle Rock (Old Bogoslof) is a steep-sided pinnacle that is a remnant of a spine from the 1796 eruption. The small Fire Island (New Bogoslof), about 600 m NW of Bogoslof Island, is a remnant of a lava dome formed in 1883.
Information Contacts: AVO; SAB.
El Chichon
Mexico
17.3602°N, 93.2297°W; summit elev. 1150 m
All times are local (unless otherwise noted)
Frequent rockfalls and continued thermal activity
The following, from José Luís Macías, Arturo Macías, Jean-Christophe Komorowski, Claus Siebe, and Robert Tilling, describes observations during fieldwork 18 April-21 May 1992, ten years after the major 1982 eruption.
Geology. We made several visits to the crater. The very significant erosion that has occurred in the last 10 years allowed us to descend relatively easily into the crater through its SE wall, where the rim's altitude is 1,060 m. The crater floor is at 900 m elevation.
The only changes that we noticed during our visits were caused by frequent rockfalls from the crater walls. Between the first and second visits, on 19 April and 3 May, new crater-floor rockfall deposits had originated from the SE crater wall. Recently exhumed fault planes veneered by secondary mineralization in the crater wall were also quite common. On the SE part of the rim, a fracture system 90 m long, 6-9 cm wide at its SE end, and 0.2-8 cm wide at the NE end, trended N 65°E, and was associated with mild fumarolic activity. The fracture cuts through bedded domal talus breccia mapped by Rose and others (1984) and might evolve to produce rockfalls in the near future. Several other curviplanar slump fractures encompass apparent areas of several hundred square meters on the crater wall. Thus, more vigorous rockfall activity might be expected, particularly during the coming rainy season or periods of heightened regional seismic activity.
People living near the volcano reported an eruption in late March or early April that produced light ashfall near the volcano, and was accompanied by loud, thunder-like noises. We think that the ashfall most likely was dust produced during large rockfalls from the crater walls, and the noise was the sound of the rockfalls. Eruption-like dust clouds produced by rockfall activity have been described at Kīlauea by Tilling (1974) and Tilling and others (1975).
To try to reduce local alarm, J.L. Macías and J.-C. Komorowski described the current activity and their interpretations of it during an informal conference on 19 May with residents of Chapultenango (11 km ESE of the crater), local authorities, and a group of elementary school teachers. Rumors in El Volcán (5 km E of the crater) that the volcano would erupt on its 10th anniversary caused many women and children to leave their homes.
Crater lake. Temperature and acidity of the crater lake were measured three times at two different sites (table 2). Lake temperature had increased from 28.6°C in 1986 to more than 40° in May 1992, nearing the 42° of October 1983 and February 1984. The pH values of 1.8 and 1.9 measured in 1983 and 1984, respectively, were similar to the April 1992 value. Although no heavy rainfall occurred between 18 April and 8 May, brief rains were common at night and may have diluted the lake with meteoric water, raising its pH. Water samples collected on the lake's N shore are being studied by M.A. Armienta and S. de la Cruz-Reyna at the Instituto de Geofísica, UNAM.
Table 2. Temperature and acidity of the crater lake at El Chichón, measured at sites on the SE and N shores.
| Date |
Site |
Temperature |
pH |
| 18 Apr 1992 |
SE shore |
32.4°C |
1.87 |
| 18 Apr 1992 |
N shore |
36.9°C |
1.87 |
| 08 May 1992 |
SE shore |
32.1°C |
2.15 |
| 08 May 1992 |
N shore |
40.1°C |
2.23 |
| 18 May 1992 |
SE shore |
-- |
-- |
| 18 May 1992 |
N shore |
40.2°C |
2.31 |
Fumarolic activity. Gas emission from the crater fed a low-altitude plume visible on clear days. Fumarolic activity was observed throughout the crater but was much more extensive and vigorous in its NNE sector (steaming ground zone of Casadevall and others, 1984). Almost all of the fumaroles showed a steady, audible release of overpressured gas, except for one just N of the crater lake, where frequent noise changes showed that output was distinctly discontinuous. At times, vapor formed only within about 1 m above this vent, suggesting that the gas is initially superheated. All of the fumaroles produced sublimates, primarily native sulfur. A high-temperature fumarole NE of the crater lake contains molten orange sulfur within the orifice of a 1-m-high feature otherwise covered with needle-like amorphous yellow sulfur. Numerous mildly steaming areas were found in the NW and NE parts of the crater, and small fumaroles were active several tens of meters above the crater floor along the path descending from the SE crater wall. Relict portions of altered brecciated trachyandesite described by Rose and others (1984) as remnants of the pre-1982 dome and shown on the map of Casadevall and others (1984) as "altered areas" are still actively steaming.
A few fumaroles on the NE side of the crater are characterized by vigorous geyser activity, sending a constant flux of boiling water to 2-3 m height. In the same area, several boiling springs about 2-3 m above the present crater-lake surface produce boiling streams with a significant discharge into the lake, 50 m away. A similar situation was evident near a boiling mud pit in the NW part of the crater. These boiling streams are sites of mineral precipitation, and active red, brown, and green algae growth. Ferns and grasses have returned to some of these hydrothermal areas. Ponds 1 m in diameter on the NW side of the lake contained vigorously boiling mud (rising <1 m) and water.
The crater lake, which had recovered to November 1982 levels by November 1990, was turquoise-blue and had at least two large zones of intense surface effervescence as described by Casadevall and others (1984).
Although an acrid smell was noted at active hydrothermal areas, H2S concentrations must have decreased below the 2-6 ppm that forced geologists to take special precautions in 1983 and to leave the crater in 1984. During several 4-hour periods in the crater, we never needed gas masks, even in the most active areas.
Other observations. In the Río Magdalena near Xochimilco (8 km NW of the crater), vegetation has made a strong comeback on pyroclastic-flow deposits, which are now covered by tall grasses and acacia trees up to 2 m high with trunks several centimeters in diameter. In all other areas within 2-3 km of the crater, the 1982 deposits are covered only by moss, lichen, and tall grass. Where pyroclastic flows and surges did not surmount topographic barriers or deposited only a thin veneer of material, vegetation is much more lush, with trees, ferns, and other broad-leafed tropical plants. Trees that were charred but not totally blown down >5 km away have begun to grow again from their stumps. The river that now passes through El Volcán was formed after the pyroclastic flows changed the former drainage pattern. An abundant, rusty colored precipitate (Fe oxides) was sampled for analysis.
Future work. More extensive field observations within the crater are planned for November or December. We will measure temperature and pH, and sample sites of hydrothermal activity. An attempt will be made to overfly the crater with a COSPEC, to bring portable seismometers into the crater and somma flanks, and to make bathymetric measurements.
References. Casadevall, T., de la Cruz-Reyna, S., Rose, W., Bagley, S., Finnegan, D., and Zoller, W., 1984, Crater lake and post-eruption hydrothermal activity, El Chichón Volcano, México: Journal of Volcanology and Geothermal Research, v. 23, p. 169-191.
Rose, W., Bornhorst, T., Halsor, S., Capaul, W., Plumley, P., de la Cruz-Reyna, S., Mena, M., and Mota, R., 1984, Volcán el Chichón, México: pre-1982 S-rich eruptive activity: Journal of Volcanology and Geothermal Research, v. 23, p. 147-167.
Tilling, R., 1974, Rockfall activity in pit craters, Kīlauea Volcano, Hawaii: Proceedings of the Symposium on "Andean and Antarctic Volcanology Problems", IAVCEI, Santiago, Chile, September 1974, p. 518-528.
Tilling, R., Koyanagi, R., and Holcomb, R., 1975, Rockfall seismicity-correlation with field observations, Makaopuhi Crater, Kīlauea Volcano, Hawaii: Journal of Research, U.S. Geological Survey, v. 3, p. 345-361.
Geologic Background. El Chichón is a small trachyandesitic tuff cone and lava dome complex in an isolated part of the Chiapas region in SE México. Prior to 1982, this relatively unknown volcano was heavily forested and of no greater height than adjacent non-volcanic peaks. The largest dome, the former summit of the volcano, was constructed within a 1.6 x 2 km summit crater created about 220,000 years ago. Two other large craters are located on the SW and SE flanks; a lava dome fills the SW crater, and an older dome is located on the NW flank. More than ten large explosive eruptions have occurred since the mid-Holocene. The powerful 1982 explosive eruptions of high-sulfur, anhydrite-bearing magma destroyed the summit lava dome and were accompanied by pyroclastic flows and surges that devastated an area extending about 8 km around the volcano. The eruptions created a new 1-km-wide, 300-m-deep crater that now contains an acidic crater lake.
Information Contacts: José Luís Macías V. and Michael Sheridan, State Univ of New York, Buffalo, NY; Jean-Christophe Komorowski and Claus Siebe, Instituto de Geofísica, UNAM; Robert Tilling, USGS.
Clark
New Zealand
36.446°S, 177.839°E; summit elev. -860 m
All times are local (unless otherwise noted)
New submarine volcano identified; no gas bubbling
Three previously unknown submarine arc stratovolcanoes have been identified at the S end of the Kermadec Ridge: Rumble V (36.140°S, 178.195°E, summit 700 m below sea level); Tangaroa (36.318°S, 178.031°E, summit 1,350 m below sea level); and Clark (36.423°S, 177.845°E, summit 1,150 m below sea level) (figure 1). All three have basal diameters of 16-18 km and rise from the seafloor at ~2,300 m depth. The first evidence of the volcanoes was from GLORIA side-scan mapping of the southern Havre Trough-Kermadec Ridge region in 1988 (Wright, 1990). Later investigations, including a photographic and rock-dredge study during the 3-week Rapuhia cruise (early 1992), confirmed previous interpretations. Side-scan and photographic data show a complex terrain of lava flows and talus fans on the flanks of all three volcanoes, with the most pristine-looking morphology at Rumble V. During the 1992 cruise, gas bubbles were detected acoustically, rising from the crests of Rumble III, IV, and V. No gas bubbling was evident from Tangaroa or Clark. Bathymetric surveys indicated that the summits of the shallowest volcanoes, Rumble III and IV, were at ~140 and 450 m, respectively, below the sea surface.
Reference. Wright, I.C., 1990, Bay of Plenty-Southern Havre Trough physiography, 1:400,000: New Zealand Oceanographic Institute Chart, Miscellaneous Series no. 68.
Geologic Background. The submarine Clark stratovolcano lies near the southern end of the Southern Kermadec arc. This basaltic and dacitic edifice consists of a basal substrate of massive lava flows, pillow lavas, and pillow tubes overlain by volcaniclastic sediments. Craters are present along the complex crest. Clark is the southernmost volcano of the submarine chain that displays hydrothermal activity. Diffuse hydrothermal venting and sulfide chimneys were observed near the summit during a New Zealand-American NOAA Vents Program expedition in 2006.
Information Contacts: I. Wright, New Zealand Oceanographic Institute, National Institute of Water and Atmospheric Research, Wellington.
Clear Lake Volcanic Field (United States) — June 1992 Cite this Report
Clear Lake Volcanic Field
United States
38.97°N, 122.77°W; summit elev. 1439 m
All times are local (unless otherwise noted)
50 small seismic events triggered by M 7.5 earthquake hundreds of km away
Southern California's largest earthquake since 1952, M 7.5 on 28 June, appeared to trigger seismicity at several volcanic centers in California. It was centered roughly 200 km E of Los Angeles. In the following, David Hill describes post-earthquake activity at Long Valley caldera, and Stephen Walter discusses the USGS's seismic network, and the changes it detected at Lassen, Shasta, Medicine Lake, and the Geysers.
In recent years, the USGS northern California seismic network has relied upon Real-Time Processors (RTPs) to detect, record, and locate earthquakes. However, a film recorder (develocorder) collects data from 18 stations in volcanic areas, primarily to detect long-period earthquakes missed by RTPs. The film recorders proved useful in counting the post-M 7.5 earthquakes, most of which were too small to trigger the RTPs.
The film record was scanned for the 24 hours after the M 7.5 earthquake, noting the average coda duration for each identified event. Some events may have been missed because of seismogram saturation by the M 7.5 earthquake. Marked increases in microseismicity were observed at Lassen Peak, Medicine Lake caldera, and the Geysers (table 1). No earthquakes were observed at Shasta, but the lack of operating stations on the volcano limited the capability to observe small events.
Table 1. Number of earthquakes at northern California volcanic centers during 24-hour periods following major earthquakes on 25 April (40.37°N, 124.32°W; M 7.0) and 28 June (34.18°N, 116.47°W; M 7.5) 1992. Events with coda durations less than or equal to 10 seconds and greater than 10 seconds are tallied separately. Earthquakes were identified from film records of seismograms from nearby stations. Courtesy of Stephen Walter.
| Volcanic center |
Lassen |
Lassen |
Shasta |
Shasta |
Medicine Lake |
Medicine Lake |
Geysers |
Geysers |
| Codas (seconds) |
0-10 |
11+ |
0-10 |
11+ |
0-10 |
11+ |
0-10 |
11+ |
| 25 Apr 1992 |
0 |
0 |
0 |
1 |
0 |
0 |
7 |
2 |
| 28 Jun 1992 |
8 |
14 |
1 |
5 |
12 |
0 |
46 |
4 |
Film was also scanned for the 24 hours following the M 7.0 earthquake at 40.37°N, 124.32°W (near Cape Mendocino) on 25 April. Although smaller than the 28 June earthquake, its epicenter was only 20-25% as far from the volcanoes. Furthermore, both the 25 April main shock and a M 6.5 aftershock were felt at the volcanic centers, but no felt reports were received from these areas after the 28 June earthquake. Only the Geysers showed any possible triggered events after the 25 April shock. However, background seismicity at the Geysers is higher than at the other centers, and is influenced by fluid injection and withdrawal associated with intensive geothermal development.
Geysers geothermal area report. Film records showed 50 small events in the 24 hours following the M 7.5 earthquake, 46 of which had coda durations
Geologic Background. The late-Pliocene to early Holocene Clear Lake Volcanic Field in the northern Coast Ranges contains lava dome complexes, cinder cones, and maars of basaltic-to-rhyolitic composition. The westernmost site of Quaternary volcanism in California, this volcanic field is in a complex geologic setting within the San Andreas transform fault system. Mount Konocti, a composite dacitic lava dome on the south shore of Clear Lake, is the largest volcanic feature. Volcanism has been largely non-explosive, with only one major airfall tuff. The latest eruptive activity, forming maars and cinder cones along the shores of Clear Lake, continued until about 9,000 years ago. A large silicic magma body provides the heat source for the Geysers, a geothermal field with a complex of electrical power plants.
Information Contacts: Stephen Walter and David Hill, MS 977, U.S. Geological Survey, 345 Middlefield Road, Menlo Park, California 94025 USA.
Colima
Mexico
19.514°N, 103.62°W; summit elev. 3850 m
All times are local (unless otherwise noted)
Rockfalls and thermal activity; large lahar deposit described
The following . . . covers activity between 10 April and 30 June 1992, and describes the 25 June 1991 lahar deposits.
Seismicity and rockfall activity. After a brief seismic crisis 4-10 March, activity at Colima remained near background levels. Starting 10 April, seismicity became more frequent. Nine B-type earthquakes were detected by the Red Sismológica de Colima (RESCO) and up to 60 events were recorded 10-20 May at the SW-flank Yerbabuena station (figure 17). Subsequent seismic activity remained near background, with only four B-type earthquakes recorded by RESCO 20-31 May, and three between 1 and 20 June. Seismic activity increased slightly 21-30 June, when 22 B-type earthquakes were recorded and the number of associated seismically detected rockfalls reached 55. Other rockfalls were also noted, probably associated with small diurnal changes in the volcano's hydrothermally altered summit region, which might be related to changes in rock temperature and surface water content. Extraordinary out-of-season precipitation in January, related to the El Niño/Southern Oscillation event of 1991-92, exceeded 700% of the monthly mean of the past 30 years and must have saturated the volcano's upper porous regions.
Current thermal activity. Fumarolic activity has been steady, with an impressive white plume that can rise several hundred meters above the summit before dissipating. This represents the systematic release of meteoric water accumulated in the upper part of the volcano, not an increase in the magmatic component of the fumarolic activity. Further avalanching of the most precarious hydrothermally altered regions of the summit area is expected during the rainy season, which has just started.
25 June 1991 lahar deposit. Block-and-ash flows emplaced about 1 x 10⁶ m3 of loose pyroclastic debris in the upper Barranca El Cordobán during collapse of the crater dome and rim on 16-17 April 1991, just before the 1991 lava flow began to move down the SW flank (figure 17) (Rodríguez-Elizarrarás and others, 1991). Despite heavy rains in May-September 1991, geologists from the CICT reported that most of the pyroclastic deposits had been washed away without producing sizeable mudflows (Rodríguez-Elizarrarás, and others, 1991). Nevertheless, on 28 March 1992, S. de la Cruz-Reyna and CICT geologists observed a significant laharic mass-flow deposit near El Jabalí, which was studied 5-7 June by J.-C. Komorowski and CICT geologists. A more thorough field and laboratory investigation of this deposit is in progress.
The lahar reached the settlements of La Becerrera and San Antonio, ~12 km SW of the summit (figure 17). Unequivocal non-reworked lahar material was seen at 1,280 m elevation, ~500 m above the confluence of the barrancas El Zarco and El Cordobán. The total thickness was 2 m with a channel width of 30 m. Deposits from this lahar have been identified up to ~1,900 m above sea level, at the bottom of a 20-30-m vertical lava wall in the barranca El Cordobán. The barranca's slope flattens drastically after the lava wall, so deposition probably began below this point. The most distant block-and-ash flow deposits in this barranca reached down to 2,100 m elevation. Upstream, the barranca was significantly eroded by water and debris from a maximum elevation of 2,600 m. Although there is no clear evidence of lahar deposits at San Antonio and La Becerrera, one person reported that the water crossing on the San Antonio-Laguna Verde road was obstructed for two days by lahar material, until machines cleared the debris. Such occurrences are frequent in the rainy season, because several large barrancas draining the upper slopes join there to form a channel 30 m wide.
We estimate the total lahar path at 9.9 km. Based on several measurements at different sites, the lahar deposit averages 25 m wide and 2 m thick. Maximum width was 38 m and maximum thickness 2.9 m at 1,640 m elevation (star on figure 17). Volume was estimated at approximately 0.5 x 10⁶ m3, or about 50% of the material estimated to have been emplaced by the 16-17 April 1991 pyroclastic activity. Field evidence and testimony (see below) unequivocally show that all of the lahar deposit was emplaced during one event. April 1992 field studies of barrancas at higher altitude revealed tremendous erosion since April 1991, leaving ravines incised deeply (to 15 m) into the pre-1991 pyroclastic deposits. A significant volume of loose 1991 debris remains on the mountain, ready to be incorporated into lahars during the rainy season.
Preliminary field investigations showed that the lahar deposit is characterized by a very flat surface, with suspended lava blocks to 1-2 m in maximum dimension protruding through the surface, and abundant pumiceous clasts from eroded 1913 deposits. The deposit is massive, non-stratified, non-graded, poorly sorted, and matrix supported. Its typical massive lowermost zone (0.6 m thick), locally well-sorted, has a concentration of blocks (to 0.5 m size) and wood fragments at the base, a prominent clast-supported medial zone (0.7 m thick) with imbricated sub-rounded boulders (to 0.3 m), and an uppermost massive unit (0.8 m) with a tendency toward reverse grading of lithic cobbles, supported in a sandy matrix. The deposit is typically semi-indurated. Inter-unit contacts are sharply defined in several places, most likely reflecting shear between rheologically different portions of the mass flow. Given the large suspended blocks, the very flat surface, the constant thickness over 9 km of travel distance, the presence of marginal levees, and overturned logs that came to rest vertically, the mass flow clearly had a significant yield strength. However, it must have been relatively swift, as it was able to flow around topographic barriers in the channel, and in some places to leave an elevated deposit on the outside wall when it rounded a sharp curve.
Few people witnessed the lahar. The best testimony came from a farmer (Ramón Aguirre Valencia) who went to Barranca El Cordobán on 26 June 1991 to check his cattle. At 1,600 m altitude, the barranca was filled by a gravel- and boulder-rich deposit with a flat surface. Rocks on the surface were coated with a thin layer of light-colored fine ash. Of the 20 cows killed by the lahar, several could be seen, with horns, heads, and feet protruding from the deposit. Numerous tree trunks several meters long and as much as 30 cm in diameter were also on the lahar's surface. Heavy rains had occurred the previous day, and the lahar apparently began to form after about 2 hours of heavy precipitation, accompanied by loud thunder. The nearest meteorological station (Cofradía de Suchitlán), about 12 km from the lahar's most likely source area, recorded 50 mm of rain on 25 June. By 3 July, a ravine had developed in the new lahar that was as deep (4.6 m) but not as wide as the present channel, which now spans 10.6 m of the 38-m-wide deposit. Five kilometers downstream, the lahar overran and destroyed a 2-m-high stone wall at El Jabalí and clogged the existing channel, but 2 km farther downslope, residents of La Becerrera noticed nothing unusual. Larger sediment flows reported at La Becerrera in January may have been related to breaching of a small earthen dam.
Warnings of future lahar flows and the hazards within Barranca El Cordobán were reiterated to authorities in 1992, as abundant loose material remains from the 1991 eruption and recently exposed 1913 pyroclastic units. The El Jabalí basin is filled with old mass-flow deposits that have traveled down several steep, deeply incised barrancas. On 12 June, CICT organized a meeting that included civil protection authorities to discuss these hazards.
Reference. Rodríguez-Elizarrarás, C., Siebe, C., Komorowski, J.-C., Espindola, J.M., and Saucedo, R., 1991, Field observations of pristine block-and-ash flow deposits emplaced April 16-17, 1991 at Volcán de Colima, México: Journal of Volcanology and Geothermal Research, v. 48, no. 3/4, p. 399-412.
Geologic Background. The Colima complex is the most prominent volcanic center of the western Mexican Volcanic Belt. It consists of two southward-younging volcanoes, Nevado de Colima (the high point of the complex) on the north and the historically active Volcán de Colima at the south. A group of late-Pleistocene cinder cones is located on the floor of the Colima graben west and east of the complex. Volcán de Colima (also known as Volcán Fuego) is a youthful stratovolcano constructed within a 5-km-wide scarp, breached to the south, that has been the source of large debris avalanches. Major slope failures have occurred repeatedly from both the Nevado and Colima cones, producing thick debris-avalanche deposits on three sides of the complex. Frequent recorded eruptions date back to the 16th century. Occasional major explosive eruptions have destroyed the summit (most recently in 1913) and left a deep, steep-sided crater that was slowly refilled and then overtopped by lava dome growth.
Information Contacts: Carlos Navarro, Abel Cortés, I. Galindo, José J. Hernández, and Ricardo Saucedo, CICT, Universidad de Colima; Jean-Christophe Komorowski and Claus Siebe, Instituto de Geofísica, UNAM.
Etna
Italy
37.748°N, 14.999°E; summit elev. 3357 m
All times are local (unless otherwise noted)
Continued flank lava production
Lava production continued from the fissure that opened in the W wall of the Valle del Bove on 15 December. Gas emission from 4 vents in the upper part of the fissure (2,215-2,235 m altitude; figure 52) fluctuated daily, probably with changes in weather conditions. However, gas emission has diminished since the eruption's initial months.
No variation was evident in the movement of lava visible through a skylight high in the main channel, at 2,205 m altitude. Lava was also seen flowing through a skylight in lava tubes that formed in June along the channel into which lava was artificially diverted on 27 May (~ 1,980 m elevation) (17:05). From there, lava advanced through a complex series of tubes past the field that had formed in recent months. Lava again reached the surface around 1,800 m altitude from a changing number (generally 3-4) of ephemeral vents at varying locations representing tube bases. Lava flows extruded from these vents have generally been modest, have remained in the center of the lava field, and have not advanced beyond 1,600 m asl. As of the morning of 9 July, only one flow was active within the Valle del Bove, near the center at around 1,670 m altitude, with a fairly well-fed front. The volume of lava produced during ~7 months of eruption is estimated to be around 165 x 106 m3.
Seismic activity during the period was characterized by low energy release. Significant increases were observed 8-9 July, when events of 2-4 Hz were recorded. The most significant perturbations were detected on 8 July at 1554, for 180 seconds, and at 1601 for 130 seconds. Tremor was almost nonexistent, obscured by seismic noise that characterizes periods of low activity at the volcano.
More or less voluminous gas emissions occurred from two vents at the bottom (~100 m from the rim) of the two central craters (Bocca Nuova and La Voragine). Incandescence caused by superheated gases (>1,000°C) from the vent in La Voragine was sometimes visible. Gas also emerged from a vent that has opened in Southeast Crater. Northeast Crater appeared to have been completely obstructed by internal collapse. COSPEC measurements of SO2 flux from the summit crater showed relatively high values of ~ 8,000 t/d.
Geologic Background. Mount Etna, towering above Catania on the island of Sicily, has one of the world's longest documented records of volcanism, dating back to 1500 BCE. Historical lava flows of basaltic composition cover much of the surface of this massive volcano, whose edifice is the highest and most voluminous in Italy. The Mongibello stratovolcano, truncated by several small calderas, was constructed during the late Pleistocene and Holocene over an older shield volcano. The most prominent morphological feature of Etna is the Valle del Bove, a 5 x 10 km caldera open to the east. Two styles of eruptive activity typically occur, sometimes simultaneously. Persistent explosive eruptions, sometimes with minor lava emissions, take place from one or more summit craters. Flank vents, typically with higher effusion rates, are less frequently active and originate from fissures that open progressively downward from near the summit (usually accompanied by Strombolian eruptions at the upper end). Cinder cones are commonly constructed over the vents of lower-flank lava flows. Lava flows extend to the foot of the volcano on all sides and have reached the sea over a broad area on the SE flank.
Information Contacts: R. Romano and T. Caltabiano, IIV; P. Carveni, M. Grasso, and C. Monaco, Univ di Catania; G. Luongo, OV.
Farallon de Pajaros (United States) — June 1992 Cite this Report
Farallon de Pajaros
United States
20.546°N, 144.893°E; summit elev. 337 m
All times are local (unless otherwise noted)
Vigorous fuming
When observed from an airplane on 13 May, the volcano continued to fume vigorously, but no active lava was seen.
Geologic Background. The small 2-km-wide island of Farallon de Pajaros (also known as Uracas) is the northernmost and most active volcano of the Mariana Islands. Its relatively frequent eruptions dating back to the mid-19th century have caused the andesitic volcano to be referred to as the "Lighthouse of the western Pacific." The symmetrical, sparsely vegetated summit is the central cone within a small caldera cutting an older edifice, remnants of which are seen on the SE and southern sides near the coast. Flank fissures have fed lava flows that form platforms along the coast. Eruptions have been recorded from both summit and flank vents.
Information Contacts: R. Moore, USGS; R. Koyanagi, M. Sako, and F. Trusdell, HVO.
Galeras
Colombia
1.22°N, 77.37°W; summit elev. 4276 m
All times are local (unless otherwise noted)
Strong explosion destroys most of summit lava dome
An explosion on 16 July, the largest since activity began in 1989, ejected large tephra and may have generated a small pyroclastic flow. Partial collapse of the summit crater's lava dome occurred in June, and minor seismicity had been recorded a few days before the explosion.
June activity. The NW portion of the 1991 lava dome collapsed during June, and explosions and ash emissions occurred from the collapsed area. Las Portillas fumarole, formerly just NW of the dome, was larger after the collapse, and a line of new vents had opened nearby. The fracture on the NW crater wall remained active, and it and Las Portillas appeared to be the highest temperature vents in the crater. Gas columns were generally small, and were dispersed to the N and W. The number and energy release of long-period events (figure 55) and high-frequency earthquakes were low. Ten high-frequency earthquakes occurred in the NW part of the crater, with magnitudes of 0.3-1.7. The amplitude and period of background tremor showed small variations on 15 and 30 June. The maximum rate of SO2 emission measured by COSPEC was ~5,500 t/d.
Precursory seismicity and tilt. Banded tremor episodes of moderate to high energy occurred 11-12 July, accompanied by a small inflationary tilt event recorded on both instruments near the summit. Between 14 and 16 July, six monochromatic long-period events were recorded, with durations on the order of 80 seconds. On 15 July, there was a small swarm of high-frequency events with magnitudes of 0-0.5.
16 July explosion. The explosion began at 1740 with a strong shock felt in Pasto . . . . More than 90% of the summit lava dome was destroyed as at least 120,000 m3 of blocks were ejected, falling primarily on the E and NE flanks. Blocks 30 cm in diameter fell 2.3 km from the crater, and impact craters to 3.5 m across were found 400 m away. Incandescent blocks started fires 2 km from the crater on the NE flank. The tephra severely damaged a small military facility on the crater rim, and dropped 40-cm blocks on telephone and television facilities near the summit. Roughly 30,000 m3 of ash were dispersed in a narrow band to the W, with the 1-mm isopach extending ~10 km. The dark-gray cauliflower-shaped eruption column reached ~4 km altitude. Reports from observers 10 km WSW of the crater (in Consacá) suggested that small pyroclastic flows may have descended the W flank. A powerful sonic wave generated by the explosion broke windows in Pasto, and reportedly in Consacá.
A seismic signal lasting ~8 minutes accompanied the explosion, saturating instruments for the first 37 seconds. Two distinct signals were recognized, one with a frequency of 1 Hz and a duration magnitude of 3, the other a 1.3-Hz tremor episode that lasted 4 minutes. A high-frequency, M 3.2-3.5 event occurred 26 hours after the explosion, in the S part of the volcano at ~5 km depth.
Geologic Background. Galeras, a stratovolcano with a large breached caldera located immediately west of the city of Pasto, is one of Colombia's most frequently active volcanoes. The dominantly andesitic complex has been active for more than 1 million years, and two major caldera collapse eruptions took place during the late Pleistocene. Long-term extensive hydrothermal alteration has contributed to large-scale edifice collapse on at least three occasions, producing debris avalanches that swept to the west and left a large open caldera inside which the modern cone has been constructed. Major explosive eruptions since the mid-Holocene have produced widespread tephra deposits and pyroclastic flows that swept all but the southern flanks. A central cone slightly lower than the caldera rim has been the site of numerous small-to-moderate eruptions since the time of the Spanish conquistadors.
Information Contacts: INGEOMINAS-Observatorio Vulcanológico del Sur.
Guguan (United States) — June 1992 Cite this Report
Guguan
United States
17.3137°N, 145.84°E; summit elev. 232 m
All times are local (unless otherwise noted)
No gas emission
A six-member team of USGS volcanologists visited the Commonwealth of the Northern Mariana Islands 11-27 May 1992 at the request of the CNMI Office of Civil Defense. Observations [of Guguan] from an airplane on 13 May and a helicopter on 21 May revealed no gas emission.
Geologic Background. The island of Guguan, ~2.8 km in diameter, is composed of an eroded volcano on the south, a caldera with a post-caldera cone, and a northern volcano. The latter has three coalescing cones and a breached summit crater that fed lava flows to the W and NW. The only known reported eruption, between 1882 and 1884, produced the northern volcano and lava flows that reached the coast. Freycinet (Uranie 1817 Expedition) confused Guguan and Alamagan; reported eruptions in 1819 and 1901 (Kuno, 1962 CAVW) actually refer to solfataric activity on Alamagan (Corwin, 1971).
Information Contacts: R. Moore, USGS; R. Koyanagi, M. Sako, and F. Trusdell, HVO.
Irazu
Costa Rica
9.979°N, 83.852°W; summit elev. 3436 m
All times are local (unless otherwise noted)
Fumarolic activity and seismicity continue
Fumarolic activity continued in the main crater. Its lime-green lake had a mean temperature of 28°C and a minimum pH of 4.9 on 3 June. Fumaroles persisted in the area NE of the lake, with temperatures of 84-90°C. Areas of bubbling to the NE remained vigorous, with strong emission of cold gas, perhaps CO2. Hot bubbling areas were stable at temperatures <=91°C. Fumarolic vents in the sedimentary fan N of the lake were buried by new sedimentation triggered by heavy rains. The resulting zone of steaming ground had surface temperatures of up to 90°C.
Seismicity continued, with 48 events recorded during June at a station (ICR) 2.2 km E of the active crater and 36 low-frequency microseisms registered 5 km WSW of the crater (at station IRZ2). The largest daily earthquake count was 7 on 2 June (at ICR). On 30 June, a M 1.9 event occurred 6.7 km SW of the main crater, at 3 km depth.
Geologic Background. The massive Irazú volcano in Costa Rica, immediately E of the capital city of San José, covers an area of 500 km2 and is vegetated to within a few hundred meters of its broad summit crater complex. At least 10 satellitic cones are located on its S flank. No lava effusion is known since the eruption of the Cervantes lava flows from S-flank vents about 14,000 years ago, and all known Holocene eruptions have been explosive. The focus of eruptions at the summit crater complex has migrated to the W towards the main crater, which contains a small lake. The first well-documented eruption occurred in 1723, and frequent explosive eruptions have occurred since. Ashfall from the last major eruption during 1963-65 caused significant disruption to San José and surrounding areas. Phreatic activity reported in 1994 may have been a landslide event from the fumarolic area on the NW summit (Fallas et al., 2018).
Information Contacts: E. Fernández, J. Barquero, and V. Barboza, OVSICORI; G.J. Soto, ICE; Mario Fernández, Escuela Centroamericana de Geología, Univ de Costa Rica.
Karangetang (Indonesia) — June 1992 Cite this Report
Karangetang
Indonesia
2.781°N, 125.407°E; summit elev. 1797 m
All times are local (unless otherwise noted)
Some decline in explosive activity, lava production, and seismicity, but glowing rockfalls advance 1.5 km
Activity began to increase in February 1992. Glowing rockfalls on 18 May filled the upper Keting river valley to 4 km from the crater. The volume of the deposit was estimated at 1.2 x 10⁶ m3, ~ 20% of the dome (17:04). Since then, the eruption has fluctuated, but a general decrease in intensity was indicated by declines in the height of the ash plume, the behavior of the glowing lava flow, and the vigor of incandescent tephra ejection. In July, glowing rockfalls advanced down the Keting river to 1,500 m from the crater. The number of volcanic and local tectonic earthquakes decreased in June and July compared to previous months. June-July seismicity was dominated by surface activity, such as explosion earthquakes and rockfalls (figure 2).
Geologic Background. Karangetang (Api Siau) volcano lies at the northern end of the island of Siau, about 125 km NNE of the NE-most point of Sulawesi. The stratovolcano contains five summit craters along a N-S line. It is one of Indonesia's most active volcanoes, with more than 40 eruptions recorded since 1675 and many additional small eruptions that were not documented (Neumann van Padang, 1951). Twentieth-century eruptions have included frequent explosive activity sometimes accompanied by pyroclastic flows and lahars. Lava dome growth has occurred in the summit craters; collapse of lava flow fronts have produced pyroclastic flows.
Information Contacts: W. Modjo, VSI.
Kilauea (United States) — June 1992 Cite this Report
Kilauea
United States
19.421°N, 155.287°W; summit elev. 1222 m
All times are local (unless otherwise noted)
Continued east rift lava production
Lava production continued through early July from the E-51 vent . . . (figure 85), but was interrupted by several brief pauses. With each resumption in activity, lava reoccupied tubes on the S flank of the E-51 shield. Flows emerged from the tubes under some pressure, creating small, meter-high dome fountains at their heads. The lava pond at the top of the E-51 shield drained and refilled with changing lava supply, sustaining frequent overflows that did not advance far. Some lava also ponded at the base of the shield before flows advanced S and E. The small lava lake in Pu`u `O`o crater remained active, fluctuating between 38 and 55 m below the crater rim in June. The lake surface rose during pauses in activity at the episode-51 vent and dropped when lava production resumed there. By early July, it had dropped farther, to 65 m below the rim.
Activity resumed on 2 June, after a 3-day pause (17:5), while harmonic tremor began a gradual increase to about twice background levels at 0000. Large flows advanced N along the W flank of Pu`u `O`o cinder cone. These shelly pahoehoe flows formed shallow tubes and stagnated within a few days. The eruption stopped briefly on 5 June, as tremor dropped to near background at 1800, resumed the next day accompanied by a tremor increase at about 0700, and halted again ~24 hours later on the 7th, when lava drained slowly from the pond atop the shield.
Another increase in tremor began early on 9 June, reaching about twice background levels by noon on the 10th. Shallow, long-period microearthquakes (LPC-A, 3-5 Hz) were frequent on 9 June, as were upper east rift events on 9-10 June. Lava started to emerge from the E-51 vent at 1325 on 10 June, re-entering the tube system on the S flank of the E-51 shield. The lava lake in Pu`u `O`o crater had been nearly level with the crater floor when E-51 activity resumed, but had dropped ~9 m by the next day.
A small spatter cone formed 3-11 June over a weak point in the tube on the N flank of the E-51 shield. This tube had fed numerous aa ooze-outs that spread out around the shield's N flank in past months. On 13 June, an aa flow was active on the shield's N flank, appearing to originate from the new spatter cone.
Lava production stopped again on 16 June, the pond at the top of the shield drained, and flows slowed their advance. The eruption restarted during the morning of 21 June, continuing through the end of the month. Pahoehoe flows extended N and SE from the vent. Through 25 June, the shield's pond was full and intermittently overflowing, but by 1 July it had drained to ~15 m depth with a solid crust at the bottom. However, lava continued to ooze into the S-flank tube system and to break out at the base of the shield. Tremor amplitudes gradually declined to near background by 2000 on 29 June, and remained at low levels into early July.
Geologic Background. Kilauea overlaps the E flank of the massive Mauna Loa shield volcano in the island of Hawaii. Eruptions are prominent in Polynesian legends; written documentation since 1820 records frequent summit and flank lava flow eruptions interspersed with periods of long-term lava lake activity at Halemaumau crater in the summit caldera until 1924. The 3 x 5 km caldera was formed in several stages about 1,500 years ago and during the 18th century; eruptions have also originated from the lengthy East and Southwest rift zones, which extend to the ocean in both directions. About 90% of the surface of the basaltic shield volcano is formed of lava flows less than about 1,100 years old; 70% of the surface is younger than 600 years. The long-term eruption from the East rift zone between 1983 and 2018 produced lava flows covering more than 100 km2, destroyed hundreds of houses, and added new coastline.
Information Contacts: T. Mattox and P. Okubo, HVO.
Kozushima
Japan
34.219°N, 139.153°E; summit elev. 572 m
All times are local (unless otherwise noted)
Earthquake and aftershocks
A M 5.2 earthquake, centered in the sea 8 km SW of the volcano at 9 km depth, occurred on 15 June at 1046. Island residents felt the shock at intensity 5 on the JMA scale of 0-7. Data from 30 stations of the Worldwide Standardized Seismic Network yielded magnitudes of 4.9 (mb) and 4.7 (Ms). One person was slightly injured by a rockfall, and wallrock collapse at 10 sites closed 5 roads to traffic. Aftershocks continued until 17 June off the island's SW coast. The event was the second largest since . . . April 1991 (figure 1). No surface anomalies were observed on the island or on the sea-surface nearby.
Geologic Background. A cluster of rhyolitic lava domes and associated pyroclastic deposits form the 4 x 6 km island of Kozushima in the northern Izu Islands. The island is the exposed summit of a larger submarine edifice more than 20 km long that lies along the Zenisu Ridge, one of several en-echelon ridges oriented NE-SW, transverse to the trend of the northern Izu arc. The youngest and largest of the 18 lava domes, Tenjosan, occupies the central portion of the island. Most of the older domes, some of which are Holocene in age, flank Tenjosan to the north, although late-Pleistocene domes are also found at the southern end of the island. A lava flow may have reached the sea during an eruption in 832 CE. The Tenjosan dome was formed during a major eruption in 838 CE that also produced pyroclastic flows and surges. Earthquake swarms took place during the 20th century.
Information Contacts: JMA; NEIC.
Langila (Papua New Guinea) — June 1992 Cite this Report
Langila
Papua New Guinea
5.525°S, 148.42°E; summit elev. 1330 m
All times are local (unless otherwise noted)
Strombolian explosions and lava flow
"A new phase of eruptive activity that started on 30 May lasted until 8 June. From 1 to 4 June, both Crater 2 and Crater 3 produced ash-rich Strombolian explosions to 500-700 m height. A new, short lava flow was emplaced on the NW flank of Crater 3. Emissions from Crater 2 became markedly ash-laden 4-7 June, with a plume rising a few kilometers above the crater and ashfalls on coastal areas 10 km NW. After the 7th, only weak to moderate vapour emissions and occasional Vulcanian explosions were noted from Crater 2.
"Activity at Crater 3 also waned after the first week in June, although more progressively. On the night of 7 June, intermittent explosions projected incandescent lava fragments to 250 m above the crater, while on 8 June there was weak steady glow over the crater. Intermittent explosions still occurred daily until the 24th, producing dark convoluting ash clouds that rose a few hundred meters above the crater.
"Seismic monitoring resumed on 11 June and showed only low-level activity throughout the rest of the month."
Geologic Background. Langila, one of the most active volcanoes of New Britain, consists of a group of four small overlapping composite basaltic-andesitic cones on the lower E flank of the extinct Talawe volcano in the Cape Gloucester area of NW New Britain. A rectangular, 2.5-km-long crater is breached widely to the SE; Langila was constructed NE of the breached crater of Talawe. An extensive lava field reaches the coast on the N and NE sides of Langila. Frequent mild-to-moderate explosive eruptions, sometimes accompanied by lava flows, have been recorded since the 19th century from three active craters at the summit. The youngest and smallest crater (no. 3 crater) was formed in 1960 and has a diameter of 150 m.
Information Contacts: P. de Saint-Ours, D. Lolok, and C. McKee, RVO.
Lascar
Chile
23.37°S, 67.73°W; summit elev. 5592 m
All times are local (unless otherwise noted)
Satellite data show heat from lava dome
"A Landsat TM image recorded the night of 15 April 1992 shows the most intense thermal anomaly of a dataset extending back to December 1984. The thermal signature, in the short-wavelength infrared bands 5 (1.55-1.75 mm) and 7 (2.08-2.35 mm), represents the active lava dome in the central crater. Comparison with the previous image (night of 7 January 1991) shows a marked increase in the anomaly's area (figure 11). In the April 1992 scene, the core of the anomaly occupies an irregular area of ~7 x 6 pixels (equivalent to 210 x 180 m). These dimensions correspond closely with the 180-190 m dome diameter estimated from 20 March airphotos (17:5). The increase in area of the TM anomaly may be explained, at least in part, by the growth of a subsidiary lava dome first sighted on 4 March. The summed thermal radiance from the whole hot spot shows a corresponding increase in the April Landsat image (figure 12).
"An interesting feature of the two most recent TM acquisitions is the persistence of a discrete hot site ~200 m W of the centre of the main anomaly (figure 11). This is very likely the expression of incandescent fumarole vent(s) beyond the steep margin of the extruded lava."
Reference. Oppenheimer, C., Francis, P.W., Rothery, D.A., Carlton, R.W., and Glaze, L.S., Analysis of Volcanic Thermal Features in Infrared Images: Lascar Volcano, Chile, 1984-1992; Journal of Geophysical Research, in press.
Geologic Background. Láscar is the most active volcano of the northern Chilean Andes. The andesitic-to-dacitic stratovolcano contains six overlapping summit craters. Prominent lava flows descend its NW flanks. An older, higher stratovolcano 5 km E, Volcán Aguas Calientes, displays a well-developed summit crater and a probable Holocene lava flow near its summit (de Silva and Francis, 1991). Láscar consists of two major edifices; activity began at the eastern volcano and then shifted to the western cone. The largest eruption took place about 26,500 years ago, and following the eruption of the Tumbres scoria flow about 9000 years ago, activity shifted back to the eastern edifice, where three overlapping craters were formed. Frequent small-to-moderate explosive eruptions have been recorded since the mid-19th century, along with periodic larger eruptions that produced ashfall hundreds of kilometers away. The largest historical eruption took place in 1993, producing pyroclastic flows to 8.5 km NW of the summit and ashfall in Buenos Aires.
Information Contacts: C. Oppenheimer, D. Rothery, P. Francis, and R. Carlton, Open Univ.
Lassen Volcanic Center (United States) — June 1992 Cite this Report
Lassen Volcanic Center
United States
40.492°N, 121.508°W; summit elev. 3187 m
All times are local (unless otherwise noted)
Seismicity apparently triggered by M 7.5 earthquake hundreds of kilometers away
Southern California's largest earthquake since 1952, M 7.5 on 28 June, appeared to trigger seismicity at several volcanic centers in California. It was centered roughly 200 km E of Los Angeles. In the following, David Hill describes post-earthquake activity at Long Valley caldera, and Stephen Walter discusses the USGS's seismic network, and the changes it detected at Lassen, Shasta, Medicine Lake, and the Geysers.
In recent years, the USGS northern California seismic network has relied upon Real-Time Processors (RTPs) to detect, record, and locate earthquakes. However, a film recorder (develocorder) collects data from 18 stations in volcanic areas, primarily to detect long-period earthquakes missed by RTPs. The film recorders proved useful in counting the post-M 7.5 earthquakes, most of which were too small to trigger the RTPs.
The film record was scanned for the 24 hours after the M 7.5 earthquake, noting the average coda duration for each identified event. Some events may have been missed because of seismogram saturation by the M 7.5 earthquake. Marked increases in microseismicity were observed at Lassen Peak, Medicine Lake caldera, and the Geysers (table 1). No earthquakes were observed at Shasta, but the lack of operating stations on the volcano limited the capability to observe small events.
Table 1. Number of earthquakes at northern California volcanic centers during 24-hour periods following major earthquakes on 25 April (40.37°N, 124.32°W; M 7.0) and 28 June (34.18°N, 116.47°W; M 7.5) 1992. Events with coda durations less than or equal to 10 seconds and greater than 10 seconds are tallied separately. Earthquakes were identified from film records of seismograms from nearby stations. Courtesy of Stephen Walter.
| Date |
Lassen |
Shasta |
Medicine Lake |
Geysers |
| Codas (seconds) |
<= 10 |
> 10 |
<= 10 |
> 10 |
<= 10 |
> 10 |
<= 10 |
> 10 |
| 25 Apr 1992 |
0 |
0 |
0 |
1 |
0 |
0 |
7 |
2 |
| 28 Jun 1992 |
8 |
14 |
1 |
5 |
12 |
0 |
46 |
4 |
Film was also scanned for the 24 hours following the M 7.0 earthquake at 40.37°N, 124.32°W (near Cape Mendocino) on 25 April. Although smaller than the 28 June earthquake, its epicenter was only 20-25% as far from the volcanoes. Furthermore, both the 25 April main shock and a M 6.5 aftershock were felt at the volcanic centers, but no felt reports were received from these areas after the 28 June earthquake. Only the Geysers showed any possible triggered events after the 25 April shock. However, background seismicity at the Geysers is higher than at the other centers, and is influenced by fluid injection and withdrawal associated with intensive geothermal development.
Lassen Report. Of the three major Holocene volcanoes in the California Cascades, Lassen (~800 km NNW of the epicenter) had the strongest response to the 28 June earthquake (figure 1). About 10 minutes after the S-wave's arrival and while surface waves were still being recorded, a M 2.8 event occurred south of Lassen Peak. Film records showed 9 more earthquakes in the first hour, and 22 events were identified during the first 24 hours. Although most were M 1 or smaller, at least two and perhaps as many as four were of magnitude greater than or equal to 2. Nine were detected by the RTP system. The best preliminary locations were concentrated ~3 km SW of Lassen Peak at
Geologic Background. The Lassen Volcanic Center consists of the andesitic Brokeoff stratovolcano SW of Lassen Peak, a dacitic lava dome field, peripheral small andesitic shield volcanoes, and large lava flows, primarily on the Central Plateau NE of Lassen Peak. A series of eruptions from Lassen Peak from 1914 to 1917 is the most recent eruptive activity in the southern Cascade Range. Activity spanning about 825,000 years began with eruptions of the Rockland caldera complex and was followed beginning about 590,000 years ago by construction of Brokeoff. Beginning about 310,000 years ago activity shifted to the N flank of Brokeoff, where episodic, more silicic eruptions produced the Lassen dome field, a group of 30 dacitic lava domes including Bumpass Mountain, Mount Helen, Ski Heil Peak, and Reading Peak. At least 12 eruptive episodes took place during the past 100,000 years, with Lassen Peak being constructed about 27,000 years ago. The Chaos Crags dome complex, ~3 km NNW of Lassen Peak, was constructed about 1,100-1,000 years ago. The Cinder Cone complex 17 km NE of Lassen Peak was erupted in a single episode several hundred years ago and is considered part of the volcanic center (Clynne et al., 2000). The 1914-1917 eruptions of Lassen Peak began with phreatic eruptions and included emplacement of a small summit lava dome, subplinian explosions, mudflows, and pyroclastic flows.
Information Contacts: Stephen Walter and David Hill, MS 977, U.S. Geological Survey, 345 Middlefield Road, Menlo Park, California 94025 USA.
Ol Doinyo Lengai (Tanzania) — June 1992 Cite this Report
Ol Doinyo Lengai
Tanzania
2.764°S, 35.914°E; summit elev. 2962 m
All times are local (unless otherwise noted)
Lava ejection from small crater-floor vent
During a previously unreported 26 February climb by David Peterson, Howard Brown, and students from St. Lawrence Univ, activity was continuing from one cone (T20) . . . . Periodic gurgling and rumbling noises from the cone were audible from the crater rim. As Peterson and several students approached the active cone, lava fragments were ejected, one of which struck a student on the leg, causing a small burn. Crater photographs show a small dark vent at the summit of T20, but no dark (fresh) lava was evident on its flanks. However, by . . . 12 March, T20 had extruded a lava flow that covered much of the W part of the crater floor (17:03).
Brown's 26 February photographs show . . . T5/T9 as tall but pale gray, with no fresh, dark patches of lava. T15 was composed of jagged dark-gray pinnacles with medium-brown lower slopes and no sign of fresh lava. T8 and T8A seemed little changed from recent photographs, with slight yellow coloring at T8's summit. T14 appeared to have been surrounded by younger lava, which had turned pale gray to white. Some dark patches were visible around its summit vent. No dark fresh flows were evident on the crater floor.
Geologic Background. The symmetrical Ol Doinyo Lengai is the only volcano known to have erupted carbonatite tephras and lavas in historical time. The prominent stratovolcano, known to the Maasai as "The Mountain of God," rises abruptly above the broad plain south of Lake Natron in the Gregory Rift Valley. The cone-building stage ended about 15,000 years ago and was followed by periodic ejection of natrocarbonatitic and nephelinite tephra during the Holocene. Historical eruptions have consisted of smaller tephra ejections and emission of numerous natrocarbonatitic lava flows on the floor of the summit crater and occasionally down the upper flanks. The depth and morphology of the northern crater have changed dramatically during the course of historical eruptions, ranging from steep crater walls about 200 m deep in the mid-20th century to shallow platforms mostly filling the crater. Long-term lava effusion in the summit crater beginning in 1983 had by the turn of the century mostly filled the northern crater; by late 1998 lava had begun overflowing the crater rim.
Information Contacts: C. Nyamweru, St. Lawrence Univ; D. Peterson, Arusha; H. Brown, Nairobi, Kenya.
Long Valley (United States) — June 1992 Cite this Report
Long Valley
United States
37.7°N, 118.87°W; summit elev. 3390 m
All times are local (unless otherwise noted)
Abrupt increase in seismicity triggered by M 7.5 earthquake hundreds of kilometers away
Southern California's largest earthquake since 1952, M 7.5 on 28 June, appeared to trigger seismicity at several volcanic centers in California. It was centered roughly 200 km E of Los Angeles. In the following, David Hill describes post-earthquake activity at Long Valley caldera, and Stephen Walter discusses the USGS's seismic network, and the changes it detected at Lassen, Shasta, Medicine Lake, and the Geysers.
In recent years, the USGS northern California seismic network has relied upon Real-Time Processors (RTPs) to detect, record, and locate earthquakes. However, a film recorder (develocorder) collects data from 18 stations in volcanic areas, primarily to detect long-period earthquakes missed by RTPs. The film recorders proved useful in counting the post-M 7.5 earthquakes, most of which were too small to trigger the RTPs.
The film record was scanned for the 24 hours after the M 7.5 earthquake, noting the average coda duration for each identified event. Some events may have been missed because of seismogram saturation by the M 7.5 earthquake. Marked increases in microseismicity were observed at Lassen Peak, Medicine Lake caldera, and the Geysers. No earthquakes were observed at Shasta, but the lack of operating stations on the volcano limited the capability to observe small events.
Film was also scanned for the 24 hours following the M 7.0 earthquake at 40.37°N, 124.32°W (near Cape Mendocino) on 25 April. Although smaller than the 28 June earthquake, its epicenter was only 20-25% as far from the volcanoes. Furthermore, both the 25 April main shock and a M 6.5 aftershock were felt at the volcanic centers, but no felt reports were received from these areas after the 28 June earthquake. Only the Geysers showed any possible triggered events after the 25 April shock. However, background seismicity at the Geysers is higher than at the other centers, and is influenced by fluid injection and withdrawal associated with intensive geothermal development.
Long Valley Report. Within eight minutes of the major earthquake's origin time, seismic activity within Long Valley caldera (400 km NNW of the epicenter) increased abruptly (figure 15). Of the >260 events located by the RTP system during the next three days, three were of M 3 or greater. The first event within the caldera located by the RTP system was a M 1.4 earthquake at 1207, but develocorder film from caldera stations provides evidence of local earthquakes beginning at least a minute earlier within the strong coda waves from the M 7.5 event. The P-wave travel-time from the epicenter is just over 1 minute, and the S-wave travel-time just under two minutes, so it appears that local earthquake activity began no later than six minutes after the S-wave arrival.
Earthquake activity within Long Valley caldera had persisted, but at relatively low levels, through the first half of 1992, averaging
Geologic Background. The large 17 x 32 km Long Valley caldera east of the central Sierra Nevada Range formed as a result of the voluminous Bishop Tuff eruption about 760,000 years ago. Resurgent doming in the central part of the caldera occurred shortly afterwards, followed by rhyolitic eruptions from the caldera moat and the eruption of rhyodacite from outer ring fracture vents, ending about 50,000 years ago. During early resurgent doming the caldera was filled with a large lake that left strandlines on the caldera walls and the resurgent dome island; the lake eventually drained through the Owens River Gorge. The caldera remains thermally active, with many hot springs and fumaroles, and has had significant deformation, seismicity, and other unrest in recent years. The late-Pleistocene to Holocene Inyo Craters cut the NW topographic rim of the caldera, and along with Mammoth Mountain on the SW topographic rim, are west of the structural caldera and are chemically and tectonically distinct from the Long Valley magmatic system.
Information Contacts: D. Hill, USGS Menlo Park.
Manam (Papua New Guinea) — June 1992 Cite this Report
Manam
Papua New Guinea
4.08°S, 145.037°E; summit elev. 1807 m
All times are local (unless otherwise noted)
Strong ash ejections; Strombolian explosions; lava and pyroclastic flows
"The eruption . . . ended on 15 June after another paroxysmal phase from Main Crater (on 7 June). Following the paroxysmal phase of 31 May from Southern Crater, the level of activity was moderate in the first days of June. Both craters were emitting white and blue vapours in weak to moderate amounts, with occasional explosions of ash-laden vapour rising a few hundred meters above the craters, weak roaring noises, and weak fluctuating glow at night.
"On the afternoon of 5 June, Southern Crater entered a phase of intermittent Strombolian activity that sprayed incandescent spatter to as much as 300 m above the crater at intervals of 30-40 minutes. At 1600, Main Crater emitted a dark ash column to ~1,000 m above the crater. Strombolian explosions within the crater must have started soon afterwards, as suggested by fluctuating night glow and roaring sounds. On the 6th, the level of activity remained moderate at Southern Crater while it strengthened at Main Crater. The forceful emissions of grey-brown ash from the latter were identified as Strombolian projections at night. From 0025 until about 1830 on 7 June, this crater produced continuous incandescent projections to 600 m above the rim in an ash column that rose 2-3 km. New lava flows were erupted into the NE Valley and followed the path of the previous flows (4-6 May) on the southern side of the valley, down to 110 m asl.
"Pyroclastic flows were also produced, scorching vegetation and some garden areas on the southern side of the NE Valley to about 1 km from Bokure Village. Downwind from the crater, on the NW side of the island, the sustained dark ash cloud overhead, the fall of ash and lapilli, and roaring sounds of the eruption caused some concern to the population.
"This paroxysmal eruption phase ended with loud explosions from 1817 to 1830 on 7 June. In the following days there was hardly any visible activity from either crater, apart from weak-to-moderate vapour emission. However, the seismicity, which had increased dramatically during the eruptive phase of 6-7 June, remained moderately high. On 12 June, occasional dull explosion sounds were heard again from Main Crater with occasional brown ash clouds and incandescent projections at night. This activity lasted until the 14th, becoming more and more intermittent. The last significant event from Main Crater observed in this eruption was a moderately strong Vulcanian explosion at 0800 on 14 June, which projected a convoluting cloud to 2-3 km above the crater. Likewise, Southern Crater was somewhat reactivated 13-15 June, with occasional weak explosions, a fluctuating night glow, and incandescent projections to 250 m above the crater rim. From 16 June onward, the seismicity dropped markedly and neither crater showed further signs of activity apart from weak, fumarolic emission. The Stage 2 volcanic alert that had applied since 13 April was dropped to Stage 1 (i.e. non-threatening, background level) on 25 June.
"This eruption of Manam is among the most significant since 1958, and can be compared with the eruption of 1974 (Palfreyman and Cooke, 1976; Cooke et al., 1976) as it involved both craters, produced pyroclastic flows and lava flows of significant volume, and affected all but one of the main valleys. However, the 1992 eruption appears to have been larger than the 1974 event. A preliminary estimate of the 1992 lava-flow volume is 17 x 106 m3, compared with only 3 x 10⁶ m3 of lava flows in 1974."
References. Cooke, R.J.S., McKee, C.O., Dent, V.F., and Wallace, D.A., 1976, Striking Sequence of Volcanic Eruptions in the Bismarck Volcanic Arc, Papua New Guinea, in 1972-75; in Johnson, R.W, ed., Volcanism in Australasia, Elsevier, p. 149-172.
Palfreyman, W.D. and Cooke, R.J.S., 1976, Eruptive History of Manam Volcano, Papua New Guinea; Ibid., p. 117-131.
Geologic Background. The 10-km-wide island of Manam, lying 13 km off the northern coast of mainland Papua New Guinea, is one of the country's most active volcanoes. Four large radial valleys extend from the unvegetated summit of the conical basaltic-andesitic stratovolcano to its lower flanks. These valleys channel lava flows and pyroclastic avalanches that have sometimes reached the coast. Five small satellitic centers are located near the island's shoreline on the northern, southern, and western sides. Two summit craters are present; both are active, although most observed eruptions have originated from the southern crater, concentrating eruptive products during much of the past century into the SE valley. Frequent eruptions, typically of mild-to-moderate scale, have been recorded since 1616. Occasional larger eruptions have produced pyroclastic flows and lava flows that reached flat-lying coastal areas and entered the sea, sometimes impacting populated areas.
Information Contacts: P. de Saint-Ours, D. Lolok, and C. McKee, RVO.
Marapi
Indonesia
0.38°S, 100.474°E; summit elev. 2885 m
All times are local (unless otherwise noted)
Explosion kills one person and injures five others
An explosion on 5 July killed one person and injured five others. Marapi has been erupting since 1987, with explosions typically occurring about once every 1-7 days. Material ejected by the smaller explosions rises 100-800 m, whereas ejecta from larger explosions reach 800-2,000 m above the summit. The recent explosions, which produce ash and lapilli, have originated from Verbeek Crater in the summit complex. Ashfalls have been frequent NW of the volcano in Bukittinggi (roughly 15 km NW of the summit), Sungai Puar (30 km NW), and the Agam district (>30 km NW), depending on wind direction. Fluctuations in Marapi's explosions seem to parallel shallow volcanic earthquakes (figure 2), suggesting that the activity is primarily caused by degassing from a relatively shallow source through an open vent.
Activity in June began with an explosion on the 1st. Continuous tremor followed, and on 6 June at 0227 another explosion occurred. Repeated explosions then deposited ~0.5 mm of ash on Bukittinggi. On 25 June, witnesses 2 km from the volcano (at the Batu Palano Volcano Observatory) heard a detonation and saw glow. A brownish-black cauliflower-shaped plume rose 1,800 m above the summit. During June, 45 deep and 312 shallow volcanic earthquakes, 108 volcanic tremor episodes, and 2,104 explosion earthquakes were recorded.
The strongest explosion occurred on 5 July at 0912. Bukittinggi and vicinity were covered by 0.5-1.5 mm of ash several hours later, with ash in some areas reaching 2 mm thickness. Ash also extended to Padang, ~10 km SW of the crater. Bombs killed one person, seriously injured three, and caused minor injuries to two others. The victims had climbed to the summit without consultation with the Mt. Marapi Volcano Observatory or local authorities, although a hazard warning had been in effect since 1987.
Geologic Background. Gunung Marapi, not to be confused with the better-known Merapi volcano on Java, is Sumatra's most active volcano. This massive complex stratovolcano rises 2,000 m above the Bukittinggi Plain in the Padang Highlands. A broad summit contains multiple partially overlapping summit craters constructed within the small 1.4-km-wide Bancah caldera. The summit craters are located along an ENE-WSW line, with volcanism migrating to the west. More than 50 eruptions, typically consisting of small-to-moderate explosive activity, have been recorded since the end of the 18th century; no lava flows outside the summit craters have been reported in historical time.
Information Contacts: W. Modjo, VSI.
Maug Islands (United States) — June 1992 Cite this Report
Maug Islands
United States
20.02°N, 145.22°E; summit elev. 227 m
All times are local (unless otherwise noted)
No activity evident
A six-member team of USGS volcanologists visited the Commonwealth of the Northern Mariana Islands 11-27 May 1992 at the request of the CNMI Office of Civil Defense. Aerial observations [of Maug] on 13 May revealed no signs of steaming or other evidence of recent volcanic activity.
Geologic Background. Three small elongated islands up to 2.3 km long mark the northern, western, and eastern rims of a largely submerged 2.5-km-wide caldera. The highest point of the Maug Islands reaches only 227 m above sea level; the submerged southern notch on the caldera rim lies about 140 m below sea level. The caldera has an average submarine depth of about 200 m and contains a twin-peaked central lava dome that rises to within about 20 m of the sea surface. The Maug Islands form a twin volcanic massif with Supply Reef, about 11 km N. The truncated inner walls of the caldera on all three islands expose lava flows and pyroclastic deposits that are cut by radial dikes; bedded ash deposits overlie the outer flanks of the islands. No eruptions are known since the discovery of the islands by Espinosa in 1522. The presence of poorly developed coral reefs and coral on the central lava dome suggests a long period of general quiescence, although it does not exclude mild eruptions (Corwin, 1971). A 2003 NOAA expedition detected possible evidence of submarine geothermal activity.
Information Contacts: R. Moore, USGS; R. Koyanagi, M. Sako, and F. Trusdell, HVO.
Medicine Lake (United States) — June 1992 Cite this Report
Medicine Lake
United States
41.611°N, 121.554°W; summit elev. 2412 m
All times are local (unless otherwise noted)
Seismicity apparently triggered by M 7.5 earthquake hundreds of kilometers away
Southern California's largest earthquake since 1952, M 7.5 on 28 June, appeared to trigger seismicity at several volcanic centers in California. It was centered roughly 200 km E of Los Angeles. In the following, David Hill describes post-earthquake activity at Long Valley caldera, and Stephen Walter discusses the USGS's seismic network, and the changes it detected at Lassen, Shasta, Medicine Lake, and the Geysers.
In recent years, the USGS northern California seismic network has relied upon Real-Time Processors (RTPs) to detect, record, and locate earthquakes. However, a film recorder (develocorder) collects data from 18 stations in volcanic areas, primarily to detect long-period earthquakes missed by RTPs. The film recorders proved useful in counting the post-M 7.5 earthquakes, most of which were too small to trigger the RTPs.
The film record was scanned for the 24 hours after the M 7.5 earthquake, noting the average coda duration for each identified event. Some events may have been missed because of seismogram saturation by the M 7.5 earthquake. Marked increases in microseismicity were observed at Lassen Peak, Medicine Lake caldera, and the Geysers (table 1). No earthquakes were observed at Shasta, but the lack of operating stations on the volcano limited the capability to observe small events.
Table 1. Number of earthquakes at northern California volcanic centers during 24-hour periods following major earthquakes on 25 April (40.37°N, 124.32°W; M 7.0) and 28 June (34.18°N, 116.47°W; M 7.5) 1992. Events with coda durations less than or equal to 10 seconds and greater than 10 seconds are tallied separately. Earthquakes were identified from film records of seismograms from nearby stations. Courtesy of Stephen Walter.
| Date |
Lassen |
Shasta |
Medicine Lake |
Geysers |
| Codas (seconds) |
<= 10 |
> 10 |
<= 10 |
> 10 |
<= 10 |
> 10 |
<= 10 |
> 10 |
| 25 Apr 1992 |
0 |
0 |
0 |
1 |
0 |
0 |
7 |
2 |
| 28 Jun 1992 |
8 |
14 |
1 |
5 |
12 |
0 |
46 |
4 |
Film was also scanned for the 24 hours following the M 7.0 earthquake at 40.37°N, 124.32°W (near Cape Mendocino) on 25 April. Although smaller than the 28 June earthquake, its epicenter was only 20-25% as far from the volcanoes. Furthermore, both the 25 April main shock and a M 6.5 aftershock were felt at the volcanic centers, but no felt reports were received from these areas after the 28 June earthquake. Only the Geysers showed any possible triggered events after the 25 April shock. However, background seismicity at the Geysers is higher than at the other centers, and is influenced by fluid injection and withdrawal associated with intensive geothermal development.
Medicine Lake Report. Twelve events were detected in the Medicine Lake area (~900 km NNW of the epicenter) in the 30 minutes after the M 7.5 earthquake. All had coda durations less than or equal to 10 seconds. The lack of any S-P separation indicated that they were centered very close to the single seismic station, near the center of the caldera. All known historical seismicity had occurred in the central caldera as part of a mainshock/aftershock sequence during the fall and winter of 1988-89.
Geologic Background. Medicine Lake is a large Pleistocene-to-Holocene, basaltic-to-rhyolitic shield volcano east of the main axis of the Cascade Range. Volcanism, similar in style to that of Newberry volcano in Oregon, began less than one million years ago. A roughly 7 x 12 km caldera truncating the summit contains a lake that gives the volcano its name. A series of young eruptions lasting a few hundred years began about 10,500 years before present (BP) and produced 5 km3 of basaltic lava. Nine Holocene eruptions clustered during three eruptive episodes at about 5000, 3000, and 1000 years ago produced a chemically varied group of basaltic lava flows from flank vents and silicic obsidian flows from vents within the caldera and on the upper flanks. The last eruption produced the massive Glass Mountain obsidian flow on the E flank about 900 years BP. Lava Beds National Monument on the N flank of Medicine Lake shield volcano contains hundreds of lava-tube caves displaying a variety of spectacular lava-flow features, most of which are found in the voluminous Mammoth Crater lava flow, which extends in several lobes up to 24 km from the vent.
Information Contacts: S. Walter and D. Hill, USGS Menlo Park.
Nyamulagira (DR Congo) — June 1992 Cite this Report
Nyamulagira
DR Congo
1.408°S, 29.2°E; summit elev. 3058 m
All times are local (unless otherwise noted)
Continued lava production from fissure vents
Vigorous lava production continued through June . . . . The eruption has built 23 cinder cones along a 2.5-km zone that trends generally NE, ~15 km NE of Nyamuragira caldera and 5 km ENE of the 1957 Kitsimbanyi vent (figure 12 and table 1). The eruption's early phases produced substantial lava flows, but since 20 November activity has been characterized by vigorous ejection of bombs, lava fragments, and ash, with lava flows of only limited extent.
Table 1. Sequence of activity at Nyamuragira's 1991-92 eruption vents. Locations are shown on figure 12. Some small, short-lived vents removed by subsequent lava flows are not listed.
| Cone |
First Activity |
Comments |
| 1 |
24 Sep 1991 |
Named Mikombe. |
| 2 |
24 Oct 1991 |
-- |
| 3 |
25 Oct 1991 |
Through 3 Feb 1992. |
| 4a, b |
07 Nov 1991 |
-- |
| 5a, b, c |
08 Nov 1991 |
On 24 November 1991 only cone 5 was active. |
| 6 |
10 Nov 1991 |
-- |
| 7 |
11 Nov 1991 |
-- |
| 8 |
23 Dec 1991 |
-- |
| 9 |
06 Feb 1992 |
-- |
| 10a, b |
26 Feb 1992 |
-- |
| 11 |
08 Mar 1992 |
-- |
| 12 |
10 Mar 1992 |
-- |
| 13 |
12 Mar 1992 |
-- |
| 14 |
16 Mar 1992 |
Still active in May. |
| 15 |
08 May 1992 |
-- |
| 16a, b |
10 May 1992 |
Cones 14-17 still active through the end of May. |
| 16b |
10 May 1992 |
-- |
| 17 |
11 May 1992 |
-- |
| 18 |
24 May 1992 |
-- |
| 19 |
05 Jul 1992 |
Cones 19-21 still intermittently active through August 1992. |
| 20 |
14 Jul 1992 |
-- |
| 21 |
19 Jul 1992 |
-- |
From 20 September until 5 February, activity was confined to a N32-34°E fissure (cones 1-8). The most persistent activity at a single vent, 25 October-3 February, has made Cone 3 the largest of the eruption, rising ~80 m above the surrounding lava plain. Three new cones developed in February, nos. 9 (6 February), 10a and 10b (26 February). In March, activity resumed at the S end of the fissure along a branch that trended E from the initial vent, successively building cones 11, 12, and 14. Vent 13, 1 km to the N, erupted during the same period.
In early May, activity moved to the N end of the fissure, as a NE branch developed and formed vents 15-17. These vents remained active at the end of May, as did no. 14 at the S end of the fissure, producing intermittent lava fountains. Vent 18, near the middle of the fissure, began to erupt at about 1100 on 24 May. By 8 June it had grown to ~25 m height and its lava flows had extended ~3 km N, eroding away cones 10a and 10b. Activity at the new vent was preceded by an increase in microtremor amplitude recorded at a seismic station (Katale) 12 km E. Amplitude increased significantly from 8 June, indicating movement of new magma from a deeper source. As of 1 July, there was no indication that the eruption was nearing its end. Lava production remained vigorous, with high lava fountains, and strong emission of bombs and other tephra.
Geologic Background. Africa's most active volcano, Nyamulagira (also known as Nyamuragira), is a massive high-potassium basaltic shield about 25 km N of Lake Kivu and 13 km NNW of the steep-sided Nyiragongo volcano. The summit is truncated by a small 2 x 2.3 km caldera that has walls up to about 100 m high. Documented eruptions have occurred within the summit caldera, as well as from the numerous flank fissures and cinder cones. A lava lake in the summit crater, active since at least 1921, drained in 1938, at the time of a major flank eruption. Recent lava flows extend down the flanks more than 30 km from the summit as far as Lake Kivu; extensive lava flows from this volcano have covered 1,500 km2 of the western branch of the East African Rift.
Information Contacts: N. Zana, CRSN, Bukavu.
Pagan (United States) — June 1992 Cite this Report
Pagan
United States
18.13°N, 145.8°E; summit elev. 570 m
All times are local (unless otherwise noted)
Recent small ash eruption; long-period earthquakes and tremor; inflation
A six-member team of USGS volcanologists visited the Commonwealth of the Northern Mariana Islands 11-27 May 1992 at the request of the CNMI Office of Civil Defense. The team observed all of the islands in the chain N of Saipan, installed a new seismic station at the base of frequently active Pagan, remeasured existing EDM networks, mapped the geology of Alamagan, sampled fumaroles and hot springs, and collected rocks and charcoal for radiocarbon dating. No volcanoes in the chain erupted during the observation period.
Reports from brief visits to Pagan indicate that the most recent small ash eruption occurred on 13 April. Continuing seismicity was dominated by short bursts of long-period earthquakes and volcanic tremor. The highest measured steam temperature was 76°C; solfataras that are probably hotter are inaccessible deep within the crater. Episodic fuming, marked by periods of relatively high SO2 outgassing followed by quiescence, was observed continuously 13-21 May. EDM lines from the coast to reflectors on the flanks had shortened by as much as 11.3 cm since September 1990. These lines had shown no significant changes between 1983 and 1990, a period characterized by frequent small ash eruptions following the large Plinian eruption of 15 May 1981 (Banks and others, 1984). After the first remeasurement on 17 May, no large changes in line lengths were detected during the next 3 days.
The team collected three charcoal samples on Pagan. Two of the units to be dated are relatively old, and their ages should help to constrain the age of the caldera.
South Pagan . . . has several steaming fumaroles, but no temperatures were measured. No shallow earthquake swarms have been recorded since the installation of the seismic station in 1990.
Reference. Banks, N.G., Koyanagi, R.Y., Sinton, J.M., and Honma, K.T., 1984, The eruption of Mount Pagan volcano, Mariana Islands, 15 May 1981: JVGR, v. 22, p. 225-269.
Geologic Background. Pagan Island, the largest and one of the most active of the Mariana Islands volcanoes, consists of two stratovolcanoes connected by a narrow isthmus. Both North and South Pagan stratovolcanoes were constructed within calderas, 7 and 4 km in diameter, respectively. North Pagan at the NE end of the island rises above the flat floor of the northern caldera, which may have formed less than 1,000 years ago. South Pagan is a stratovolcano with an elongated summit containing four distinct craters. Almost all of the recorded eruptions, which date back to the 17th century, have originated from North Pagan. The largest eruption during historical time took place in 1981 and prompted the evacuation of the sparsely populated island.
Information Contacts: R. Moore, USGS; R. Koyanagi, M. Sako, and F. Trusdell, HVO.
Pinatubo (Philippines) — June 1992 Cite this Report
Pinatubo
Philippines
15.13°N, 120.35°E; summit elev. 1486 m
All times are local (unless otherwise noted)
Lava dome extruded into caldera lake; small steam-and-ash ejections; lahars and secondary explosions
Increased seismicity preceded the emergence of a lava dome into the center of the caldera lake. Moderate steam-and-ash emission was associated with the lava extrusion.
Long-period earthquakes and tremor began to be recorded on 6 July. An aerial survey during the morning of 7 July showed no visible change in steaming from crater vents, although the caldera lake was convecting and somewhat muddier than normal. A small island was reported in the caldera lake early on 9 July. An overflight that day at 1500 revealed a mud cone about 100 m in diameter near the center of the lake, protruding about 5 m above the lake surface. Small phreatic explosions to about 100 m height occurred near the side of the island. PHIVOLCS raised the official alert level to 3, indicating the possibility of an eruption within weeks. The announcement described possible activity as quiet extrusion of a lava dome or moderately explosive phreatomagmatic eruptions. A danger zone of 10-km radius was being enforced.
The cone had reportedly reached 200-300 m in diameter by 12 July. A lava dome 100-150 m in diameter was visible near the center of the island during an aerial survey on 14 July at 0900-1000. The island had grown to around 250-300 m across and was 8-10 m above lake level. A continuous dirty white steam column that included some ash was emerging from the dome and drifting SW during the overflight. Ashfall was reported on two towns ~30 km SW of the summit (San Marcelino and Castillejos) at about 0600 and 1300. The alert level was raised to 5 (eruption in progress).
On the flanks of the volcano, monsoon rains triggered secondary explosions and lahars that forced the evacuation of thousands of people living along rivers. Two people were reported killed by lahars on 12 July. The Department of Social Welfare said that about 70,000 people remained in evacuation centers and resettlement sites in the aftermath of the June 1991 eruption.
Geologic Background. Prior to 1991 Pinatubo volcano was a relatively unknown, heavily forested lava dome complex located 100 km NW of Manila with no records of historical eruptions. The 1991 eruption, one of the world's largest of the 20th century, ejected massive amounts of tephra and produced voluminous pyroclastic flows, forming a small, 2.5-km-wide summit caldera whose floor is now covered by a lake. Caldera formation lowered the height of the summit by more than 300 m. Although the eruption caused hundreds of fatalities and major damage with severe social and economic impact, successful monitoring efforts greatly reduced the number of fatalities. Widespread lahars that redistributed products of the 1991 eruption have continued to cause severe disruption. Previous major eruptive periods, interrupted by lengthy quiescent periods, have produced pyroclastic flows and lahars that were even more extensive than in 1991.
Information Contacts: PHIVOLCS; UPI; Reuters; AP.
Poas
Costa Rica
10.2°N, 84.233°W; summit elev. 2697 m
All times are local (unless otherwise noted)
Vigorous gas emission in and around crater lake; continued seismicity
Water level in the crater lake had dropped at least 3 m since April, shrinking it substantially by early June (figure 41). Its color was lime green to sky blue, and the temperature in accessible areas reached 85.8°C. Numerous cones and miniature mud volcanoes were visible within the lake. The nine main fumaroles emitted water vapor with yellowish and bluish gases (sulfur and SO2). Bluish gases and orange flames, probably caused by combustion of sulfur, emerged from the northernmost fumarole. The fumaroles to the SE occurred among collapsed sulfur-and-mud cones, as in the past 3 years.
As the rainy season began, fumaroles exposed by the shrinkage of the crater lake were covered by water. The resulting continuous phreatic activity produced plumes 1-2 m high. As the lake rose, it cooled to 64-73°C, with a pH of 1.1. Weak fumarolic activity continued on the 1953-55 dome, with a maximum measured temperature of 89°C and a condensate pH of 4.4.
A daily average of 200 low-frequency events and 24 A-B-type (medium-frequency) events were recorded 2.7 km SW of the summit (by station POA2) in June (figure 42). Highest seismicity was on 2 June.
Geologic Background. The broad vegetated edifice of Poás, one of the most active volcanoes of Costa Rica, contains three craters along a N-S line. The frequently visited multi-hued summit crater lakes of the basaltic-to-dacitic volcano are easily accessible by vehicle from the nearby capital city of San José. A N-S-trending fissure cutting the complex stratovolcano extends to the lower N flank, where it has produced the Congo stratovolcano and several lake-filled maars. The southernmost of the two summit crater lakes, Botos, last erupted about 7,500 years ago. The more prominent geothermally heated northern lake, Laguna Caliente, is one of the world's most acidic natural lakes, with a pH of near zero. It has been the site of frequent phreatic and phreatomagmatic eruptions since an eruption was reported in 1828. Eruptions often include geyser-like ejections of crater-lake water.
Information Contacts: E. Fernández, J. Barquero, and V. Barboza, OVSCIORI; G. Soto, ICE; M. Fernández, UCR.
Rabaul (Papua New Guinea) — June 1992 Cite this Report
Rabaul
Papua New Guinea
4.2459°S, 152.1937°E; summit elev. 688 m
All times are local (unless otherwise noted)
Uplift and seismicity increase slightly
"Seismic activity . . . has shown a slight increase over the last 2 months (June: 410 caldera earthquakes, May: 425) compared with activity over the last 2.5 years (100-300 events/month). Less than 1% of the recorded earthquakes in June could be located. Most were from the NW part of the caldera seismic zone. Similarly, levelling measurements showed a slight uplift of the central part of the caldera during the last two months (20 mm, 11 May-4 June; and an additional 13 mm by 8 July)."
Geologic Background. The low-lying Rabaul caldera on the tip of the Gazelle Peninsula at the NE end of New Britain forms a broad sheltered harbor utilized by what was the island's largest city prior to a major eruption in 1994. The outer flanks of the asymmetrical shield volcano are formed by thick pyroclastic-flow deposits. The 8 x 14 km caldera is widely breached on the east, where its floor is flooded by Blanche Bay and was formed about 1,400 years ago. An earlier caldera-forming eruption about 7,100 years ago is thought to have originated from Tavui caldera, offshore to the north. Three small stratovolcanoes lie outside the N and NE caldera rims. Post-caldera eruptions built basaltic-to-dacitic pyroclastic cones on the caldera floor near the NE and W caldera walls. Several of these, including Vulcan cone, which was formed during a large eruption in 1878, have produced major explosive activity during historical time. A powerful explosive eruption in 1994 occurred simultaneously from Vulcan and Tavurvur volcanoes and forced the temporary abandonment of Rabaul city.
Information Contacts: P. de Saint-Ours, D. Lolok, and C. McKee, RVO.
Rincon de la Vieja (Costa Rica) — June 1992 Cite this Report
Rincon de la Vieja
Costa Rica
10.83°N, 85.324°W; summit elev. 1916 m
All times are local (unless otherwise noted)
Continued fumarolic activity
Fumarolic activity continued through June in the active crater, where it had fed a plume more than 100 m high during May fieldwork. Chemical analyses of water collected 13 May showed pH values of less than 3 in two of the three N-flank rivers sampled, and some enhancement in sulfate and chloride concentrations (table 2). A seismographic station 5 km SW of the crater (RIN3) registered seven low-frequency earthquakes in June.
Table 2. Chemistry of water collected 13 May 1992 from three rivers on the N flank of Rincón de la Vieja. Data courtesy of the Univ. de Costa Rica.
| River |
pH |
Cl- (ppm) |
SO4-2 (ppm) |
| Pénjamo |
2.9 |
1.5 |
392 |
| Blanco |
5.8 |
2.1 |
122 |
| Azul |
2.4 |
10.0 |
384 |
Geologic Background. Rincón de la Vieja, the largest volcano in NW Costa Rica, is a remote volcanic complex in the Guanacaste Range. The volcano consists of an elongated, arcuate NW-SE-trending ridge constructed within the 15-km-wide early Pleistocene Guachipelín caldera, whose rim is exposed on the south side. Sometimes known as the "Colossus of Guanacaste," it has an estimated volume of 130 km3 and contains at least nine major eruptive centers. Activity has migrated to the SE, where the youngest-looking craters are located. The twin cone of Santa María volcano, the highest peak of the complex, is located at the eastern end of a smaller, 5-km-wide caldera and has a 500-m-wide crater. A Plinian eruption producing the 0.25 km3 Río Blanca tephra about 3,500 years ago was the last major magmatic eruption. All subsequent eruptions, including numerous historical eruptions possibly dating back to the 16th century, have been from the prominent active crater containing a 500-m-wide acid lake located ENE of Von Seebach crater.
Information Contacts: E. Fernández, J. Barquero, and V. Barboza, OVSICORI; G. Soto, ICE; Mario Fernández, Univ. de Costa Rica.
Rumble III (New Zealand) — June 1992 Cite this Report
Rumble III
New Zealand
35.745°S, 178.478°E; summit elev. -220 m
All times are local (unless otherwise noted)
Gas bubbles detected; summit 140 m below surface
Three previously unknown submarine arc stratovolcanoes have been identified at the S end of the Kermadec Ridge: Rumble V (36.140°S, 178.195°E, summit 700 m below sea level); Tangaroa (36.318°S, 178.031°E, summit 1,350 m below sea level); and Clark (36.423°S, 177.845°E, summit 1,150 m below sea level) (figure 1). All three have basal diameters of 16-18 km and rise from the seafloor at ~2,300 m depth. The first evidence of the volcanoes was from GLORIA side-scan mapping of the southern Havre Trough-Kermadec Ridge region in 1988 (Wright, 1990). Later investigations, including a photographic and rock-dredge study during the 3-week Rapuhia cruise (early 1992), confirmed previous interpretations. Side-scan and photographic data show a complex terrain of lava flows and talus fans on the flanks of all three volcanoes, with the most pristine-looking morphology at Rumble V. During the 1992 cruise, gas bubbles were detected acoustically, rising from the crests of Rumble III, IV, and V. No gas bubbling was evident from Tangaroa or Clark. Bathymetric surveys indicated that the summits of the shallowest volcanoes, Rumble III and IV, were at ~140 and 450 m, respectively, below the sea surface.
Reference. Wright, I.C., 1990, Bay of Plenty-Southern Havre Trough physiography, 1:400,000: New Zealand Oceanographic Institute Chart, Miscellaneous Series no. 68.
Geologic Background. Rumble III seamount, the largest of the Rumbles group of submarine volcanoes along the South Kermadec Ridge, rises 2,300 m from the seafloor to within about 200 m of the surface. Collapse of the edifice produced a scarp open to the west and a large debris-avalanche deposit. Fresh-looking andesitic rocks have been dredged from the summit and basaltic lava from its flanks. It has been the source of several submarine eruptions detected by hydrophone signals.
Information Contacts: I. Wright, New Zealand Oceanographic Institute, National Institute of Water and Atmospheric Research, Wellington.
Rumble IV (New Zealand) — June 1992 Cite this Report
Rumble IV
New Zealand
36.13°S, 178.05°E; summit elev. -500 m
All times are local (unless otherwise noted)
Gas bubbles detected; summit 450 m below surface
Three previously unknown submarine arc stratovolcanoes have been identified at the S end of the Kermadec Ridge: Rumble V (36.140°S, 178.195°E, summit 700 m below sea level); Tangaroa (36.318°S, 178.031°E, summit 1,350 m below sea level); and Clark (36.423°S, 177.845°E, summit 1,150 m below sea level) (figure 1). All three have basal diameters of 16-18 km and rise from the seafloor at ~2,300 m depth. The first evidence of the volcanoes was from GLORIA side-scan mapping of the southern Havre Trough-Kermadec Ridge region in 1988 (Wright, 1990). Later investigations, including a photographic and rock-dredge study during the 3-week Rapuhia cruise (early 1992), confirmed previous interpretations. Side-scan and photographic data show a complex terrain of lava flows and talus fans on the flanks of all three volcanoes, with the most pristine-looking morphology at Rumble V. During the 1992 cruise, gas bubbles were detected acoustically, rising from the crests of Rumble III, IV, and V. No gas bubbling was evident from Tangaroa or Clark. Bathymetric surveys indicated that the summits of the shallowest volcanoes, Rumble III and IV, were at ~140 and 450 m, respectively, below the sea surface.
Reference. Wright, I.C., 1990, Bay of Plenty-Southern Havre Trough physiography, 1:400,000: New Zealand Oceanographic Institute Chart, Miscellaneous Series no. 68.
Geologic Background. The submarine Rumble IV volcano was thought to have been active from April to December 1966, based on hydrophone signals (Kibblewhite, 1967), but later evidence indicated that the hydrophone array had been damaged and the signals originated from Rumble III (Hall, 1985). Fresh, glassy andesitic lava was dredged from the summit in 1992 during a New Zealand Oceanographic Institute cruise, and gas bubbles were acoustically detected rising from Rumble IV.
Information Contacts: I. Wright, New Zealand Oceanographic Institute, National Institute of Water and Atmospheric Research, Wellington.
Rumble V (New Zealand) — June 1992 Cite this Report
Rumble V
New Zealand
36.142°S, 178.196°E; summit elev. -400 m
All times are local (unless otherwise noted)
New submarine volcano identified; rising gas bubbles
Three previously unknown submarine arc stratovolcanoes have been identified at the S end of the Kermadec Ridge: Rumble V (36.140°S, 178.195°E, summit 700 m below sea level); Tangaroa (36.318°S, 178.031°E, summit 1,350 m below sea level); and Clark (36.423°S, 177.845°E, summit 1,150 m below sea level) (figure 1). All three have basal diameters of 16-18 km and rise from the seafloor at ~2,300 m depth. The first evidence of the volcanoes was from GLORIA side-scan mapping of the southern Havre Trough-Kermadec Ridge region in 1988 (Wright, 1990). Later investigations, including a photographic and rock-dredge study during the 3-week Rapuhia cruise (early 1992), confirmed previous interpretations. Side-scan and photographic data show a complex terrain of lava flows and talus fans on the flanks of all three volcanoes, with the most pristine-looking morphology at Rumble V. During the 1992 cruise, gas bubbles were detected acoustically, rising from the crests of Rumble III, IV, and V. No gas bubbling was evident from Tangaroa or Clark. Bathymetric surveys indicated that the summits of the shallowest volcanoes, Rumble III and IV, were at ~140 and 450 m, respectively, below the sea surface.
Reference. Wright, I.C., 1990, Bay of Plenty-Southern Havre Trough physiography, 1:400,000: New Zealand Oceanographic Institute Chart, Miscellaneous Series no. 68.
Geologic Background. Rumble V was discovered in 1992 at the southernmost end of the Rumble seamounts on the southern Kermadec Ridge, 17 km ESE of Rumble IV. Andesitic and basaltic andesite rocks have been dredged from this volcano, which rises more than 2,000 m to nearly 400 m below the ocean surface and shows a pristine morphology. A large plume of gas bubbles was acoustically detected rising from the summit in 1992, and subsequent expeditions detected evidence of vigorous hydrothermal activity.
Information Contacts: I. Wright, New Zealand Oceanographic Institute, National Institute of Water and Atmospheric Research, Wellington.
Sarigan (United States) — June 1992 Cite this Report
Sarigan
United States
16.708°N, 145.78°E; summit elev. 538 m
All times are local (unless otherwise noted)
No activity evident
A six-member team of USGS volcanologists visited the Commonwealth of the Northern Mariana Islands 11-27 May 1992 at the request of the CNMI Office of Civil Defense. Gas emission [from Sarigan] was not evident during overflights in an airplane on 13 May and a helicopter on 21 May.
Geologic Background. Sarigan volcano forms a 3-km-long, roughly triangular island. A low truncated cone with a 750-m-wide summit crater contains a small ash cone. The youngest eruptions produced two lava domes from vents above and near the south crater rim. Lava flows from each dome reached the coast and extended out to sea, forming irregular shorelines. The northern flow overtopped the crater rim on the north and NW sides. The sparse vegetation on the flows indicates they are of Holocene age (Meijer and Reagan, 1981).
Information Contacts: R. Moore, USGS; R. Koyanagi, M. Sako, and F. Trusdell, HVO.
Shasta (United States) — June 1992 Cite this Report
Shasta
United States
41.409°N, 122.193°W; summit elev. 4317 m
All times are local (unless otherwise noted)
No seismicity triggered by M 7.5 earthquake hundreds of kilometers away
Southern California's largest earthquake since 1952, M 7.5 on 28 June, appeared to trigger seismicity at several volcanic centers in California. It was centered roughly 200 km E of Los Angeles. In the following, David Hill describes post-earthquake activity at Long Valley caldera, and Stephen Walter discusses the USGS's seismic network, and the changes it detected at Lassen, Shasta, Medicine Lake, and the Geysers.
In recent years, the USGS northern California seismic network has relied upon Real-Time Processors (RTPs) to detect, record, and locate earthquakes. However, a film recorder (develocorder) collects data from 18 stations in volcanic areas, primarily to detect long-period earthquakes missed by RTPs. The film recorders proved useful in counting the post-M 7.5 earthquakes, most of which were too small to trigger the RTPs.
The film record was scanned for the 24 hours after the M 7.5 earthquake, noting the average coda duration for each identified event. Some events may have been missed because of seismogram saturation by the M 7.5 earthquake. Marked increases in microseismicity were observed at Lassen Peak, Medicine Lake caldera, and the Geysers (table 1). No earthquakes were observed at Shasta, but the lack of operating stations on the volcano limited the capability to observe small events.
Table 1. Number of earthquakes at northern California volcanic centers during 24-hour periods following major earthquakes on 25 April (40.37°N, 124.32°W; M 7.0) and 28 June (34.18°N, 116.47°W; M 7.5) 1992. Events with coda durations less than or equal to 10 seconds and greater than 10 seconds are tallied separately. Earthquakes were identified from film records of seismograms from nearby stations. Courtesy of Stephen Walter.
| Date |
Lassen |
Shasta |
Medicine Lake |
Geysers |
| Codas (seconds) |
<= 10 |
> 10 |
<= 10 |
> 10 |
<= 10 |
> 10 |
<= 10 |
> 10 |
| 25 Apr 1992 |
0 |
0 |
0 |
1 |
0 |
0 |
7 |
2 |
| 28 Jun 1992 |
8 |
14 |
1 |
5 |
12 |
0 |
46 |
4 |
Film was also scanned for the 24 hours following the M 7.0 earthquake at 40.37°N, 124.32°W (near Cape Mendocino) on 25 April. Although smaller than the 28 June earthquake, its epicenter was only 20-25% as far from the volcanoes. Furthermore, both the 25 April main shock and a M 6.5 aftershock were felt at the volcanic centers, but no felt reports were received from these areas after the 28 June earthquake. Only the Geysers showed any possible triggered events after the 25 April shock. However, background seismicity at the Geysers is higher than at the other centers, and is influenced by fluid injection and withdrawal associated with intensive geothermal development.
Shasta report. The film record showed no earthquake activity beneath Shasta (~900 km NNW of the epicenter), although telemetry problems limited the ability to detect events below M 2. Of the six earthquakes in the 24 hours following the M 7.5 shock, two were large enough to be recorded by the RTP system. These were centered about 60 km SE of Shasta and about equidistant from Lassen (figure 1). Because the arrival times and S-P sequences of the other four events were similar to those of the two located shocks, it is likely that all had similar epicenters. Occasional M 2 earthquakes have previously occurred in this area, which includes several mapped N-trending normal faults with Quaternary movement. Three days after the M 7.5 earthquake, a M 2.0 shock occurred beneath Shasta's SE flank, followed by a M 2.7 event the next day. Both were centered at about 15 km depth, similar to most earthquakes beneath Shasta in the last decade.
Geologic Background. The most voluminous of the Cascade volcanoes, northern California's Mount Shasta is a massive compound stratovolcano composed of at least four main edifices constructed over a period of at least 590,000 years. An older edifice was destroyed by a large debris avalanche which filled the Shasta River valley to the NW. The Hotlum cone, forming the present summit, the Shastina lava dome complex, and the SW flank Black Butte lava dome, were constructed during the early Holocene. Eruptions from these vents have produced pyroclastic flows and mudflows that affected areas as far as 20 km from the summit. Eruptions from Hotlum cone continued throughout the Holocene.
Information Contacts: Stephen Walter and David Hill, MS 977, U.S. Geological Survey, 345 Middlefield Road, Menlo Park, California 94025 USA.
Spurr (United States) — June 1992 Cite this Report
Spurr
United States
61.299°N, 152.251°W; summit elev. 3374 m
All times are local (unless otherwise noted)
Details of 27 June eruptive cloud
Increased seismicity preceded a brief eruption of Spurr that began on 27 June at 0704, producing an eruption cloud that was carried rapidly NNE. Seismic data suggested that the eruption ended at about 1100, after apparent eruptive pulses at 0814 and 0904. By 1049, shortly before feeding of the plume stopped, data from the Nimbus-7 satellite's TOMS showed its leading edge roughly 500 km from the volcano, near Fairbanks (figure 3), with an apparent SO2 content of 35 kilotons. The next day, the cloud was detached from the volcano but still clearly visible on weather satellite imagery, extending in a 2,000-km arc E and SE over NE Alaska and NW Canada (figures 3 and 4). As the plume elongated, SO2 detected by the TOMS instrument increased to a maximum of 185 kilotons on 28 June at 1125, then decreased slightly to 160 kilotons as it started to dissipate on 29 June. The cloud remained visible on both TOMS data and weather satellite imagery for several more days.
The maximum eruption cloud altitude reported by pilots was about 12 km. However, radar installed on the Kenai Peninsula after the Redoubt eruption, to monitor nearby volcanic activity, measured higher altitudes. At 0803, radar detected a vertical cloud to about 9 km altitude; at 0840, strong returns to 9 km and some material to 14.5 km; at 0950 and 1004, columns to 16 km altitude; and at 1018, to 18 km (figure 5).
Because the plume was carried northward, major air routes to Asia that extend along the Aleutian chain from Anchorage were not affected. A Notice to Airmen warned aircraft to avoid the immediate vicinity of the volcano. No routes were officially closed, but airlines avoided using routes N and NW of the volcano (J501, 111, 133, 120, and 122; and V319, 444, and 480) during the eruption. Flights arriving in Anchorage, 120 km E of Spurr, were routed along normal approaches from the south.
Geologic Background. Mount Spurr is the closest volcano to Anchorage, Alaska (130 km W) and just NE of Chakachamna Lake. The summit is a large lava dome at the center of a roughly 5-km-wide amphitheater open to the south formed by a late-Pleistocene or early Holocene debris avalanche and associated pyroclastic flows that destroyed an older edifice. The debris avalanche traveled more than 25 km SE, and the resulting deposit contains blocks as large as 100 m in diameter. Several ice-carved post-collapse cones or lava domes are present. The youngest vent, Crater Peak, formed at the southern end of the amphitheater and has been the source of about 40 identified Holocene tephra layers. Eruptions from Crater Peak in 1953 and 1992 deposited ash in Anchorage.
Information Contacts: AVO; G. Bluth, NASA GSFC; SAB, NOAA/NESDIS; Joel Curtis and Dale Eubanks, NWS Alaska Region, Anchorage; Darla Gerlach, Air Traffic Division, FAA, Anchorage.
Stromboli
Italy
38.789°N, 15.213°E; summit elev. 924 m
All times are local (unless otherwise noted)
Small explosions and seismicity continue
Fieldwork during the first week in June revealed that eruptive activity was mainly concentrated in craters C1 (vent 1) and C3 (vent 4), which fed black plumes no more than 100 m high. Seismicity remained high in June (figure 26), near the 180 events/day reached in the last third of May. A minimum of 108 events was recorded on 24 June. After declining rapidly about 20 May, tremor energy returned to levels characteristic of the period since November 1991.
Geologic Background. Spectacular incandescent nighttime explosions at Stromboli have long attracted visitors to the "Lighthouse of the Mediterranean" in the NE Aeolian Islands. This volcano has lent its name to the frequent mild explosive activity that has characterized its eruptions throughout much of historical time. The small island is the emergent summit of a volcano that grew in two main eruptive cycles, the last of which formed the western portion of the island. The Neostromboli eruptive period took place between about 13,000 and 5,000 years ago. The active summit vents are located at the head of the Sciara del Fuoco, a prominent scarp that formed about 5,000 years ago due to a series of slope failures which extends to below sea level. The modern volcano has been constructed within this scarp, which funnels pyroclastic ejecta and lava flows to the NW. Essentially continuous mild Strombolian explosions, sometimes accompanied by lava flows, have been recorded for more than a millennium.
Information Contacts: M. Riuscetti, Univ di Udine.
Tangaroa (New Zealand) — June 1992 Cite this Report
Tangaroa
New Zealand
36.321°S, 178.028°E; summit elev. -600 m
All times are local (unless otherwise noted)
New submarine volcano identified; no gas bubbling
Three previously unknown submarine arc stratovolcanoes have been identified at the S end of the Kermadec Ridge: Rumble V (36.140°S, 178.195°E, summit 700 m below sea level); Tangaroa (36.318°S, 178.031°E, summit 1,350 m below sea level); and Clark (36.423°S, 177.845°E, summit 1,150 m below sea level) (figure 1). All three have basal diameters of 16-18 km and rise from the seafloor at ~2,300 m depth. The first evidence of the volcanoes was from GLORIA side-scan mapping of the southern Havre Trough-Kermadec Ridge region in 1988 (Wright, 1990). Later investigations, including a photographic and rock-dredge study during the 3-week Rapuhia cruise (early 1992), confirmed previous interpretations. Side-scan and photographic data show a complex terrain of lava flows and talus fans on the flanks of all three volcanoes, with the most pristine-looking morphology at Rumble V. During the 1992 cruise, gas bubbles were detected acoustically, rising from the crests of Rumble III, IV, and V. No gas bubbling was evident from Tangaroa or Clark. Bathymetric surveys indicated that the summits of the shallowest volcanoes, Rumble III and IV, were at ~140 and 450 m, respectively, below the sea surface.
Reference. Wright, I.C., 1990, Bay of Plenty-Southern Havre Trough physiography, 1:400,000: New Zealand Oceanographic Institute Chart, Miscellaneous Series no. 68.
Geologic Background. Tangaroa submarine volcano in the southern Kermadec arc rises to within 600 m of the ocean surface. The volcano is elongated in a NW-SE direction and contains smaller cones on its SE to eastern flanks. A larger edifice lies further to the SE. Tangaroa lies between Clark and Rumble V submarine volcanoes near the southern end of the Kermadec arc and is one of more than a half dozen volcanoes in this part of the arc showing evidence for active hydrothermal vent fields.
Information Contacts: I. Wright, New Zealand Oceanographic Institute, National Institute of Water and Atmospheric Research, Wellington.
Turrialba (Costa Rica) — June 1992 Cite this Report
Turrialba
Costa Rica
10.025°N, 83.767°W; summit elev. 3340 m
All times are local (unless otherwise noted)
Occasional seismicity
A telemetering seismic station (VTU) 0.5 km E of the active crater recorded 17 events in June. The maximum daily number, 4, occurred on 13 June.
Geologic Background. Turrialba, the easternmost of Costa Rica's Holocene volcanoes, is a large vegetated basaltic-to-dacitic stratovolcano located across a broad saddle NE of Irazú volcano overlooking the city of Cartago. The massive edifice covers an area of 500 km2. Three well-defined craters occur at the upper SW end of a broad 800 x 2200 m summit depression that is breached to the NE. Most activity originated from the summit vent complex, but two pyroclastic cones are located on the SW flank. Five major explosive eruptions have occurred during the past 3500 years. A series of explosive eruptions during the 19th century were sometimes accompanied by pyroclastic flows. Fumarolic activity continues at the central and SW summit craters.
Information Contacts: E. Fernández, J. Barquero, and V. Barboza, OVSICORI.
Unzendake
Japan
32.761°N, 130.299°E; summit elev. 1483 m
All times are local (unless otherwise noted)
Continued lava dome growth generates pyroclastic flows
Growth of the lava dome continued through early July. Partial collapses of the dome complex frequently generated pyroclastic flows. Dome 7, which had begun to emerge in late March, grew exogenously against dome 6 (figure 43), which was buried and eroded by dome 7's lava blocks. Frequent rockfalls from the front and margins of dome 7 reduced its length (to ~ 200 m) and height (to ~ 50 m). Petal or peel structures, which had always appeared on the dome's surface during periods of rapid lava extrusion, were not evident, perhaps indicating a declining magma supply rate. The cryptodome, including dome 5, grew endogenously, frequently generating small rockfalls that were probably triggered by earthquakes within or beneath the dome complex.
Volcanic gas was emitted continuously from the E part of dome 3, as well as from the depression between domes 3 and 7. The depression divides the cryptodome area into a conical NE section that includes the dome's summit, and a lower SW section with a flat top.
Deposits of the pyroclastic flows that cascade down the SE flank continue to bury the Akamatsu valley. The lowest saddle of the valley's southern cliff remains ~ 10 m high. On 23 June, the ash-cloud surge from a pyroclastic flow struck the saddle, but the main flow did not reach the cliff. The surge toppled brush on the saddle and to ~ 100 m distance, but small cedar trees remained standing. Bark and leaves were not burned, but leaves in the area died. About 10 cm of ash was deposited on the saddle. Thin lead foil, set in a stainless-steel hole to detect the pressure of the ash-cloud surge, was hollowed, and aluminum foil was broken.
Debris flows that have occasionally occurred during the current rainy season eroded pyroclastic flow deposits in the valley. Pyroclastic-flow material was deposited along the valley's N side and in its upper reaches. This deposition pattern, erosion by debris flows, and the declining magma-supply rate delayed the overflow of the lowest part of the saddle by southern-cliff pyroclastic flow deposits. In early July, the Nagasaki prefectural government began to construct a steel fence, 35 m wide and 10 m high, in a stream originating from the saddle, hoping to prevent ash-cloud surges from entering the stream.
JMA reported that the daily number of seismically detected pyroclastic flows ranged from 6 to 21 in June. The total of 373 in June was almost unchanged from previous months. The longest June flow extended 3 km SE from the dome. Most ash clouds generated by the flows rose about 1,000 m, with the highest, to 1,200 m, on 13 and 17 June.
Small earthquakes continued to occur within and beneath the dome complex, at rates of 50-200/day through mid-July. The June total, 3,671 recorded earthquakes, was similar to previous months.
Evacuated areas . . . were somewhat reduced on 11 July, decreasing the number of evacuees from 6,746 to 6,064.
Geologic Background. The massive Unzendake volcanic complex comprises much of the Shimabara Peninsula east of the city of Nagasaki. An E-W graben, 30-40 km long, extends across the peninsula. Three large stratovolcanoes with complex structures, Kinugasa on the north, Fugen-dake at the east-center, and Kusenbu on the south, form topographic highs on the broad peninsula. Fugendake and Mayuyama volcanoes in the east-central portion of the andesitic-to-dacitic volcanic complex have been active during the Holocene. The Mayuyama lava dome complex, located along the eastern coast west of Shimabara City, formed about 4000 years ago and was the source of a devastating 1792 CE debris avalanche and tsunami. Historical eruptive activity has been restricted to the summit and flanks of Fugendake. The latest activity during 1990-95 formed a lava dome at the summit, accompanied by pyroclastic flows that caused fatalities and damaged populated areas near Shimabara City.
Information Contacts: S. Nakada, Kyushu Univ; JMA.