Recently Published Bulletin Reports
Erebus (Antarctica) Lava lake remains active; most thermal alerts recorded since 2019
Rincon de la Vieja (Costa Rica) Frequent phreatic explosions during July-December 2023
Bezymianny (Russia) Explosion on 18 October 2023 sends ash plume 8 km high; lava flows and incandescent avalanches
Kilauea (United States) Low-level lava effusions in the lava lake at Halema’uma’u during July-December 2022
Nyamulagira (DR Congo) Lava flows and thermal activity during May-October 2023
Bagana (Papua New Guinea) Explosions, ash plumes, ashfall, and lava flows during April-September 2023
Mayon (Philippines) Lava flows, pyroclastic flows, ash emissions, and seismicity during April-September 2023
Nishinoshima (Japan) Eruption plumes and gas-and-steam plumes during May-August 2023
Krakatau (Indonesia) White gas-and-steam plumes and occasional ash plumes during May-August 2023
Villarrica (Chile) Strombolian activity, gas-and-ash emissions, and crater incandescence during April-September 2023
Merapi (Indonesia) Frequent incandescent avalanches during April-September 2023
Ebeko (Russia) Moderate explosive activity with ash plumes continued during June-November 2023
Erebus (Antarctica) — January 2024  Cite this Report
Erebus
Antarctica
77.53°S, 167.17°E; summit elev. 3794 m
All times are local (unless otherwise noted)
Lava lake remains active; most thermal alerts recorded since 2019
The lava lake in the summit crater of Erebus has been active since at least 1972. Located in Antarctica overlooking the McMurdo Station on Ross Island, it is the southernmost active volcano on the planet. Because of the remote location, activity is primarily monitored by satellites. This report covers activity during 2023.
The number of thermal alerts recorded by the Hawai'i Institute of Geophysics and Planetology’s MODVOLC Thermal Alerts System increased considerably in 2023 compared to the years 2020-2022 (table 9). In contrast to previous years, the MODIS instruments aboard the Aqua and Terra satellites captured data from Erebus every month during 2023. Consistent with previous years, the lowest number of anomalous pixels were recorded in January, November, and December.
Table 9. Number of monthly MODIS-MODVOLC thermal alert pixels recorded at Erebus during 2017-2023. See BGVN 42:06 for data from 2000 through 2016. The table was compiled using data provided by the HIGP – MODVOLC Thermal Alerts System.
| Year |
Jan |
Feb |
Mar |
Apr |
May |
Jun |
Jul |
Aug |
Sep |
Oct |
Nov |
Dec |
SUM |
| 2017 |
0 |
21 |
9 |
0 |
0 |
1 |
11 |
61 |
76 |
52 |
0 |
3 |
234 |
| 2018 |
0 |
21 |
58 |
182 |
55 |
17 |
137 |
172 |
103 |
29 |
0 |
0 |
774 |
| 2019 |
2 |
21 |
162 |
151 |
55 |
56 |
75 |
53 |
29 |
19 |
1 |
0 |
624 |
| 2020 |
0 |
2 |
16 |
18 |
4 |
4 |
1 |
3 |
18 |
3 |
1 |
6 |
76 |
| 2021 |
0 |
9 |
1 |
0 |
2 |
56 |
46 |
47 |
35 |
52 |
5 |
3 |
256 |
| 2022 |
1 |
13 |
55 |
22 |
15 |
32 |
39 |
19 |
31 |
11 |
0 |
0 |
238 |
| 2023 |
2 |
33 |
49 |
82 |
41 |
32 |
70 |
64 |
42 |
17 |
5 |
11 |
448 |
Sentinel-2 infrared images showed one or two prominent heat sources within the summit crater, accompanied by adjacent smaller sources, similar to recent years (see BGVN 46:01, 47:02, and 48:01). A unique image was obtained on 25 November 2023 by the OLI-2 (Operational Land Imager-2) on Landsat 9, showing the upper part of the volcano surrounded by clouds (figure 32).
Geologic Background. Mount Erebus, the world's southernmost historically active volcano, overlooks the McMurdo research station on Ross Island. It is the largest of three major volcanoes forming the crudely triangular Ross Island. The summit of the dominantly phonolitic volcano has been modified by one or two generations of caldera formation. A summit plateau at about 3,200 m elevation marks the rim of the youngest caldera, which formed during the late-Pleistocene and within which the modern cone was constructed. An elliptical 500 x 600 m wide, 110-m-deep crater truncates the summit and contains an active lava lake within a 250-m-wide, 100-m-deep inner crater; other lava lakes are sometimes present. The glacier-covered volcano was erupting when first sighted by Captain James Ross in 1841. Continuous lava-lake activity with minor explosions, punctuated by occasional larger Strombolian explosions that eject bombs onto the crater rim, has been documented since 1972, but has probably been occurring for much of the volcano's recent history.
Information Contacts: Hawai'i Institute of Geophysics and Planetology (HIGP) - MODVOLC Thermal Alerts System, School of Ocean and Earth Science and Technology (SOEST), Univ. of Hawai'i, 2525 Correa Road, Honolulu, HI 96822, USA (URL: http://modis.higp.hawaii.edu/); Copernicus Browser, Copernicus Data Space Ecosystem, European Space Agency (URL: https://dataspace.copernicus.eu/browser/); NASA Earth Observatory, EOS Project Science Office, NASA Goddard Space Flight Center, Goddard, Maryland, USA (URL: https://earthobservatory.nasa.gov/images/152134/erebus-breaks-through).
Rincon de la Vieja (Costa Rica) — January 2024 Cite this Report
Rincon de la Vieja
Costa Rica
10.83°N, 85.324°W; summit elev. 1916 m
All times are local (unless otherwise noted)
Frequent phreatic explosions during July-December 2023
Rincón de la Vieja is a volcanic complex in Costa Rica with a hot convecting acid lake that exhibits frequent weak phreatic explosions, gas-and-steam emissions, and occasional elevated sulfur dioxide levels (BGVN 45:10, 46:03, 46:11). The current eruption period began June 2021. This report covers activity during July-December 2023 and is based on weekly bulletins and occasional daily reports from the Observatorio Vulcanologico Sismologica de Costa Rica-Universidad Nacional (OVSICORI-UNA).
Numerous weak phreatic explosions continued during July-December 2023, along with gas-and-steam emissions and plumes that rose as high as 3 km above the crater rim. Many weekly OVSICORI-UNA bulletins included the previous week's number of explosions and emissions (table 9). For many explosions, the time of explosion was given (table 10). Frequent seismic activity (long-period earthquakes, volcano-tectonic earthquakes, and tremor) accompanied the phreatic activity.
Table 9. Number of reported weekly phreatic explosions and gas-and-steam emissions at Rincón de la Vieja, July-December 2023. Counts are reported for the week before the Weekly Bulletin date; not all reports included these data. Courtesy of OVSICORI-UNA.
| OVSICORI Weekly Bulletin |
Number of explosions |
Number of emissions |
| 28 Jul 2023 |
6 |
14 |
| 4 Aug 2023 |
10 |
12 |
| 1 Sep 2023 |
13 |
11 |
| 22 Sep 2023 |
12 |
13 |
| 29 Sep 2023 |
6 |
11 |
| 6 Oct 2023 |
12 |
5 |
| 13 Oct 2023 |
7 |
9 |
| 20 Oct 2023 |
1 |
15 |
| 27 Oct 2023 |
3 |
23 |
| 3 Nov 2023 |
3 |
10 |
| 17 Nov 2023 |
0 |
Some |
| 24 Nov 2023 |
0 |
14 |
| 8 Dec 2023 |
4 |
16 |
| 22 Dec 2023 |
8 |
18 |
Table 10. Summary of activity at Rincón de la Vieja during July-December 2023. Weak phreatic explosions and gas emissions are noted where the time of explosion was indicated in the weekly or daily bulletins. Height of plumes or emissions are distance above the crater rim. Courtesy of OVSICORI-UNA.
| Date |
Time |
Description of Activity |
| 1 Jul 2023 |
0156 |
Explosion. |
| 2 Jul 2023 |
0305 |
Explosion. |
| 4 Jul 2023 |
0229, 0635 |
Event at 0635 produced a gas-and-steam plume that rose 700 m and drifted W; seen by residents in Liberia (21 km SW). |
| 9 Jul 2023 |
1843 |
Explosion. |
| 21 Jul 2023 |
0705 |
Explosion. |
| 26 Jul 2023 |
1807 |
Explosion. |
| 28 Jul 2023 |
0802 |
Explosion generated a gas-and-steam plume that rose 500 m. |
| 30 Jul 2023 |
1250 |
Explosion. |
| 31 Jul 2023 |
2136 |
Explosion. |
| 11 Aug 2023 |
0828 |
Explosion. |
| 18 Aug 2023 |
1304 |
Explosion. |
| 21 Aug 2023 |
1224 |
Explosion generated gas-and-steam plumes rose 500-600 m. |
| 22 Aug 2023 |
0749 |
Explosion generated gas-and-steam plumes rose 500-600 m. |
| 24 Aug 2023 |
1900 |
Explosion. |
| 25 Aug 2023 |
0828 |
Event produced a steam-and-gas plume that rose 3 km and drifted NW. |
| 27-28 Aug 2023 |
0813 |
Four small events; the event at 0813 on 28 August lasted two minutes and generated a steam-and-gas plume that rose 2.5 km. |
| 1 Sep 2023 |
1526 |
Explosion generated plume that rose 2 km and ejected material onto the flanks. |
| 2-3 Sep 2023 |
- |
Small explosions detected in infrasound data. |
| 4 Sep 2023 |
1251 |
Gas-and-steam plume rose 1 km and drifted W. |
| 7 Nov 2023 |
1113 |
Explosion. |
| 8 Nov 2023 |
0722 |
Explosion. |
| 12 Nov 2023 |
0136 |
Small gas emissions. |
| 14 Nov 2023 |
0415 |
Small gas emissions. |
According to OVSICORI-UNA, during July-October the average weekly sulfur dioxide (SO2) flux ranged from 68 to 240 tonnes/day. However, in mid-November the flux increased to as high as 334 tonnes/day, the highest value measured in recent years. The high SO2 flux in mid-November was also detected by the TROPOMI instrument on the Sentinel-5P satellite (figure 43).
Geologic Background. Rincón de la Vieja, the largest volcano in NW Costa Rica, is a remote volcanic complex in the Guanacaste Range. The volcano consists of an elongated, arcuate NW-SE-trending ridge constructed within the 15-km-wide early Pleistocene Guachipelín caldera, whose rim is exposed on the south side. Sometimes known as the "Colossus of Guanacaste," it has an estimated volume of 130 km3 and contains at least nine major eruptive centers. Activity has migrated to the SE, where the youngest-looking craters are located. The twin cone of Santa María volcano, the highest peak of the complex, is located at the eastern end of a smaller, 5-km-wide caldera and has a 500-m-wide crater. A Plinian eruption producing the 0.25 km3 Río Blanca tephra about 3,500 years ago was the last major magmatic eruption. All subsequent eruptions, including numerous historical eruptions possibly dating back to the 16th century, have been from the prominent active crater containing a 500-m-wide acid lake located ENE of Von Seebach crater.
Information Contacts: Observatorio Vulcanológico Sismológica de Costa Rica-Universidad Nacional (OVSICORI-UNA), Apartado 86-3000, Heredia, Costa Rica (URL: http://www.ovsicori.una.ac.cr/); NASA Global Sulfur Dioxide Monitoring Page, Atmospheric Chemistry and Dynamics Laboratory, NASA Goddard Space Flight Center (NASA/GSFC), 8800 Greenbelt Road, Goddard MD 20771, USA (URL: https://so2.gsfc.nasa.gov/).
Bezymianny (Russia) — November 2023 Cite this Report
Bezymianny
Russia
55.972°N, 160.595°E; summit elev. 2882 m
All times are local (unless otherwise noted)
Explosion on 18 October 2023 sends ash plume 8 km high; lava flows and incandescent avalanches
Bezymianny, located on Russia’s Kamchatka Peninsula, has had eruptions since 1955 characterized by dome growth, explosions, pyroclastic flows, ash plumes, and ashfall. Activity during November 2022-April 2023 included gas-and-steam emissions, lava dome collapses generating avalanches, and persistent thermal activity. Similar eruptive activity continued from May through October 2023, described here based on information from weekly and daily reports of the Kamchatka Volcano Eruptions Response Team (KVERT), notices from Tokyo VAAC (Volcanic Ash Advisory Center), and from satellite data.
Overall activity decreased after the strong period of activity in late March through April 2023, which included ash explosions during 29 March and 7-8 April 2023 that sent plumes as high as 10-12 km altitude, along with dome growth and lava flows (BGVN 48:05). This reduced activity can be seen in the MIROVA thermal detection system graph (figure 56), which was consistent with data from the MODVOLC thermal detection system and with Sentinel-2 satellite images that showed persistent hotspots in the summit crater when conditions allowed observations. A renewed period of strong activity began in mid-October 2023.
Activity increased significantly on 17 October 2023 when large collapses began during 0700-0830 on the E flanks of the lava dome and continued to after 0930 the next day (figure 57). Ash plumes rose to an altitude of 4.5-5 km, extending 220 km NNE by 18 October. A large explosion at 1630 on 18 October produced an ash plume that rose to an altitude of 11 km (8 km above the summit) and drifted NNE and then NW, extending 900 km NW within two days at an altitude of 8 km. Minor ashfall was noted in Kozyrevsk (45 km WNW). At 0820 on 20 October an ash plume was identified in satellite images drifting 100 km ENE at altitudes of 4-4.5 km.
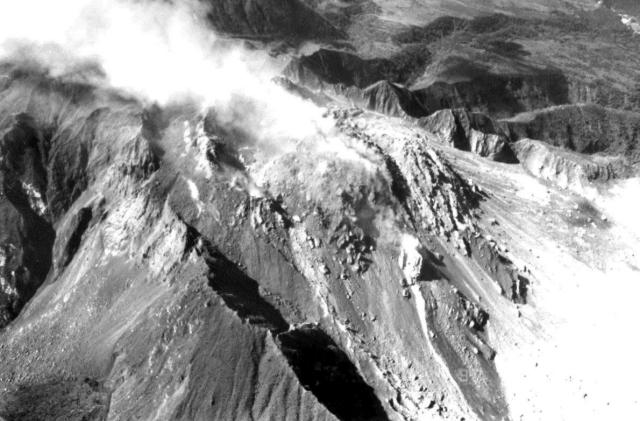
Lava flows and hot avalanches from the dome down the SE flank continued over the next few days, including 23 October when clear conditions allowed good observations (figures 58 and 59). A large thermal anomaly was observed over the volcano through 24 October, and in the summit crater on 30 October (figure 60). Strong fumarolic activity continued, with numerous avalanches and occasional incandescence. By the last week of October, volcanic activity had decreased to a level consistent with that earlier in the reporting period.
Aviation warnings were frequently updated during 17-20 October. KVERT issued a Volcano Observatory Notice for Aviation (VONA) on 17 October at 1419 and 1727 (0219 and 0527 UTC) raising the Aviation Color Code (ACC) from Yellow to Orange (second highest level). The next day, KVERT issued a VONA at 1705 (0505 UTC) raising the ACC to Red (highest level) but lowered it back to Orange at 2117 (0917 UTC). After another decrease to Yellow and back to Orange, the ACC was reduced to Yellow on 20 October at 1204 (0004 UTC). In addition, the Tokyo VAAC issued a series of Volcanic Ash Advisories beginning on 16 October and continuing through 30 October.
Geologic Background. The modern Bezymianny, much smaller than its massive neighbors Kamen and Kliuchevskoi on the Kamchatka Peninsula, was formed about 4,700 years ago over a late-Pleistocene lava-dome complex and an edifice built about 11,000-7,000 years ago. Three periods of intensified activity have occurred during the past 3,000 years. The latest period, which was preceded by a 1,000-year quiescence, began with the dramatic 1955-56 eruption. This eruption, similar to that of St. Helens in 1980, produced a large open crater that was formed by collapse of the summit and an associated lateral blast. Subsequent episodic but ongoing lava-dome growth, accompanied by intermittent explosive activity and pyroclastic flows, has largely filled the 1956 crater.
Information Contacts: Kamchatka Volcanic Eruptions Response Team (KVERT), Far Eastern Branch, Russian Academy of Sciences, 9 Piip Blvd., Petropavlovsk-Kamchatsky, 683006, Russia (URL: http://www.kscnet.ru/ivs/kvert/); Kamchatka Volcanological Station, Kamchatka Branch of Geophysical Survey, (KB GS RAS), Klyuchi, Kamchatka Krai, Russia (URL: http://volkstat.ru/); Tokyo Volcanic Ash Advisory Center (VAAC), 1-3-4 Otemachi, Chiyoda-ku, Tokyo 100-8122, Japan (URL: http://ds.data.jma.go.jp/svd/vaac/data/); Hawai'i Institute of Geophysics and Planetology (HIGP) - MODVOLC Thermal Alerts System, School of Ocean and Earth Science and Technology (SOEST), Univ. of Hawai'i, 2525 Correa Road, Honolulu, HI 96822, USA (URL: http://modis.higp.hawaii.edu/); MIROVA (Middle InfraRed Observation of Volcanic Activity), a collaborative project between the Universities of Turin and Florence (Italy) supported by the Centre for Volcanic Risk of the Italian Civil Protection Department (URL: http://www.mirovaweb.it/); Copernicus Browser, Copernicus Data Space Ecosystem, European Space Agency (URL: https://dataspace.copernicus.eu/browser/).chr
Kilauea (United States) — January 2023 Cite this Report
Kilauea
United States
19.421°N, 155.287°W; summit elev. 1222 m
All times are local (unless otherwise noted)
Low-level lava effusions in the lava lake at Halema’uma’u during July-December 2022
Kīlauea is the southeastern-most volcano in Hawaii and overlaps the E flank of the Mauna Loa volcano. Its East Rift Zone (ERZ) has been intermittently active for at least 2,000 years. An extended eruption period began in January 1983 and was characterized by open lava lakes and lava flows from the summit caldera and the East Rift Zone. During May 2018 magma migrated into the Lower East Rift Zone (LERZ) and opened 24 fissures along a 6-km-long NE-trending fracture zone that produced lava flows traveling in multiple directions. As lava emerged from the fissures, the lava lake at Halema'uma'u drained and explosions sent ash plumes to several kilometers altitude (BGVN 43:10).
The current eruption period started during September 2021 and has recently been characterized by lava effusions, spatter, and sulfur dioxide emissions in the active Halema’uma’u lava lake (BGVN 47:08). Lava effusions, some spatter, and sulfur dioxide emissions have continued during this reporting period of July through December 2022 using daily reports, volcanic activity notices, and abundant photo, map, and video data from the US Geological Survey's (USGS) Hawaiian Volcano Observatory (HVO).
Summary of activity during July-December 2022. Low-level effusions have continued at the western vent of the Halema’uma’u crater during July through early December 2022. Occasional weak ooze-outs (also called lava break outs) would occur along the margins of the crater floor. The overall level of the active lava lake throughout the reporting period gradually increased due to infilling, however it stagnated in mid-September (table 13). During September through November, activity began to decline, though lava effusions persisted at the western vent. By 9 December, the active part of the lava lake had completely crusted over, and incandescence was no longer visible.
Table 13. Summary of measurements taken during overflights at Kīlauea that show a gradual increase in the active lava lake level and the volume of lava effused since 29 September 2021. Lower activity was reported during September-October. Data collected during July-December 2022. Courtesy of HVO.
| Date: |
Level of the active lava lake (m): |
Cumulative volume of lava effused (million cubic meters): |
| 7 Jul 2022 |
130 |
95 |
| 19 Jul 2022 |
133 |
98 |
| 4 Aug 2022 |
136 |
102 |
| 16 Aug 2022 |
137 |
104 |
| 12 Sep 2022 |
143 |
111 |
| 5 Oct 2022 |
143 |
111 |
| 28 Oct 2022 |
143 |
111 |
Activity during July 2022. Lava effusions were reported from the western vent in the Halema’uma’u crater, along with occasional weak ooze-outs along the margins of the crater floor. The height of the lava lake was variable due to deflation-inflation tilt events; for example, the lake level dropped approximately 3-4 m during a summit deflation-inflation event reported on 1 July. Webcam images taken during the night of 6-12 July showed intermittent low-level spattering at the western vent that rose less than 10 m above the vent (figure 519). Measurements made during an overflight on 7 July indicated that the crater floor was infilled about 130 m and that 95 million cubic meters of lava had been effused since 29 September 2021. A single, relatively small lava ooze-out was active to the S of the lava lake. Around midnight on 8 July there were two brief periods of lava overflow onto the lake margins. On 9 July lava ooze-outs were reported near the SE and NE edges of the crater floor and during 10-11 July they occurred near the E, NE, and NW edges. On 16 July crater incandescence was reported, though the ooze-outs and spattering were not visible. On 18 July overnight webcam images showed incandescence in the western vent complex and two ooze-outs were reported around 0000 and 0200 on 19 July. By 0900 there were active ooze-outs along the SW edge of the crater floor. Measurements made from an overflight on 19 July indicated that the crater floor was infilled about 133 m and 98 million cubic meters of lava had erupted since 29 September 2021 (figure 520). On 20 July around 1600 active ooze-outs were visible along the N edge of the crater, which continued through the next day. Extensive ooze-outs occurred along the W margin during 24 July until 1900; on 26 July minor ooze-outs were noted along the N margin. Minor spattering was visible on 29 July along the E margin of the lake. The sulfur dioxide emission rates ranged 650-2,800 tons per day (t/d), the higher of which was measured on 8 July (figure 519).
Activity during August 2022. The eruption continued in the Halema’uma’u crater at the western vent. According to HVO the lava in the active lake remained at the level of the bounding levees. Occasional minor ooze-outs were observed along the margins of the crater floor. Strong nighttime crater incandescence was visible after midnight on 6 August over the western vent cone. During 6-7 August scattered small lava lobes were active along the crater floor and incandescence persisted above the western vent through 9 August. During 7-9 August HVO reported a single lava effusion source was active along the NW margin of the crater floor. Measurements from an overflight on 4 August indicated that the crater floor was infilled about 136 m total and that 102 million cubic meters of lava had been erupted since the start of the eruption. Lava breakouts were reported along the N, NE, E, S, and W margins of the crater during 10-16 August. Another overflight survey conducted on 16 August indicated that the crater floor infilled about 137 m and 104 million cubic meters of lava had been erupted since September 2021. Measured sulfur dioxide emissions rates ranged 1,150-2,450 t/d, the higher of which occurred on 8 August.
Activity during September 2022. During September, lava effusion continued from the western vent into the active lava lake and onto the crater floor. Intermittent minor ooze-outs were reported through the month. A small ooze-out was visible on the W crater floor margin at 0220 on 2 September, which showed decreasing surface activity throughout the day, but remained active through 3 September. On 3 September around 1900 a lava outbreak occurred along the NW margin of the crater floor but had stopped by the evening of 4 September. Field crews monitoring the summit lava lake on 9 September observed spattering on the NE margin of the lake that rose no higher than 10 m, before falling back onto the lava lake crust (figure 521). Overflight measurements on 12 September indicated that the crater floor was infilled a total of 143 m and 111 million cubic meters of lava had been erupted since September 2021. Extensive breakouts in the W and N part of the crater floor were reported at 1600 on 20 September and continued into 26 September. The active part of the lava lake dropped by 10 m while other parts of the crater floor dropped by several meters. Summit tiltmeters recorded a summit seismic swarm of more than 80 earthquakes during 1500-1800 on 21 September, which occurred about 1.5 km below Halema’uma’u; a majority of these were less than Mw 2. By 22 September the active part of the lava lake was infilled about 2 m. On 23 September the western vent areas exhibited several small spatter cones with incandescent openings, along with weak, sporadic spattering (figure 522). The sulfur dioxide emission rate ranged from 930 t/d to 2,000 t/d, the higher of which was measured on 6 September.
Activity during October 2022. Activity during October declined slightly compared to previous months, though lava effusions persisted from the western vent into the active lava lake and onto the crater floor during October (figure 523). Slight variations in the lava lake were noted throughout the month. HVO reported that around 0600 on 3 October the level of the lava lake has lowered slightly. Overflight measurements taken on 5 October indicated that the crater floor was infilled a total of about 143 m and that 111 million cubic meters of lava had been effused since September 2021. During 6-7 October the lake gradually rose 0.5 m. Sulfur dioxide measurements made on 22 October had an emission rate of 700 t/d. Another overflight taken on 28 October showed that there was little to no change in the elevation of the crater floor: the crater floor was infilled a total of 143 m and 111 million cubic meters of lava had erupted since the start of the eruption.
Activity during November 2022. Activity remained low during November, though HVO reported that lava from the western vent continued to effuse into the active lava lake and onto the crater floor throughout the month. The rate of sulfur dioxide emissions during November ranged from 300-600 t/d, the higher amount of which occurred on 9 November.
Activity during December 2022. Similar low activity was reported during December, with lava effusing from the western vent into the active lava lake and onto the crater floor. During 4-5 December the active part of the lava lake was slightly variable in elevation and fluctuated within 1 m. On 9 December HVO reported that lava was no longer erupting from the western vent in the Halema’uma’u crater and that sulfur dioxide emissions had returned to near pre-eruption background levels; during 10-11 December, the lava lake had completely crusted over, and no incandescence was visible (figure 524). Time lapse camera images covering the 4-10 December showed that the crater floor showed weak deflation and no inflation. Some passive events of crustal overturning were reported during 14-15 December, which brought fresh incandescent lava to the lake surface. The sulfur dioxide emission rate was approximately 200 t/d on 14 December. A smaller overturn event on 17 December and another that occurred around 0000 and into the morning of 20 December were also detected. A small seismic swarm was later detected on 30 December.
Geologic Background. Kilauea overlaps the E flank of the massive Mauna Loa shield volcano in the island of Hawaii. Eruptions are prominent in Polynesian legends; written documentation since 1820 records frequent summit and flank lava flow eruptions interspersed with periods of long-term lava lake activity at Halemaumau crater in the summit caldera until 1924. The 3 x 5 km caldera was formed in several stages about 1,500 years ago and during the 18th century; eruptions have also originated from the lengthy East and Southwest rift zones, which extend to the ocean in both directions. About 90% of the surface of the basaltic shield volcano is formed of lava flows less than about 1,100 years old; 70% of the surface is younger than 600 years. The long-term eruption from the East rift zone between 1983 and 2018 produced lava flows covering more than 100 km2, destroyed hundreds of houses, and added new coastline.
Information Contacts: Hawaiian Volcano Observatory (HVO), U.S. Geological Survey, PO Box 51, Hawai'i National Park, HI 96718, USA (URL: http://hvo.wr.usgs.gov/).
Nyamulagira (DR Congo) — November 2023 Cite this Report
Nyamulagira
DR Congo
1.408°S, 29.2°E; summit elev. 3058 m
All times are local (unless otherwise noted)
Lava flows and thermal activity during May-October 2023
Nyamulagira (also known as Nyamuragira) is a shield volcano in the Democratic Republic of Congo with the summit truncated by a small 2 x 2.3 km caldera with walls up to about 100 m high. Documented eruptions have occurred within the summit caldera, as well as from numerous flank fissures and cinder cones. The current eruption period began in April 2018 and has more recently been characterized by summit crater lava flows and thermal activity (BGVN 48:05). This report describes lava flows and variable thermal activity during May through October 2023, based on information from the Observatoire Volcanologique de Goma (OVG) and various satellite data.
Lava lake activity continued during May. The MIROVA (Middle InfraRed Observation of Volcanic Activity) system recorded moderate-to-strong thermal activity throughout the reporting period; activity was more intense during May and October and relatively weaker from June through September (figure 95). The MODVOLC thermal algorithm, detected a total of 209 thermal alerts. There were 143 hotspots detected during May, eight during June, nine during September, and 49 during October. This activity was also reflected in infrared satellite images, where a lava flow was visible in the NW part of the crater on 7 May and strong activity was seen in the center of the crater on 4 October (figure 96). Another infrared satellite image taken on 12 May showed still active lava flows along the NW margin of the crater. According to OVG lava effusions were active during 7-29 May and moved to the N and NW parts of the crater beginning on 9 May. Strong summit crater incandescence was visible from Goma (27 km S) during the nights of 17, 19, and 20 May (figure 97). On 17 May there was an increase in eruptive activity, which peaked at 0100 on 20 May. Notable sulfur dioxide plumes drifted NW and W during 19-20 May (figure 98). Drone footage acquired in partnership with the USGS (United States Geological Survey) on 20 May captured images of narrow lava flows that traveled about 100 m down the W flank (figure 99). Data from the Rumangabo seismic station indicated a decreasing trend in activity during 17-21 May. Although weather clouds prevented clear views of the summit, a strong thermal signature on the NW flank was visible in an infrared satellite image on 22 May, based on an infrared satellite image. On 28 May the lava flows on the upper W flank began to cool and solidify. By 29 May seismicity returned to levels similar to those recorded before the 17 May increase. Lava effusion continued but was confined to the summit crater; periodic crater incandescence was observed.
Low-level activity was noted during June through October. On 1 June OVG reported that seismicity remained at lower levels and that crater incandescence had been absent for three days, though infrared satellite imagery showed continued lava effusion in the summit crater. The lava flows on the flanks covered an estimated 0.6 km2. Satellite imagery continued to show thermal activity confined to the lava lake through October (figure 96), although no lava flows or significant sulfur dioxide emissions were reported.
Geologic Background. Africa's most active volcano, Nyamulagira (also known as Nyamuragira), is a massive high-potassium basaltic shield about 25 km N of Lake Kivu and 13 km NNW of the steep-sided Nyiragongo volcano. The summit is truncated by a small 2 x 2.3 km caldera that has walls up to about 100 m high. Documented eruptions have occurred within the summit caldera, as well as from the numerous flank fissures and cinder cones. A lava lake in the summit crater, active since at least 1921, drained in 1938, at the time of a major flank eruption. Recent lava flows extend down the flanks more than 30 km from the summit as far as Lake Kivu; extensive lava flows from this volcano have covered 1,500 km2 of the western branch of the East African Rift.
Information Contacts: Observatoire Volcanologique de Goma (OVG), Departement de Geophysique, Centre de Recherche en Sciences Naturelles, Lwiro, D.S. Bukavu, DR Congo; Hawai'i Institute of Geophysics and Planetology (HIGP) - MODVOLC Thermal Alerts System, School of Ocean and Earth Science and Technology (SOEST), Univ. of Hawai'i, 2525 Correa Road, Honolulu, HI 96822, USA (URL: http://modis.higp.hawaii.edu/); MIROVA (Middle InfraRed Observation of Volcanic Activity), a collaborative project between the Universities of Turin and Florence (Italy) supported by the Centre for Volcanic Risk of the Italian Civil Protection Department (URL: http://www.mirovaweb.it/); NASA Global Sulfur Dioxide Monitoring Page, Atmospheric Chemistry and Dynamics Laboratory, NASA Goddard Space Flight Center (NASA/GSFC), 8800 Greenbelt Road, Goddard, Maryland, USA (URL: https://so2.gsfc.nasa.gov/); Copernicus Browser, Copernicus Data Space Ecosystem, European Space Agency (URL: https://dataspace.copernicus.eu/browser/); Charles Balagizi, Goma Volcano Observatory, Departement de Geophysique, Centre de Recherche en Sciences Naturelles, Lwiro, D.S. Bukavu, DR Congo.
Bagana (Papua New Guinea) — October 2023 Cite this Report
Bagana
Papua New Guinea
6.137°S, 155.196°E; summit elev. 1855 m
All times are local (unless otherwise noted)
Explosions, ash plumes, ashfall, and lava flows during April-September 2023
The remote volcano of Bagana is located in central Bougainville Island, Papua New Guinea. Recorded eruptions date back to 1842 and activity has consisted of effusive activity that has built a small lava dome in the summit crater and occasional explosions that produced pyroclastic flows. The most recent eruption has been ongoing since February 2000 and has produced occasional explosions, ash plumes, and lava flows. More recently, activity has been characterized by ongoing effusive activity and ash emissions (BGVN 48:04). This report updates activity from April through September 2023 that has consisted of explosions, ash plumes, ashfall, and lava flows, using information from the Darwin Volcanic Ash Advisory Center (VAAC) and satellite data.
An explosive eruption was reported on 7 July that generated a large gas-and-ash plume to high altitudes and caused significant ashfall in local communities; the eruption plume had reached upper tropospheric (16-18 km altitude) altitudes by 2200, according to satellite images. Sulfur dioxide plumes were detected in satellite images on 8 July and indicated that the plume was likely a mixture of gas, ice, and ash. A report issued by the Autonomous Bougainville Government (ABG) (Torokina District, Education Section) on 10 July noted that significant ash began falling during 2000-2100 on 7 July and covered most areas in the Vuakovi, Gotana (9 km SW), Koromaketo, Laruma (25 km W) and Atsilima (27 km NW) villages. Pyroclastic flows also occurred, according to ground-based reports; small deposits confined to one drainage were inspected by RVO during an overflight on 17 July and were confirmed to be from the 7 July event. Ashfall continued until 10 July and covered vegetation, which destroyed bushes and gardens and contaminated rivers and streams.
RVO reported another eruption on 14 July. The Darwin VAAC stated that an explosive event started around 0830 on 15 July and produced an ash plume that rose to 16.5 km altitude by 1000 and drifted N, according to satellite images. The plume continued to drift N and remained visible through 1900, and by 2150 it had dissipated.
Ashfall likely from both the 7 and 15 July events impacted about 8,111 people in Torokina (20 km SW), including Tsito/Vuakovi, Gotana, Koromaketo, Kenaia, Longkogari, Kenbaki, Piva (13 km SW), and Atsinima, and in the Tsitovi district, according to ABG. Significant ashfall was also reported in Ruruvu (22 km N) in the Wakunai District of Central Bougainville, though the thickness of these deposits could not be confirmed. An evacuation was called for the villages in Wakunai, where heavy ashfall had contaminated water sources; the communities of Ruruvu, Togarau, Kakarapaia, Karauturi, Atao, and Kuritaturi were asked to evacuate to a disaster center at the Wakunai District Station, and communities in Torokina were asked to evacuate to the Piva District station. According to a news article, more than 7,000 people needed temporary accommodations, with about 1,000 people in evacuation shelters. Ashfall had deposited over a broad area, contaminating water supplies, affecting crops, and collapsing some roofs and houses in rural areas. Schools were temporarily shut down. Intermittent ash emissions continued through the end of July and drifted NNW, NW, and SW. Fine ashfall was reported on the coast of Torokina, and ash plumes also drifted toward Laruma and Atsilima.
A small explosive eruption occurred at 2130 on 28 July that ejected material from the crater vents, according to reports from Torokina, in addition to a lava flow that contained two lobes. A second explosion was detected at 2157. Incandescence from the lava flow was visible from Piva as it descended the W flank around 2000 on 29 July (figure 47). The Darwin VAAC reported that a strong thermal anomaly was visible in satellite images during 30-31 July and that ash emissions rose to 2.4 km altitude and drifted WSW on 30 July. A ground report from RVO described localized emissions at 0900 on 31 July.
The Darwin VAAC reported that ash plumes were identified in satellite imagery at 0800 and 1220 on 12 August and rose to 2.1 km and 3 km altitude and drifted NW and W, respectively. A news report stated that aid was sent to more than 6,300 people that were adversely affected by the eruption. Photos taken during 17-19 August showed ash emissions rising no higher than 1 km above the summit and drifting SE. A small explosion generated an ash plume during the morning of 19 August. Deposits from small pyroclastic flows were also captured in the photos. Satellite images captured lava flows and pyroclastic flow deposits. Two temporary seismic stations were installed near Bagana on 17 August at distances of 7 km WSW (Vakovi station) and 11 km SW (Kepox station). The Kepox station immediately started to record continuous, low-frequency background seismicity.
Satellite data. Little to no thermal activity was detected during April through mid-July 2023; only one anomaly was recorded during early April and one during early June, according to MIROVA (Middle InfraRed Observation of Volcanic Activity) data (figure 48). Thermal activity increased in both power and frequency during mid-July through September, although there were still some short gaps in detected activity. MODVOLC also detected increased thermal activity during August; thermal hotspots were detected a total of five times on 19, 20, and 27 August. Weak thermal anomalies were also captured in infrared satellite images on clear weather days throughout the reporting period on 7, 12, and 17 April, 27 May, 1, 6, 16, and 31 July, and 19 September (figure 48); a strong thermal anomaly was visible on 31 July. Distinct sulfur dioxide plumes that drifted generally NW were intermittently captured by the TROPOMI instrument on the Sentinel-5P satellite and sometimes exceeded two Dobson Units (DUs) (figure 49).
Geologic Background. Bagana volcano, in a remote portion of central Bougainville Island, is frequently active. This massive symmetrical cone was largely constructed by an accumulation of viscous andesitic lava flows. The entire edifice could have been constructed in about 300 years at its present rate of lava production. Eruptive activity is characterized by non-explosive effusion of viscous lava that maintains a small lava dome in the summit crater, although occasional explosive activity produces pyroclastic flows. Lava flows with tongue-shaped lobes up to 50 m thick and prominent levees descend the flanks on all sides.
Information Contacts: Rabaul Volcano Observatory (RVO), Geohazards Management Division, Department of Mineral Policy and Geohazards Management (DMPGM), PO Box 3386, Kokopo, East New Britain Province, Papua New Guinea; Darwin Volcanic Ash Advisory Centre (VAAC), Bureau of Meteorology, Northern Territory Regional Office, PO Box 40050, Casuarina, NT 0811, Australia (URL: http://www.bom.gov.au/info/vaac/); MIROVA (Middle InfraRed Observation of Volcanic Activity), a collaborative project between the Universities of Turin and Florence (Italy) supported by the Centre for Volcanic Risk of the Italian Civil Protection Department (URL: http://www.mirovaweb.it/); Hawai'i Institute of Geophysics and Planetology (HIGP) - MODVOLC Thermal Alerts System, School of Ocean and Earth Science and Technology (SOEST), Univ. of Hawai'i, 2525 Correa Road, Honolulu, HI 96822, USA (URL: http://modis.higp.hawaii.edu/); NASA Global Sulfur Dioxide Monitoring Page, Atmospheric Chemistry and Dynamics Laboratory, NASA Goddard Space Flight Center (NASA/GSFC), 8800 Greenbelt Road, Goddard, Maryland, USA (URL: https://so2.gsfc.nasa.gov/); Copernicus Browser, Copernicus Data Space Ecosystem, European Space Agency (URL: https://dataspace.copernicus.eu/browser/); Autonomous Bougainville Government, P.O Box 322, Buka, AROB, PNG (URL: https://abg.gov.pg/); Andrew Tupper (Twitter: @andrewcraigtupp); Simon Carn, Geological and Mining Engineering and Sciences, Michigan Technological University, 1400 Townsend Drive, Houghton, MI 49931, USA (URL: http://www.volcarno.com/, Twitter: @simoncarn); Radio NZ (URL: https://www.rnz.co.nz/news/pacific/494464/more-than-7-000-people-in-bougainville-need-temporary-accommodation-after-eruption); USAID, 1300 Pennsylvania Ave, NW, Washington DC 20004, USA (URL: https://www.usaid.gov/pacific-islands/press-releases/aug-08-2023-united-states-provides-immediate-emergency-assistance-support-communities-affected-mount-bagana-volcanic-eruptions).
Mayon (Philippines) — October 2023 Cite this Report
Mayon
Philippines
13.257°N, 123.685°E; summit elev. 2462 m
All times are local (unless otherwise noted)
Lava flows, pyroclastic flows, ash emissions, and seismicity during April-September 2023
Mayon is located in the Philippines and has steep upper slopes capped by a small summit crater. Historical eruptions date back to 1616 CE that have been characterized by Strombolian eruptions, lava flows, pyroclastic flows, and mudflows. Eruptions mostly originated from a central conduit. Pyroclastic flows and mudflows have commonly descended many of the approximately 40 drainages that surround the volcano. The most recent eruption occurred during June through October 2022 and consisted of lava dome growth and gas-and-steam emissions (BGVN 47:12). A new eruption was reported during late April 2023 and has included lava flows, pyroclastic density currents, ash emissions, and seismicity. This report covers activity during April through September 2023 based on daily bulletins from the Philippine Institute of Volcanology and Seismology (PHIVOLCS).
During April through September 2023, PHIVOLCS reported near-daily rockfall events, frequent volcanic earthquakes, and sulfur dioxide measurements. Gas-and-steam emissions rose 100-900 m above the crater and drifted in different directions. Nighttime crater incandescence was often visible during clear weather and was accompanied by incandescent avalanches of material. Activity notably increased during June when lava flows were reported on the S, SE, and E flanks (figure 52). The MIROVA graph (Middle InfraRed Observation of Volcanic Activity) showed strong thermal activity coincident with these lava flows, which remained active through September (figure 53). According to the MODVOLC thermal algorithm, a total of 110 thermal alerts were detected during the reporting period: 17 during June, 40 during July, 27 during August, and 26 during September. During early June, pyroclastic density currents (PDCs) started to occur more frequently.
Low activity was reported during much of April and May; gas-and-steam emissions rose 100-900 m above the crater and generally drifted in different directions. A total of 52 rockfall events and 18 volcanic earthquakes were detected during April and 147 rockfall events and 13 volcanic events during May. Sulfur dioxide flux measurements ranged between 400-576 tons per day (t/d) during April, the latter of which was measured on 29 April and between 162-343 t/d during May, the latter of which was measured on 13 May.
Activity during June increased, characterized by lava flows, pyroclastic density currents (PDCs), crater incandescence and incandescent rockfall events, gas-and-steam emissions, and continued seismicity. Weather clouds often prevented clear views of the summit, but during clear days, moderate gas-and-steam emissions rose 100-2,500 m above the crater and drifted in multiple directions. A total of 6,237 rockfall events and 288 volcanic earthquakes were detected. The rockfall events often deposited material on the S and SE flanks within 700-1,500 m of the summit crater and ash from the events drifted SW, S, SE, NE, and E. Sulfur dioxide emissions ranged between 149-1,205 t/d, the latter of which was measured on 10 June. Short-term observations from EDM and electronic tiltmeter monitoring indicated that the upper slopes were inflating since February 2023. Longer-term ground deformation parameters based on EDM, precise leveling, continuous GPS, and electronic tilt monitoring indicated that the volcano remained inflated, especially on the NW and SE flanks. At 1000 on 5 June the Volcano Alert Level (VAL) was raised to 2 (on a 0-5 scale). PHIVOLCS noted that although low-level volcanic earthquakes, ground deformation, and volcanic gas emissions indicated unrest, the steep increase in rockfall frequency may indicate increased dome activity.
A total of 151 dome-collapse PDCs occurred during 8-9 and 11-30 June, traveled 500-2,000 m, and deposited material on the S flank within 2 km of the summit crater. During 8-9 June the VAL was raised to 3. At approximately 1947 on 11 June lava flow activity was reported; two lobes traveled within 500 m from the crater and deposited material on the S (Mi-isi), SE (Bonga), and E (Basud) flanks. Weak seismicity accompanied the lava flow and slight inflation on the upper flanks. This lava flow remained active through 30 June, moving down the S and SE flank as far as 2.5 km and 1.8 km, respectively and depositing material up to 3.3 km from the crater. During 15-16 June traces of ashfall from the PDCs were reported in Sitio Buga, Nabonton, City of Ligao and Purok, and San Francisco, Municipality of Guinobatan. During 28-29 June there were two PDCs generated by the collapse of the lava flow front, which generated a light-brown ash plume 1 km high. Satellite monitors detected significant concentrations of sulfur dioxide beginning on 29 June. On 30 June PDCs primarily affected the Basud Gully on the E flank, the largest of which occurred at 1301 and lasted eight minutes, based on the seismic record. Four PDCs generated between 1800 and 2000 that lasted approximately four minutes each traveled 3-4 km on the E flank and generated an ash plume that rose 1 km above the crater and drifted N and NW. Ashfall was recorded in Tabaco City.
Similar strong activity continued during July; slow lava effusion remained active on the S and SE flanks and traveled as far as 2.8 km and 2.8 km, respectively and material was deposited as far as 4 km from the crater. There was a total of 6,983 rockfall events and 189 PDCs that affected the S, SE, and E flanks. The volcano network detected a total of 2,124 volcanic earthquakes. Continuous gas-and-steam emissions rose 200-2,000 m above the crater and drifted in multiple directions. Sulfur dioxide emissions averaged 792-4,113 t/d, the latter of which was measured on 28 July. During 2-4 July three PDCs were generated from the collapse of the lava flow and resulting light brown plumes rose 200-300 m above the crater. Continuous tremor pulses were reported beginning at 1547 on 3 July through 7 July at 1200, at 2300 on 8 July and going through 0300 on 10 July, and at 2300 on 16 July, as recorded by the seismic network. During 6-9 July there were 10 lava flow-collapse-related PDCs that generated light brown plumes 300-500 m above the crater. During 10-11 July light ashfall was reported in some areas of Mabinit, Legazpi City, Budiao and Salvacion, Daraga, and Camalig, Albay. By 18 July the lava flow advanced 600 m on the E flank as well.
During 1733 on 18 July and 0434 on 19 July PHIVOLCS reported 30 “ashing” events, which are degassing events accompanied by audible thunder-like sounds and entrained ash at the crater, which produced short, dark plumes that drifted SW. These events each lasted 20-40 seconds, and plume heights ranged from 150-300 m above the crater, as recorded by seismic, infrasound, visual, and thermal monitors. Three more ashing events occurred during 19-20 July. Short-term observations from electronic tilt and GPS monitoring indicate deflation on the E lower flanks in early July and inflation on the NW middle flanks during the third week of July. Longer-term ground deformation parameters from EDM, precise leveling, continuous GPS, and electronic tilt monitoring indicated that the volcano was still generally inflated relative to baseline levels. A short-lived lava pulse lasted 28 seconds at 1956 on 21 July, which was accompanied by seismic and infrasound signals. By 22 July, the only lava flow that remained active was on the SE flank, and continued to extend 3.4 km, while those on the S and E flanks weakened markedly. One ashing event was detected during 30-31 July, whereas there were 57 detected during 31 July-1 August; according to PHIVOLCS beginning at approximately 1800 on 31 July eruptive activity was dominated by phases of intermittent ashing, as well as increased in the apparent rates of lava effusion from the summit crater. The ashing phases consisted of discrete events recorded as low-frequency volcanic earthquakes (LFVQ) typically 30 seconds in duration, based on seismic and infrasound signals. Gray ash plume rose 100 m above the crater and generally drifted NE. Shortly after these ashing events began, new lava began to effuse rapidly from the crater, feeding the established flowed on the SE, E, and E flanks and generating frequent rockfall events.
Intensified unrest persisted during August. There was a total of 4,141 rockfall events, 2,881 volcanic earthquakes, which included volcanic tremor events, 32 ashing events, and 101 PDCs detected throughout the month. On clear weather days, gas-and-steam emissions rose 300-1,500 m above the crater and drifted in different directions (figure 54). Sulfur dioxide emissions averaged 735-4,756 t/d, the higher value of which was measured on 16 August. During 1-2 August the rate of lava effusion decreased, but continued to feed the flows on the SE, S, and E flanks, maintaining their advances to 3.4 km, 2.8 km, and 1.1 km from the crater, respectively (figure 55). Rockfall and PDCs generated by collapses at the lava flow margins and from the summit dome deposited material within 4 km of the crater. During 3-4 August there were 10 tremor events detected that lasted 1-4 minutes. Short-lived lava pulse lasted 35 seconds and was accompanied by seismic and infrasound signals at 0442 on 6 August. Seven collapses were recorded at the front of the lava flow during 12-14 August.
During September, similar activity of slow lava effusion, PDCs, gas-and-steam emissions, and seismicity continued. There was a total of 4,452 rockfall events, 329 volcanic earthquakes, which included volcanic tremor events, two ashing events, and 85 PDCs recorded throughout the month. On clear weather days, gas-and-steam emissions rose 100-1,500 m above the crater and drifted in multiple directions. Sulfur dioxide emissions averaged 609-2,252 t/d, the higher average of which was measured on 6 September. Slow lava effusion continued advancing on the SE, S, and E flanks, maintaining lengths of 3.4 km, 2.8 km, and 1.1 km, respectively. Rockfall and PDC events generated by collapses along the lava flow margins and at the summit dome deposited material within 4 km of the crater.
Geologic Background. Symmetrical Mayon, which rises above the Albay Gulf NW of Legazpi City, is the most active volcano of the Philippines. The steep upper slopes are capped by a small summit crater. Recorded eruptions since 1616 CE range from Strombolian to basaltic Plinian, with cyclical activity beginning with basaltic eruptions, followed by longer periods of andesitic lava flows. Eruptions occur predominately from the central conduit and have also produced lava flows that travel far down the flanks. Pyroclastic density currents and mudflows have commonly swept down many of the approximately 40 ravines that radiate from the summit and have often damaged populated lowland areas. A violent eruption in 1814 killed more than 1,200 people and devastated several towns.
Information Contacts: Philippine Institute of Volcanology and Seismology (PHIVOLCS), Department of Science and Technology, University of the Philippines Campus, Diliman, Quezon City, Philippines (URL: http://www.phivolcs.dost.gov.ph/); MIROVA (Middle InfraRed Observation of Volcanic Activity), a collaborative project between the Universities of Turin and Florence (Italy) supported by the Centre for Volcanic Risk of the Italian Civil Protection Department (URL: http://www.mirovaweb.it/); Hawai'i Institute of Geophysics and Planetology (HIGP) - MODVOLC Thermal Alerts System, School of Ocean and Earth Science and Technology (SOEST), Univ. of Hawai'i, 2525 Correa Road, Honolulu, HI 96822, USA (URL: http://modis.higp.hawaii.edu/); Copernicus Browser, Copernicus Data Space Ecosystem, European Space Agency (URL: https://dataspace.copernicus.eu/browser/); William Rogers, Legazpi City, Albay Province, Philippines.
Nishinoshima (Japan) — October 2023 Cite this Report
Nishinoshima
Japan
27.247°N, 140.874°E; summit elev. 100 m
All times are local (unless otherwise noted)
Eruption plumes and gas-and-steam plumes during May-August 2023
Nishinoshima, located about 1,000 km S of Tokyo, is a small island in the Ogasawara Arc in Japan. The island is the summit of a massive submarine volcano that has prominent submarine peaks to the S, W, and NE. Eruptions date back to 1973 and the current eruption period began in October 2022. Recent activity has consisted of small ash plumes and fumarolic activity (BGVN 48:07). This report covers activity during May through August 2023, using information from monthly reports of the Japan Meteorological Agency (JMA) monthly reports and satellite data.
Activity during May through June was relatively low. The Japan Coast Guard (JCG) did overflights on 14 and 22 June and reported white gas-and-steam emissions rising 600 m and 1,200 m from the central crater of the pyroclastic cone, respectively (figure 125). In addition, multiple white gas-and-steam emissions rose from the inner rim of the W side of the crater and from the SE flank of the pyroclastic cone. Discolored brown-to-green water was observed around almost the entire perimeter of the island; on 22 June light green discolored water was observed off the S coast of the island.
Observations from the Himawari meteorological satellite confirmed an eruption on 9 and 10 July. An eruption plume rose 1.6 km above the crater and drifted N around 1300 on 9 July. Satellite images acquired at 1420 and 2020 on 9 July and at 0220 on 10 July showed continuing emissions that rose 1.3-1.6 km above the crater and drifted NE and N. The Tokyo VAAC reported that an ash plume seen by a pilot and identified in a satellite image at 0630 on 21 July rose to 3 km altitude and drifted S.
Aerial observations conducted by JCG on 8 August showed a white-and-gray plume rising from the central crater of the pyroclastic cone, and multiple white gas-and-steam emissions were rising from the inner edge of the western crater and along the NW-SE flanks of the island (figure 126). Brown-to-green discolored water was also noted around the perimeter of the island.
Intermittent low-to-moderate power thermal anomalies were recorded in the MIROVA graph (Middle InfraRed Observation of Volcanic Activity), showing an increase in both frequency and power beginning in July (figure 127). This increase in activity coincides with eruptive activity on 9 and 10 July, characterized by eruption plumes. According to the MODVOLC thermal alert algorithm, one thermal hotspot was recorded on 20 July. Weak thermal anomalies were also detected in infrared satellite imagery, accompanied by strong gas-and-steam plumes (figure 128).
Geologic Background. The small island of Nishinoshima was enlarged when several new islands coalesced during an eruption in 1973-74. Multiple eruptions that began in 2013 completely covered the previous exposed surface and continued to enlarge the island. The island is the summit of a massive submarine volcano that has prominent peaks to the S, W, and NE. The summit of the southern cone rises to within 214 m of the ocean surface 9 km SSE.
Information Contacts: Japan Meteorological Agency (JMA), 1-3-4 Otemachi, Chiyoda-ku, Tokyo 100-8122, Japan (URL: http://www.jma.go.jp/jma/indexe.html); Tokyo Volcanic Ash Advisory Center (VAAC), 1-3-4 Otemachi, Chiyoda-ku, Tokyo 100-8122, Japan (URL: http://ds.data.jma.go.jp/svd/vaac/data/); MIROVA (Middle InfraRed Observation of Volcanic Activity), a collaborative project between the Universities of Turin and Florence (Italy) supported by the Centre for Volcanic Risk of the Italian Civil Protection Department (URL: http://www.mirovaweb.it/); Copernicus Browser, Copernicus Data Space Ecosystem, European Space Agency (URL: https://dataspace.copernicus.eu/browser/).
Krakatau (Indonesia) — October 2023 Cite this Report
Krakatau
Indonesia
6.1009°S, 105.4233°E; summit elev. 285 m
All times are local (unless otherwise noted)
White gas-and-steam plumes and occasional ash plumes during May-August 2023
Krakatau is located in the Sunda Strait between Java and Sumatra, Indonesia. Caldera collapse during the catastrophic 1883 eruption destroyed Danan and Perbuwatan cones and left only a remnant of Rakata. The post-collapse cone of Anak Krakatau (Child of Krakatau) was constructed within the 1883 caldera at a point between the former Danan and Perbuwatan cones; it has been the site of frequent eruptions since 1927. The current eruption period began in May 2021 and has recently consisted of Strombolian eruptions and ash plumes (BGVN 48:07). This report describes lower levels of activity consisting of ash and white gas-and-steam plumes during May through August 2023, based on information provided by the Indonesian Center for Volcanology and Geological Hazard Mitigation, referred to as Pusat Vulkanologi dan Mitigasi Bencana Geologi (PVMBG), MAGMA Indonesia, and satellite data.
Activity was relatively low during May and June. Daily white gas-and-steam emissions rose 25-200 m above the crater and drifted in different directions. Five ash plumes were detected at 0519 on 10 May, 1241 on 11 May, 0920 on 12 May, 2320 on 12 May, and at 0710 on 13 May, and rose 1-2.5 km above the crater and drifted SW. A webcam image taken on 12 May showed ejection of incandescent material above the vent. A total of nine ash plumes were detected during 6-11 June: at 1434 and 00220 on 6 and 7 June the ash plumes rose 500 m above the crater and drifted NW, at 1537 on 8 June the ash plume rose 1 km above the crater and drifted SW, at 0746 and at 0846 on 9 June the ash plumes rose 800 m and 3 km above the crater and drifted SW, respectively, at 0423, 1431, and 1750 on 10 June the ash plumes rose 2 km, 1.5 km, and 3.5 km above the crater and drifted NW, respectively, and at 0030 on 11 June an ash plume rose 2 km above the crater and drifted NW. Webcam images taken on 10 and 11 June at 0455 and 0102, respectively, showed incandescent material ejected above the vent. On 19 June an ash plume at 0822 rose 1.5 km above the crater and drifted SE.
Similar low activity of white gas-and-steam emissions and few ash plumes were reported during July and August. Daily white gas-and-steam emissions rose 25-300 m above the crater and drifted in multiple directions. Three ash plumes were reported at 0843, 0851, and 0852 on 20 July that rose 500-2,000 m above the crater and drifted NW.
The MIROVA (Middle InfraRed Observation of Volcanic Activity) graph of MODIS thermal anomaly data showed intermittent low-to-moderate power thermal anomalies during May through August 2023 (figure 140). Although activity was often obscured by weather clouds, a thermal anomaly was visible in an infrared satellite image of the crater on 12 May, accompanied by an eruption plume that drifted SW (figure 141).
Geologic Background. The renowned Krakatau (frequently mis-named as Krakatoa) volcano lies in the Sunda Strait between Java and Sumatra. Collapse of an older edifice, perhaps in 416 or 535 CE, formed a 7-km-wide caldera. Remnants of that volcano are preserved in Verlaten and Lang Islands; subsequently the Rakata, Danan, and Perbuwatan cones were formed, coalescing to create the pre-1883 Krakatau Island. Caldera collapse during the catastrophic 1883 eruption destroyed Danan and Perbuwatan, and left only a remnant of Rakata. This eruption caused more than 36,000 fatalities, most as a result of tsunamis that swept the adjacent coastlines of Sumatra and Java. Pyroclastic surges traveled 40 km across the Sunda Strait and reached the Sumatra coast. After a quiescence of less than a half century, the post-collapse cone of Anak Krakatau (Child of Krakatau) was constructed within the 1883 caldera at a point between the former Danan and Perbuwatan cones. Anak Krakatau has been the site of frequent eruptions since 1927.
Information Contacts: Pusat Vulkanologi dan Mitigasi Bencana Geologi (PVMBG, also known as Indonesian Center for Volcanology and Geological Hazard Mitigation, CVGHM), Jalan Diponegoro 57, Bandung 40122, Indonesia (URL: http://www.vsi.esdm.go.id/); MAGMA Indonesia, Kementerian Energi dan Sumber Daya Mineral (URL: https://magma.esdm.go.id/v1); MIROVA (Middle InfraRed Observation of Volcanic Activity), a collaborative project between the Universities of Turin and Florence (Italy) supported by the Centre for Volcanic Risk of the Italian Civil Protection Department (URL: http://www.mirovaweb.it/); Copernicus Browser, Copernicus Data Space Ecosystem, European Space Agency (URL: https://dataspace.copernicus.eu/browser/).
Villarrica (Chile) — October 2023 Cite this Report
Villarrica
Chile
39.42°S, 71.93°W; summit elev. 2847 m
All times are local (unless otherwise noted)
Strombolian activity, gas-and-ash emissions, and crater incandescence during April-September 2023
Villarrica, in central Chile, consists of a 2-km-wide caldera that formed about 3,500 years ago and is located at the base of the presently active cone at the NW margin of a 6-km-wide caldera. Historical eruptions eruptions date back to 1558 and have been characterized by mild-to-moderate explosive activity with occasional lava effusions. The current eruption period began in December 2014 and has recently consisted of nighttime crater incandescence, ash emissions, and seismicity (BGVN 48:04). This report covers activity during April through September 2023 and describes occasional Strombolian activity, gas-and-ash emissions, and nighttime crater incandescence. Information for this report primarily comes from the Southern Andes Volcano Observatory (Observatorio Volcanológico de Los Andes del Sur, OVDAS), part of Chile's National Service of Geology and Mining (Servicio Nacional de Geología y Minería, SERNAGEOMIN) and satellite data.
Seismicity during April consisted of long period (LP) events and tremor (TRE); a total of 9,413 LP-type events and 759 TR-type events were detected throughout the month. Nighttime crater incandescence persisted and was visible in the degassing column. Sulfur dioxide data was obtained using Differential Absorption Optical Spectroscopy Equipment (DOAS) that showed an average value of 1,450 ± 198 tons per day (t/d) during 1-15 April and 1,129 ± 201 t/d during 16-30 April, with a maximum daily value of 2,784 t/d on 9 April. Gas-and-steam emissions of variable intensities rose above the active crater as high as 1.3 km above the crater on 13 April. Strombolian explosions were not observed and there was a slight decrease in the lava lake level.
There were 14,123 LP-type events and 727 TR-type events detected during May. According to sulfur dioxide measurements taken with DOAS equipment, the active crater emitted an average value of 1,826 ± 482 t/d during 1-15 May and 912 ± 41 t/d during 16-30 May, with a daily maximum value of 5,155 t/d on 13 May. Surveillance cameras showed continuous white gas-and-steam emissions that rose as high as 430 m above the crater on 27 May. Nighttime incandescence illuminated the gas column less than 300 m above the crater rim was and no pyroclastic emissions were reported. A landslide was identified on 13 May on the E flank of the volcano 50 m from the crater rim and extending 300 m away; SERNAGEOMIN noted that this event may have occurred on 12 May. During the morning of 27 and 28 May minor Strombolian explosions characterized by incandescent ejecta were recorded at the crater rim; the last reported Strombolian explosions had occurred at the end of March.
Seismic activity during June consisted of five volcano-tectonic (VT)-type events, 21,606 LP-type events, and 2,085 TR-type events. The average value of sulfur dioxide flux obtained by DOAS equipment was 1,420 ± 217 t/d during 1-15 June and 2,562 ± 804 t/d, with a maximum daily value of 4,810 t/d on 17 June. White gas-and-steam emissions rose less than 480 m above the crater; frequent nighttime crater incandescence was reflected in the degassing plume. On 12 June an emission rose 100 m above the crater and drifted NNW. On 15 June one or several emissions resulted in ashfall to the NE as far as 5.5 km from the crater, based on a Skysat satellite image. Several Strombolian explosions occurred within the crater; activity on 15 June was higher energy and ejected blocks 200-300 m on the NE slope. Surveillance cameras showed white gas-and-steam emissions rising 480 m above the crater on 16 June. On 19 and 24 June low-intensity Strombolian activity was observed, ejecting material as far as 200 m from the center of the crater to the E.
During July, seismicity included 29,319 LP-type events, 3,736 TR-type events, and two VT-type events. DOAS equipment recorded two days of sulfur dioxide emissions of 4,220 t/d and 1,009 t/d on 1 and 13 July, respectively. Constant nighttime incandescence was also recorded and was particularly noticeable when accompanied by eruptive columns on 12 and 16 July. Minor explosive events were detected in the crater. According to Skysat satellite images taken on 12, 13, and 16 July, ashfall deposits were identified 155 m S of the crater. According to POVI, incandescence was visible from two vents on the crater floor around 0336 on 12 July. Gas-and-ash emissions rose as high as 1.2 km above the crater on 13 July and drifted E and NW. A series of gas-and-steam pulses containing some ash deposited material on the upper E flank around 1551 on 13 July. During 16-31 July, average sulfur dioxide emissions of 1,679 ± 406 t/d were recorded, with a maximum daily value of 2,343 t/d on 28 July. Fine ash emissions were also reported on 16, 17, and 23 July.
Seismicity persisted during August, characterized by 27,011 LP-type events, 3,323 TR-type events, and three VT-type events. The average value of sulfur dioxide measurements taken during 1-15 August was 1,642 ± 270 t/d and 2,207 ± 4,549 t/d during 16-31 August, with a maximum daily value of 3,294 t/d on 27 August. Nighttime crater incandescence remained visible in degassing columns. White gas-and-steam emissions rose 480 m above the crater on 6 August. According to a Skysat satellite image from 6 August, ash accumulation was observed proximal to the crater and was mainly distributed toward the E slope. White gas-and-steam emissions rose 320 m above the crater on 26 August. Nighttime incandescence and Strombolian activity that generated ash emissions were reported on 27 August.
Seismicity during September was characterized by five VT-type events, 12,057 LP-type events, and 2,058 TR-type events. Nighttime incandescence persisted. On 2 September an ash emission rose 180 m above the crater and drifted SE at 1643 (figure 125) and a white gas-and-steam plume rose 320 m above the crater. According to the Buenos Aires VAAC, periods of continuous gas-and-ash emissions were visible in webcam images from 1830 on 2 September to 0110 on 3 September. Strombolian activity was observed on 2 September and during the early morning of 3 September, the latter event of which generated an ash emission that rose 60 m above the crater and drifted 100 m from the center of the crater to the NE and SW. Ashfall was reported to the SE and S as far as 750 m from the crater. The lava lake was active during 3-4 September and lava fountaining was visible for the first time since 26 March 2023, according to POVI. Fountains captured in webcam images at 2133 on 3 September and at 0054 on 4 September rose as high as 60 m above the crater rim and ejected material onto the upper W flank. Sulfur dioxide flux of 1,730 t/d and 1,281 t/d was measured on 3 and 4 September, respectively, according to data obtained by DOAS equipment.
Strong Strombolian activity and larger gas-and-ash plumes were reported during 18-20 September. On 18 September activity was also associated with energetic LP-type events and notable sulfur dioxide fluxes (as high as 4,277 t/d). On 19 September Strombolian activity and incandescence were observed. On 20 September at 0914 ash emissions rose 50 m above the crater and drifted SSE, accompanied by Strombolian activity that ejected material less than 100 m SSE, causing fall deposits on that respective flank. SERNAGEOMIN reported that a Planet Scope satellite image taken on 20 September showed the lava lake in the crater, measuring 32 m x 35 m and an area of 0.001 km2. Several ash emissions were recorded at 0841, 0910, 1251, 1306, 1312, 1315, and 1324 on 23 September and rose less than 150 m above the crater. The sulfur dioxide flux value was 698 t/d on 23 September and 1,097 t/d on 24 September. On 24 September the Volcanic Alert Level (VAL) was raised to Orange (the third level on a four-color scale). SENAPRED maintained the Alert Level at Yellow (the middle level on a three-color scale) for the communities of Villarrica, Pucón (16 km N), Curarrehue, and Panguipulli.
During 24-25 September there was an increase in seismic energy (observed at TR-events) and acoustic signals, characterized by 1 VT-type event, 213 LP-type events, and 124 TR-type events. Mainly white gas-and-steam emissions, in addition to occasional fine ash emissions were recorded. During the early morning of 25 September Strombolian explosions were reported and ejected material 250 m in all directions, though dominantly toward the NW. On 25 September the average value of sulfur dioxide flux was 760 t/d. Seismicity during 25-30 September consisted of five VT-type events, 1,937 LP-type events, and 456 TR-type events.
During 25-29 September moderate Strombolian activity was observed and ejected material as far as the crater rim. In addition, ash pulses lasting roughly 50 minutes were observed around 0700 and dispersed ENE. During 26-27 September a TR episode lasted 6.5 hours and was accompanied by discrete acoustic signals. Satellite images from 26 September showed a spatter cone on the crater floor with one vent that measured 10 x 14 m and a smaller vent about 35 m NE of the cone. SERNAGEOMIN reported an abundant number of bomb-sized blocks up to 150 m from the crater, as well as impact marks on the snow, which indicated explosive activity. A low-altitude ash emission was observed drifting NW around 1140 on 28 September, based on webcam images. Between 0620 and 0850 on 29 September an ash emission rose 60 m above the crater and drifted NW. During an overflight taken around 1000 on 29 September scientists observed molten material in the vent, a large accumulation of pyroclasts inside the crater, and energetic degassing, some of which contained a small amount of ash. Block-sized pyroclasts were deposited on the internal walls and near the crater, and a distal ash deposit was also visible. The average sulfur dioxide flux measured on 28 September was 344 t/d. Satellite images taken on 29 September ashfall was deposited roughly 3 km WNW from the crater and nighttime crater incandescence remained visible. The average sulfur dioxide flux value from 29 September was 199 t/d. On 30 September at 0740 a pulsating ash emission rose 1.1 km above the crater and drifted NNW (figure 126). Deposits on the S flank extended as far as 4.5 km from the crater rim, based on satellite images from 30 September.
Infrared MODIS satellite data processed by MIROVA (Middle InfraRed Observation of Volcanic Activity) showed intermittent thermal activity during April through September, with slightly stronger activity detected during late September (figure 127). Small clusters of thermal activity were detected during mid-June, early July, early August, and late September. According to the MODVOLC thermal alert system, a total of four thermal hotspots were detected on 7 July and 3 and 23 September. This activity was also intermittently captured in infrared satellite imagery on clear weather days (figure 128).
Geologic Background. The glacier-covered Villarrica stratovolcano, in the northern Lakes District of central Chile, is ~15 km south of the city of Pucon. A 2-km-wide caldera that formed about 3,500 years ago is located at the base of the presently active, dominantly basaltic to basaltic andesite cone at the NW margin of a 6-km-wide Pleistocene caldera. More than 30 scoria cones and fissure vents are present on the flanks. Plinian eruptions and pyroclastic flows that have extended up to 20 km from the volcano were produced during the Holocene. Lava flows up to 18 km long have issued from summit and flank vents. Eruptions documented since 1558 CE have consisted largely of mild-to-moderate explosive activity with occasional lava effusion. Glaciers cover 40 km2 of the volcano, and lahars have damaged towns on its flanks.
Information Contacts: Servicio Nacional de Geología y Minería (SERNAGEOMIN), Observatorio Volcanológico de Los Andes del Sur (OVDAS), Avda Sta María No. 0104, Santiago, Chile (URL: http://www.sernageomin.cl/); Proyecto Observación Villarrica Internet (POVI) (URL: http://www.povi.cl/); Sistema y Servicio Nacional de Prevención y Repuesta Ante Desastres (SENAPRED), Av. Beauchef 1671, Santiago, Chile (URL: https://web.senapred.cl/); Buenos Aires Volcanic Ash Advisory Center (VAAC), Servicio Meteorológico Nacional-Fuerza Aérea Argentina, 25 de mayo 658, Buenos Aires, Argentina (URL: http://www.smn.gov.ar/vaac/buenosaires/inicio.php); MIROVA (Middle InfraRed Observation of Volcanic Activity), a collaborative project between the Universities of Turin and Florence (Italy) supported by the Centre for Volcanic Risk of the Italian Civil Protection Department (URL: http://www.mirovaweb.it/); Hawai'i Institute of Geophysics and Planetology (HIGP) - MODVOLC Thermal Alerts System, School of Ocean and Earth Science and Technology (SOEST), Univ. of Hawai'i, 2525 Correa Road, Honolulu, HI 96822, USA (URL: http://modis.higp.hawaii.edu/); Copernicus Browser, Copernicus Data Space Ecosystem, European Space Agency (URL: https://dataspace.copernicus.eu/browser/).
Merapi (Indonesia) — October 2023 Cite this Report
Merapi
Indonesia
7.54°S, 110.446°E; summit elev. 2910 m
All times are local (unless otherwise noted)
Frequent incandescent avalanches during April-September 2023
Merapi, located just north of the major city of Yogyakarta in central Java, Indonesia, has had activity within the last 20 years characterized by pyroclastic flows and lahars accompanying growth and collapse of the steep-sided active summit lava dome. The current eruption period began in late December 2020 and has more recently consisted of ash plumes, intermittent incandescent avalanches of material, and pyroclastic flows (BGVN 48:04). This report covers activity during April through September 2023, based on information from Balai Penyelidikan dan Pengembangan Teknologi Kebencanaan Geologi (BPPTKG), the Center for Research and Development of Geological Disaster Technology, a branch of PVMBG which specifically monitors Merapi. Additional information comes from the Pusat Vulkanologi dan Mitigasi Bencana Geologi (PVMBG, also known as Indonesian Center for Volcanology and Geological Hazard Mitigation, CVGHM), MAGMA Indonesia, the Darwin Volcanic Ash Advisory Centre (VAAC), and various satellite data.
Activity during April through September 2023 primarily consisted of incandescent avalanches of material that mainly affected the SW and W flanks and traveled as far as 2.3 km from the summit (table 25) and white gas-and-steam emissions that rose 10-1,000 m above the crater.
Table 25. Monthly summary of avalanches and avalanche distances recorded at Merapi during April through September 2023. The number of reported avalanches does not include instances where possible avalanches were heard but could not be visually confirmed as a result of inclement weather. Data courtesy of BPPTKG (April-September 2023 daily reports).
| Month |
Average number of avalanches per day |
Distance avalanches traveled (m) |
| Apr 2023 |
19 |
1,200-2,000 |
| May 2023 |
22 |
500-2,000 |
| Jun 2023 |
18 |
1,200-2,000 |
| Jul 2023 |
30 |
300-2,000 |
| Aug 2023 |
25 |
400-2,300 |
| Sep 2023 |
23 |
600-2,000 |
BPPTKG reported that during April and May white gas-and-steam emissions rose 10-750 m above the crater, incandescent avalanches descended 500-2,000 m on the SW and W flanks (figure 135). Cloudy weather often prevented clear views of the summit, and sometimes avalanches could not be confirmed. According to a webcam image, a pyroclastic flow was visible on 17 April at 0531. During the week of 28 April and 4 May a pyroclastic flow was reported on the SW flank, traveling up to 2.5 km. According to a drone overflight taken on 17 May the SW lava dome volume was an estimated 2,372,800 cubic meters and the dome in the main crater was an estimated 2,337,300 cubic meters.
During June and July similar activity persisted with white gas-and-steam emissions rising 10-350 m above the crater and frequent incandescent avalanches that traveled 300-2,000 m down the SW, W, and S flanks (figure 136). Based on an analysis of aerial photos taken on 24 June the volume of the SW lava dome was approximately 2.5 million cubic meters. A pyroclastic flow was observed on 5 July that traveled 2.7 km on the SW flank. According to the Darwin VAAC multiple minor ash plumes were identified in satellite images on 19 July that rose to 3.7 km altitude and drifted S and SW. During 22, 25, and 26 July a total of 17 avalanches descended as far as 1.8 km on the S flank.
Frequent white gas-and-steam emissions continued during August and September, rising 10-450 m above the crater. Incandescent avalanches mainly affected the SW and W flanks and traveled 400-2,300 m from the vent (figure 137). An aerial survey conducted on 10 August was analyzed and reported that estimates of the SW dome volume was 2,764,300 cubic meters and the dome in the main crater was 2,369,800 cubic meters.
Frequent and moderate-power thermal activity continued throughout the reporting period, according to a MIROVA (Middle InfraRed Observation of Volcanic Activity) analysis of MODIS satellite data (figure 138). There was an increase in the number of detected anomalies during mid-May. The MODVOLC thermal algorithm recorded a total of 47 thermal hotspots: six during April, nine during May, eight during June, 15 during July, four during August, and five during September. Some of this activity was captured in infrared satellite imagery on clear weather days, sometimes accompanied by incandescent material on the SW flank (figure 139).
Geologic Background. Merapi, one of Indonesia's most active volcanoes, lies in one of the world's most densely populated areas and dominates the landscape immediately north of the major city of Yogyakarta. It is the youngest and southernmost of a volcanic chain extending NNW to Ungaran volcano. Growth of Old Merapi during the Pleistocene ended with major edifice collapse perhaps about 2,000 years ago, leaving a large arcuate scarp cutting the eroded older Batulawang volcano. Subsequent growth of the steep-sided Young Merapi edifice, its upper part unvegetated due to frequent activity, began SW of the earlier collapse scarp. Pyroclastic flows and lahars accompanying growth and collapse of the steep-sided active summit lava dome have devastated cultivated lands on the western-to-southern flanks and caused many fatalities.
Information Contacts: Balai Penyelidikan dan Pengembangan Teknologi Kebencanaan Geologi (BPPTKG), Center for Research and Development of Geological Disaster Technology (URL: http://merapi.bgl.esdm.go.id/, Twitter: @BPPTKG); MAGMA Indonesia, Kementerian Energi dan Sumber Daya Mineral (URL: https://magma.esdm.go.id/v1); Pusat Vulkanologi dan Mitigasi Bencana Geologi (PVMBG, also known as Indonesian Center for Volcanology and Geological Hazard Mitigation, CVGHM), Jalan Diponegoro 57, Bandung 40122, Indonesia (URL: http://www.vsi.esdm.go.id/); Darwin Volcanic Ash Advisory Centre (VAAC), Bureau of Meteorology, Northern Territory Regional Office, PO Box 40050, Casuarina, NT 0811, Australia (URL: http://www.bom.gov.au/info/vaac/); MIROVA (Middle InfraRed Observation of Volcanic Activity), a collaborative project between the Universities of Turin and Florence (Italy) supported by the Centre for Volcanic Risk of the Italian Civil Protection Department (URL: http://www.mirovaweb.it/); Hawai'i Institute of Geophysics and Planetology (HIGP) - MODVOLC Thermal Alerts System, School of Ocean and Earth Science and Technology (SOEST), Univ. of Hawai'i, 2525 Correa Road, Honolulu, HI 96822, USA (URL: http://modis.higp.hawaii.edu/); Copernicus Browser, Copernicus Data Space Ecosystem, European Space Agency (URL: https://dataspace.copernicus.eu/browser/); Øystein Lund Andersen (URL: https://www.oysteinlundandersen.com/, https://twitter.com/oysteinvolcano).
Ebeko
Russia
50.686°N, 156.014°E; summit elev. 1103 m
All times are local (unless otherwise noted)
Moderate explosive activity with ash plumes continued during June-November 2023
Ebeko, located on the N end of Paramushir Island in Russia’s Kuril Islands just S of the Kamchatka Peninsula, consists of three summit craters along a SSW-NNE line at the northern end of a complex of five volcanic cones. Observed eruptions date back to the late 18th century and have been characterized as small-to-moderate explosions from the summit crater, accompanied by intense fumarolic activity. The current eruptive period began in June 2022, consisting of frequent explosions, ash plumes, and thermal activity (BGVN 47:10, 48:06). This report covers similar activity during June-November 2023, based on information from the Kamchatka Volcanic Eruptions Response Team (KVERT) and satellite data.
Moderate explosive activity continued during June-November 2023 (figures 50 and 51). According to visual data from Severo-Kurilsk, explosions sent ash 2-3.5 km above the summit (3-4.5 km altitude) during most days during June through mid-September. Activity after mid-September was slightly weaker, with ash usually reaching less than 2 km above the summit. According to KVERT the volcano in October and November was, with a few exceptions, either quiet or obscured by clouds that prevented satellite observations. KVERT issued Volcano Observatory Notices for Aviation (VONA) on 8 and 12 June, 13 and 22 July, 3 and 21 August, and 31 October warning of potential aviation hazards from ash plumes drifting 3-15 km from the volcano. Based on satellite data, KVERT reported a persistent thermal anomaly whenever weather clouds permitted viewing.
Geologic Background. The flat-topped summit of the central cone of Ebeko volcano, one of the most active in the Kuril Islands, occupies the northern end of Paramushir Island. Three summit craters located along a SSW-NNE line form Ebeko volcano proper, at the northern end of a complex of five volcanic cones. Blocky lava flows extend west from Ebeko and SE from the neighboring Nezametnyi cone. The eastern part of the southern crater contains strong solfataras and a large boiling spring. The central crater is filled by a lake about 20 m deep whose shores are lined with steaming solfataras; the northern crater lies across a narrow, low barrier from the central crater and contains a small, cold crescentic lake. Historical activity, recorded since the late-18th century, has been restricted to small-to-moderate explosive eruptions from the summit craters. Intense fumarolic activity occurs in the summit craters, on the outer flanks of the cone, and in lateral explosion craters.
Information Contacts: Kamchatka Volcanic Eruptions Response Team (KVERT), Far Eastern Branch, Russian Academy of Sciences, 9 Piip Blvd., Petropavlovsk-Kamchatsky, 683006, Russia (URL: http://www.kscnet.ru/ivs/kvert/).
Search Bulletin Archive by Publication Date
Select a month and year from the drop-downs and click "Show Issue" to have that issue displayed in this tab.
The default month and year is the latest issue available.
Bulletin of the Global Volcanism Network - Volume 22, Number 01 (January 1997)
Managing Editor: Richard Wunderman
Aira (Japan)
Four explosive eruptions from Minami-dake in December and January
Akan (Japan)
New fumaroles; eruptive pause continues in December 1996
Atmospheric Effects (1995-2001) (Unknown)
Lidar data from Hampton, Virginia, USA
Fukutoku-Oka-no-Ba (Japan)
Submarine venting continues to discolor seawater
Irazu (Costa Rica)
Minor seismicity; no significant tilt in late 1996
Irruputuncu (Chile-Bolivia)
Minor, late-1995 eruption; the first unambiguous modern report
Kavachi (Solomon Islands)
Submarine ejection of mud and hot ash; plumes rise to 2.1 km
Kilauea (United States)
New, short-lived eruptive episode (54) in Napau Crater; Pu`u `O`o pauses
Kujusan (Japan)
Increased seismic activity in January
Langila (Papua New Guinea)
Small January plumes; February plumes reach 11 km altitude
Manam (Papua New Guinea)
Larger outburst on 11 February follows mild January activity
McDonald Islands (Australia)
Apparent volcanic plume sighted on 5 January
Okmok (United States)
Eruption begins on 13 February from crater along S caldera rim
Pavlof (United States)
Pause in eruptive activity, but continued small intermittent steam plumes
Rabaul (Papua New Guinea)
Large gas fireball, Strombolian eruptions, and lava flows
Rincon de la Vieja (Costa Rica)
Sulfur-bearing steam, mass wasting, and acid rain in September
Soufriere Hills (United Kingdom)
Ongoing dome growth, pyroclastic flows, and crack dilation
Suwanosejima (Japan)
Weak ash emission and rumbling in late December
Aira
Japan
31.5772°N, 130.6589°E; summit elev. 1117 m
All times are local (unless otherwise noted)
Four explosive eruptions from Minami-dake in December and January
During December and January, Minami-dake crater had six eruptions (four explosive). At a seismic station 2.3 km NW of Minami-dake crater, 342 earthquakes and 14 tremors were recorded in December, and 257 earthquakes and 18 tremors were recorded in January. The highest plume in December rose to a height of 2,700 m. The monthly ashfall measured at the Kagoshima Local Meteorological Observatory (KMO), 10 km W from the crater, was 14 g/m2.
On 14 December, bombs and lapilli were ejected and deposited on the flanks. A small quantity of ashfall was observed at Aburatsu and Miyako-no-jo. During the eruption, 14 lightning strikes occurred during a 10-second interval. January's only eruption produced <1 g/m2 of ashfall at KMO.
Geologic Background. The Aira caldera in the northern half of Kagoshima Bay contains the post-caldera Sakurajima volcano, one of Japan's most active. Eruption of the voluminous Ito pyroclastic flow accompanied formation of the 17 x 23 km caldera about 22,000 years ago. The smaller Wakamiko caldera was formed during the early Holocene in the NE corner of the caldera, along with several post-caldera cones. The construction of Sakurajima began about 13,000 years ago on the southern rim and built an island that was joined to the Osumi Peninsula during the major explosive and effusive eruption of 1914. Activity at the Kitadake summit cone ended about 4,850 years ago, after which eruptions took place at Minamidake. Frequent eruptions since the 8th century have deposited ash on the city of Kagoshima, located across Kagoshima Bay only 8 km from the summit. The largest recorded eruption took place during 1471-76.
Information Contacts: Volcanological Division, Japan Meteorological Agency (JMA), 1-3-4 Ote-machi, Chiyoda-ku, Tokyo 100, Japan.
Akan
Japan
43.384°N, 144.013°E; summit elev. 1499 m
All times are local (unless otherwise noted)
New fumaroles; eruptive pause continues in December 1996
According to observations from a helicopter on 12 and 19 December, fumes from a new vent were very active. Weak fumes were also observed from two new fumaroles in Crater 3 and Crater 4. In total, 137 earthquakes were recorded in December, but there were no volcanic tremors.
Geologic Background. Akan is a 13 x 24 km caldera located immediately SW of Kussharo caldera. The elongated, irregular outline of the caldera rim reflects its incremental formation during major explosive eruptions from the early to mid-Pleistocene. Growth of four post-caldera stratovolcanoes, three at the SW end of the caldera and the other at the NE side, has restricted the size of the caldera lake. Conical Oakandake was frequently active during the Holocene. The 1-km-wide Nakamachineshiri crater of Meakandake was formed during a major pumice-and-scoria eruption about 13,500 years ago. Within the Akan volcanic complex, only the Meakandake group, east of Lake Akan, has been historically active, producing mild phreatic eruptions since the beginning of the 19th century. Meakandake is composed of nine overlapping cones. The main cone of Meakandake proper has a triple crater at its summit. Historical eruptions at Meakandake have consisted of minor phreatic explosions, but four major magmatic eruptions including pyroclastic flows have occurred during the Holocene.
Information Contacts: Volcanological Division, Japan Meteorological Agency (JMA), 1-3-4 Ote-machi, Chiyoda-ku, Tokyo 100, Japan.
Atmospheric Effects (1995-2001) (Unknown) — January 1997 Cite this Report
Atmospheric Effects (1995-2001)
Unknown
Unknown, Unknown; summit elev. m
All times are local (unless otherwise noted)
Lidar data from Hampton, Virginia, USA
Table 9 lists the 48-inch lidar measurements at 0.69 µm taken with a ruby laser in Hampton, Virginia (37.1°N, 76.3°W). An aerosol layer peak was located in the range 13-31 km altitude during early October; lidar backscatter ratios varied between 1.13 and 1.21.
Table 9. Lidar data from Virginia, USA, showing altitudes of aerosol layers. Backscattering ratio are for the ruby wavelength of 0.69 µm. Integrated values show total backscatter, expressed in steradians-1, integrated over 300-m intervals from the tropopause to 30 km.
| DATE |
LAYER ALTITUDE (km) (peak) |
BACKSCATTERING RATIO |
BACKSCATTERING INTEGRATED |
| Hampton, Virginia (37.1°N, 76.3°W) |
| 10 Oct 1996 |
14-29 (15.5) |
1.15 |
4.94 x 10⁻⁵ |
| 31 Oct 1996 |
15-31 (27.5) |
1.13 |
4.45 x 10⁻⁵ |
| 03 Dec 1996 |
12-30 (22.3) |
1.16 |
5.58 x 10⁻⁵ |
| 01 Jan 1997 |
14-28 (21.1) |
1.21 |
7.34 x 10⁻⁵ |
| 22 Jan 1997 |
13-28 (21.2) |
1.19 |
6.41 x 10⁻⁵ |
Geologic Background. The enormous aerosol cloud from the March-April 1982 eruption of Mexico''s El Chichón persisted for years in the stratosphere, and led to the Atmospheric Effects section becoming a regular feature of the Bulletin thorugh 1989. Lidar data and other atmospheric observations were again published intermittently between 1995 and 2001; those reports are included here.
Information Contacts: Mary Osborn, NASA Langley Research Center (LaRC), Hampton VA 23665, USA.
Fukutoku-Oka-no-Ba (Japan) — January 1997 Cite this Report
Fukutoku-Oka-no-Ba
Japan
24.285°N, 141.481°E; summit elev. -29 m
All times are local (unless otherwise noted)
Submarine venting continues to discolor seawater
On 12 December, a Japan Maritime Safety Agency aviator reported yellow-green discoloration of seawater at Fukutoku-Okanoba over a 50 x 200 m area. On 27 January, pale green discoloration was seen by an aviator of the Japan Maritime Safety Agency covering an area of 2,000 x 100 m.
Geologic Background. Fukutoku-Oka-no-ba is a submarine volcano located 5 km NE of the island of Minami-Ioto. Water discoloration is frequently observed, and several ephemeral islands have formed in the 20th century. The first of these formed Shin-Ioto ("New Sulfur Island") in 1904, and the most recent island was formed in 1986. The volcano is part of an elongated edifice with two major topographic highs trending NNW-SSE, and is a trachyandesitic volcano geochemically similar to Ioto.
Information Contacts: Volcanological Division, Japan Meteorological Agency (JMA), 1-3-4 Ote-machi, Chiyoda-ku, Tokyo 100, Japan.
Irazu (Costa Rica) — January 1997 Cite this Report
Irazu
Costa Rica
9.979°N, 83.852°W; summit elev. 3436 m
All times are local (unless otherwise noted)
Minor seismicity; no significant tilt in late 1996
Situated 5 km SW of the crater, the local seismic station (IRZ2) registered 18 local events during September 1995. Although a survey of the tilt network that extends 3.5 km S of the crater has detected no significant tilt since 1994, three of five electronic inclinometers measured an average tilt of 5.6 µrad/year since 1994 (figure 10).
Geologic Background. The massive Irazú volcano in Costa Rica, immediately E of the capital city of San José, covers an area of 500 km2 and is vegetated to within a few hundred meters of its broad summit crater complex. At least 10 satellitic cones are located on its S flank. No lava effusion is known since the eruption of the Cervantes lava flows from S-flank vents about 14,000 years ago, and all known Holocene eruptions have been explosive. The focus of eruptions at the summit crater complex has migrated to the W towards the main crater, which contains a small lake. The first well-documented eruption occurred in 1723, and frequent explosive eruptions have occurred since. Ashfall from the last major eruption during 1963-65 caused significant disruption to San José and surrounding areas. Phreatic activity reported in 1994 may have been a landslide event from the fumarolic area on the NW summit (Fallas et al., 2018).
Information Contacts: E. Fernández, E. Duarte, V. Barboza, R. Van der Laat, E. Hernandez, M. Martinez, and R. Sáenz, Observatorio Vulcanológico y Sismológico de Costa Rica, Universidad Nacional (OVSICORI-UNA), Apartado 86-3000, Heredia, Costa Rica.
Irruputuncu (Chile-Bolivia) — January 1997 Cite this Report
Irruputuncu
Chile-Bolivia
20.73°S, 68.55°W; summit elev. 5163 m
All times are local (unless otherwise noted)
Minor, late-1995 eruption; the first unambiguous modern report
In the course of field work on volcanic rocks in the region, Anita Grunder observed a dark, vertical plume coming from the top of Irruputuncu at about 1000 on 26 November 1995. This dark plume lasted a few minutes, then returned to a white plume, and then again became dark and returned to white. The dark plume was dark gray to black and of the same puffy form as the white plume. The plumes dispersed very slowly to the E and the column height was same whether black or white. It was hard to judge the column size, but it seemed perhaps a few times the relief of the volcano suggesting they were kilometers tall. Grunder's field assistant, Maximino Burotto Huerta, said he had seen similar behavior on 1 September. Ordinarily, either a white wisp of steam or nothing is seen emanating from the peak. The sighting on 26 November was from ~30 km SSE, not far from the village of Ujina.
Grunder was in the area for 31 days between 24 August and 5 December 1995, though typically not in sight of the volcano. She observed no plumes on 27 November and 1-5 December 1995. These observations suggested that the activity consisted of modest phreatic eruptions.
Available literature lacks clear documentation of any historical Irruputuncu eruptions. The stratovolcano was the subject of unconfirmed press reports of an eruption in December 1989, but when visited by a state geologist on 25 March 1990 he found only fumarolic activity (BGVN 15:03). Irruputuncu sits within the collapse scarp related to a Holocene debris avalanche. There are two summit craters, the southernmost of which has been fumarolically active.
Geologic Background. Irruputuncu is a small stratovolcano that straddles the Chile/Bolivia border. It is the youngest and most southerly of a NE-SW-trending chain of volcanoes. It was constructed within the collapse scarp of a Holocene debris avalanche whose deposit extends to the SW. Subsequent eruptions filled much of this scarp and produced thick, viscous lava flows down the W flank. The summit complex contains two craters, the southernmost of which is fumarolically active. The first unambiguous historical eruption took place in November 1995, when phreatic explosions produced dark ash clouds.
Information Contacts: Anita Grunder, Department of Geosciences, 104 Wilkinson Hall, Oregon State University, Corvallis OR 97331, USA.
Kavachi (Solomon Islands) — January 1997 Cite this Report
Kavachi
Solomon Islands
8.991°S, 157.979°E; summit elev. -20 m
All times are local (unless otherwise noted)
Submarine ejection of mud and hot ash; plumes rise to 2.1 km
On 16 January a Solair pilot reported continuous ejection of mud and hot ash up to 2,100 m altitude. When the pilot returned on 17 January, the eruption was continuing with intermittent plumes reaching similar heights. On 29 January the sea water near the volcano was discolored and dirty, however, there were no reports of eruptive activity.
Kavachi is a basaltic to andesitic shallow submarine volcano. It has produced ephemeral islands at least nine times since its first recorded eruption in 1939. The last record of eruptive activity was in May 1991 (see BGVN 16:07).
Geologic Background. Named for a sea-god of the Gatokae and Vangunu peoples, Kavachi is located in the Solomon Islands south of Vangunu Island. Sometimes referred to as Rejo te Kvachi ("Kavachi's Oven"), this shallow submarine basaltic-to-andesitic volcano has produced ephemeral islands up to 1 km long many times since its first recorded eruption during 1939. Residents of the nearby islands of Vanguna and Nggatokae (Gatokae) reported "fire on the water" prior to 1939, a possible reference to earlier eruptions. The roughly conical edifice rises from water depths of 1.1-1.2 km on the north and greater depths to the SE. Frequent shallow submarine and occasional subaerial eruptions produce phreatomagmatic explosions that eject steam, ash, and incandescent bombs. On a number of occasions lava flows were observed on the ephemeral islands.
Information Contacts: Alison K. Papabatu, Ministry of Energy, Water and Mineral Resources, Solomon Islands.
Kilauea (United States) — January 1997 Cite this Report
Kilauea
United States
19.421°N, 155.287°W; summit elev. 1222 m
All times are local (unless otherwise noted)
New, short-lived eruptive episode (54) in Napau Crater; Pu`u `O`o pauses
During December and most of January, the dynamics of eruptive activity along the east rift zone continued without significant change; however, there were two prominent changes in landforms. On 2 December the coastal bench collapsed, removing 0.1 km2 of shoreline bench and 0.03 km2 of existing land that created a crescent-shaped embayment nearly 900 m long with widths up to 100 m. New lava continued to travel from a vent on the W flank of the Pu`u `O`o cinder cone through a 10-km-long network of lava tubes to the ocean entry at Lae'apuki (figure 103), quickly building a new subaerial bench in the W half of the embayment.
The large collapse pits, including the "Great Pit" and the episode-51 collapse pit that previously pocked the W side of the Pu`u `O`o cone, enlarged into a single pit during a sequence of slope failures. Rockfalls at the cone were recorded during the 14-hour period from 1347 on 8 December until about 0400 on 9 December. The pit was elongate in a N60°E direction and was aligned with fissures on the E rift zone in that area. Blocks continued to spall off, creating plumes that covered the W and S side of the cone with red rock dust. The summit crater to the E remained intact and the level of the lava pond remained 80-90 m below the crater rim.
Around 0243 on 30 January a new eruptive episode began, designated episode 54 by the Hawaiian Volcano Observatory. Three fissures formed within and just E of Napau Crater ~3 km up-rift from Pu`u `O`o. Lava fountains from the fissures reached tens of meters in height. By 0716 all three fissures stopped emitting lava but continued spattering intermittently. The lava flows generated during this phase covered ~190,000 m2 (figure 104, A and C).
The eruption continued as two new fissures formed at about 1239 and 1639 E of Napau Crater. These fissures emitted lava flows that covered ~58,700 m2 before fountaining ended around 1840 (figure 104, D and E). Fountaining resumed from a new fissure on the W rim of Napau crater at about 0033 on 31 January. Lava emitted from this fissure covered ~10,000 m2 (figure 104, F).
In total, six fissures emitted more than 300,000 m3 of lava within 24 hours, covering ~258,700 m2 of mostly unvegetated land. A series of intense seismic tremors preceded the eruption, the largest of which were felt at the summit and measured M 3.3 at 2336 on 28 January and 0300 and 0710 on 29 January. More than 30,000 shallow long-period summit earthquakes (high of 5,400 on 2 February) and over 3,000 shallow east rift events were counted during the eruption. Harmonic tremor was recorded near the eruption site for ~7.5 hours and was accompanied by summit deflation (17 µrads). Deflation throughout the eruptive episode totaled ~30 µrads.
Following the eruption, activity at the Pu`u `O`o cinder cone paused. The summit and west side of the cone were removed by collapse, the lava lake drained, and the crater floor dropped an estimated 100 m to a depth of ~250 m below the crater rim (~60 m below the pre-1983 surface). The collapse generated a red dust plume ~800 m high. Lava stopped flowing through the lava tube down-slope from the vent, and the ocean entry produced only intermittent steam plumes.
Kīlauea is one of five coalescing volcanoes that comprise the island of Hawaii. Historically its eruptions originate primarily from the summit caldera or along one of the lengthy E and SW rift zones that extend from the caldera to the sea (figure 105). The latest Kīlauea eruption began in January 1983 along the east rift zone. The eruption's early phases, or episodes, occurred along a portion of the rift zone that extend from Napau Crater on the uprift end to ~8 km E on the downrift end. Activity eventually centered on what was later named Pu'u' O'o.
Between July 1986 and January 1992, the Kupianaha lava lake was active ~3 km NE (downrift) of Pu`u `O`o (figure 103). It was during this period that the town of Kalapana and a majority of the 181 homes lost were destroyed. In December 1991, one month prior to the shut down of Kupianaha, eruptive activity returned to Pu`u `O`o. Activity had remained there until this latest episode (episode 54). More than 1 km3 of lava has erupted during the 14 years of activity (January 1983 - January 1997).
Reference. Tilling, R.I., Heliker, C., and Wright, T.L., 1987, Eruptions of Hawaiian volcanoes: past, present, and future: U.S. Geological Survey series of general-interest publications, 54 p.
Geologic Background. Kilauea overlaps the E flank of the massive Mauna Loa shield volcano in the island of Hawaii. Eruptions are prominent in Polynesian legends; written documentation since 1820 records frequent summit and flank lava flow eruptions interspersed with periods of long-term lava lake activity at Halemaumau crater in the summit caldera until 1924. The 3 x 5 km caldera was formed in several stages about 1,500 years ago and during the 18th century; eruptions have also originated from the lengthy East and Southwest rift zones, which extend to the ocean in both directions. About 90% of the surface of the basaltic shield volcano is formed of lava flows less than about 1,100 years old; 70% of the surface is younger than 600 years. The long-term eruption from the East rift zone between 1983 and 2018 produced lava flows covering more than 100 km2, destroyed hundreds of houses, and added new coastline.
Information Contacts: Hawaiian Volcano Observatory (HVO), U.S. Geological Survey, PO Box 51, Hawaii National Park, HI 96718, USA (URL: http://www.soest.hawaii.edu/hvo/).
Kujusan
Japan
33.086°N, 131.249°E; summit elev. 1791 m
All times are local (unless otherwise noted)
Increased seismic activity in January
The monthly total of earthquakes for December was 397, and included volcanic tremors on 1, 2, and 28 December. In January, seismicity increased to a total of 2,142 events. From the night of 9 January through 11 January, activity peaked with a high of 1,262 events on 10 January, the highest daily number of recorded seismic events since 11 October 1995. The highest plumes reached 600 m in December and 700 m in January.
Geologic Background. Kujusan is a complex of stratovolcanoes and lava domes lying NE of Aso caldera in north-central Kyushu. The group consists of 16 andesitic lava domes, five andesitic stratovolcanoes, and one basaltic cone. Activity dates back about 150,000 years. Six major andesitic-to-dacitic tephra deposits, many associated with the growth of lava domes, have been recorded during the Holocene. Eruptive activity has migrated systematically eastward during the past 5000 years. The latest magmatic activity occurred about 1600 years ago, when Kurodake lava dome at the E end of the complex was formed. The first reports of historical eruptions were in the 17th and 18th centuries, when phreatic or hydrothermal activity occurred. There are also many hot springs and hydrothermal fields. A fumarole on Hosho lava dome was the site of a sulfur mine for at least 500 years. Two geothermal power plants are in operation at Kuju.
Information Contacts: Volcanological Division, Japan Meteorological Agency (JMA), 1-3-4 Ote-machi, Chiyoda-ku, Tokyo 100, Japan.
Langila (Papua New Guinea) — January 1997 Cite this Report
Langila
Papua New Guinea
5.525°S, 148.42°E; summit elev. 1330 m
All times are local (unless otherwise noted)
Small January plumes; February plumes reach 11 km altitude
Throughout January activity at Crater 2 continued at a low level. Although on most days, Crater 2 only occasionally released pale gray ash clouds, from 9 to 19 January, darker gray clouds were emitted. These were occasionally accompanied by weak rumbling sounds and the emission of glowing lava fragments. The ash clouds seldom rose higher than ~2.5 km, although they occasionally reached ~4 km altitude. They blew to the SE, resulting in light ashfall. During January, Crater 3 released only fumarolic white vapors. No seismic recording took place during the month.
During 11-12 February at least five aviation reports gave warnings to pilots (SIGMETs) for Langila's plumes. The reports indicated the plumes reached at least 10.7 km altitude on 11-12 February. Although some reports described W-drifting plumes, one report at 1745 on 12 February described a "tight radius" plume that consisted of a ". . . solid core of discernible ash up to [10.7 km altitude]."
Geologic Background. Langila, one of the most active volcanoes of New Britain, consists of a group of four small overlapping composite basaltic-andesitic cones on the lower E flank of the extinct Talawe volcano in the Cape Gloucester area of NW New Britain. A rectangular, 2.5-km-long crater is breached widely to the SE; Langila was constructed NE of the breached crater of Talawe. An extensive lava field reaches the coast on the N and NE sides of Langila. Frequent mild-to-moderate explosive eruptions, sometimes accompanied by lava flows, have been recorded since the 19th century from three active craters at the summit. The youngest and smallest crater (no. 3 crater) was formed in 1960 and has a diameter of 150 m.
Information Contacts: B. Talai, D. Lolok, P. de Saint-Ours, and C. McKee, RVO.
Manam (Papua New Guinea) — January 1997 Cite this Report
Manam
Papua New Guinea
4.08°S, 145.037°E; summit elev. 1807 m
All times are local (unless otherwise noted)
Larger outburst on 11 February follows mild January activity
Following the disastrous eruption of December 1996 (BGVN 21:12), Manam only showed mild activity throughout January. Seismic activity was generally low and monitoring was discontinued on 28 January. The water-tube tiltmeters at Tabele Observatory (4 km SW of the summit) have shown no changes since the slight drop following the December eruption.
South Crater released gentle pale ash clouds at irregular intervals. Weak rumbling and roaring sounds were heard on 9, 22, 26, and 28 January. South Crater gave off night glow on 22 January and weakly emitted incandescent material on 28 January.
On most days, emissions from the Main Crater consisted of gentle continuous white vapor. Some ash emission occurred on 12 and 22-23 January, accompanied by weak roaring and rumbling sounds, and incandescent projections at night. All combined, the resulting ash clouds were generally low, rising to ~2,500 m altitude and were blown to the SE side of the island where they resulted in light ashfall.
At least two aviation reports gave warnings to pilots (SIGMETs) about Manam's 11 February plumes. The reports indicated the plumes reached ~7 km altitude.
Geologic Background. The 10-km-wide island of Manam, lying 13 km off the northern coast of mainland Papua New Guinea, is one of the country's most active volcanoes. Four large radial valleys extend from the unvegetated summit of the conical basaltic-andesitic stratovolcano to its lower flanks. These valleys channel lava flows and pyroclastic avalanches that have sometimes reached the coast. Five small satellitic centers are located near the island's shoreline on the northern, southern, and western sides. Two summit craters are present; both are active, although most observed eruptions have originated from the southern crater, concentrating eruptive products during much of the past century into the SE valley. Frequent eruptions, typically of mild-to-moderate scale, have been recorded since 1616. Occasional larger eruptions have produced pyroclastic flows and lava flows that reached flat-lying coastal areas and entered the sea, sometimes impacting populated areas.
Information Contacts: B. Talai, D. Lolok, P. de Saint-Ours, and C. McKee, RVO.
McDonald Islands (Australia) — January 1997 Cite this Report
McDonald Islands
Australia
53.03°S, 72.6°E; summit elev. 230 m
All times are local (unless otherwise noted)
Apparent volcanic plume sighted on 5 January
[Originally reported under Heard.]
On 5 January, a pilot on an Antarctic sightseeing tour near Heard Island saw what appeared to be a volcanic plume.
Geologic Background. Historical eruptions have greatly modified the morphology of the McDonald Islands, located on the Kerguelen Plateau about 75 km W of Heard Island. The largest island, McDonald, is composed of a layered phonolitic tuff plateau cut by phonolitic dikes and lava domes. A possible nearby active submarine center was inferred from phonolitic pumice that washed up on Heard Island in 1992. Volcanic plumes were observed in December 1996 and January 1997 from McDonald Island. During March 1997 the crew of a vessel that sailed near the island noted vigorous steaming from a vent on the N side of the island along with possible pyroclastic deposits and lava flows. A satellite image taken in November 2001 showed the island to have more than doubled in area since previous reported observations in November 2000. The high point of the island group had shifted to the McDonald's N end, which had merged with Flat Island.
Information Contacts: Andrew Tupper, Darwin RFC/RSMC/VAAC, Bureau of Meteorology, Northern Territory, Australia.
Okmok (United States) — January 1997 Cite this Report
Okmok
United States
53.43°N, 168.13°W; summit elev. 1073 m
All times are local (unless otherwise noted)
Eruption begins on 13 February from crater along S caldera rim
On the morning of 13 February, a small eruption began from a cone at 760 m elevation along the S rim of the Okmok caldera. Around 1000 a dark ash plume rose to ~1,525 m and was carried SW by prevailing winds. On 18 February, Coast Guard pilots reported an ash plume that rose to an altitude of 3,050-4,600 m. Observers at the former Fort Glenn military base reported seeing a bright red glare reflected from the 1,830-m-high weather clouds between 0100 and sunrise. At 1335 pilots reported a second plume that rose to 4,875 m. Satellite imagery continued to reveal a hot spot in the vicinity of the cone through the week of 21 February.
Geologic Background. The basaltic Okmok shield volcano forms the NE end of Umnak Island in the Aleutian Islands. The summit of the low, 35-km-wide volcano is cut by two overlapping 10-km-wide calderas formed during eruptions about 12,000 and 2,050 years ago when dacitic pyroclastic flows reached the coast. More than 60 tephra layers from Okmok have been found overlying the 12,000-year-old caldera-forming tephra layer. Numerous cones and lava domes are present on the flanks down to the coast, including the SE-flank Mount Tulik, which is almost 200 m higher than the caldera rim. Some of the post-caldera cones show evidence of wave-cut lake terraces; more recent cones were formed after the caldera lake, once 150 m deep, disappeared. Eruptions have been reported since 1805 from cinder cones within the caldera, where there are also hot springs and fumaroles.
Information Contacts: Alaska Volcano Observatory (AVO); NOAA/NESDIS Satellite Analysis Branch (SAB).
Pavlof (United States) — January 1997 Cite this Report
Pavlof
United States
55.417°N, 161.894°W; summit elev. 2493 m
All times are local (unless otherwise noted)
Pause in eruptive activity, but continued small intermittent steam plumes
The latest eruption began on 15 September and continued intermittently through 3 January, when a small ash burst was observed just above the summit (BGVN 21:08-21:12). On the morning of 24 January a pilot reported weak emission of steam and possibly minor ash rising to ~4.2 km altitude, mixing with a cloud layer, and drifting SE. Very low levels of seismicity were recorded from early January through late February.
A ground observer who glimpsed the volcano on 4 February reported that the summit vent area, which had been snow-covered the previous week, was now bare. On 6 February the same observer saw a small steam plume rising from the vent area to the level of the summit. U.S. National Weather Service observers in Cold Bay (60 km SW) reported another small steam plume up to 300 m above the summit vents during 15-16 February. A similar steam plume to 600-900 m above the vents was reported by pilots on 19 February.
Geologic Background. The most active volcano of the Aleutian arc, Pavlof is a Holocene stratovolcano that was constructed along a line of vents extending NE from the Emmons Lake caldera. Pavlof and Pavlof Sister to the NE form a dramatic pair of symmetrical, glacier-covered stratovolcanoes that overlook Pavlof and Volcano bays. Little Pavlof is a smaller cone on the SW flank of Pavlof volcano, near the rim of Emmons Lake caldera. Unlike Pavlof Sister, eruptions have frequently been reported from Pavlof, typically Strombolian to Vulcanian explosive eruptions from the summit vents and occasional lava flows. The active vents lie near the summit on the north and east sides. The largest recorded eruption took place in 1911, at the end of a 5-year-long eruptive episode, when a fissure opened on the N flank, ejecting large blocks and issuing lava flows.
Information Contacts: Alaska Volcano Observatory (AVO), a cooperative program of a) U.S. Geological Survey, 4200 University Drive, Anchorage, AK 99508-4667, USA (URL: http://www.avo.alaska.edu/), b) Geophysical Institute, University of Alaska, PO Box 757320, Fairbanks, AK 99775-7320, USA, and c) Alaska Division of Geological & Geophysical Surveys, 794 University Ave., Suite 200, Fairbanks, AK 99709, USA.
Rabaul (Papua New Guinea) — January 1997 Cite this Report
Rabaul
Papua New Guinea
4.2459°S, 152.1937°E; summit elev. 688 m
All times are local (unless otherwise noted)
Large gas fireball, Strombolian eruptions, and lava flows
A strong Strombolian and lava-producing eruption occurred at Tavurvur, the small active crater on the E side of Rabaul Caldera, on 9 January. The eruption, very similar to the one on 4 October last year, marked the start of a new eruptive phase in the caldera.
Since early December, a reversal in trend at the Sulphur Creek (SCK) water-tube tiltmeter (3 km NW of Tavurvur) suggested a slight deflation of the central magma reservoir. From mid-December, SO2 emissions measured by COSPEC dropped to very low levels and emissions from Tavurvur were reduced to only white vapor. From 25 December onward, low-frequency earthquakes started to occur under Tavurvur and became increasingly common. In early January, emissions from Tavurvur contained more blue vapor and only occasional ash. A hissing sound could be heard from nearby Matupit Island accompanied by red glow at night.
At 0053 on 9 January, a powerful explosion woke residents of the caldera and Kokopo, 1 km S. It was reported to have produced a dark ash cloud that rose 3,000-4,000 m and blocks could be heard falling around the Tavurvur cone.
No further unusual activity was noticed until 0120, when a "large fireball" rose silently above the crater to a height of ~1,500 m while expanding to a ~500 m radius before falling onto the cone where it ignited bush fires. Witnesses say that it produced very intense light for a few seconds before dying off instantaneously and that there were no incandescent projections. It is presumed that this phenomenon corresponded to the ignition of a large bubble of methane, a gas that is relatively abundant in Tavurvur emissions.
Following the gas fireball, background RSAM rose (from <50 to >100 scale units) and weak Strombolian activity started within ten minutes. The strength of the Strombolian activity increased rapidly as did the RSAM levels (~200 by 0200, ~500 by 0245, and ~700 by 0300). The activity culminated between 0400 and 1200, with sub-continuous fountaining of pasty lumps of lava to ~1,000 m above the crater rim and sub-continuous detonations that broke glassware at Kokopo and were heard as far away as Bialla and Buka Islands (200 km SW and 300 km SE, respectively). The detonations were quieter on the N side of Rabaul (presumably due to the shape of Tavurvur crater, now open to the S). A column containing ash and scoria rose to ~4,000 m; it blew SE, leaving >1 cm thickness of coarse ash at Talwat village (1.5 km SE) and a few millimeters over the Tokua-Kokopo area.
Starting at about 0315 on 9 January, a chunky lava flow (estimated volume 4 x 10⁶ m3) poured over Tavurvur's S rim, over and onto either side of the 4 October lava flow, until it reached the sea. By 10 January the coastline had been extended ~100 m offshore. Throughout the main phase of the Strombolian activity and lava flows, RSAM levels were steady at ~850, similar to the October 1996 eruption.
Coconut and cocoa groves, the road leading to Talwat, and a few houses (deserted since the 1994 eruption) were ignited and buried by the lava flow. During the night, inhabitants of Matupit Island (~2 km W of Tavurvur) began to evacuate on their own accord. Upon encountering RVO staff at about 0300 and 0400 on 9 January, they learned that the eruption was probably not a threat to life or property and many returned to their homes. That day, many businesses stayed closed in the Kokopo area, due to the continuous, unnerving detonations.
Activity started to decline after noon, and decreased rapidly after 1400. By 1800, Strombolian explosions were discontinuous and weak. RSAM levels dropped to pre-eruption background levels (~40).
The SCK water tube tiltmeter showed a radial deflation of ~10 µrad in response to the eruption (compared to ~12 µrad in response to the October eruption). Some GPS measurements along a 3 km radius to Tavurvur showed significant (centimeter scale) horizontal changes. Although some motion occurred away from the volcano, the horizontal movement appeared complex and irregular.
Inspection of the S flank of Tavurvur revealed that, at an unknown time during the eruption, part of the crater wall slumped half way down the cone, now forming a hump partly covered and partly surrounded by the lava flow.
On the following days, activity was low. Pale gray ash clouds discharged at irregular intervals with load roaring or explosion sounds. For nearly a week afterward, bands of harmonic tremor occurred at intervals of a few hours, sometimes energetic enough to be recorded by the whole seismic network. RSAM values remained at background levels, with discrete spikes in response to explosions. SO2 levels also remained low (300-800 tons/day) throughout.
From 15 January, ash emissions became darker. By 21 January, these Vulcanian explosions were occurring at 1-5 minute intervals, rising to 3,000 m and resulting in light, damp ashfalls to the SE. However, past the third week in January, activity was back to a moderate level of weaker, grayish Vulcanian explosions, while SCK tiltmeter showed a slow recovery trend.
Geologic Background. The low-lying Rabaul caldera on the tip of the Gazelle Peninsula at the NE end of New Britain forms a broad sheltered harbor utilized by what was the island's largest city prior to a major eruption in 1994. The outer flanks of the asymmetrical shield volcano are formed by thick pyroclastic-flow deposits. The 8 x 14 km caldera is widely breached on the east, where its floor is flooded by Blanche Bay and was formed about 1,400 years ago. An earlier caldera-forming eruption about 7,100 years ago is thought to have originated from Tavui caldera, offshore to the north. Three small stratovolcanoes lie outside the N and NE caldera rims. Post-caldera eruptions built basaltic-to-dacitic pyroclastic cones on the caldera floor near the NE and W caldera walls. Several of these, including Vulcan cone, which was formed during a large eruption in 1878, have produced major explosive activity during historical time. A powerful explosive eruption in 1994 occurred simultaneously from Vulcan and Tavurvur volcanoes and forced the temporary abandonment of Rabaul city.
Information Contacts: B. Talai, D. Lolok, P. de Saint-Ours, and C. McKee, Rabaul Volcano Observatory (RVO), P.O. Box 386, Rabaul, Papua New Guinea.
Rincon de la Vieja (Costa Rica) — January 1997 Cite this Report
Rincon de la Vieja
Costa Rica
10.83°N, 85.324°W; summit elev. 1916 m
All times are local (unless otherwise noted)
Sulfur-bearing steam, mass wasting, and acid rain in September
A visit to the crater during September 1996 revealed vegetation killed by the phreatic eruption of November 1995 (BGVN 20:10 and 20:11/12), by mass wasting in its aftermath, and by continued acidic rainfall. Although some plants were beginning to return, most suffered visible damage such as scalded leaves. The crater area continued to smell of sulfur and the loud noise of escaping steam could be heard from the crater's margin.
Geologic Background. Rincón de la Vieja, the largest volcano in NW Costa Rica, is a remote volcanic complex in the Guanacaste Range. The volcano consists of an elongated, arcuate NW-SE-trending ridge constructed within the 15-km-wide early Pleistocene Guachipelín caldera, whose rim is exposed on the south side. Sometimes known as the "Colossus of Guanacaste," it has an estimated volume of 130 km3 and contains at least nine major eruptive centers. Activity has migrated to the SE, where the youngest-looking craters are located. The twin cone of Santa María volcano, the highest peak of the complex, is located at the eastern end of a smaller, 5-km-wide caldera and has a 500-m-wide crater. A Plinian eruption producing the 0.25 km3 Río Blanca tephra about 3,500 years ago was the last major magmatic eruption. All subsequent eruptions, including numerous historical eruptions possibly dating back to the 16th century, have been from the prominent active crater containing a 500-m-wide acid lake located ENE of Von Seebach crater.
Information Contacts: E. Fernández, E. Duarte, V. Barboza, R. Van der Laat, E. Hernandez, M. Martinez, and R. Sáenz, Observatorio Vulcanológico y Sismológico de Costa Rica, Universidad Nacional (OVSICORI-UNA), Apartado 86-3000, Heredia, Costa Rica.
Soufriere Hills (United Kingdom) — January 1997 Cite this Report
Soufriere Hills
United Kingdom
16.72°N, 62.18°W; summit elev. 915 m
All times are local (unless otherwise noted)
Ongoing dome growth, pyroclastic flows, and crack dilation
The following condenses the daily Scientific Reports of the Montserrat Volcano Observatory (MVO) for the period 12 January-8 February 1997. This interval was marked by noteworthy pyroclastic flows and visible dome destruction and growth. Galway's Wall, on the volcano SW side, underwent sufficient erosion to allow escape of some dome talus. A photo (figure 16) taken on 28 January, and associated sketch (figure 17), shows the dome within the breached English's Crater.
Visual observations. On 13 January (between 1130-1300 and 2215-2305) two very large pyroclastic flows originated from the SE part of the 1 October dome at a spot close to the 11 December dome. The pyroclastic flows traveled down the S side of the Tar River valley to the sea. These flows eroded a chute to the S of Castle Peak, and created a scar in the 1 October dome. This scar became the site of rapid dome growth from the next day (14 January), when incandescence, small rockfalls and steaming and ash venting from the dome were reported. A helicopter flight on 14 January disclosed new talus deposits along the E and W margins of Galway's Wall.
On the morning of 16 January (between 0530 and 0630) the largest single pyroclastic flow in this eruption occurred. Reports from the airport described a rumbling of rocks and ash accompanying a glowing cloud down to the sea. The entire fan was covered by new material that included blocks 1-2 m in diameter (up to 5 m diameter at the head of the fan). The deposit was quite narrow in the upper reaches of the Tar River valley. The S chute cut back deeply into the dome to the S of Castle Peak, creating a large amphitheater into the mass of the 1 October dome ("Santa lobe") and the 11 December dome. Smaller pyroclastic flows occurred later that day; finally a prominent scar estimated to be ~8 m deep and running NE-SW was noted across the dome. The ash cloud from this activity rose to 6.1 km. The low-level ash was carried SW, causing heavy ashfall in Plymouth. At higher levels, the winds blew the ash S and E, and light ashfall was reported from Guadeloupe, 120 km SE.
On 19 and 20 January observers at Whites saw new extrusions growing rapidly within the scars formed by collapses of the SE flank of the composite October-December dome.
Pyroclastic flows began at 1830 on 20 January and lasted for about one hour. They originated from the SE part of the October-December composite dome, traveled down the S Tar River, and ignited some trees on the lower slopes of Perches Mountain before reaching the sea. A scoop-shaped excavation was carved into the SE flank of the composite dome, in the same place as the 16 January excavation, but larger in size.
The ash cloud from the 20 January pyroclastic flow rose to ~10 km. Low-altitude winds blew ash SW. Higher altitude winds blew ash NE, where it mixed with rain and fell as wet ash over most of N Montserrat. It was suggested that the higher amount of ash production on 20 January, compared with 16 January, was due to the higher lava temperature.
On 22 January, about 40 hours after the activity began, observers noted new growth and a large flower-shaped extrusion within the scar. During the first week of growth, this extrusion was contained within the scar, and only a few rockfalls entered the Tar River valley.
The largest rockfall on 26 January reached only to the foot of the dome. On 28 and 29 January, rockfalls were more common to both the N and S of Castle Peak, and occasional small pyroclastic flows were observed. The dome's vertical growth slowed, as it expanded laterally to the E and NW.
Evidence of further landslides from the Galway's Wall, on the S part of the crater rim, was seen on 26, 27, and 28 January. By 29 January, the central part of the wall's top was flush with the talus of the pre-September dome, and a small amount of dome material had fallen over the wall, leaving a minor scoop in the dome.
From late January through 8 February frequent small pyroclastic flows occurred, often during episodes of tremor. On 1 February a pyroclastic flow caused an ash cloud that drifted NW, depositing ash in Corkhill, Salem, and Old Towne. On 2 February, small pyroclastic flows accompanied by fountains of ash were reported from the area above Castle Peak. On 1 and 2 February heavy rain caused destructive flash flooding in Fort Ghaut. Much of the vegetation on the W slopes of the volcano was destroyed by months of heavy ashfall and acidic rain.
By 3 February, the remains of Castle Peak had either been completely buried or removed by pyroclastic flow activity. On 6 February a pyroclastic flow reached the sea; two flows on 7 February reached about half-way across the delta. The second flow was observed from the air and from Whites. During that event a collapse at the dome's SE face caused four pulses of small-scale decompression, resulting in ash jetting and release of small projectiles.
The most significant development at Galway's Wall during this period occurred sometime around 1-2 February, perhaps associated with heavy rains. A notch was cut through the upper wall at the western end, along one of the near-vertical zones of weakness in the wall. Dome material funneled through the wall, and fell on top of the landslide deposits in the upper Galway's area. The notch was first seen on 4 February, and the volume of material involved did not seem to increase significantly during the rest of the week.
Dome volume measurements. Volume measurements were made of the 20 January dome on 26 and 28 January, giving volumes of 1.46 and 1.52 x 10⁶ m3, respectively. It was also estimated that an accumulation of 150,000 m3 of talus blocks developed at the base of the new extrusion. A survey on 6 February indicated that around 2.3 x 10⁶ m3 of material were produced in nine days, giving an extrusion rate between the 28 January and 6 February of 2.9 m3/s. The average extrusion rate for the 20 January dome up to 6 February was 2.7 m3/s.
Helicopter surveys of the Tar River delta on 5 and 7 February showed that the total volume of the deposits was 14.9 x 10⁶ m3, of which 7.4 x 10⁶ m3 lay above sea level. The previous measurement on 27 September 1996 gave a volume of 11.6 x 10⁶ m3 with a sub-aerial volume of 4.9 x 10⁶ m3. The delta was also measured 600 m offshore, where it was 1.3 km across at its widest point. Even though the delta had not extended significantly since late September, it widened by 150 m and gained 10 m in height at the central point.
Seismicity. Rockfalls, pyroclastic flow signals, and volcano-tectonic events dominated the seismicity during this observation period. Swarms of volcano-tectonic earthquakes were as usual located at shallow depths beneath the crater. All of the major pyroclastic flows were preceded by earthquake swarms, suggesting that the earthquakes may be caused by pulses of magma moving to the surface, with these pulses then causing dome collapses a short time later. Out of nine earthquake swarms, three were followed by pyroclastic flows in the subsequent 27 to 66 minutes. Low-amplitude banded tremor was also observed during this reporting period. The typical tremor duration was about two hours, and the tremor episodes were ~8 hours apart. The amplitude of the tremor increased slightly during 15 January, prior to the collapse early on 16 January. Another tremor episode started before midnight on 16 January, and continued at regular intervals until the end of the period.
In general, after 21 January, volcano-tectonic swarms became fairly regular, occurring twice per day at ~12-hour intervals. This pattern was similar to that observed in the two weeks prior to the explosion of 17 September 1996, when the time interval between the swarms gradually decreased to 4 hours immediately prior to the explosion. At the end, almost all the swarms were accompanied by 2-5 long-period earthquakes (dominant frequencies, ~1 Hz or lower). Again, during 26 January-1 February the volcano-tectonic swarms were regularly spaced, with ~12 hours between each swarm, apart from a gap on 28 January. The duration of the swarms was variable, but generally 1-2 hours. The swarms started at or just after the peak in the theoretical solid-earth tide.
From 2 February, there was an increase in amplitude and duration of tremor episodes that lasted for 40-140 minutes; a gradual increase in amplitude was followed by an abrupt decay. At first the tremor built up gradually from background noise levels, but in the latter part of the observation period the tremor started as individual hybrid earthquakes that grew in number until they formed a continuous signal. During about half of these episodes, pyroclastic flows occurred at or shortly after the peak in tremor.
The time between the earthquake swarms gradually increased between 2 and 7 February. Maximum tremor amplitude also increased, with the highest amplitude recorded on 6 February. Thereafter the maximum tremor amplitude decayed, and no tremor was detected following a swarm on 8 February. Tremor was generally non-harmonic, with frequency in the 1-2.5 Hz range. However, harmonic tremor was recorded during a short interval close to the peak intensity of a tremor episode on 6 February, and may have been present for short periods during other episodes. The dominant frequency of this tremor was 1.25 Hz.
COSPEC and other measurements. On 16 January correlation spectrometer measurements from a boat along lines off the SW coast yielded average SO2 values of 344 metric tons/day (t/d) at 5.5 km from the dome and 233 t/d at 8.5 km. Measurements were made on the same day along the SW road within a few hours of dome collapse, but due to the wind direction, it was only possible to measure for half of the plume, which yielded a value of 1,017 t/d. On 21 January, 1,260 t/d were measured, a value typical of recent measurements immediately after dome collapses. Daily averages on 24, 29, and 31 January, and 4, 6, and 7 February were 590, 796, 495, 323, 446, and 652 t/d, respectively. During the 7 February traverse, the SO2 flux maxima (up to 871 t/d) was coincident with tremor and pyroclastic flow activity.
Scientists measured net movement along two prominent cracks on Chances Peak, located at the N intersection of Galway's Wall and Chances Peak. From 12 to 22 January, Crack 1, the most southerly of the two cracks, was oriented NE-SW and showed an extension of 0.69 cm/day and shear of 0.31 cm/day . From 22 to 26 January extension increased to 1.6 cm/day and shear to 0.7 cm/day. From 26 to 28 January extension increased to 1.75 cm/day and shear remained at 0.7 cm/day. Measurements at Crack 2 (22-26 January) showed a steady movement of 0.7 cm/day. Between 26 and 28 January shear increased slightly from 0.06 cm/day to 0.25 cm/day.
SO2 diffusion tubes downwind of the volcano showed a gradual decrease in this gas species throughout the period 1 October to 30 December, a drop similar to the one prior to the September 1996 explosion event. Dust samples collected in Plymouth in early October had high numbers of particles <0.7 µm in size.
Water samples showed high acidity levels (pH 2-3) in the Amersham area, as a result of acid rain forming in the plume; this effect decayed with distance. Rain water samples collected from various locations around the volcano showed that the rainwater directly W of the volcano continues to be highly acidic and has revealed concentrations of sulfites, chloride, and fluorides.
On 1 February, a Nettlton gravity profile across Whites Ghaut yielded a density of 2.1 g/cm3. On 30 January and 4 February, GPS networks showed that all slope lengths were within two standard deviations of the long-term means since June 1996.
Geologic Background. The complex, dominantly andesitic Soufrière Hills volcano occupies the southern half of the island of Montserrat. The summit area consists primarily of a series of lava domes emplaced along an ESE-trending zone. The volcano is flanked by Pleistocene complexes to the north and south. English's Crater, a 1-km-wide crater breached widely to the east by edifice collapse, was formed about 2000 years ago as a result of the youngest of several collapse events producing submarine debris-avalanche deposits. Block-and-ash flow and surge deposits associated with dome growth predominate in flank deposits, including those from an eruption that likely preceded the 1632 CE settlement of the island, allowing cultivation on recently devegetated land to near the summit. Non-eruptive seismic swarms occurred at 30-year intervals in the 20th century, but no historical eruptions were recorded until 1995. Long-term small-to-moderate ash eruptions beginning in that year were later accompanied by lava-dome growth and pyroclastic flows that forced evacuation of the southern half of the island and ultimately destroyed the capital city of Plymouth, causing major social and economic disruption.
Information Contacts: Montserrat Volcano Observatory (MVO), c/o Chief Minister's Office, PO Box 292, Plymouth, Montserrat (URL: http://www.mvo.ms/).
Suwanosejima (Japan) — January 1997 Cite this Report
Suwanosejima
Japan
29.638°N, 129.714°E; summit elev. 796 m
All times are local (unless otherwise noted)
Weak ash emission and rumbling in late December
On 26, 27, and 28 December, the Government of the Kagoshima Prefecture reported weak ash emission and rumbling from Suwanose-jima. A small quantity of ashfall was observed on 27 December.
Geologic Background. The 8-km-long island of Suwanosejima in the northern Ryukyu Islands consists of an andesitic stratovolcano with two active summit craters. The summit is truncated by a large breached crater extending to the sea on the E flank that was formed by edifice collapse. One of Japan's most frequently active volcanoes, it was in a state of intermittent Strombolian activity from Otake, the NE summit crater, between 1949 and 1996, after which periods of inactivity lengthened. The largest recorded eruption took place in 1813-14, when thick scoria deposits covered residential areas, and the SW crater produced two lava flows that reached the western coast. At the end of the eruption the summit of Otake collapsed, forming a large debris avalanche and creating an open collapse scarp extending to the eastern coast. The island remained uninhabited for about 70 years after the 1813-1814 eruption. Lava flows reached the eastern coast of the island in 1884. Only about 50 people live on the island.
Information Contacts: Volcanological Division, Japan Meteorological Agency (JMA), 1-3-4 Ote-machi, Chiyoda-ku, Tokyo 100, Japan.