Recently Published Bulletin Reports
Erebus (Antarctica) Lava lake remains active; most thermal alerts recorded since 2019
Rincon de la Vieja (Costa Rica) Frequent phreatic explosions during July-December 2023
Bezymianny (Russia) Explosion on 18 October 2023 sends ash plume 8 km high; lava flows and incandescent avalanches
Kilauea (United States) Low-level lava effusions in the lava lake at Halema’uma’u during July-December 2022
Nyamulagira (DR Congo) Lava flows and thermal activity during May-October 2023
Bagana (Papua New Guinea) Explosions, ash plumes, ashfall, and lava flows during April-September 2023
Mayon (Philippines) Lava flows, pyroclastic flows, ash emissions, and seismicity during April-September 2023
Nishinoshima (Japan) Eruption plumes and gas-and-steam plumes during May-August 2023
Krakatau (Indonesia) White gas-and-steam plumes and occasional ash plumes during May-August 2023
Villarrica (Chile) Strombolian activity, gas-and-ash emissions, and crater incandescence during April-September 2023
Merapi (Indonesia) Frequent incandescent avalanches during April-September 2023
Ebeko (Russia) Moderate explosive activity with ash plumes continued during June-November 2023
Erebus (Antarctica) — January 2024  Cite this Report
Erebus
Antarctica
77.53°S, 167.17°E; summit elev. 3794 m
All times are local (unless otherwise noted)
Lava lake remains active; most thermal alerts recorded since 2019
The lava lake in the summit crater of Erebus has been active since at least 1972. Located in Antarctica overlooking the McMurdo Station on Ross Island, it is the southernmost active volcano on the planet. Because of the remote location, activity is primarily monitored by satellites. This report covers activity during 2023.
The number of thermal alerts recorded by the Hawai'i Institute of Geophysics and Planetology’s MODVOLC Thermal Alerts System increased considerably in 2023 compared to the years 2020-2022 (table 9). In contrast to previous years, the MODIS instruments aboard the Aqua and Terra satellites captured data from Erebus every month during 2023. Consistent with previous years, the lowest number of anomalous pixels were recorded in January, November, and December.
Table 9. Number of monthly MODIS-MODVOLC thermal alert pixels recorded at Erebus during 2017-2023. See BGVN 42:06 for data from 2000 through 2016. The table was compiled using data provided by the HIGP – MODVOLC Thermal Alerts System.
| Year |
Jan |
Feb |
Mar |
Apr |
May |
Jun |
Jul |
Aug |
Sep |
Oct |
Nov |
Dec |
SUM |
| 2017 |
0 |
21 |
9 |
0 |
0 |
1 |
11 |
61 |
76 |
52 |
0 |
3 |
234 |
| 2018 |
0 |
21 |
58 |
182 |
55 |
17 |
137 |
172 |
103 |
29 |
0 |
0 |
774 |
| 2019 |
2 |
21 |
162 |
151 |
55 |
56 |
75 |
53 |
29 |
19 |
1 |
0 |
624 |
| 2020 |
0 |
2 |
16 |
18 |
4 |
4 |
1 |
3 |
18 |
3 |
1 |
6 |
76 |
| 2021 |
0 |
9 |
1 |
0 |
2 |
56 |
46 |
47 |
35 |
52 |
5 |
3 |
256 |
| 2022 |
1 |
13 |
55 |
22 |
15 |
32 |
39 |
19 |
31 |
11 |
0 |
0 |
238 |
| 2023 |
2 |
33 |
49 |
82 |
41 |
32 |
70 |
64 |
42 |
17 |
5 |
11 |
448 |
Sentinel-2 infrared images showed one or two prominent heat sources within the summit crater, accompanied by adjacent smaller sources, similar to recent years (see BGVN 46:01, 47:02, and 48:01). A unique image was obtained on 25 November 2023 by the OLI-2 (Operational Land Imager-2) on Landsat 9, showing the upper part of the volcano surrounded by clouds (figure 32).
Geologic Background. Mount Erebus, the world's southernmost historically active volcano, overlooks the McMurdo research station on Ross Island. It is the largest of three major volcanoes forming the crudely triangular Ross Island. The summit of the dominantly phonolitic volcano has been modified by one or two generations of caldera formation. A summit plateau at about 3,200 m elevation marks the rim of the youngest caldera, which formed during the late-Pleistocene and within which the modern cone was constructed. An elliptical 500 x 600 m wide, 110-m-deep crater truncates the summit and contains an active lava lake within a 250-m-wide, 100-m-deep inner crater; other lava lakes are sometimes present. The glacier-covered volcano was erupting when first sighted by Captain James Ross in 1841. Continuous lava-lake activity with minor explosions, punctuated by occasional larger Strombolian explosions that eject bombs onto the crater rim, has been documented since 1972, but has probably been occurring for much of the volcano's recent history.
Information Contacts: Hawai'i Institute of Geophysics and Planetology (HIGP) - MODVOLC Thermal Alerts System, School of Ocean and Earth Science and Technology (SOEST), Univ. of Hawai'i, 2525 Correa Road, Honolulu, HI 96822, USA (URL: http://modis.higp.hawaii.edu/); Copernicus Browser, Copernicus Data Space Ecosystem, European Space Agency (URL: https://dataspace.copernicus.eu/browser/); NASA Earth Observatory, EOS Project Science Office, NASA Goddard Space Flight Center, Goddard, Maryland, USA (URL: https://earthobservatory.nasa.gov/images/152134/erebus-breaks-through).
Rincon de la Vieja (Costa Rica) — January 2024 Cite this Report
Rincon de la Vieja
Costa Rica
10.83°N, 85.324°W; summit elev. 1916 m
All times are local (unless otherwise noted)
Frequent phreatic explosions during July-December 2023
Rincón de la Vieja is a volcanic complex in Costa Rica with a hot convecting acid lake that exhibits frequent weak phreatic explosions, gas-and-steam emissions, and occasional elevated sulfur dioxide levels (BGVN 45:10, 46:03, 46:11). The current eruption period began June 2021. This report covers activity during July-December 2023 and is based on weekly bulletins and occasional daily reports from the Observatorio Vulcanologico Sismologica de Costa Rica-Universidad Nacional (OVSICORI-UNA).
Numerous weak phreatic explosions continued during July-December 2023, along with gas-and-steam emissions and plumes that rose as high as 3 km above the crater rim. Many weekly OVSICORI-UNA bulletins included the previous week's number of explosions and emissions (table 9). For many explosions, the time of explosion was given (table 10). Frequent seismic activity (long-period earthquakes, volcano-tectonic earthquakes, and tremor) accompanied the phreatic activity.
Table 9. Number of reported weekly phreatic explosions and gas-and-steam emissions at Rincón de la Vieja, July-December 2023. Counts are reported for the week before the Weekly Bulletin date; not all reports included these data. Courtesy of OVSICORI-UNA.
| OVSICORI Weekly Bulletin |
Number of explosions |
Number of emissions |
| 28 Jul 2023 |
6 |
14 |
| 4 Aug 2023 |
10 |
12 |
| 1 Sep 2023 |
13 |
11 |
| 22 Sep 2023 |
12 |
13 |
| 29 Sep 2023 |
6 |
11 |
| 6 Oct 2023 |
12 |
5 |
| 13 Oct 2023 |
7 |
9 |
| 20 Oct 2023 |
1 |
15 |
| 27 Oct 2023 |
3 |
23 |
| 3 Nov 2023 |
3 |
10 |
| 17 Nov 2023 |
0 |
Some |
| 24 Nov 2023 |
0 |
14 |
| 8 Dec 2023 |
4 |
16 |
| 22 Dec 2023 |
8 |
18 |
Table 10. Summary of activity at Rincón de la Vieja during July-December 2023. Weak phreatic explosions and gas emissions are noted where the time of explosion was indicated in the weekly or daily bulletins. Height of plumes or emissions are distance above the crater rim. Courtesy of OVSICORI-UNA.
| Date |
Time |
Description of Activity |
| 1 Jul 2023 |
0156 |
Explosion. |
| 2 Jul 2023 |
0305 |
Explosion. |
| 4 Jul 2023 |
0229, 0635 |
Event at 0635 produced a gas-and-steam plume that rose 700 m and drifted W; seen by residents in Liberia (21 km SW). |
| 9 Jul 2023 |
1843 |
Explosion. |
| 21 Jul 2023 |
0705 |
Explosion. |
| 26 Jul 2023 |
1807 |
Explosion. |
| 28 Jul 2023 |
0802 |
Explosion generated a gas-and-steam plume that rose 500 m. |
| 30 Jul 2023 |
1250 |
Explosion. |
| 31 Jul 2023 |
2136 |
Explosion. |
| 11 Aug 2023 |
0828 |
Explosion. |
| 18 Aug 2023 |
1304 |
Explosion. |
| 21 Aug 2023 |
1224 |
Explosion generated gas-and-steam plumes rose 500-600 m. |
| 22 Aug 2023 |
0749 |
Explosion generated gas-and-steam plumes rose 500-600 m. |
| 24 Aug 2023 |
1900 |
Explosion. |
| 25 Aug 2023 |
0828 |
Event produced a steam-and-gas plume that rose 3 km and drifted NW. |
| 27-28 Aug 2023 |
0813 |
Four small events; the event at 0813 on 28 August lasted two minutes and generated a steam-and-gas plume that rose 2.5 km. |
| 1 Sep 2023 |
1526 |
Explosion generated plume that rose 2 km and ejected material onto the flanks. |
| 2-3 Sep 2023 |
- |
Small explosions detected in infrasound data. |
| 4 Sep 2023 |
1251 |
Gas-and-steam plume rose 1 km and drifted W. |
| 7 Nov 2023 |
1113 |
Explosion. |
| 8 Nov 2023 |
0722 |
Explosion. |
| 12 Nov 2023 |
0136 |
Small gas emissions. |
| 14 Nov 2023 |
0415 |
Small gas emissions. |
According to OVSICORI-UNA, during July-October the average weekly sulfur dioxide (SO2) flux ranged from 68 to 240 tonnes/day. However, in mid-November the flux increased to as high as 334 tonnes/day, the highest value measured in recent years. The high SO2 flux in mid-November was also detected by the TROPOMI instrument on the Sentinel-5P satellite (figure 43).
Geologic Background. Rincón de la Vieja, the largest volcano in NW Costa Rica, is a remote volcanic complex in the Guanacaste Range. The volcano consists of an elongated, arcuate NW-SE-trending ridge constructed within the 15-km-wide early Pleistocene Guachipelín caldera, whose rim is exposed on the south side. Sometimes known as the "Colossus of Guanacaste," it has an estimated volume of 130 km3 and contains at least nine major eruptive centers. Activity has migrated to the SE, where the youngest-looking craters are located. The twin cone of Santa María volcano, the highest peak of the complex, is located at the eastern end of a smaller, 5-km-wide caldera and has a 500-m-wide crater. A Plinian eruption producing the 0.25 km3 Río Blanca tephra about 3,500 years ago was the last major magmatic eruption. All subsequent eruptions, including numerous historical eruptions possibly dating back to the 16th century, have been from the prominent active crater containing a 500-m-wide acid lake located ENE of Von Seebach crater.
Information Contacts: Observatorio Vulcanológico Sismológica de Costa Rica-Universidad Nacional (OVSICORI-UNA), Apartado 86-3000, Heredia, Costa Rica (URL: http://www.ovsicori.una.ac.cr/); NASA Global Sulfur Dioxide Monitoring Page, Atmospheric Chemistry and Dynamics Laboratory, NASA Goddard Space Flight Center (NASA/GSFC), 8800 Greenbelt Road, Goddard MD 20771, USA (URL: https://so2.gsfc.nasa.gov/).
Bezymianny (Russia) — November 2023 Cite this Report
Bezymianny
Russia
55.972°N, 160.595°E; summit elev. 2882 m
All times are local (unless otherwise noted)
Explosion on 18 October 2023 sends ash plume 8 km high; lava flows and incandescent avalanches
Bezymianny, located on Russia’s Kamchatka Peninsula, has had eruptions since 1955 characterized by dome growth, explosions, pyroclastic flows, ash plumes, and ashfall. Activity during November 2022-April 2023 included gas-and-steam emissions, lava dome collapses generating avalanches, and persistent thermal activity. Similar eruptive activity continued from May through October 2023, described here based on information from weekly and daily reports of the Kamchatka Volcano Eruptions Response Team (KVERT), notices from Tokyo VAAC (Volcanic Ash Advisory Center), and from satellite data.
Overall activity decreased after the strong period of activity in late March through April 2023, which included ash explosions during 29 March and 7-8 April 2023 that sent plumes as high as 10-12 km altitude, along with dome growth and lava flows (BGVN 48:05). This reduced activity can be seen in the MIROVA thermal detection system graph (figure 56), which was consistent with data from the MODVOLC thermal detection system and with Sentinel-2 satellite images that showed persistent hotspots in the summit crater when conditions allowed observations. A renewed period of strong activity began in mid-October 2023.
Activity increased significantly on 17 October 2023 when large collapses began during 0700-0830 on the E flanks of the lava dome and continued to after 0930 the next day (figure 57). Ash plumes rose to an altitude of 4.5-5 km, extending 220 km NNE by 18 October. A large explosion at 1630 on 18 October produced an ash plume that rose to an altitude of 11 km (8 km above the summit) and drifted NNE and then NW, extending 900 km NW within two days at an altitude of 8 km. Minor ashfall was noted in Kozyrevsk (45 km WNW). At 0820 on 20 October an ash plume was identified in satellite images drifting 100 km ENE at altitudes of 4-4.5 km.
Lava flows and hot avalanches from the dome down the SE flank continued over the next few days, including 23 October when clear conditions allowed good observations (figures 58 and 59). A large thermal anomaly was observed over the volcano through 24 October, and in the summit crater on 30 October (figure 60). Strong fumarolic activity continued, with numerous avalanches and occasional incandescence. By the last week of October, volcanic activity had decreased to a level consistent with that earlier in the reporting period.
Aviation warnings were frequently updated during 17-20 October. KVERT issued a Volcano Observatory Notice for Aviation (VONA) on 17 October at 1419 and 1727 (0219 and 0527 UTC) raising the Aviation Color Code (ACC) from Yellow to Orange (second highest level). The next day, KVERT issued a VONA at 1705 (0505 UTC) raising the ACC to Red (highest level) but lowered it back to Orange at 2117 (0917 UTC). After another decrease to Yellow and back to Orange, the ACC was reduced to Yellow on 20 October at 1204 (0004 UTC). In addition, the Tokyo VAAC issued a series of Volcanic Ash Advisories beginning on 16 October and continuing through 30 October.
Geologic Background. The modern Bezymianny, much smaller than its massive neighbors Kamen and Kliuchevskoi on the Kamchatka Peninsula, was formed about 4,700 years ago over a late-Pleistocene lava-dome complex and an edifice built about 11,000-7,000 years ago. Three periods of intensified activity have occurred during the past 3,000 years. The latest period, which was preceded by a 1,000-year quiescence, began with the dramatic 1955-56 eruption. This eruption, similar to that of St. Helens in 1980, produced a large open crater that was formed by collapse of the summit and an associated lateral blast. Subsequent episodic but ongoing lava-dome growth, accompanied by intermittent explosive activity and pyroclastic flows, has largely filled the 1956 crater.
Information Contacts: Kamchatka Volcanic Eruptions Response Team (KVERT), Far Eastern Branch, Russian Academy of Sciences, 9 Piip Blvd., Petropavlovsk-Kamchatsky, 683006, Russia (URL: http://www.kscnet.ru/ivs/kvert/); Kamchatka Volcanological Station, Kamchatka Branch of Geophysical Survey, (KB GS RAS), Klyuchi, Kamchatka Krai, Russia (URL: http://volkstat.ru/); Tokyo Volcanic Ash Advisory Center (VAAC), 1-3-4 Otemachi, Chiyoda-ku, Tokyo 100-8122, Japan (URL: http://ds.data.jma.go.jp/svd/vaac/data/); Hawai'i Institute of Geophysics and Planetology (HIGP) - MODVOLC Thermal Alerts System, School of Ocean and Earth Science and Technology (SOEST), Univ. of Hawai'i, 2525 Correa Road, Honolulu, HI 96822, USA (URL: http://modis.higp.hawaii.edu/); MIROVA (Middle InfraRed Observation of Volcanic Activity), a collaborative project between the Universities of Turin and Florence (Italy) supported by the Centre for Volcanic Risk of the Italian Civil Protection Department (URL: http://www.mirovaweb.it/); Copernicus Browser, Copernicus Data Space Ecosystem, European Space Agency (URL: https://dataspace.copernicus.eu/browser/).chr
Kilauea (United States) — January 2023 Cite this Report
Kilauea
United States
19.421°N, 155.287°W; summit elev. 1222 m
All times are local (unless otherwise noted)
Low-level lava effusions in the lava lake at Halema’uma’u during July-December 2022
Kīlauea is the southeastern-most volcano in Hawaii and overlaps the E flank of the Mauna Loa volcano. Its East Rift Zone (ERZ) has been intermittently active for at least 2,000 years. An extended eruption period began in January 1983 and was characterized by open lava lakes and lava flows from the summit caldera and the East Rift Zone. During May 2018 magma migrated into the Lower East Rift Zone (LERZ) and opened 24 fissures along a 6-km-long NE-trending fracture zone that produced lava flows traveling in multiple directions. As lava emerged from the fissures, the lava lake at Halema'uma'u drained and explosions sent ash plumes to several kilometers altitude (BGVN 43:10).
The current eruption period started during September 2021 and has recently been characterized by lava effusions, spatter, and sulfur dioxide emissions in the active Halema’uma’u lava lake (BGVN 47:08). Lava effusions, some spatter, and sulfur dioxide emissions have continued during this reporting period of July through December 2022 using daily reports, volcanic activity notices, and abundant photo, map, and video data from the US Geological Survey's (USGS) Hawaiian Volcano Observatory (HVO).
Summary of activity during July-December 2022. Low-level effusions have continued at the western vent of the Halema’uma’u crater during July through early December 2022. Occasional weak ooze-outs (also called lava break outs) would occur along the margins of the crater floor. The overall level of the active lava lake throughout the reporting period gradually increased due to infilling, however it stagnated in mid-September (table 13). During September through November, activity began to decline, though lava effusions persisted at the western vent. By 9 December, the active part of the lava lake had completely crusted over, and incandescence was no longer visible.
Table 13. Summary of measurements taken during overflights at Kīlauea that show a gradual increase in the active lava lake level and the volume of lava effused since 29 September 2021. Lower activity was reported during September-October. Data collected during July-December 2022. Courtesy of HVO.
| Date: |
Level of the active lava lake (m): |
Cumulative volume of lava effused (million cubic meters): |
| 7 Jul 2022 |
130 |
95 |
| 19 Jul 2022 |
133 |
98 |
| 4 Aug 2022 |
136 |
102 |
| 16 Aug 2022 |
137 |
104 |
| 12 Sep 2022 |
143 |
111 |
| 5 Oct 2022 |
143 |
111 |
| 28 Oct 2022 |
143 |
111 |
Activity during July 2022. Lava effusions were reported from the western vent in the Halema’uma’u crater, along with occasional weak ooze-outs along the margins of the crater floor. The height of the lava lake was variable due to deflation-inflation tilt events; for example, the lake level dropped approximately 3-4 m during a summit deflation-inflation event reported on 1 July. Webcam images taken during the night of 6-12 July showed intermittent low-level spattering at the western vent that rose less than 10 m above the vent (figure 519). Measurements made during an overflight on 7 July indicated that the crater floor was infilled about 130 m and that 95 million cubic meters of lava had been effused since 29 September 2021. A single, relatively small lava ooze-out was active to the S of the lava lake. Around midnight on 8 July there were two brief periods of lava overflow onto the lake margins. On 9 July lava ooze-outs were reported near the SE and NE edges of the crater floor and during 10-11 July they occurred near the E, NE, and NW edges. On 16 July crater incandescence was reported, though the ooze-outs and spattering were not visible. On 18 July overnight webcam images showed incandescence in the western vent complex and two ooze-outs were reported around 0000 and 0200 on 19 July. By 0900 there were active ooze-outs along the SW edge of the crater floor. Measurements made from an overflight on 19 July indicated that the crater floor was infilled about 133 m and 98 million cubic meters of lava had erupted since 29 September 2021 (figure 520). On 20 July around 1600 active ooze-outs were visible along the N edge of the crater, which continued through the next day. Extensive ooze-outs occurred along the W margin during 24 July until 1900; on 26 July minor ooze-outs were noted along the N margin. Minor spattering was visible on 29 July along the E margin of the lake. The sulfur dioxide emission rates ranged 650-2,800 tons per day (t/d), the higher of which was measured on 8 July (figure 519).
Activity during August 2022. The eruption continued in the Halema’uma’u crater at the western vent. According to HVO the lava in the active lake remained at the level of the bounding levees. Occasional minor ooze-outs were observed along the margins of the crater floor. Strong nighttime crater incandescence was visible after midnight on 6 August over the western vent cone. During 6-7 August scattered small lava lobes were active along the crater floor and incandescence persisted above the western vent through 9 August. During 7-9 August HVO reported a single lava effusion source was active along the NW margin of the crater floor. Measurements from an overflight on 4 August indicated that the crater floor was infilled about 136 m total and that 102 million cubic meters of lava had been erupted since the start of the eruption. Lava breakouts were reported along the N, NE, E, S, and W margins of the crater during 10-16 August. Another overflight survey conducted on 16 August indicated that the crater floor infilled about 137 m and 104 million cubic meters of lava had been erupted since September 2021. Measured sulfur dioxide emissions rates ranged 1,150-2,450 t/d, the higher of which occurred on 8 August.
Activity during September 2022. During September, lava effusion continued from the western vent into the active lava lake and onto the crater floor. Intermittent minor ooze-outs were reported through the month. A small ooze-out was visible on the W crater floor margin at 0220 on 2 September, which showed decreasing surface activity throughout the day, but remained active through 3 September. On 3 September around 1900 a lava outbreak occurred along the NW margin of the crater floor but had stopped by the evening of 4 September. Field crews monitoring the summit lava lake on 9 September observed spattering on the NE margin of the lake that rose no higher than 10 m, before falling back onto the lava lake crust (figure 521). Overflight measurements on 12 September indicated that the crater floor was infilled a total of 143 m and 111 million cubic meters of lava had been erupted since September 2021. Extensive breakouts in the W and N part of the crater floor were reported at 1600 on 20 September and continued into 26 September. The active part of the lava lake dropped by 10 m while other parts of the crater floor dropped by several meters. Summit tiltmeters recorded a summit seismic swarm of more than 80 earthquakes during 1500-1800 on 21 September, which occurred about 1.5 km below Halema’uma’u; a majority of these were less than Mw 2. By 22 September the active part of the lava lake was infilled about 2 m. On 23 September the western vent areas exhibited several small spatter cones with incandescent openings, along with weak, sporadic spattering (figure 522). The sulfur dioxide emission rate ranged from 930 t/d to 2,000 t/d, the higher of which was measured on 6 September.
Activity during October 2022. Activity during October declined slightly compared to previous months, though lava effusions persisted from the western vent into the active lava lake and onto the crater floor during October (figure 523). Slight variations in the lava lake were noted throughout the month. HVO reported that around 0600 on 3 October the level of the lava lake has lowered slightly. Overflight measurements taken on 5 October indicated that the crater floor was infilled a total of about 143 m and that 111 million cubic meters of lava had been effused since September 2021. During 6-7 October the lake gradually rose 0.5 m. Sulfur dioxide measurements made on 22 October had an emission rate of 700 t/d. Another overflight taken on 28 October showed that there was little to no change in the elevation of the crater floor: the crater floor was infilled a total of 143 m and 111 million cubic meters of lava had erupted since the start of the eruption.
Activity during November 2022. Activity remained low during November, though HVO reported that lava from the western vent continued to effuse into the active lava lake and onto the crater floor throughout the month. The rate of sulfur dioxide emissions during November ranged from 300-600 t/d, the higher amount of which occurred on 9 November.
Activity during December 2022. Similar low activity was reported during December, with lava effusing from the western vent into the active lava lake and onto the crater floor. During 4-5 December the active part of the lava lake was slightly variable in elevation and fluctuated within 1 m. On 9 December HVO reported that lava was no longer erupting from the western vent in the Halema’uma’u crater and that sulfur dioxide emissions had returned to near pre-eruption background levels; during 10-11 December, the lava lake had completely crusted over, and no incandescence was visible (figure 524). Time lapse camera images covering the 4-10 December showed that the crater floor showed weak deflation and no inflation. Some passive events of crustal overturning were reported during 14-15 December, which brought fresh incandescent lava to the lake surface. The sulfur dioxide emission rate was approximately 200 t/d on 14 December. A smaller overturn event on 17 December and another that occurred around 0000 and into the morning of 20 December were also detected. A small seismic swarm was later detected on 30 December.
Geologic Background. Kilauea overlaps the E flank of the massive Mauna Loa shield volcano in the island of Hawaii. Eruptions are prominent in Polynesian legends; written documentation since 1820 records frequent summit and flank lava flow eruptions interspersed with periods of long-term lava lake activity at Halemaumau crater in the summit caldera until 1924. The 3 x 5 km caldera was formed in several stages about 1,500 years ago and during the 18th century; eruptions have also originated from the lengthy East and Southwest rift zones, which extend to the ocean in both directions. About 90% of the surface of the basaltic shield volcano is formed of lava flows less than about 1,100 years old; 70% of the surface is younger than 600 years. The long-term eruption from the East rift zone between 1983 and 2018 produced lava flows covering more than 100 km2, destroyed hundreds of houses, and added new coastline.
Information Contacts: Hawaiian Volcano Observatory (HVO), U.S. Geological Survey, PO Box 51, Hawai'i National Park, HI 96718, USA (URL: http://hvo.wr.usgs.gov/).
Nyamulagira (DR Congo) — November 2023 Cite this Report
Nyamulagira
DR Congo
1.408°S, 29.2°E; summit elev. 3058 m
All times are local (unless otherwise noted)
Lava flows and thermal activity during May-October 2023
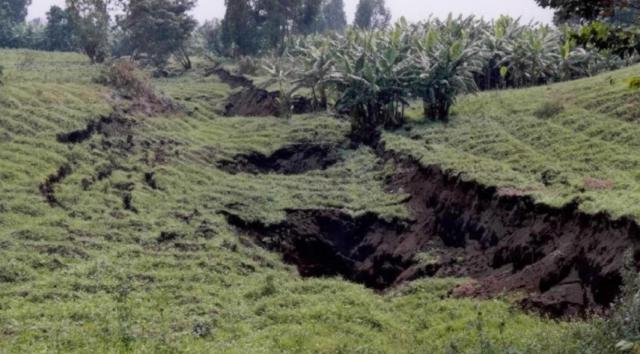
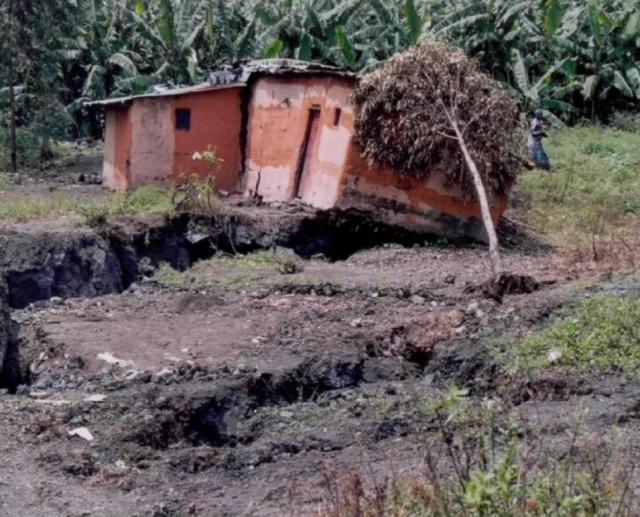
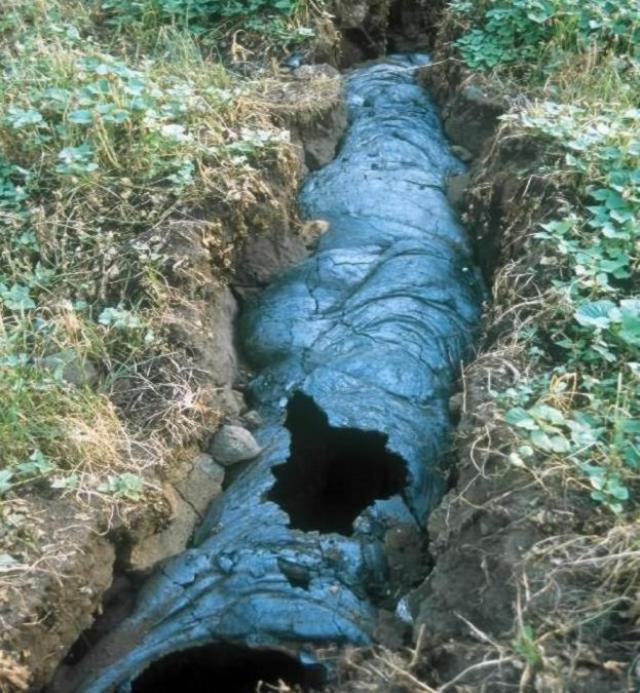
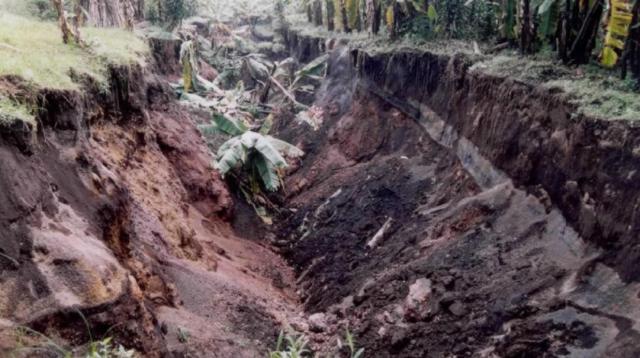
Nyamulagira (also known as Nyamuragira) is a shield volcano in the Democratic Republic of Congo with the summit truncated by a small 2 x 2.3 km caldera with walls up to about 100 m high. Documented eruptions have occurred within the summit caldera, as well as from numerous flank fissures and cinder cones. The current eruption period began in April 2018 and has more recently been characterized by summit crater lava flows and thermal activity (BGVN 48:05). This report describes lava flows and variable thermal activity during May through October 2023, based on information from the Observatoire Volcanologique de Goma (OVG) and various satellite data.
Lava lake activity continued during May. The MIROVA (Middle InfraRed Observation of Volcanic Activity) system recorded moderate-to-strong thermal activity throughout the reporting period; activity was more intense during May and October and relatively weaker from June through September (figure 95). The MODVOLC thermal algorithm, detected a total of 209 thermal alerts. There were 143 hotspots detected during May, eight during June, nine during September, and 49 during October. This activity was also reflected in infrared satellite images, where a lava flow was visible in the NW part of the crater on 7 May and strong activity was seen in the center of the crater on 4 October (figure 96). Another infrared satellite image taken on 12 May showed still active lava flows along the NW margin of the crater. According to OVG lava effusions were active during 7-29 May and moved to the N and NW parts of the crater beginning on 9 May. Strong summit crater incandescence was visible from Goma (27 km S) during the nights of 17, 19, and 20 May (figure 97). On 17 May there was an increase in eruptive activity, which peaked at 0100 on 20 May. Notable sulfur dioxide plumes drifted NW and W during 19-20 May (figure 98). Drone footage acquired in partnership with the USGS (United States Geological Survey) on 20 May captured images of narrow lava flows that traveled about 100 m down the W flank (figure 99). Data from the Rumangabo seismic station indicated a decreasing trend in activity during 17-21 May. Although weather clouds prevented clear views of the summit, a strong thermal signature on the NW flank was visible in an infrared satellite image on 22 May, based on an infrared satellite image. On 28 May the lava flows on the upper W flank began to cool and solidify. By 29 May seismicity returned to levels similar to those recorded before the 17 May increase. Lava effusion continued but was confined to the summit crater; periodic crater incandescence was observed.
Low-level activity was noted during June through October. On 1 June OVG reported that seismicity remained at lower levels and that crater incandescence had been absent for three days, though infrared satellite imagery showed continued lava effusion in the summit crater. The lava flows on the flanks covered an estimated 0.6 km2. Satellite imagery continued to show thermal activity confined to the lava lake through October (figure 96), although no lava flows or significant sulfur dioxide emissions were reported.
Geologic Background. Africa's most active volcano, Nyamulagira (also known as Nyamuragira), is a massive high-potassium basaltic shield about 25 km N of Lake Kivu and 13 km NNW of the steep-sided Nyiragongo volcano. The summit is truncated by a small 2 x 2.3 km caldera that has walls up to about 100 m high. Documented eruptions have occurred within the summit caldera, as well as from the numerous flank fissures and cinder cones. A lava lake in the summit crater, active since at least 1921, drained in 1938, at the time of a major flank eruption. Recent lava flows extend down the flanks more than 30 km from the summit as far as Lake Kivu; extensive lava flows from this volcano have covered 1,500 km2 of the western branch of the East African Rift.
Information Contacts: Observatoire Volcanologique de Goma (OVG), Departement de Geophysique, Centre de Recherche en Sciences Naturelles, Lwiro, D.S. Bukavu, DR Congo; Hawai'i Institute of Geophysics and Planetology (HIGP) - MODVOLC Thermal Alerts System, School of Ocean and Earth Science and Technology (SOEST), Univ. of Hawai'i, 2525 Correa Road, Honolulu, HI 96822, USA (URL: http://modis.higp.hawaii.edu/); MIROVA (Middle InfraRed Observation of Volcanic Activity), a collaborative project between the Universities of Turin and Florence (Italy) supported by the Centre for Volcanic Risk of the Italian Civil Protection Department (URL: http://www.mirovaweb.it/); NASA Global Sulfur Dioxide Monitoring Page, Atmospheric Chemistry and Dynamics Laboratory, NASA Goddard Space Flight Center (NASA/GSFC), 8800 Greenbelt Road, Goddard, Maryland, USA (URL: https://so2.gsfc.nasa.gov/); Copernicus Browser, Copernicus Data Space Ecosystem, European Space Agency (URL: https://dataspace.copernicus.eu/browser/); Charles Balagizi, Goma Volcano Observatory, Departement de Geophysique, Centre de Recherche en Sciences Naturelles, Lwiro, D.S. Bukavu, DR Congo.
Bagana (Papua New Guinea) — October 2023 Cite this Report
Bagana
Papua New Guinea
6.137°S, 155.196°E; summit elev. 1855 m
All times are local (unless otherwise noted)
Explosions, ash plumes, ashfall, and lava flows during April-September 2023
The remote volcano of Bagana is located in central Bougainville Island, Papua New Guinea. Recorded eruptions date back to 1842 and activity has consisted of effusive activity that has built a small lava dome in the summit crater and occasional explosions that produced pyroclastic flows. The most recent eruption has been ongoing since February 2000 and has produced occasional explosions, ash plumes, and lava flows. More recently, activity has been characterized by ongoing effusive activity and ash emissions (BGVN 48:04). This report updates activity from April through September 2023 that has consisted of explosions, ash plumes, ashfall, and lava flows, using information from the Darwin Volcanic Ash Advisory Center (VAAC) and satellite data.
An explosive eruption was reported on 7 July that generated a large gas-and-ash plume to high altitudes and caused significant ashfall in local communities; the eruption plume had reached upper tropospheric (16-18 km altitude) altitudes by 2200, according to satellite images. Sulfur dioxide plumes were detected in satellite images on 8 July and indicated that the plume was likely a mixture of gas, ice, and ash. A report issued by the Autonomous Bougainville Government (ABG) (Torokina District, Education Section) on 10 July noted that significant ash began falling during 2000-2100 on 7 July and covered most areas in the Vuakovi, Gotana (9 km SW), Koromaketo, Laruma (25 km W) and Atsilima (27 km NW) villages. Pyroclastic flows also occurred, according to ground-based reports; small deposits confined to one drainage were inspected by RVO during an overflight on 17 July and were confirmed to be from the 7 July event. Ashfall continued until 10 July and covered vegetation, which destroyed bushes and gardens and contaminated rivers and streams.
RVO reported another eruption on 14 July. The Darwin VAAC stated that an explosive event started around 0830 on 15 July and produced an ash plume that rose to 16.5 km altitude by 1000 and drifted N, according to satellite images. The plume continued to drift N and remained visible through 1900, and by 2150 it had dissipated.
Ashfall likely from both the 7 and 15 July events impacted about 8,111 people in Torokina (20 km SW), including Tsito/Vuakovi, Gotana, Koromaketo, Kenaia, Longkogari, Kenbaki, Piva (13 km SW), and Atsinima, and in the Tsitovi district, according to ABG. Significant ashfall was also reported in Ruruvu (22 km N) in the Wakunai District of Central Bougainville, though the thickness of these deposits could not be confirmed. An evacuation was called for the villages in Wakunai, where heavy ashfall had contaminated water sources; the communities of Ruruvu, Togarau, Kakarapaia, Karauturi, Atao, and Kuritaturi were asked to evacuate to a disaster center at the Wakunai District Station, and communities in Torokina were asked to evacuate to the Piva District station. According to a news article, more than 7,000 people needed temporary accommodations, with about 1,000 people in evacuation shelters. Ashfall had deposited over a broad area, contaminating water supplies, affecting crops, and collapsing some roofs and houses in rural areas. Schools were temporarily shut down. Intermittent ash emissions continued through the end of July and drifted NNW, NW, and SW. Fine ashfall was reported on the coast of Torokina, and ash plumes also drifted toward Laruma and Atsilima.
A small explosive eruption occurred at 2130 on 28 July that ejected material from the crater vents, according to reports from Torokina, in addition to a lava flow that contained two lobes. A second explosion was detected at 2157. Incandescence from the lava flow was visible from Piva as it descended the W flank around 2000 on 29 July (figure 47). The Darwin VAAC reported that a strong thermal anomaly was visible in satellite images during 30-31 July and that ash emissions rose to 2.4 km altitude and drifted WSW on 30 July. A ground report from RVO described localized emissions at 0900 on 31 July.
The Darwin VAAC reported that ash plumes were identified in satellite imagery at 0800 and 1220 on 12 August and rose to 2.1 km and 3 km altitude and drifted NW and W, respectively. A news report stated that aid was sent to more than 6,300 people that were adversely affected by the eruption. Photos taken during 17-19 August showed ash emissions rising no higher than 1 km above the summit and drifting SE. A small explosion generated an ash plume during the morning of 19 August. Deposits from small pyroclastic flows were also captured in the photos. Satellite images captured lava flows and pyroclastic flow deposits. Two temporary seismic stations were installed near Bagana on 17 August at distances of 7 km WSW (Vakovi station) and 11 km SW (Kepox station). The Kepox station immediately started to record continuous, low-frequency background seismicity.
Satellite data. Little to no thermal activity was detected during April through mid-July 2023; only one anomaly was recorded during early April and one during early June, according to MIROVA (Middle InfraRed Observation of Volcanic Activity) data (figure 48). Thermal activity increased in both power and frequency during mid-July through September, although there were still some short gaps in detected activity. MODVOLC also detected increased thermal activity during August; thermal hotspots were detected a total of five times on 19, 20, and 27 August. Weak thermal anomalies were also captured in infrared satellite images on clear weather days throughout the reporting period on 7, 12, and 17 April, 27 May, 1, 6, 16, and 31 July, and 19 September (figure 48); a strong thermal anomaly was visible on 31 July. Distinct sulfur dioxide plumes that drifted generally NW were intermittently captured by the TROPOMI instrument on the Sentinel-5P satellite and sometimes exceeded two Dobson Units (DUs) (figure 49).
Geologic Background. Bagana volcano, in a remote portion of central Bougainville Island, is frequently active. This massive symmetrical cone was largely constructed by an accumulation of viscous andesitic lava flows. The entire edifice could have been constructed in about 300 years at its present rate of lava production. Eruptive activity is characterized by non-explosive effusion of viscous lava that maintains a small lava dome in the summit crater, although occasional explosive activity produces pyroclastic flows. Lava flows with tongue-shaped lobes up to 50 m thick and prominent levees descend the flanks on all sides.
Information Contacts: Rabaul Volcano Observatory (RVO), Geohazards Management Division, Department of Mineral Policy and Geohazards Management (DMPGM), PO Box 3386, Kokopo, East New Britain Province, Papua New Guinea; Darwin Volcanic Ash Advisory Centre (VAAC), Bureau of Meteorology, Northern Territory Regional Office, PO Box 40050, Casuarina, NT 0811, Australia (URL: http://www.bom.gov.au/info/vaac/); MIROVA (Middle InfraRed Observation of Volcanic Activity), a collaborative project between the Universities of Turin and Florence (Italy) supported by the Centre for Volcanic Risk of the Italian Civil Protection Department (URL: http://www.mirovaweb.it/); Hawai'i Institute of Geophysics and Planetology (HIGP) - MODVOLC Thermal Alerts System, School of Ocean and Earth Science and Technology (SOEST), Univ. of Hawai'i, 2525 Correa Road, Honolulu, HI 96822, USA (URL: http://modis.higp.hawaii.edu/); NASA Global Sulfur Dioxide Monitoring Page, Atmospheric Chemistry and Dynamics Laboratory, NASA Goddard Space Flight Center (NASA/GSFC), 8800 Greenbelt Road, Goddard, Maryland, USA (URL: https://so2.gsfc.nasa.gov/); Copernicus Browser, Copernicus Data Space Ecosystem, European Space Agency (URL: https://dataspace.copernicus.eu/browser/); Autonomous Bougainville Government, P.O Box 322, Buka, AROB, PNG (URL: https://abg.gov.pg/); Andrew Tupper (Twitter: @andrewcraigtupp); Simon Carn, Geological and Mining Engineering and Sciences, Michigan Technological University, 1400 Townsend Drive, Houghton, MI 49931, USA (URL: http://www.volcarno.com/, Twitter: @simoncarn); Radio NZ (URL: https://www.rnz.co.nz/news/pacific/494464/more-than-7-000-people-in-bougainville-need-temporary-accommodation-after-eruption); USAID, 1300 Pennsylvania Ave, NW, Washington DC 20004, USA (URL: https://www.usaid.gov/pacific-islands/press-releases/aug-08-2023-united-states-provides-immediate-emergency-assistance-support-communities-affected-mount-bagana-volcanic-eruptions).
Mayon (Philippines) — October 2023 Cite this Report
Mayon
Philippines
13.257°N, 123.685°E; summit elev. 2462 m
All times are local (unless otherwise noted)
Lava flows, pyroclastic flows, ash emissions, and seismicity during April-September 2023
Mayon is located in the Philippines and has steep upper slopes capped by a small summit crater. Historical eruptions date back to 1616 CE that have been characterized by Strombolian eruptions, lava flows, pyroclastic flows, and mudflows. Eruptions mostly originated from a central conduit. Pyroclastic flows and mudflows have commonly descended many of the approximately 40 drainages that surround the volcano. The most recent eruption occurred during June through October 2022 and consisted of lava dome growth and gas-and-steam emissions (BGVN 47:12). A new eruption was reported during late April 2023 and has included lava flows, pyroclastic density currents, ash emissions, and seismicity. This report covers activity during April through September 2023 based on daily bulletins from the Philippine Institute of Volcanology and Seismology (PHIVOLCS).
During April through September 2023, PHIVOLCS reported near-daily rockfall events, frequent volcanic earthquakes, and sulfur dioxide measurements. Gas-and-steam emissions rose 100-900 m above the crater and drifted in different directions. Nighttime crater incandescence was often visible during clear weather and was accompanied by incandescent avalanches of material. Activity notably increased during June when lava flows were reported on the S, SE, and E flanks (figure 52). The MIROVA graph (Middle InfraRed Observation of Volcanic Activity) showed strong thermal activity coincident with these lava flows, which remained active through September (figure 53). According to the MODVOLC thermal algorithm, a total of 110 thermal alerts were detected during the reporting period: 17 during June, 40 during July, 27 during August, and 26 during September. During early June, pyroclastic density currents (PDCs) started to occur more frequently.
Low activity was reported during much of April and May; gas-and-steam emissions rose 100-900 m above the crater and generally drifted in different directions. A total of 52 rockfall events and 18 volcanic earthquakes were detected during April and 147 rockfall events and 13 volcanic events during May. Sulfur dioxide flux measurements ranged between 400-576 tons per day (t/d) during April, the latter of which was measured on 29 April and between 162-343 t/d during May, the latter of which was measured on 13 May.
Activity during June increased, characterized by lava flows, pyroclastic density currents (PDCs), crater incandescence and incandescent rockfall events, gas-and-steam emissions, and continued seismicity. Weather clouds often prevented clear views of the summit, but during clear days, moderate gas-and-steam emissions rose 100-2,500 m above the crater and drifted in multiple directions. A total of 6,237 rockfall events and 288 volcanic earthquakes were detected. The rockfall events often deposited material on the S and SE flanks within 700-1,500 m of the summit crater and ash from the events drifted SW, S, SE, NE, and E. Sulfur dioxide emissions ranged between 149-1,205 t/d, the latter of which was measured on 10 June. Short-term observations from EDM and electronic tiltmeter monitoring indicated that the upper slopes were inflating since February 2023. Longer-term ground deformation parameters based on EDM, precise leveling, continuous GPS, and electronic tilt monitoring indicated that the volcano remained inflated, especially on the NW and SE flanks. At 1000 on 5 June the Volcano Alert Level (VAL) was raised to 2 (on a 0-5 scale). PHIVOLCS noted that although low-level volcanic earthquakes, ground deformation, and volcanic gas emissions indicated unrest, the steep increase in rockfall frequency may indicate increased dome activity.
A total of 151 dome-collapse PDCs occurred during 8-9 and 11-30 June, traveled 500-2,000 m, and deposited material on the S flank within 2 km of the summit crater. During 8-9 June the VAL was raised to 3. At approximately 1947 on 11 June lava flow activity was reported; two lobes traveled within 500 m from the crater and deposited material on the S (Mi-isi), SE (Bonga), and E (Basud) flanks. Weak seismicity accompanied the lava flow and slight inflation on the upper flanks. This lava flow remained active through 30 June, moving down the S and SE flank as far as 2.5 km and 1.8 km, respectively and depositing material up to 3.3 km from the crater. During 15-16 June traces of ashfall from the PDCs were reported in Sitio Buga, Nabonton, City of Ligao and Purok, and San Francisco, Municipality of Guinobatan. During 28-29 June there were two PDCs generated by the collapse of the lava flow front, which generated a light-brown ash plume 1 km high. Satellite monitors detected significant concentrations of sulfur dioxide beginning on 29 June. On 30 June PDCs primarily affected the Basud Gully on the E flank, the largest of which occurred at 1301 and lasted eight minutes, based on the seismic record. Four PDCs generated between 1800 and 2000 that lasted approximately four minutes each traveled 3-4 km on the E flank and generated an ash plume that rose 1 km above the crater and drifted N and NW. Ashfall was recorded in Tabaco City.
Similar strong activity continued during July; slow lava effusion remained active on the S and SE flanks and traveled as far as 2.8 km and 2.8 km, respectively and material was deposited as far as 4 km from the crater. There was a total of 6,983 rockfall events and 189 PDCs that affected the S, SE, and E flanks. The volcano network detected a total of 2,124 volcanic earthquakes. Continuous gas-and-steam emissions rose 200-2,000 m above the crater and drifted in multiple directions. Sulfur dioxide emissions averaged 792-4,113 t/d, the latter of which was measured on 28 July. During 2-4 July three PDCs were generated from the collapse of the lava flow and resulting light brown plumes rose 200-300 m above the crater. Continuous tremor pulses were reported beginning at 1547 on 3 July through 7 July at 1200, at 2300 on 8 July and going through 0300 on 10 July, and at 2300 on 16 July, as recorded by the seismic network. During 6-9 July there were 10 lava flow-collapse-related PDCs that generated light brown plumes 300-500 m above the crater. During 10-11 July light ashfall was reported in some areas of Mabinit, Legazpi City, Budiao and Salvacion, Daraga, and Camalig, Albay. By 18 July the lava flow advanced 600 m on the E flank as well.
During 1733 on 18 July and 0434 on 19 July PHIVOLCS reported 30 “ashing” events, which are degassing events accompanied by audible thunder-like sounds and entrained ash at the crater, which produced short, dark plumes that drifted SW. These events each lasted 20-40 seconds, and plume heights ranged from 150-300 m above the crater, as recorded by seismic, infrasound, visual, and thermal monitors. Three more ashing events occurred during 19-20 July. Short-term observations from electronic tilt and GPS monitoring indicate deflation on the E lower flanks in early July and inflation on the NW middle flanks during the third week of July. Longer-term ground deformation parameters from EDM, precise leveling, continuous GPS, and electronic tilt monitoring indicated that the volcano was still generally inflated relative to baseline levels. A short-lived lava pulse lasted 28 seconds at 1956 on 21 July, which was accompanied by seismic and infrasound signals. By 22 July, the only lava flow that remained active was on the SE flank, and continued to extend 3.4 km, while those on the S and E flanks weakened markedly. One ashing event was detected during 30-31 July, whereas there were 57 detected during 31 July-1 August; according to PHIVOLCS beginning at approximately 1800 on 31 July eruptive activity was dominated by phases of intermittent ashing, as well as increased in the apparent rates of lava effusion from the summit crater. The ashing phases consisted of discrete events recorded as low-frequency volcanic earthquakes (LFVQ) typically 30 seconds in duration, based on seismic and infrasound signals. Gray ash plume rose 100 m above the crater and generally drifted NE. Shortly after these ashing events began, new lava began to effuse rapidly from the crater, feeding the established flowed on the SE, E, and E flanks and generating frequent rockfall events.
Intensified unrest persisted during August. There was a total of 4,141 rockfall events, 2,881 volcanic earthquakes, which included volcanic tremor events, 32 ashing events, and 101 PDCs detected throughout the month. On clear weather days, gas-and-steam emissions rose 300-1,500 m above the crater and drifted in different directions (figure 54). Sulfur dioxide emissions averaged 735-4,756 t/d, the higher value of which was measured on 16 August. During 1-2 August the rate of lava effusion decreased, but continued to feed the flows on the SE, S, and E flanks, maintaining their advances to 3.4 km, 2.8 km, and 1.1 km from the crater, respectively (figure 55). Rockfall and PDCs generated by collapses at the lava flow margins and from the summit dome deposited material within 4 km of the crater. During 3-4 August there were 10 tremor events detected that lasted 1-4 minutes. Short-lived lava pulse lasted 35 seconds and was accompanied by seismic and infrasound signals at 0442 on 6 August. Seven collapses were recorded at the front of the lava flow during 12-14 August.
During September, similar activity of slow lava effusion, PDCs, gas-and-steam emissions, and seismicity continued. There was a total of 4,452 rockfall events, 329 volcanic earthquakes, which included volcanic tremor events, two ashing events, and 85 PDCs recorded throughout the month. On clear weather days, gas-and-steam emissions rose 100-1,500 m above the crater and drifted in multiple directions. Sulfur dioxide emissions averaged 609-2,252 t/d, the higher average of which was measured on 6 September. Slow lava effusion continued advancing on the SE, S, and E flanks, maintaining lengths of 3.4 km, 2.8 km, and 1.1 km, respectively. Rockfall and PDC events generated by collapses along the lava flow margins and at the summit dome deposited material within 4 km of the crater.
Geologic Background. Symmetrical Mayon, which rises above the Albay Gulf NW of Legazpi City, is the most active volcano of the Philippines. The steep upper slopes are capped by a small summit crater. Recorded eruptions since 1616 CE range from Strombolian to basaltic Plinian, with cyclical activity beginning with basaltic eruptions, followed by longer periods of andesitic lava flows. Eruptions occur predominately from the central conduit and have also produced lava flows that travel far down the flanks. Pyroclastic density currents and mudflows have commonly swept down many of the approximately 40 ravines that radiate from the summit and have often damaged populated lowland areas. A violent eruption in 1814 killed more than 1,200 people and devastated several towns.
Information Contacts: Philippine Institute of Volcanology and Seismology (PHIVOLCS), Department of Science and Technology, University of the Philippines Campus, Diliman, Quezon City, Philippines (URL: http://www.phivolcs.dost.gov.ph/); MIROVA (Middle InfraRed Observation of Volcanic Activity), a collaborative project between the Universities of Turin and Florence (Italy) supported by the Centre for Volcanic Risk of the Italian Civil Protection Department (URL: http://www.mirovaweb.it/); Hawai'i Institute of Geophysics and Planetology (HIGP) - MODVOLC Thermal Alerts System, School of Ocean and Earth Science and Technology (SOEST), Univ. of Hawai'i, 2525 Correa Road, Honolulu, HI 96822, USA (URL: http://modis.higp.hawaii.edu/); Copernicus Browser, Copernicus Data Space Ecosystem, European Space Agency (URL: https://dataspace.copernicus.eu/browser/); William Rogers, Legazpi City, Albay Province, Philippines.
Nishinoshima (Japan) — October 2023 Cite this Report
Nishinoshima
Japan
27.247°N, 140.874°E; summit elev. 100 m
All times are local (unless otherwise noted)
Eruption plumes and gas-and-steam plumes during May-August 2023
Nishinoshima, located about 1,000 km S of Tokyo, is a small island in the Ogasawara Arc in Japan. The island is the summit of a massive submarine volcano that has prominent submarine peaks to the S, W, and NE. Eruptions date back to 1973 and the current eruption period began in October 2022. Recent activity has consisted of small ash plumes and fumarolic activity (BGVN 48:07). This report covers activity during May through August 2023, using information from monthly reports of the Japan Meteorological Agency (JMA) monthly reports and satellite data.
Activity during May through June was relatively low. The Japan Coast Guard (JCG) did overflights on 14 and 22 June and reported white gas-and-steam emissions rising 600 m and 1,200 m from the central crater of the pyroclastic cone, respectively (figure 125). In addition, multiple white gas-and-steam emissions rose from the inner rim of the W side of the crater and from the SE flank of the pyroclastic cone. Discolored brown-to-green water was observed around almost the entire perimeter of the island; on 22 June light green discolored water was observed off the S coast of the island.
Observations from the Himawari meteorological satellite confirmed an eruption on 9 and 10 July. An eruption plume rose 1.6 km above the crater and drifted N around 1300 on 9 July. Satellite images acquired at 1420 and 2020 on 9 July and at 0220 on 10 July showed continuing emissions that rose 1.3-1.6 km above the crater and drifted NE and N. The Tokyo VAAC reported that an ash plume seen by a pilot and identified in a satellite image at 0630 on 21 July rose to 3 km altitude and drifted S.
Aerial observations conducted by JCG on 8 August showed a white-and-gray plume rising from the central crater of the pyroclastic cone, and multiple white gas-and-steam emissions were rising from the inner edge of the western crater and along the NW-SE flanks of the island (figure 126). Brown-to-green discolored water was also noted around the perimeter of the island.
Intermittent low-to-moderate power thermal anomalies were recorded in the MIROVA graph (Middle InfraRed Observation of Volcanic Activity), showing an increase in both frequency and power beginning in July (figure 127). This increase in activity coincides with eruptive activity on 9 and 10 July, characterized by eruption plumes. According to the MODVOLC thermal alert algorithm, one thermal hotspot was recorded on 20 July. Weak thermal anomalies were also detected in infrared satellite imagery, accompanied by strong gas-and-steam plumes (figure 128).
Geologic Background. The small island of Nishinoshima was enlarged when several new islands coalesced during an eruption in 1973-74. Multiple eruptions that began in 2013 completely covered the previous exposed surface and continued to enlarge the island. The island is the summit of a massive submarine volcano that has prominent peaks to the S, W, and NE. The summit of the southern cone rises to within 214 m of the ocean surface 9 km SSE.
Information Contacts: Japan Meteorological Agency (JMA), 1-3-4 Otemachi, Chiyoda-ku, Tokyo 100-8122, Japan (URL: http://www.jma.go.jp/jma/indexe.html); Tokyo Volcanic Ash Advisory Center (VAAC), 1-3-4 Otemachi, Chiyoda-ku, Tokyo 100-8122, Japan (URL: http://ds.data.jma.go.jp/svd/vaac/data/); MIROVA (Middle InfraRed Observation of Volcanic Activity), a collaborative project between the Universities of Turin and Florence (Italy) supported by the Centre for Volcanic Risk of the Italian Civil Protection Department (URL: http://www.mirovaweb.it/); Copernicus Browser, Copernicus Data Space Ecosystem, European Space Agency (URL: https://dataspace.copernicus.eu/browser/).
Krakatau (Indonesia) — October 2023 Cite this Report
Krakatau
Indonesia
6.1009°S, 105.4233°E; summit elev. 285 m
All times are local (unless otherwise noted)
White gas-and-steam plumes and occasional ash plumes during May-August 2023
Krakatau is located in the Sunda Strait between Java and Sumatra, Indonesia. Caldera collapse during the catastrophic 1883 eruption destroyed Danan and Perbuwatan cones and left only a remnant of Rakata. The post-collapse cone of Anak Krakatau (Child of Krakatau) was constructed within the 1883 caldera at a point between the former Danan and Perbuwatan cones; it has been the site of frequent eruptions since 1927. The current eruption period began in May 2021 and has recently consisted of Strombolian eruptions and ash plumes (BGVN 48:07). This report describes lower levels of activity consisting of ash and white gas-and-steam plumes during May through August 2023, based on information provided by the Indonesian Center for Volcanology and Geological Hazard Mitigation, referred to as Pusat Vulkanologi dan Mitigasi Bencana Geologi (PVMBG), MAGMA Indonesia, and satellite data.
Activity was relatively low during May and June. Daily white gas-and-steam emissions rose 25-200 m above the crater and drifted in different directions. Five ash plumes were detected at 0519 on 10 May, 1241 on 11 May, 0920 on 12 May, 2320 on 12 May, and at 0710 on 13 May, and rose 1-2.5 km above the crater and drifted SW. A webcam image taken on 12 May showed ejection of incandescent material above the vent. A total of nine ash plumes were detected during 6-11 June: at 1434 and 00220 on 6 and 7 June the ash plumes rose 500 m above the crater and drifted NW, at 1537 on 8 June the ash plume rose 1 km above the crater and drifted SW, at 0746 and at 0846 on 9 June the ash plumes rose 800 m and 3 km above the crater and drifted SW, respectively, at 0423, 1431, and 1750 on 10 June the ash plumes rose 2 km, 1.5 km, and 3.5 km above the crater and drifted NW, respectively, and at 0030 on 11 June an ash plume rose 2 km above the crater and drifted NW. Webcam images taken on 10 and 11 June at 0455 and 0102, respectively, showed incandescent material ejected above the vent. On 19 June an ash plume at 0822 rose 1.5 km above the crater and drifted SE.
Similar low activity of white gas-and-steam emissions and few ash plumes were reported during July and August. Daily white gas-and-steam emissions rose 25-300 m above the crater and drifted in multiple directions. Three ash plumes were reported at 0843, 0851, and 0852 on 20 July that rose 500-2,000 m above the crater and drifted NW.
The MIROVA (Middle InfraRed Observation of Volcanic Activity) graph of MODIS thermal anomaly data showed intermittent low-to-moderate power thermal anomalies during May through August 2023 (figure 140). Although activity was often obscured by weather clouds, a thermal anomaly was visible in an infrared satellite image of the crater on 12 May, accompanied by an eruption plume that drifted SW (figure 141).
Geologic Background. The renowned Krakatau (frequently mis-named as Krakatoa) volcano lies in the Sunda Strait between Java and Sumatra. Collapse of an older edifice, perhaps in 416 or 535 CE, formed a 7-km-wide caldera. Remnants of that volcano are preserved in Verlaten and Lang Islands; subsequently the Rakata, Danan, and Perbuwatan cones were formed, coalescing to create the pre-1883 Krakatau Island. Caldera collapse during the catastrophic 1883 eruption destroyed Danan and Perbuwatan, and left only a remnant of Rakata. This eruption caused more than 36,000 fatalities, most as a result of tsunamis that swept the adjacent coastlines of Sumatra and Java. Pyroclastic surges traveled 40 km across the Sunda Strait and reached the Sumatra coast. After a quiescence of less than a half century, the post-collapse cone of Anak Krakatau (Child of Krakatau) was constructed within the 1883 caldera at a point between the former Danan and Perbuwatan cones. Anak Krakatau has been the site of frequent eruptions since 1927.
Information Contacts: Pusat Vulkanologi dan Mitigasi Bencana Geologi (PVMBG, also known as Indonesian Center for Volcanology and Geological Hazard Mitigation, CVGHM), Jalan Diponegoro 57, Bandung 40122, Indonesia (URL: http://www.vsi.esdm.go.id/); MAGMA Indonesia, Kementerian Energi dan Sumber Daya Mineral (URL: https://magma.esdm.go.id/v1); MIROVA (Middle InfraRed Observation of Volcanic Activity), a collaborative project between the Universities of Turin and Florence (Italy) supported by the Centre for Volcanic Risk of the Italian Civil Protection Department (URL: http://www.mirovaweb.it/); Copernicus Browser, Copernicus Data Space Ecosystem, European Space Agency (URL: https://dataspace.copernicus.eu/browser/).
Villarrica (Chile) — October 2023 Cite this Report
Villarrica
Chile
39.42°S, 71.93°W; summit elev. 2847 m
All times are local (unless otherwise noted)
Strombolian activity, gas-and-ash emissions, and crater incandescence during April-September 2023
Villarrica, in central Chile, consists of a 2-km-wide caldera that formed about 3,500 years ago and is located at the base of the presently active cone at the NW margin of a 6-km-wide caldera. Historical eruptions eruptions date back to 1558 and have been characterized by mild-to-moderate explosive activity with occasional lava effusions. The current eruption period began in December 2014 and has recently consisted of nighttime crater incandescence, ash emissions, and seismicity (BGVN 48:04). This report covers activity during April through September 2023 and describes occasional Strombolian activity, gas-and-ash emissions, and nighttime crater incandescence. Information for this report primarily comes from the Southern Andes Volcano Observatory (Observatorio Volcanológico de Los Andes del Sur, OVDAS), part of Chile's National Service of Geology and Mining (Servicio Nacional de Geología y Minería, SERNAGEOMIN) and satellite data.
Seismicity during April consisted of long period (LP) events and tremor (TRE); a total of 9,413 LP-type events and 759 TR-type events were detected throughout the month. Nighttime crater incandescence persisted and was visible in the degassing column. Sulfur dioxide data was obtained using Differential Absorption Optical Spectroscopy Equipment (DOAS) that showed an average value of 1,450 ± 198 tons per day (t/d) during 1-15 April and 1,129 ± 201 t/d during 16-30 April, with a maximum daily value of 2,784 t/d on 9 April. Gas-and-steam emissions of variable intensities rose above the active crater as high as 1.3 km above the crater on 13 April. Strombolian explosions were not observed and there was a slight decrease in the lava lake level.
There were 14,123 LP-type events and 727 TR-type events detected during May. According to sulfur dioxide measurements taken with DOAS equipment, the active crater emitted an average value of 1,826 ± 482 t/d during 1-15 May and 912 ± 41 t/d during 16-30 May, with a daily maximum value of 5,155 t/d on 13 May. Surveillance cameras showed continuous white gas-and-steam emissions that rose as high as 430 m above the crater on 27 May. Nighttime incandescence illuminated the gas column less than 300 m above the crater rim was and no pyroclastic emissions were reported. A landslide was identified on 13 May on the E flank of the volcano 50 m from the crater rim and extending 300 m away; SERNAGEOMIN noted that this event may have occurred on 12 May. During the morning of 27 and 28 May minor Strombolian explosions characterized by incandescent ejecta were recorded at the crater rim; the last reported Strombolian explosions had occurred at the end of March.
Seismic activity during June consisted of five volcano-tectonic (VT)-type events, 21,606 LP-type events, and 2,085 TR-type events. The average value of sulfur dioxide flux obtained by DOAS equipment was 1,420 ± 217 t/d during 1-15 June and 2,562 ± 804 t/d, with a maximum daily value of 4,810 t/d on 17 June. White gas-and-steam emissions rose less than 480 m above the crater; frequent nighttime crater incandescence was reflected in the degassing plume. On 12 June an emission rose 100 m above the crater and drifted NNW. On 15 June one or several emissions resulted in ashfall to the NE as far as 5.5 km from the crater, based on a Skysat satellite image. Several Strombolian explosions occurred within the crater; activity on 15 June was higher energy and ejected blocks 200-300 m on the NE slope. Surveillance cameras showed white gas-and-steam emissions rising 480 m above the crater on 16 June. On 19 and 24 June low-intensity Strombolian activity was observed, ejecting material as far as 200 m from the center of the crater to the E.
During July, seismicity included 29,319 LP-type events, 3,736 TR-type events, and two VT-type events. DOAS equipment recorded two days of sulfur dioxide emissions of 4,220 t/d and 1,009 t/d on 1 and 13 July, respectively. Constant nighttime incandescence was also recorded and was particularly noticeable when accompanied by eruptive columns on 12 and 16 July. Minor explosive events were detected in the crater. According to Skysat satellite images taken on 12, 13, and 16 July, ashfall deposits were identified 155 m S of the crater. According to POVI, incandescence was visible from two vents on the crater floor around 0336 on 12 July. Gas-and-ash emissions rose as high as 1.2 km above the crater on 13 July and drifted E and NW. A series of gas-and-steam pulses containing some ash deposited material on the upper E flank around 1551 on 13 July. During 16-31 July, average sulfur dioxide emissions of 1,679 ± 406 t/d were recorded, with a maximum daily value of 2,343 t/d on 28 July. Fine ash emissions were also reported on 16, 17, and 23 July.
Seismicity persisted during August, characterized by 27,011 LP-type events, 3,323 TR-type events, and three VT-type events. The average value of sulfur dioxide measurements taken during 1-15 August was 1,642 ± 270 t/d and 2,207 ± 4,549 t/d during 16-31 August, with a maximum daily value of 3,294 t/d on 27 August. Nighttime crater incandescence remained visible in degassing columns. White gas-and-steam emissions rose 480 m above the crater on 6 August. According to a Skysat satellite image from 6 August, ash accumulation was observed proximal to the crater and was mainly distributed toward the E slope. White gas-and-steam emissions rose 320 m above the crater on 26 August. Nighttime incandescence and Strombolian activity that generated ash emissions were reported on 27 August.
Seismicity during September was characterized by five VT-type events, 12,057 LP-type events, and 2,058 TR-type events. Nighttime incandescence persisted. On 2 September an ash emission rose 180 m above the crater and drifted SE at 1643 (figure 125) and a white gas-and-steam plume rose 320 m above the crater. According to the Buenos Aires VAAC, periods of continuous gas-and-ash emissions were visible in webcam images from 1830 on 2 September to 0110 on 3 September. Strombolian activity was observed on 2 September and during the early morning of 3 September, the latter event of which generated an ash emission that rose 60 m above the crater and drifted 100 m from the center of the crater to the NE and SW. Ashfall was reported to the SE and S as far as 750 m from the crater. The lava lake was active during 3-4 September and lava fountaining was visible for the first time since 26 March 2023, according to POVI. Fountains captured in webcam images at 2133 on 3 September and at 0054 on 4 September rose as high as 60 m above the crater rim and ejected material onto the upper W flank. Sulfur dioxide flux of 1,730 t/d and 1,281 t/d was measured on 3 and 4 September, respectively, according to data obtained by DOAS equipment.
Strong Strombolian activity and larger gas-and-ash plumes were reported during 18-20 September. On 18 September activity was also associated with energetic LP-type events and notable sulfur dioxide fluxes (as high as 4,277 t/d). On 19 September Strombolian activity and incandescence were observed. On 20 September at 0914 ash emissions rose 50 m above the crater and drifted SSE, accompanied by Strombolian activity that ejected material less than 100 m SSE, causing fall deposits on that respective flank. SERNAGEOMIN reported that a Planet Scope satellite image taken on 20 September showed the lava lake in the crater, measuring 32 m x 35 m and an area of 0.001 km2. Several ash emissions were recorded at 0841, 0910, 1251, 1306, 1312, 1315, and 1324 on 23 September and rose less than 150 m above the crater. The sulfur dioxide flux value was 698 t/d on 23 September and 1,097 t/d on 24 September. On 24 September the Volcanic Alert Level (VAL) was raised to Orange (the third level on a four-color scale). SENAPRED maintained the Alert Level at Yellow (the middle level on a three-color scale) for the communities of Villarrica, Pucón (16 km N), Curarrehue, and Panguipulli.
During 24-25 September there was an increase in seismic energy (observed at TR-events) and acoustic signals, characterized by 1 VT-type event, 213 LP-type events, and 124 TR-type events. Mainly white gas-and-steam emissions, in addition to occasional fine ash emissions were recorded. During the early morning of 25 September Strombolian explosions were reported and ejected material 250 m in all directions, though dominantly toward the NW. On 25 September the average value of sulfur dioxide flux was 760 t/d. Seismicity during 25-30 September consisted of five VT-type events, 1,937 LP-type events, and 456 TR-type events.
During 25-29 September moderate Strombolian activity was observed and ejected material as far as the crater rim. In addition, ash pulses lasting roughly 50 minutes were observed around 0700 and dispersed ENE. During 26-27 September a TR episode lasted 6.5 hours and was accompanied by discrete acoustic signals. Satellite images from 26 September showed a spatter cone on the crater floor with one vent that measured 10 x 14 m and a smaller vent about 35 m NE of the cone. SERNAGEOMIN reported an abundant number of bomb-sized blocks up to 150 m from the crater, as well as impact marks on the snow, which indicated explosive activity. A low-altitude ash emission was observed drifting NW around 1140 on 28 September, based on webcam images. Between 0620 and 0850 on 29 September an ash emission rose 60 m above the crater and drifted NW. During an overflight taken around 1000 on 29 September scientists observed molten material in the vent, a large accumulation of pyroclasts inside the crater, and energetic degassing, some of which contained a small amount of ash. Block-sized pyroclasts were deposited on the internal walls and near the crater, and a distal ash deposit was also visible. The average sulfur dioxide flux measured on 28 September was 344 t/d. Satellite images taken on 29 September ashfall was deposited roughly 3 km WNW from the crater and nighttime crater incandescence remained visible. The average sulfur dioxide flux value from 29 September was 199 t/d. On 30 September at 0740 a pulsating ash emission rose 1.1 km above the crater and drifted NNW (figure 126). Deposits on the S flank extended as far as 4.5 km from the crater rim, based on satellite images from 30 September.
Infrared MODIS satellite data processed by MIROVA (Middle InfraRed Observation of Volcanic Activity) showed intermittent thermal activity during April through September, with slightly stronger activity detected during late September (figure 127). Small clusters of thermal activity were detected during mid-June, early July, early August, and late September. According to the MODVOLC thermal alert system, a total of four thermal hotspots were detected on 7 July and 3 and 23 September. This activity was also intermittently captured in infrared satellite imagery on clear weather days (figure 128).
Geologic Background. The glacier-covered Villarrica stratovolcano, in the northern Lakes District of central Chile, is ~15 km south of the city of Pucon. A 2-km-wide caldera that formed about 3,500 years ago is located at the base of the presently active, dominantly basaltic to basaltic andesite cone at the NW margin of a 6-km-wide Pleistocene caldera. More than 30 scoria cones and fissure vents are present on the flanks. Plinian eruptions and pyroclastic flows that have extended up to 20 km from the volcano were produced during the Holocene. Lava flows up to 18 km long have issued from summit and flank vents. Eruptions documented since 1558 CE have consisted largely of mild-to-moderate explosive activity with occasional lava effusion. Glaciers cover 40 km2 of the volcano, and lahars have damaged towns on its flanks.
Information Contacts: Servicio Nacional de Geología y Minería (SERNAGEOMIN), Observatorio Volcanológico de Los Andes del Sur (OVDAS), Avda Sta María No. 0104, Santiago, Chile (URL: http://www.sernageomin.cl/); Proyecto Observación Villarrica Internet (POVI) (URL: http://www.povi.cl/); Sistema y Servicio Nacional de Prevención y Repuesta Ante Desastres (SENAPRED), Av. Beauchef 1671, Santiago, Chile (URL: https://web.senapred.cl/); Buenos Aires Volcanic Ash Advisory Center (VAAC), Servicio Meteorológico Nacional-Fuerza Aérea Argentina, 25 de mayo 658, Buenos Aires, Argentina (URL: http://www.smn.gov.ar/vaac/buenosaires/inicio.php); MIROVA (Middle InfraRed Observation of Volcanic Activity), a collaborative project between the Universities of Turin and Florence (Italy) supported by the Centre for Volcanic Risk of the Italian Civil Protection Department (URL: http://www.mirovaweb.it/); Hawai'i Institute of Geophysics and Planetology (HIGP) - MODVOLC Thermal Alerts System, School of Ocean and Earth Science and Technology (SOEST), Univ. of Hawai'i, 2525 Correa Road, Honolulu, HI 96822, USA (URL: http://modis.higp.hawaii.edu/); Copernicus Browser, Copernicus Data Space Ecosystem, European Space Agency (URL: https://dataspace.copernicus.eu/browser/).
Merapi (Indonesia) — October 2023 Cite this Report
Merapi
Indonesia
7.54°S, 110.446°E; summit elev. 2910 m
All times are local (unless otherwise noted)
Frequent incandescent avalanches during April-September 2023
Merapi, located just north of the major city of Yogyakarta in central Java, Indonesia, has had activity within the last 20 years characterized by pyroclastic flows and lahars accompanying growth and collapse of the steep-sided active summit lava dome. The current eruption period began in late December 2020 and has more recently consisted of ash plumes, intermittent incandescent avalanches of material, and pyroclastic flows (BGVN 48:04). This report covers activity during April through September 2023, based on information from Balai Penyelidikan dan Pengembangan Teknologi Kebencanaan Geologi (BPPTKG), the Center for Research and Development of Geological Disaster Technology, a branch of PVMBG which specifically monitors Merapi. Additional information comes from the Pusat Vulkanologi dan Mitigasi Bencana Geologi (PVMBG, also known as Indonesian Center for Volcanology and Geological Hazard Mitigation, CVGHM), MAGMA Indonesia, the Darwin Volcanic Ash Advisory Centre (VAAC), and various satellite data.
Activity during April through September 2023 primarily consisted of incandescent avalanches of material that mainly affected the SW and W flanks and traveled as far as 2.3 km from the summit (table 25) and white gas-and-steam emissions that rose 10-1,000 m above the crater.
Table 25. Monthly summary of avalanches and avalanche distances recorded at Merapi during April through September 2023. The number of reported avalanches does not include instances where possible avalanches were heard but could not be visually confirmed as a result of inclement weather. Data courtesy of BPPTKG (April-September 2023 daily reports).
| Month |
Average number of avalanches per day |
Distance avalanches traveled (m) |
| Apr 2023 |
19 |
1,200-2,000 |
| May 2023 |
22 |
500-2,000 |
| Jun 2023 |
18 |
1,200-2,000 |
| Jul 2023 |
30 |
300-2,000 |
| Aug 2023 |
25 |
400-2,300 |
| Sep 2023 |
23 |
600-2,000 |
BPPTKG reported that during April and May white gas-and-steam emissions rose 10-750 m above the crater, incandescent avalanches descended 500-2,000 m on the SW and W flanks (figure 135). Cloudy weather often prevented clear views of the summit, and sometimes avalanches could not be confirmed. According to a webcam image, a pyroclastic flow was visible on 17 April at 0531. During the week of 28 April and 4 May a pyroclastic flow was reported on the SW flank, traveling up to 2.5 km. According to a drone overflight taken on 17 May the SW lava dome volume was an estimated 2,372,800 cubic meters and the dome in the main crater was an estimated 2,337,300 cubic meters.
During June and July similar activity persisted with white gas-and-steam emissions rising 10-350 m above the crater and frequent incandescent avalanches that traveled 300-2,000 m down the SW, W, and S flanks (figure 136). Based on an analysis of aerial photos taken on 24 June the volume of the SW lava dome was approximately 2.5 million cubic meters. A pyroclastic flow was observed on 5 July that traveled 2.7 km on the SW flank. According to the Darwin VAAC multiple minor ash plumes were identified in satellite images on 19 July that rose to 3.7 km altitude and drifted S and SW. During 22, 25, and 26 July a total of 17 avalanches descended as far as 1.8 km on the S flank.
Frequent white gas-and-steam emissions continued during August and September, rising 10-450 m above the crater. Incandescent avalanches mainly affected the SW and W flanks and traveled 400-2,300 m from the vent (figure 137). An aerial survey conducted on 10 August was analyzed and reported that estimates of the SW dome volume was 2,764,300 cubic meters and the dome in the main crater was 2,369,800 cubic meters.
Frequent and moderate-power thermal activity continued throughout the reporting period, according to a MIROVA (Middle InfraRed Observation of Volcanic Activity) analysis of MODIS satellite data (figure 138). There was an increase in the number of detected anomalies during mid-May. The MODVOLC thermal algorithm recorded a total of 47 thermal hotspots: six during April, nine during May, eight during June, 15 during July, four during August, and five during September. Some of this activity was captured in infrared satellite imagery on clear weather days, sometimes accompanied by incandescent material on the SW flank (figure 139).
Geologic Background. Merapi, one of Indonesia's most active volcanoes, lies in one of the world's most densely populated areas and dominates the landscape immediately north of the major city of Yogyakarta. It is the youngest and southernmost of a volcanic chain extending NNW to Ungaran volcano. Growth of Old Merapi during the Pleistocene ended with major edifice collapse perhaps about 2,000 years ago, leaving a large arcuate scarp cutting the eroded older Batulawang volcano. Subsequent growth of the steep-sided Young Merapi edifice, its upper part unvegetated due to frequent activity, began SW of the earlier collapse scarp. Pyroclastic flows and lahars accompanying growth and collapse of the steep-sided active summit lava dome have devastated cultivated lands on the western-to-southern flanks and caused many fatalities.
Information Contacts: Balai Penyelidikan dan Pengembangan Teknologi Kebencanaan Geologi (BPPTKG), Center for Research and Development of Geological Disaster Technology (URL: http://merapi.bgl.esdm.go.id/, Twitter: @BPPTKG); MAGMA Indonesia, Kementerian Energi dan Sumber Daya Mineral (URL: https://magma.esdm.go.id/v1); Pusat Vulkanologi dan Mitigasi Bencana Geologi (PVMBG, also known as Indonesian Center for Volcanology and Geological Hazard Mitigation, CVGHM), Jalan Diponegoro 57, Bandung 40122, Indonesia (URL: http://www.vsi.esdm.go.id/); Darwin Volcanic Ash Advisory Centre (VAAC), Bureau of Meteorology, Northern Territory Regional Office, PO Box 40050, Casuarina, NT 0811, Australia (URL: http://www.bom.gov.au/info/vaac/); MIROVA (Middle InfraRed Observation of Volcanic Activity), a collaborative project between the Universities of Turin and Florence (Italy) supported by the Centre for Volcanic Risk of the Italian Civil Protection Department (URL: http://www.mirovaweb.it/); Hawai'i Institute of Geophysics and Planetology (HIGP) - MODVOLC Thermal Alerts System, School of Ocean and Earth Science and Technology (SOEST), Univ. of Hawai'i, 2525 Correa Road, Honolulu, HI 96822, USA (URL: http://modis.higp.hawaii.edu/); Copernicus Browser, Copernicus Data Space Ecosystem, European Space Agency (URL: https://dataspace.copernicus.eu/browser/); Øystein Lund Andersen (URL: https://www.oysteinlundandersen.com/, https://twitter.com/oysteinvolcano).
Ebeko
Russia
50.686°N, 156.014°E; summit elev. 1103 m
All times are local (unless otherwise noted)
Moderate explosive activity with ash plumes continued during June-November 2023
Ebeko, located on the N end of Paramushir Island in Russia’s Kuril Islands just S of the Kamchatka Peninsula, consists of three summit craters along a SSW-NNE line at the northern end of a complex of five volcanic cones. Observed eruptions date back to the late 18th century and have been characterized as small-to-moderate explosions from the summit crater, accompanied by intense fumarolic activity. The current eruptive period began in June 2022, consisting of frequent explosions, ash plumes, and thermal activity (BGVN 47:10, 48:06). This report covers similar activity during June-November 2023, based on information from the Kamchatka Volcanic Eruptions Response Team (KVERT) and satellite data.
Moderate explosive activity continued during June-November 2023 (figures 50 and 51). According to visual data from Severo-Kurilsk, explosions sent ash 2-3.5 km above the summit (3-4.5 km altitude) during most days during June through mid-September. Activity after mid-September was slightly weaker, with ash usually reaching less than 2 km above the summit. According to KVERT the volcano in October and November was, with a few exceptions, either quiet or obscured by clouds that prevented satellite observations. KVERT issued Volcano Observatory Notices for Aviation (VONA) on 8 and 12 June, 13 and 22 July, 3 and 21 August, and 31 October warning of potential aviation hazards from ash plumes drifting 3-15 km from the volcano. Based on satellite data, KVERT reported a persistent thermal anomaly whenever weather clouds permitted viewing.
Geologic Background. The flat-topped summit of the central cone of Ebeko volcano, one of the most active in the Kuril Islands, occupies the northern end of Paramushir Island. Three summit craters located along a SSW-NNE line form Ebeko volcano proper, at the northern end of a complex of five volcanic cones. Blocky lava flows extend west from Ebeko and SE from the neighboring Nezametnyi cone. The eastern part of the southern crater contains strong solfataras and a large boiling spring. The central crater is filled by a lake about 20 m deep whose shores are lined with steaming solfataras; the northern crater lies across a narrow, low barrier from the central crater and contains a small, cold crescentic lake. Historical activity, recorded since the late-18th century, has been restricted to small-to-moderate explosive eruptions from the summit craters. Intense fumarolic activity occurs in the summit craters, on the outer flanks of the cone, and in lateral explosion craters.
Information Contacts: Kamchatka Volcanic Eruptions Response Team (KVERT), Far Eastern Branch, Russian Academy of Sciences, 9 Piip Blvd., Petropavlovsk-Kamchatsky, 683006, Russia (URL: http://www.kscnet.ru/ivs/kvert/).
Search Bulletin Archive by Publication Date
Select a month and year from the drop-downs and click "Show Issue" to have that issue displayed in this tab.
The default month and year is the latest issue available.
Bulletin of the Global Volcanism Network - Volume 27, Number 04 (April 2002)
Managing Editor: Richard Wunderman
Chikurachki (Russia)
Eruptive activity that began on 25 January 2002 continued through mid-March
Etna (Italy)
Nine months of relative quiet follow mid-2001 flank eruption
Ijen (Indonesia)
Continuous tremor, volcanic and tectonic earthquakes through April 2002
Kerinci (Indonesia)
Small explosion earthquakes dominate, plumes 600 m above summit
Lokon-Empung (Indonesia)
Ash eruptions and increased seismicity in mid-April, Alert Level raised to 3
Mayon (Philippines)
Declining activity prompts PHIVOLCS to lower Alert Level to 0
Nyiragongo (DR Congo)
French-British scientific team field work report on the 17-18 January eruption
San Cristobal (Nicaragua)
November ash-and-gas emissions; thousands of earthquakes through May 2002
Soufriere Hills (United Kingdom)
Rockfalls and pyroclastic flows originate from growing lava dome
Chikurachki (Russia) — April 2002 Cite this Report
Chikurachki
Russia
50.324°N, 155.461°E; summit elev. 1781 m
All times are local (unless otherwise noted)
Eruptive activity that began on 25 January 2002 continued through mid-March
Eruptive activity at Chikurachki began on 25 January 2002. Ash plumes were observed, and a small new crater formed on the SSE part of the summit crater. By mid-February, volcanism decreased, but the Kamchatkan Eruptions Response Team (KVERT) stated that ash explosions could still occur (BGVN 27:01).
During 23-27 February, reports from the town of Severo-Kurilsk revealed renewed activity. On 25, 26, and 27 February ash plumes occasionally rose above the crater and ash fell in the vicinity of Tukharka River. In addition, snow melted very quickly near the volcano. On 8 February an ash plume rose a short distance and drifted NNE. Several clouds were visible on AVHRR satellite imagery that may have been composed of gas and steam from the volcano.
KVERT reported a continuation of eruptive activity through at least 16 March. On that day, beginning at 0700 and lasting until late evening, ash fell in Podgorny settlement, ~20 km SE of the volcano. On a reconnaissance helicopter flight during 1100-1300, observers saw constant gas emissions and sustained ash explosions that rose 200 m above the volcano and extended more than 100 km SE.
Geologic Background. Chikurachki, the highest volcano on Paramushir Island in the northern Kuriles, is a relatively small cone constructed on a high Pleistocene edifice. Oxidized basaltic-to-andesitic scoria deposits covering the upper part of the young cone give it a distinctive red color. Frequent basaltic Plinian eruptions have occurred during the Holocene. Lava flows have reached the sea and formed capes on the NW coast; several young lava flows are also present on the E flank beneath a scoria deposit. The Tatarinov group of six volcanic centers is located immediately to the south, and the Lomonosov cinder cone group, the source of an early Holocene lava flow that reached the saddle between it and Fuss Peak to the west, lies at the southern end of the N-S-trending Chikurachki-Tatarinov complex. In contrast to the frequently active Chikurachki, the Tatarinov centers are extensively modified by erosion and have a more complex structure. Tephrochronology gives evidence of an eruption around 1690 CE from Tatarinov, although its southern cone contains a sulfur-encrusted crater with fumaroles that were active along the margin of a crater lake until 1959.
Information Contacts: Olga Chubarova, Kamchatka Volcanic Eruptions Response Team (KVERT), Institute of Volcanic Geology and Geochemistry, Piip Ave. 9, Petropavlovsk-Kamchatsky, 683006, Russia; Tom Miller, Alaska Volcano Observatory (AVO), a cooperative program of a) U.S. Geological Survey, 4200 University Drive, Anchorage, AK 99508-4667, USA (URL: http://www.avo.alaska.edu/), b) Geophysical Institute, University of Alaska, PO Box 757320, Fairbanks, AK 99775-7320, USA, and c) Alaska Division of Geological & Geophysical Surveys, 794 University Ave., Suite 200, Fairbanks, AK 99709, USA.
Etna
Italy
37.748°N, 14.999°E; summit elev. 3357 m
All times are local (unless otherwise noted)
Nine months of relative quiet follow mid-2001 flank eruption
This report discusses Etna following the July-August 2001 eruption and through 25 April 2002. According to Boris Behncke, the chief source for this report, this 9-month interval was an unusually quiet one and marked the longest quiet interval since 1995.
A visit to the summit craters on 30 January 2002 revealed low levels of activity and no evidence of energetic outbursts. Loud explosions occurred at intervals of 5-30 minutes within the NW pit of Bocca Nuova, but no solid material was ejected. The rims of the pit were covered with brown lithic ash (which had been emitted in December-January) but there were no blocks or fresh scoriae indicating recent ejections. The pit appeared much the same as in September 2001, with a crescent-shaped flat terrace surrounding a deep, degassing vent in the SE part of the pit.
Most of the present degassing at the summit craters is occurring from a vent in the SW part of the Voragine, which had been much less active during the past 1.5 years. Northeast Crater emitted a fairly dilute plume, and at Southeast Crater, fumarolic activity was concentrated at its W rim where numerous degassing vents lie in a fracture. Mechanized access remained limited after the demise of the cable car and the ski lifts on the S flank during the July-August 2001 eruption (BGVN 26:08 and 27:03). In order to access the summit area one has to hike from ~1,900 m elevation, a trip that takes several hours and leads across the July-August 2001 lava fields.
Numerous small earthquakes, some of which were felt by the local population, were recorded on the S flank (in the area of the largest of the July-August 2001 lava flows), and were interpreted to result from the cooling of the lava. Near-continuous, pulsating emissions of reddish-brown lithic ash began around 9 March at the NW vent of Bocca Nuova, generating a plume that trailed for dozens of kilometers downwind. The same source vent has been the site of deep-seated explosions during the past six months. The emissions may have been caused by collapse within the conduit, which occurred repeatedly after the end of the July-August 2001 eruption, and does not necessarily indicate an intensification of eruptive activity or uprise of fresh magma. On the other hand, the volcano had been quiet for some 8 months at this time, and renewed magmatic activity at the summit was to be expected in the near future.
During the third week of March, emissions of lithic, pink-colored ash continued at Bocca Nuova. These were accompanied by voluminous degassing from Northeast Crater and minor fumarolic activity from Voragine and Southeast Crater. During days without strong wind, these emissions rose vertically to form a spectacular plume that might easily create the impression of true eruptive activity at the summit. However, there is no evidence that fresh magma has risen to near the surface, because no incandescence can be seen at night.
A mid-March summit visit by Giovanni Tomarchio, a cameraman of the Italian television RAI (who is responsible for much of the television footage of Etna in recent years), revealed frequent loud explosions at the SW vent of Bocca Nuova. Although the floor of this vent was not visible, it seemed that the explosions originated somewhere immediately below the visible part of the pit. All recent ejecta were fine lithic ash, which accumulated to form a thick, soft deposit in the summit area. Similar emissions occurred for months at Bocca Nuova during the spring and summer of 1999, prior to the vigorous eruptions at Voragine and Bocca Nuova during September-November of that year.
In late March, after nearly three weeks of ash emissions from Bocca Nuova, Northeast Crater began to emit dark brown to gray ash. The emissions appeared to follow a series of small SE-flank earthquakes during 24-25 March. At least three of the shocks were felt by the local population. On 27 and 28 March the ash emissions from both Bocca Nuova and Northeast Crater rose as distinct puffs to several hundred meters above the summit and seemed more energetic, denser, and darker than during the previous weeks. To a passing airplane pilot they appeared so spectacular that he sent out a warning of an eruption. On 28 March, light ash fell over the S flank as far as Catania (~25 km SSE).
Whether Etna is back in magmatic eruption is the subject of debate. The ash that came from the two craters consisted of fine-grained fragments of rock and was derived from the conduit walls and thus contained no new magmatic material. The ash that fell in Catania on 28 March was distinctly darker than the ash that fell in the summit area during the previous weeks and may contain a certain proportion of juvenile magmatic material, although microscopic examination has not been conducted to confirm this. No glow has been seen so far at the summit during night observations, so it seems unlikely that magma has reached the surface. On 29 March two impressive columns bearing dark ash rose nearly continuously from the two craters to several hundreds of meters (~800 m at one point) above the summit. Shifting winds carried the plume E, S, and W.
During late March through 2 April ash emission continued without interruption from Bocca Nuova, while at Northeast Crater it had apparently stopped. Light ashfalls occurred in downwind areas, at times extending as far as Catania. The emissions took the form of billowing brown plumes, which at times rose several hundred meters above the summit. No incandescence was seen at night. Weather prevented observations after the afternoon of 2 April.
The summit became visible again on 6 April. Bocca Nuova continued to produce weak expulsions of brown-colored (probably lithic) ash, while Northeast Crater emitted only white vapor. Two small (M ~3) earthquakes occurred under the SE flank on 4 April. On 13 April two earthquakes (M 2.7-3) were felt by residents on the SE flank (between the towns of Zafferana and Santa Venerina), their epicenters lying in an area named "Salto della Giumenta," located ~5 km NW of Zafferana. Press sources citing scientists of the Istituto Nazionale di Geofisica e Vulcanologia of Catania gave focal depths of ~4 km below the surface. Numerous earthquakes had occurred within the past few weeks in this area, although their correlation with magma movement within the volcano remained unclear.
Ash emissions continued almost constantly at Bocca Nuova. On 14 April these appeared to be dark gray, and at times were emitted forcefully enough to form plumes several hundred meters high. No incandescence was seen during night observations. A dense plume of brownish-gray ash drifted from Etna's summit across the E sky of Catania as Bocca Nuova emitted pulverized rock from its SE vent. Voragine and Northeast craters gave off dense steamy plumes.
In late April heavy snow fell on Etna; snow-cover reached down to ~1,400 m elevation and access to the summit area was reduced. The snow provided a good opportunity to observe the hot areas at the summit and to confirm that no recent lava outflows have taken place. Snow was melting rapidly on the cones of the summit craters and along the fracture that extends NNE from Southeast Crater. Since 23 April, Bocca Nuova's ash emissions, which had been nearly continuous since early March, decreased markedly. The only visible summit activity during 24-25 April consisted of apparently ash-free gas emissions, mostly from Bocca Nuova and Northeast Crater. Nine months after the climax of its most recent flank eruption, Etna continues its unquiet slumber.
Geologic Background. Mount Etna, towering above Catania on the island of Sicily, has one of the world's longest documented records of volcanism, dating back to 1500 BCE. Historical lava flows of basaltic composition cover much of the surface of this massive volcano, whose edifice is the highest and most voluminous in Italy. The Mongibello stratovolcano, truncated by several small calderas, was constructed during the late Pleistocene and Holocene over an older shield volcano. The most prominent morphological feature of Etna is the Valle del Bove, a 5 x 10 km caldera open to the east. Two styles of eruptive activity typically occur, sometimes simultaneously. Persistent explosive eruptions, sometimes with minor lava emissions, take place from one or more summit craters. Flank vents, typically with higher effusion rates, are less frequently active and originate from fissures that open progressively downward from near the summit (usually accompanied by Strombolian eruptions at the upper end). Cinder cones are commonly constructed over the vents of lower-flank lava flows. Lava flows extend to the foot of the volcano on all sides and have reached the sea over a broad area on the SE flank.
Information Contacts: Boris Behncke, Dipartimento di Scienze Geologiche (Sezione di Geologia e Geofisica), Palazzo delle Scienze, Corso Italia 55, 95129 Catania, Italy.
Ijen
Indonesia
8.058°S, 114.242°E; summit elev. 2769 m
All times are local (unless otherwise noted)
Continuous tremor, volcanic and tectonic earthquakes through April 2002
During 7 January through at least 19 May 2002 at Ijen, seismicity was higher than normal. Shallow volcanic and tectonic earthquakes were recorded (table 3). One small explosion earthquake was recorded during the week of 28 January-3 February. A total of three deep volcanic (A-type) earthquakes were registered during early May. Continuous tremor occurred with a maximum amplitude of 0.5-4 mm until mid-March, when it decreased to 0.5-2 mm. During 8-14 April, a white, thin, medium-pressure plume rose 50 m above the summit crater. The following week, the tremor increased to 0.5-6 mm maximum amplitude and remained at similar levels through at least 19 May. The Alert Level remained at 2 during the report period.
Table 3. Earthquakes recorded at Ijen during 7 January through 19 May 2002. Courtesy VSI.
| Date |
Shallow volcanic earthquakes (B-type) |
Tectonic earthquakes |
| 07 Jan-13 Jan 2002 |
5 |
2 |
| 14 Jan-20 Jan 2002 |
-- |
-- |
| 21 Jan-27 Jan 2002 |
-- |
-- |
| 28 Jan-03 Feb 2002 |
9 |
1 |
| 04 Feb-10 Feb 2002 |
1 |
3 |
| 11 Feb-17 Feb 2002 |
4 |
1 |
| 18 Feb-24 Feb 2002 |
8 |
-- |
| 25 Feb-03 Mar 2002 |
9 |
3 |
| 04 Mar-10 Mar 2002 |
12 |
4 |
| 11 Mar-17 Mar 2002 |
2 |
2 |
| 18 Mar-24 Mar 2002 |
1 |
-- |
| 25 Mar-31 Mar 2002 |
2 |
2 |
| 01 Apr-07 Apr 2002 |
-- |
2 |
| 08 Apr-14 Apr 2002 |
2 |
-- |
| 15 Apr-21 Apr 2002 |
9 |
2 |
| 22 Apr-28 Apr 2002 |
11 |
1 |
| 29 Apr-05 May 2002 |
70 |
4 |
| 06 May-12 May 2002 |
42 |
3 |
| 13 May-19 May 2002 |
22 |
4 |
Geologic Background. The Ijen volcano complex at the eastern end of Java consists of a group of small stratovolcanoes constructed within the 20-km-wide Ijen (Kendeng) caldera. The north caldera wall forms a prominent arcuate ridge, but elsewhere the rim was buried by post-caldera volcanoes, including Gunung Merapi, which forms the high point of the complex. Immediately west of the Gunung Merapi stratovolcano is the historically active Kawah Ijen crater, which contains a nearly 1-km-wide, turquoise-colored, acid lake. Kawah Ijen is the site of a labor-intensive mining operation in which baskets of sulfur are hand-carried from the crater floor. Many other post-caldera cones and craters are located within the caldera or along its rim. The largest concentration of cones forms an E-W zone across the southern side of the caldera. Coffee plantations cover much of the caldera floor; nearby waterfalls and hot springs are tourist destinations.
Information Contacts: Dali Ahmad, Volcanological Survey of Indonesia (VSI) (URL: http://www.vsi.esdm.go.id/).
Kerinci (Indonesia) — April 2002 Cite this Report
Kerinci
Indonesia
1.697°S, 101.264°E; summit elev. 3800 m
All times are local (unless otherwise noted)
Small explosion earthquakes dominate, plumes 600 m above summit
During January-May 2002, seismic activity at Kerinci was dominated by small explosion earthquakes. Plumes reached up to 600 m above the summit (table 2). An explosion during 0950-1030 on 4 May produced ash that rose 400 m above the summit. The Alert Level remained at 2 throughout the report period.
Table 2. Seismicity and plume observations at Kerinci during 7 January through 19 May 2002. Courtesy VSI.
| Date |
Deep volcanic |
Shallow volcanic |
Small explosion |
Tectonic |
Plume observations |
| 07 Jan-13 Jan 2002 |
4 |
3 |
263 |
3 |
White thin-thick medium-pressure plume rose 50-100 m and drifted E. |
| 14 Jan-20 Jan 2002 |
-- |
-- |
409 |
7 |
-- |
| 21 Jan-27 Jan 2002 |
4 |
-- |
391 |
13 |
A minor explosion on 26 January produced a dark gray plume that rose ~100-600 m above the summit. |
| 28 Jan-03 Feb 2002 |
1 |
-- |
630 |
9 |
Gray plume reached 500 m above the summit. |
| 04 Feb-10 Feb 2002 |
-- |
4 |
461 |
10 |
A minor explosion on 8 February produced a thick gray ash plume that rose 500 m above the summit. |
| 11 Feb-17 Feb 2002 |
1 |
-- |
172 |
2 |
White thick plume rose 50-300 m. |
| 18 Feb-24 Feb 2002 |
1 |
-- |
133 |
6 |
White thick plume 50-300 m above the summit. |
| 25 Feb-03 Mar 2002 |
-- |
1 |
628 |
4 |
White thick plume 50-300 m above the summit. |
| 03 Mar-10 Mar 2002 |
-- |
-- |
673 |
-- |
White thick medium-pressure plume 50-400 m above the summit. |
| 11 Mar-17 Mar 2002 |
-- |
-- |
continuous |
6 |
White thick medium-pressure plume 50-500 m above the summit. |
| 18 Mar-24 Mar 2002 |
1 |
3 |
continuous |
5 |
White brown thick plume ~100-500 m above the summit; drifted E. |
| 25 Mar-31 Mar 2002 |
-- |
1 |
continuous |
8 |
White brown thick medium-high pressure plume 100-500 m above the summit; drifted E. |
| 01 Apr-07 Apr 2002 |
4 |
2 |
294 |
6 |
White-brownish medium-high pressure plume 100-500 m above the summit; drifted E. |
| 08 Apr-14 Apr 2002 |
1 |
1 |
262 |
4 |
White thick darkish medium-high pressure plume 50-300 m above the summit; drifted E. |
| 15 Apr-21 Apr 2002 |
1 |
-- |
272 |
7 |
White thick medium-high pressure plume rose 50-500 m above the summit; drifted E. |
| 22 Apr-28 Apr 2002 |
1 |
0 |
352 |
8 |
White thin-thick medium-high pressure plume rose 50-400 m above the summit. |
| 29 Apr-05 May 2002 |
3 |
0 |
continuous |
6 |
White-brownish ash plume rose 400 m above the summit. |
| 06 May-12 May 2002 |
3 |
2 |
continuous |
1 |
-- |
| 13 May-19 May 2002 |
1 |
2 |
285 |
8 |
-- |
Geologic Background. Gunung Kerinci in central Sumatra forms Indonesia's highest volcano and is one of the most active in Sumatra. It is capped by an unvegetated young summit cone that was constructed NE of an older crater remnant. There is a deep 600-m-wide summit crater often partially filled by a small crater lake that lies on the NE crater floor, opposite the SW-rim summit. The massive 13 x 25 km wide volcano towers 2400-3300 m above surrounding plains and is elongated in a N-S direction. Frequently active, Kerinci has been the source of numerous moderate explosive eruptions since its first recorded eruption in 1838.
Information Contacts: Dali Ahmad, Volcanological Survey of Indonesia (VSI), Jalan Diponegoro No. 57, Bandung 40122, Indonesia (URL: http://www.vsi.esdm.go.id/).
Lokon-Empung (Indonesia) — April 2002 Cite this Report
Lokon-Empung
Indonesia
1.3644°N, 124.7992°E; summit elev. 1580 m
All times are local (unless otherwise noted)
Ash eruptions and increased seismicity in mid-April, Alert Level raised to 3
An eruption at Lokon on 9 February, triggered by extensive rainfall, sent ash plumes to 1 km and deposited ash in surrounding villages. Activity then decreased significantly and remained low through February 2002 (BGVN 27:02). During February through at least April, Tompaluan crater emitted plumes 50-350 m above the crater rim.
During early April deep and shallow volcanic earthquakes increased (table 2). Eruptions on 10 and 12 April ejected glowing material from the crater. A thick white-gray ash plume rose 1 km above the crater rim. During 13-14 April gas/ash explosions occurred nearly continuously, with eight explosions on 13 April and five on the 14th. Ash explosions rose 50-75 m above the crater rim. Tremor amplitude increased from 0.5-2 mm on 11 April to 4-48 mm by 14 April. The Volcanological Survey of Indonesia (VSI) raised the Alert Level to 3 on 12 April. A total of 25 and 68 small explosions per week were registered during 22-28 April and 29 April-5 May, respectively. During the following weeks the number of small explosions dropped to only 6 per week. As of 26 May, tremor fluctuated (0.5-30 mm amplitude) and gas explosions continued.
Table 2. Earthquakes recorded at Lokon during 11 February through 26 May 2002. Courtesy VSI.
| Date |
Deep volcanic (A-type) |
Shallow volcanic (B-type) |
Tectonic |
| 11 Feb-17 Feb 2002 |
-- |
2 |
17 |
| 18 Feb-24 Feb 2002 |
4 |
1 |
41 |
| 25 Feb-03 Mar 2002 |
-- |
3 |
16 |
| 04 Mar-10 Mar 2002 |
-- |
1 |
34 |
| 11 Mar-17 Mar 2002 |
-- |
1 |
28 |
| 18 Mar-24 Mar 2002 |
10 |
11 |
11 |
| 25 Mar-31 Mar 2002 |
-- |
1 |
17 |
| 01 Apr-07 Apr 2002 |
44 |
78 |
12 |
| 08 Apr-14 Apr 2002 |
90 |
184 |
10 |
| 15 Apr-21 Apr 2002 |
-- |
34 |
43 |
| 22 Apr-28 Apr 2002 |
13 |
81 |
35 |
| 29 Apr-05 May 2002 |
2 |
7 |
25 |
| 06 May-12 May 2002 |
111 |
482 |
18 |
| 13 May-19 May 2002 |
84 |
207 |
35 |
Geologic Background. The Lokong-Empung volcanic complex, rising above the plain of Tondano in North Sulawesi, includes four peaks and an active crater. Lokon, the highest peak, has a flat craterless top. The morphologically younger Empung cone 2 km NE has a 400-m-wide, 150-m-deep crater that erupted last in the 18th century. A ridge extending 3 km WNW from Lokon includes the Tatawiran and Tetempangan peaks. All eruptions since 1829 have originated from Tompaluan, a 150 x 250 m crater in the saddle between Lokon and Empung. These eruptions have primarily produced small-to-moderate ash plumes that sometimes damaged croplands and houses, but lava-dome growth and pyroclastic flows have also occurred.
Information Contacts: Dali Ahmad, Volcanological Survey of Indonesia (VSI) (URL: http://www.vsi.esdm.go.id/).
Mayon (Philippines) — April 2002 Cite this Report
Mayon
Philippines
13.257°N, 123.685°E; summit elev. 2462 m
All times are local (unless otherwise noted)
Declining activity prompts PHIVOLCS to lower Alert Level to 0
Eruptions at Mayon in June and July 2001 were followed by a decrease in seismic activity beginning on 10 August. Low-frequency volcanic earthquakes and SO2 fluxes were still high and were probably related to shallow magma degassing. While various monitoring parameters continued to reflect significant unrest, the general trend was one of declining activity (BGVN 26:08).
Volcanic activity remained low during August. There was relatively little seismicity, slight inflation, occasional observations of incandescence at the summit, and a moderate amount of steam emission. SO2 flux remained well above the baseline of 500 metric tons per day (t/d) (table 7). SO2 emission rates reflected continued degassing of cooling magma, and ground-deformation data continued to indicate the absence of magma intrusion. On 21 August the Alert Level was lowered to 3 and, following a continued decrease in activity, on 19 October it was lowered to 1.
Table 7. Earthquakes, tremor, and SO2 flux at Mayon during 13-30 August. Differences in reported daily and weekly data during 20-26 August could not be resolved by press time. Courtesy PHIVOLCS.
| Date |
High-freq volc EQ's |
Low-freq volc EQ's (amplitude) |
High-freq short-duration volc tremor (amplitude) |
Low-freq short-duration volc tremor (amplitude) |
Avg SO2 flux (t/d) |
| 13-19 Aug 2001 |
4 |
62 |
40 (31.0, 58.0, 3.2, and 40.0 mm) |
17 |
4,757 |
| 21 Aug 2001 |
-- |
-- |
-- |
-- |
4,784 |
| 22 Aug 2001 |
-- |
1 |
3 |
6 |
5,315 |
| 23 Aug 2001 |
-- |
17 |
-- |
6 |
-- |
| 24 Aug 2001 |
-- |
5 |
1 |
-- |
3,989 |
| 25 Aug 2001 |
-- |
4 (4.0 and 5.0 mm) |
2 |
-- |
2,191 |
| 26 Aug 2001 |
-- |
10 (12.0 mm) |
-- |
-- |
2,044 |
| 20-26 Aug 2001 |
-- |
54 |
14 (14.0, 3.4, and 11.0 mm) |
10 |
3,771 |
| 27 Aug 2001 |
-- |
13 (12.0 mm) |
1 (45.0 mm) |
-- |
1,550 |
| 28 Aug 2001 |
-- |
10 (7.0 mm) |
4 (7.0 mm) |
-- |
3,863 |
| 29 Aug 2001 |
-- |
3 (11.0 mm) |
3 (6.5 mm) |
-- |
5,576 |
| 30 Aug 2001 |
-- |
15 (14.0 mm) |
-- |
-- |
-- |
News reports on 21 November stated that lahars were generated after several days of heavy rainfall mixed with unconsolidated material on the volcano's slopes. According to the civil defense, flooding caused more than 4,800 families to be evacuated from their homes.
The Philippine Institute of Volcanology and Seismology (PHIVOLCS) reported that since 19 October 2001, when the Alert Level was lowered to 1, all measured parameters had continued to decrease to near-baseline levels. Ground deformation data from electronic tiltmeters continued to indicate the volcano's deflated condition, and SO2 emission rates yielded relatively low values of 450-900 t/d. The observations implied that no active magma intrusion was occurring beneath the active cone. Although incandescence was still visible at night, PHIVOLCS suggested that it was likely due to still-hot magma beneath the crater. As a result of the low activity, on 5 February PHIVOLCS lowered the Alert Level to 0, but reminded the public to avoid the 6 km Permanent Danger Zone, and residents near major river channels emanating from the volcano were advised to be on alert during heavy rainfall because loose pyroclastic deposits could be remobilized as life-threatening stream flows and lahars.
Geologic Background. Symmetrical Mayon, which rises above the Albay Gulf NW of Legazpi City, is the most active volcano of the Philippines. The steep upper slopes are capped by a small summit crater. Recorded eruptions since 1616 CE range from Strombolian to basaltic Plinian, with cyclical activity beginning with basaltic eruptions, followed by longer periods of andesitic lava flows. Eruptions occur predominately from the central conduit and have also produced lava flows that travel far down the flanks. Pyroclastic density currents and mudflows have commonly swept down many of the approximately 40 ravines that radiate from the summit and have often damaged populated lowland areas. A violent eruption in 1814 killed more than 1,200 people and devastated several towns.
Information Contacts: Philippine Institute of Volcanology and Seismology (PHIVOLCS), C.P. Garcia Ave., Univ. Philippines Campus, U.P. Diliman, 1101 Quezon City; Associated Press.
Nyiragongo (DR Congo) — April 2002 Cite this Report
Nyiragongo
DR Congo
1.52°S, 29.25°E; summit elev. 3470 m
All times are local (unless otherwise noted)
French-British scientific team field work report on the 17-18 January eruption
The following was extracted from the 8 March final report of the French-British Scientific Team on the January 2002 Nyiragongo eruption (Allard and others, 2002). On 22 January the team, comprised of Patrick Allard, Peter Baxter, Michel Halbwachs, and Jean-Christophe Komorowski, joined local scientists of the Goma Volcano Observatory (GVO), and the UN-OCHA team (Jacques Durieux, Paolo Papale, Dario Tedesco, and Orlando Vaselli) in Goma.
Precursory signals. The January 2002 eruption of Nyiragongo volcano was heralded by precursory phenomena detected since March 2001 by volcanologists of the GVO. Anomalous seismicity occurred. It included both type-C long-period (LP) events and tremor, which persisted after the February-March 2001 eruption of Nyamuragira (BGVN 26:03), 15 km NW of Nyiragongo, and had increased gently over the rest of the year. LP events and volcanic tremor were mainly registered at the Bulengo seismic station (15 km W of Goma) and were minimal, or absent, at the more remote (40 km) Katale station, located closer to Nyamuragira (Akumbi Mbiligi, GVO, pers. comm.). This observation supported the idea of seismo-magmatic processes occurring at, or closer to, Nyiragongo. This was later confirmed by the registration of earthquake swarms (presumed fracturing events) in the Nyiragongo area: first in October 2001 and then on 4 January 2002, 13 days prior to the eruption's onset. The 4 January earthquakes were accompanied by a darkened plume and rumbling sounds at the summit of Nyiragongo (Akumbi and Kasareka, GVO, pers. comm.).
A fracture from the 1977 eruption runs above Shaheru crater (2,700 m elevation and ~2 km S of the summit, figure 15). A fumarolic vent formed at ~2,800 m elevation along this fracture in October 2001. New cracks and increased fumarolic activity were also detected on the southern inner wall of the summit crater, upslope of Shaheru crater. In November 2001, new fumaroles appeared on the N floor of Shaheru crater itself.
An increase in seismicity during 4-17 January included several felt earthquakes and volcanic tremor. On 16 January, a few hours before the eruption onset, an abnormally strong smell of sulfur dioxide was also noticed by the pilot of a small private aircraft flying N of Nyiragongo (Ted Hoaru, pers. comm.).
Chronology of the eruption. According to GVO, Nyiragongo started erupting at 0825 on 17 January. Earthquakes caused the 1977 fracture system running from 2,800 m elevation into Shaheru crater to open and drain the lava stored in the summit crater. The height and energy of the discharging lava during this initial phase is demonstrated by lava boulders that were perched 6-8 m high in trees at distances up to 30 m from the eruptive fracture above Shaheru. Very fluid lava flows, only 10-15 cm thick at their source, moved across the forested SE slopes of Nyiragongo and rapidly cut the road going N from Goma. The outpouring lava left high-stand marks on trees up to a height of 1.5 m upslope of, and within, Shaheru. The 800-m-wide Shaheru crater was filled with a 3-m-thick lava pond.
Two sets of parallel eruptive fractures, ~300 m apart, further propagated through the S flank of Shaheru cone and extended downslope forming a series of grabens (~5-10 m wide) cutting across banana groves, villages, and older volcanic cones. Between 1000 and 1100, lava flows issued from a series of eruptive vents at ~2,300-1,800 m elevation along this system (figure 16), devastating several villages. Between 1400 and 1620 fractures approached the outskirts of Goma and began to form a line of vents SE of Monigi village only 1.5 km NE of Goma airport (see figure 15, including points labeled 1610 and 1620). These lowest fractures produced intense spattering. This led to the voluminous lava flow that ran through the airport and the heart of Goma, finally entering Lake Kivu during the night. Other eruptive vents that opened higher on the volcano produced voluminous lava flows that also reached Goma. Most of these flows were of aa-type, less fluid, black, and 1-3 m thick. Visible fracturing occurred simultaneously with the onset of lava effusions.
Another eruptive fissure opened at 1530 at 2,250 m elevation (figure 15) (2 km W of Kibati). Eyewitnesses reported that this western fissure initially produced passively effusive activity feeding pahoehoe lava flows. However, the presence of a scoria-fall deposit extending over 500 m around the vent indicated at least momentary lava fountaining. Lava flows there were voluminous, aa-type, and 1-2 m thick, that cascaded down a significant sector of the volcano (figure 17). These fed a flow advancing towards Monigi and formed the second main flow that reached Goma on the W, stopping a few kilometers from Lake Kivu.
From helicopter and ground-based studies of the lava flows the team estimated a total erupted volume of between 20 and 30 x 106 m3, including the lava that flowed into Lake Kivu. First analyses of bulk rock samples (table 3) revealed that lavas erupted from the highest and lowest fractures had very similar compositions, implying their derivation from a single magma batch. These otherwise degassed lavas still contained very high bulk amounts of S, F, and Cl, with slightly higher contents in the products of spattering activity along the Monigi fracture zone. Moreover, the 2002 Nyiragongo lavas are similar to the leucite-bearing nephelinite lavas produced during the 1977 eruption.
Table 3. Chemical analyses of lavas from the January 2002 and January 1977 Nyiragongo eruptions. Analysis at CRPG, CNRS, Vandoeuvre-Les-Nancy, France. All values in wt % (P. Allard, unpublished data, 2002). Courtesy of the French-British team.
| Sample |
PA-2 |
PA-4 |
PA-1 |
PA-0 |
| Date |
17 Jan 2002 |
17 Jan 2002 |
17 Jan 2002 |
10 Jan 1977 |
| Site |
Upper lava flow |
Spatter cone |
Main lava flow |
1977 eruption |
| Elev (m) |
Shaheru: 2,760 |
Munigi: 1,680 |
Goma center: 1,540 |
Kibati: 2,000 |
| SiO2 |
39.27 |
39.38 |
39.37 |
39.30 |
| Al2O3 |
14.99 |
14.96 |
15.05 |
15.02 |
| Fe2O3 |
13.44 |
13.21 |
13.48 |
13.89 |
| MnO |
0.29 |
0.29 |
0.29 |
0.30 |
| MgO |
4.06 |
4.05 |
4.11 |
4.05 |
| CaO |
12.49 |
12.61 |
12.60 |
12.19 |
| Na2O |
5.94 |
6.10 |
6.01 |
5.57 |
| K2O |
5.69 |
5.72 |
5.70 |
5.65 |
| TiO2 |
2.74 |
2.68 |
2.73 |
2.83 |
| P2O5 |
1.29 |
1.25 |
1.29 |
1.30 |
| Total |
99.79 |
99.83 |
100.17 |
99.69 |
| S tot |
0.18 |
0.22 |
0.19 |
0.15 |
| F |
0.27 |
0.29 |
0.28 |
0.25 |
| Cl |
0.095 |
0.118 |
0.103 |
0.063 |
The UN reported 147 deaths (of whom 60-100 died in an explosion of the Goma central petrol station on 21 January), 30,000 people displaced, and 14,000 homes destroyed by the eruption. Around 470 injured people reportedly suffered burns, fractures, and gas intoxication. However, Peter Baxter reviewed health aspects of the eruption during a visit to Goma in March, and found no evidence for a large number of people injured or killed. He places the number of deaths at about 70, of which 20 occurred as a result of the petrol station explosion; only a few burn injuries needed hospital treatment, and none of those were serious.
As many as 350,000 people fled from the advancing lava, principally towards nearby Rwanda to the E. After two days the majority returned to Goma, despite hazards from hot lava and burning materials. Despite the lack of observers on the scene at the time, it seems that lava emission stopped during the early morning of 18 January, indicating that the entire flank eruption lasted ~24 hours. However, molten lava continued to flow in tunnels and tubes along the main flow that had reached Lake Kivu and spilled into it for a few more days. This created a new fan-shaped lava delta ~800 m across at its widest point along the previous shoreline. Lava flows destroyed part of the airport and Goma's business and commercial center.
Crater collapse and explosive activity. According to Jacques Durieux (UN-OCHA), the solidified lava floor of Nyiragongo summit crater, lying at 320 m below the rim since 1996, was still in place on 21 January, three days after the end of the eruption, but was cut by a N-S steaming graben. It is most likely that this chilled crater floor, although thick enough to initially resist falling, had been weakened by the lava drainage during 17-18 January. Its broad-scale collapse occurred during the night of 22-23 January. A detailed report by eyewitnesses in Rusaya (8 km SW of the summit) indicated that collapse started at 2051 on 22 January, coinciding with a series of felt earthquakes. It was accompanied by roaring sounds and glow above the crater and followed soon after by hot ashfall over Rusaya, that reportedly formed a layer 10 cm thick. GVO registered intense and continuous seismic tremor over the next four hours. Light ashfall also took place over Goma and Gisenyi that night. A helicopter flight on 24 January allowed the team to observe the ash cover on the forested SW flank. They found Nyiragongo's new crater floor ~700 m (instead of 320 m) below the rim, with a blocky and fuming narrow bottom partly covered by remnants of the former crater floor.
Changes in crater morphology correspond to an estimated bulk volume of ~30 x 106 m3 removed during previous lava drainage and subsequent (unquantified but likely secondary) ash emission. This figure compares well with the bulk volume of lava flows, suggesting that these mainly derived from the lava stored in the crater and upper conduit of the volcano. This conclusion is consistent with the identical composition of bulk lava flow samples from the upper and lower fissure vents (table 3).
Intermittent phreatomagmatic explosive activity inside Nyiragongo crater persisted after the collapse. At 0910 on 24 January a dense cloud was visible above the volcano. On 27 January fresh impacts and fresh tree-destructions were discovered in the forest on the upper N flank. Phreatomagmatic activity in the crater was observed directly on 3 February by GVO volcanologist M. Kasareka who had climbed to the summit.
Fracture system. A large fracture system cut the volcano over an elevation range of 1,100 m and extendeed 20 km from N to S, reaching to within 1 km of Goma (figure 15). In some places along the fractures eruptive vents and phreatic (explosion-caused) craters formed. Field observations, combined with eyewitness accounts confirmed the opening of fractures and emission of lava flows either simultaneously or in close succession during the eruption. The overall fissure propagation velocity averaged 2 km/hour. However, massive post-eruptive fracturing was also observed in some places, correlated with intense post-eruptive seismicity. Two weeks after the eruption strong steaming persisted in several sections of the fracture system.
The system of fractures was spectacularly developed in the Monigi area (1,700 m elevation) where it consists of a down-dropped zone ~25-50 m wide with up to 20 m of vertical downward displacement along vertical walls that extend across the topography for ~2 km (figures 18-20). Several fractures opened 1-3 m and ran parallel on either side of the main fault system; they extended out to a distance of 100-300 m from the axis. The fault system passed through several villages (Kasenyi, Buganra). Continuous steaming (60-80°C) was occurring along the faults. Locally, steam vents formed craters 10-15 m deep.
A 50- to 80-cm-wide fracture at Monigi village also channeled lava to the surface where it formed a thin chilled margin (figure 21). Withdrawal of magma during the fracture's southward propagation, as confirmed by eyewitness accounts, left a drained lava tube. In a few locations lava spatter was ejected up to 15 m away from the fracture indicating short-lived gas-rich lava venting.
Fracturing occurred over a short time between 1000 and 1300 from N to S, cutting through thick scoria-cone deposits (figure 22) as well as lava flows several meters thick. Fractures left openings 5-10 m deep. The system transected the W flanks of the Mubara cinder cone, where fractures spread over an area of 100-200 m forming several sub-parallel strands with 0.2-3 m of vertical displacement. This area could present future slope stability problems.
Seismicity. Intense felt seismic activity occurred during but mainly after the eruption, including tectonic earthquakes M 3.5 or larger. The number of earthquakes gradually declined with time but has remained abnormally high. As of early March 2002, earthquakes were still felt intermittently.
The seismic network that operated during the eruption and up until 30 January did not allow an accurate assessment of the location and depth of earthquakes. However, the short time intervals between the arrival of P and S waves as measured on seismograms indicated local sources. The persistence of numerous LP events and sequences of tremor after the eruption raised concerns about the possibility of continuing magma intrusions and phreato-magmatic eruptions inside the summit crater. This intense post-eruptive seismicity, combined with widespread ground subsidence in the Kivu rift (BGVN 27:03), as well as the synchronism of the eruption with 20-km-long fractures and the broadly consistent volumes of bulk lava flows and summit crater collapse, led the team to propose that the 2002 Nyiragongo eruption was most likely triggered by tectonic spreading of the Kivu rift.
Gas emanations. During and after the eruption people in Goma confronted a variety of gas emissions. Abnormal odors of hydrocarbons were reported in many parts of the city, prompting the use of a portable infrared spectrometer allowing in-situ gas analysis. The team found that the smells were due to hydrocarbon-bearing methane- and CO2-rich gas emanations from the ground, which occurred in areas separated by 300-800 m from the lava flows and which, therefore, had no relationship with organic matter fired or heated by the flows. These emanations, with methane concentrations of a few percent and sometimes approaching the 5% flammability threshold in air were found both outdoors diffusing up through pavements along streets, in gardens, and in buildings. At a school, methane measured under 1%. Near a drain system for rainwater ~200 m from a lava flow's edge methane was found in the air along the ground but at less than 1%. However, at a nearby concrete roof over a drain the methane content was 2%, together with 2% CO2.
A long fissure passed under a church in the center of Goma. CO2 emissions caused two women cleaning the church to faint. According to GVO, similar fractures are scattered throughout the area. Heat from engulfing lava flows led to the combustion of both plants and a wide variety of dissimilar materials (houses, cars, petrol tanks, etc.).
Flames of burning gas and vegetation were observed and analyzed in different parts of the flows, both inside and outside the city. On 23 January the team measured a temperature of 500°C for blue flames burning on a still-hot lava flow. The air in cracks near the flames contained about 2% methane, the smell of which was readily detectable in the area. According to witnesses, on the previous day these flames had been orange in color and 1.5 m high, suggesting that the fire was originally caused by the burning of organic matter inside the flow and that the flames resulted from the combustion of distillates of vegetation. Slow combustion of vegetation and organic matter was widespread after the eruption in all the areas affected by Nyiragongo lava flows.
Numerous gas bursts were reported to have occurred during-but mostly after-the eruption, principally during 20-22 January when the most intense seismicity occurred. No one was injured by the explosions. Eyewitnesses to these events saw that the gas bursts shortly followed strongly felt earthquakes and were accompanied by strong smells of hydrocarbon gas. In several places 300-400 m distant from lava flows, these gas bursts ripped through cement and stone pavement in Goma's houses and streets. Gas concentrations stood at 5% CO2 and 3-4% methane in one case, and at 1% CO2 and 2.6% methane in an office. Not far away in a garage a 21 January explosion had blown apart a concrete floor 10 cm thick. But when visited 4 days later, a measurable gas anomaly was absent.
Most of the gas bursts occurred at places or in areas that are broadly aligned with the N-S fracture system cutting the volcano and where ground gas emanations were persisting. Although these explosions occurred at the time of felt earthquakes, the associated seismically induced ground movement was not severe enough to have been responsible for the observed localized type of damages. The strong gas smells and the elevated methane concentrations were taken as evidence of a methane-driven origin for the explosions. Sub-surface methane concentrations must have been locally high enough to allow spontaneous ignition of the methane upon contact with oxygen during and following seismic loading. Further study will be necessary to elucidate the origin of that methane. The team emphasized that methane is weakly abundant in permanent gas vents (locally called "mazukus") that occur in the area, emanating through old lava flows, such as those to the W of Goma (CO2: 93.2 %; methane, CH4: 0.07% by volume).
The team witnessed a small methane burst on 27 January while inspecting ground fractures in Monigi that displayed persistent incandescence and very high temperatures (970°C on 24 January). These sites are located in the middle of a small village and constitute a major attraction for cooking and for children who play nearby. The fracture, through which no lava had erupted, was formed parallel to the main eruptive fractures but there crosses through thick old lava flows. The team inferred that incandescence was caused by the presence at depth of relict heat from the magma body (dike) that fed the nearby lava flows that covered Goma (within 1 km). The gas burst occurred at ~2 m from the site where maximum incandescence had persisted for a week and where scientists were measuring temperatures and collecting gases. Most likely, the scientific fieldwork brought air in contact with a pocket of methane, which then spontaneously burst. A few fist-sized blocks of old lava were popped up to a distance under 1 m, without causing any injuries to the numerous bystanders. At another site, minor bursts occured every few minutes as wind blew through the fractures.
In contrast, minor explosions of phreatic origin also occasionally occurred in different places. For example, at the lava delta, when molten lava entered Lake Kivu, and at Goma when bulldozing the lava flows suddenly depressurized steam produced by the high temperature of lava flows along the ground.
Gas hazard of Lake Kivu. Lake Kivu (485 m deep) is known to contain an immense amount of both CO2 (1,000 times that in Lake Nyos, Cameroon) and methane stored in solution in its waters. In the case of a major disturbance of the density stratification of gas-charged water in this lake, a huge gas release could occur. Concerns about such a hazard were raised when the lava flowed into the lake, together with the opening of new fractures, strong seismicity, and the poorly understood possibility of an underwater extension of the eruption.
A variety of manifestations were observed at the surface of the lake after the eruption. During 20-21 January, coincident with felt earthquakes, the lake water was seen uprising along the shore 9 km to the W of Goma and, in three separate areas, the water became dark and warm, with gas bubbles and an associated odor (hydrogen sulfide). Many dead fish were seen in and around these areas. Similar phenomena were reported along other sectors of the lake's shore. Additionally, yellow flames were reported to have been seen on occasion at the surface of Lake Kivu well away from the lava flows, suggesting methane burning. Unpleasant odors and experiences were reported by swimmers in Lake Kivu before the eruption, again ascribed to gas emissions. These reports need to be followed up by a survey of gas concentrations at the lake surface.
The hazard of lava flows entering and disturbing the lake waters has not been extensively studied previously. The hot lava could disturb the lake stability by starting lake-water convection. This might trigger a gas burst resulting in a lethal cloud of CO2 and methane flowing over an unknown area around the lake. In order to assess the problem, Halbwachs organized underwater investigations, first with the help of scuba divers from UN-OCHA and, in a second stage (7-10 February), using a submersible sent from France with the support of EC-ECHO.
Local divers reported the presence of hot water (40-60°C) surrounding the lava delta. Gas bubbling could be observed locally, but its limited extent suggested that neither the gases, nor the solidified lava presented a risk for the local water supplies. In contrast, potential hazard from submarine lava tubes required investigations at greater depth. Despite the poor visibility due to abundant particles in suspension, the surveys with the submersible revealed that the lava flow and tubes had descended to ~80 m depth in the lake by the shore at Goma. Fortunately, such a depth is much smaller than the critical depths of 200-300 m at which Lake Kivu's waters contain more abundant dissolved carbon dioxide, closer to the saturation limit.
In order to evaluate the influence of the hot mass of lava that entered into Lake Kivu on its physico-chemical stratification, during early February a series of samples were collected at varying depths, and 40 vertical lake soundings were undertaken. In collaboration with Halbwachs, these measurements were performed by two limnologists: Klaus Tietze (PDT GmbH, Celle, Germany) and Andreas Lorke (EAWAG Laboratory, Lucerne, Switzerland). They measured depth, temperature, pH, electrical conductivity, turbidity (transparency to white light), and dissolved-oxygen content. Preliminary results suggested a change in the water stratification since the last measurements by Klaus Tietze 20 years ago. A new homogenous water layer was found at depths between 200 and 250 m. Near the lava delta the temperature and turbidity profiles showed some perturbations between 50 and 120 m depth. Away from the delta, a thin (3 m) layer of slightly warmer water lay at ~80 m depth. The turbidity was rather low close to the lava flows but increased rapidly away from it. More synthesis and analytical work continues in order to assess fundamental questions on the stability of Lake Kivu stratification.
References. Allard, P., Baxter, P., Halbwachs, M., and Komorowski, J-C, 2002, Final report of the French-British scientific team: submitted to the Ministry for Foreign Affairs, Paris, France, Foreign Office, London, United Kingdom and respective Embassies in Democratic Republic of Congo and Republic of Rwanda, 24 p.
Thonnard, R.L.G., Denaeyer, M-E., and Antun, P., 1965, Carte volcanologique des Virunga (1/50000), Afrique Central, Feuile No. 1: Centre National de Volcanologie (Belgique), Missions Gèologiques et Gèophysiques aux Virunga, Ministère de L'Education et de la Culture, Bruxelles, Belgium.
Geologic Background. The Nyiragongo stratovolcano contained a lava lake in its deep summit crater that was active for half a century before draining catastrophically through its outer flanks in 1977. The steep slopes contrast to the low profile of its neighboring shield volcano, Nyamuragira. Benches in the steep-walled, 1.2-km-wide summit crater mark levels of former lava lakes, which have been observed since the late-19th century. Two older stratovolcanoes, Baruta and Shaheru, are partially overlapped by Nyiragongo on the north and south. About 100 cones are located primarily along radial fissures south of Shaheru, east of the summit, and along a NE-SW zone extending as far as Lake Kivu. Many cones are buried by voluminous lava flows that extend long distances down the flanks, which is characterized by the eruption of foiditic rocks. The extremely fluid 1977 lava flows caused many fatalities, as did lava flows that inundated portions of the major city of Goma in January 2002.
Information Contacts: Patrick Allard, Laboratoire Pierre Süe, CNRS-CEA, Saclay, France; Peter Baxter, University of Cambridge, United Kingdom; Michel Halbwachs, Université de Savoie, Chambéry, France; Jean-Christophe Komorowski, Institut de Physique du Globe de Paris, France.
San Cristobal (Nicaragua) — April 2002 Cite this Report
San Cristobal
Nicaragua
12.702°N, 87.004°W; summit elev. 1745 m
All times are local (unless otherwise noted)
November ash-and-gas emissions; thousands of earthquakes through May 2002
Instituto Nicaragüense de Estudios Territoriales (INETER) reported that during December 2001 through May 2002 San Cristóbal maintained generally constant levels of seismicity and moderate tremor levels. Thousands of earthquakes per month were recorded, most with frequencies of 4.0 to over 10 Hz. Very few events registered with frequencies less than 1.0 Hz.
The third eruptive stage in 2001 was during 7-25 November, when strong ash-and-gas emissions and rumblings occurred and small amounts of ash fell in surrounding areas. After visiting the crater on 11 and 25 November, and 9 December, Vicente Perez (INETER) reported rockfalls and strong emissions of gas and ash. Fumarolic temperatures on 25 November were ~40-100°C, and were similar during December. On 15 January Pedro Perez observed only sporadic gas emanations during a crater visit.
During November through 23 February seismic tremor generally remained between 20 and 60 RSAM units, with the maximum tremor occurring during 8-14 November, when ash-and-gas emissions were strongest. Tremor frequency was 4.0-6.0 Hz.
Observations on 6 February revealed an overall lack of visible changes at the volcano with the exception of gas emanations in the new crater. On 24 February seismic tremor began to increase until it reached 40 RSAM units. While the tremor increased, the number of earthquakes diminished. Strong rumblings on 22 and 26 February, coinciding with the increase of tremor on 24 February, were accompanied by gas emissions.
Another increase in tremor began on the afternoon of 6 March. Strong seismicity occurred in 2- to 3-hour periods that were generally separated by less than 1 hour of less intense activity. INETER reported that seismic tremor reached more than 50 RSAM units on 7 March. Scientists visiting the volcano found that the amount and temperature of degassing had increased. Reportedly, incandescent material in the crater was reflected on the clouds above it. On 22 March at 2219 an earthquake was felt by most of the population near the volcano. Following this event, more than twelve earthquakes with magnitudes of 2.0-3.2 occurred. According to INETER, associated activity was not strong enough to warrant raising the Alert Level.
During April an average of 30 earthquakes occurred per hour (figure 10), most associated with degassing. Very few events were volcano-tectonic or explosion earthquakes. Seismic tremor remained between 40 and 45 RSAM units.
On 23 May a strong gas column was observed at San Cristóbal. The Washington Volcanic Ash Advisory Center (VAAC) stated that a surface report had indicated strong activity near the summit. A plume was visible on satellite imagery drifting SW from the summit (figure 11). A video camera near the summit indicated that the altitude of the plume was relatively low, near ~3 km. The Washingon VAAC issued a second notice stating that according to INETER, the emissions consisted solely of gas. The VAAC noted that no plume was detected in satellite imagery later that day. INETER reported that the column was the result of rain in the crater that generated steam. No other phenomena were observed that could indicate an increase in the eruptive activity of the volcano.
Geologic Background. The San Cristóbal volcanic complex, consisting of five principal volcanic edifices, forms the NW end of the Marrabios Range. The symmetrical 1745-m-high youngest cone, named San Cristóbal (also known as El Viejo), is Nicaragua's highest volcano and is capped by a 500 x 600 m wide crater. El Chonco, with several flank lava domes, is located 4 km W of San Cristóbal; it and the eroded Moyotepe volcano, 4 km NE of San Cristóbal, are of Pleistocene age. Volcán Casita, containing an elongated summit crater, lies immediately east of San Cristóbal and was the site of a catastrophic landslide and lahar in 1998. The Plio-Pleistocene La Pelona caldera is located at the eastern end of the complex. Historical eruptions from San Cristóbal, consisting of small-to-moderate explosive activity, have been reported since the 16th century. Some other 16th-century eruptions attributed to Casita volcano are uncertain and may pertain to other Marrabios Range volcanoes.
Information Contacts: Virginia Tenorio, Department of Geophysics, Instituto Nicaragüense de Estudios Territoriales (INETER), P.O. Box 1761, Managua, Nicaragua (URL: http://www.ineter.gob.ni/); La Noticia (URL: http://www.lanoticia.com.ni/); El Nuevo Diario (URL: http://www.elnuevodiario.com.ni/); La Prensa (URL: http://www.laprensa.com.ni/); Washington Volcanic Ash Advisory Center (VAAC), Satellite Analysis Branch, NOAA/NESDIS/E/SP23, NOAA Science Center Room 401, Camp Springs, MD 20746, USA (URL: http://www.ssd.noaa.gov/).
Soufriere Hills (United Kingdom) — April 2002 Cite this Report
Soufriere Hills
United Kingdom
16.72°N, 62.18°W; summit elev. 915 m
All times are local (unless otherwise noted)
Rockfalls and pyroclastic flows originate from growing lava dome
During mid-August 2001 through February 2002 at a new lava dome continued to grow at Soufriere Hills. Small-scale dome collapses generated pyroclastic flows almost continuously, with some reaching and entering the sea on several occasions. Dense ash plumes associated with sea entry and ash venting from the summit generally drifted W and reached up to 3 km altitude. Mudflows occurred in the Belham Valley on several days during periods of torrential rainfall (BGVN 27:01). The lava dome continued to grow during February through at least mid-May 2002. Minor episodes of ash venting occurred from the summit of the dome, and at times incandescence was visible. The dome produced numerous rockfalls and small pyroclastic flows in the upper reaches of the Tar River Valley. SO2 flux rates reached up to 1,200 metric tons per day (table 40).
Table 40. Seismic and SO2-flux data from Soufriere Hills during 1 February-10 May 2002. Courtesy of MVO.
| Date |
Rockfall |
Long-period / Rockfall |
Long-period |
Hybrid |
Volcano-tectonic |
SO2 flux (metric tons/day) |
| 01 Feb-08 Feb 2002 |
897 |
64 |
85 |
16 |
-- |
06 Feb: 160-380; 07 Feb: 665-790 |
| 08 Feb-15 Feb 2002 |
734 |
69 |
83 |
17 |
1 |
09-12 Feb: 150-420; 14 Feb: 350-650 |
| 15 Feb-22 Feb 2002 |
786 |
75 |
74 |
17 |
-- |
16 Feb: 600-780; 19 Feb: 90-130 |
| 22 Feb-01 Mar 2002 |
1013 |
124 |
101 |
5 |
-- |
-- |
| 01 Mar-08 Mar 2002 |
415 |
49 |
56 |
10 |
-- |
60-130 |
| 08 Mar-15 Mar 2002 |
779 |
67 |
92 |
6 |
-- |
40-860 |
| 15 Mar-22 Mar 2002 |
1002 |
108 |
162 |
3 |
2 |
395-1035 |
| 22 Mar-29 Mar 2002 |
935 |
80 |
123 |
3 |
-- |
1100-1200 |
| 12 Apr-19 Apr 2002 |
841 |
52 |
65 |
6 |
-- |
~1200 |
| 19 Apr-26 Apr 2002 |
990 |
66 |
114 |
31 |
1 |
~1200 |
| 26 Apr-03 May 2002 |
741 |
33 |
76 |
42 |
2 |
~600 |
| 03 May-10 May 2002 |
557 |
40 |
82 |
13 |
-- |
-- |
During flights on 4, 5, and 6 February new pyroclastic-flow deposits were observed in the Tar River to the E (with some flows reaching the sea) and in the White River to the S, derived from the collapse of remnant talus material from the pre-29 July 2001 dome (BGVN 26:07). An observation flight on 14 February revealed minor rockfalls of old, inactive dome material in the upper part of the Gages region. Near-continuous rockfalls and minor pyroclastic flows occurred on the E flank. Minor rockfalls on the N flank of the active dome cascaded between the NE and central buttresses of the older inactive dome.
Activity increased beginning on the evening of 8 March. Small ash clouds (reaching ~2.1 km) arising from small collapses drifted to the W over the Plymouth and Richmond Hill area, although most of the ash fallout occurred over the sea. For a couple days during late March weak winds dispersed the ash towards the NW and N, depositing it over the main populated areas. Large spines on the dome during mid-March periodically collapsed, producing pyroclastic flows down the E flank, some of which reached the Tar River Fan. By late March minor amounts of rockfall debris from the NE flank of the dome had begun to spill into the head of Tuit's Ghaut. Ash venting appeared to have been from a pit-like depression on the summit of the dome.
Increased rockfall and pyroclastic-flow activity over the E flank of the dome coincided with periods of tremor during late April. Small, low-level ash clouds were occasionally visible on satellite imagery. Rockfalls traveled down the SE flank of the dome almost continuously. By early May rockfall talus had begun to spill over the rim of the 29 July 2001 collapse-scar in the extreme SE at the foot of Roches Mountain. Pyroclastic flows on the mornings of 1 and 2 May were the most energetic seismic events recorded for over a month. Activity increased beginning on 8 May, and rockfalls and pyroclastic flows were concentrated on the dome's NE flank.
MVO reported that weather permitting, the daytime entry zone (DTEZ) would remain open. The observatory warned that activity could increase quite suddenly, with a dangerous situation developing in the DTEZ very quickly, and that ash masks should be worn in ashy conditions. The Belham Valley was to be avoided during and after heavy rainfall due to the possibility of mudflows. Access to Plymouth, Bramble airport, and beyond was prohibited. In addition, a maritime exclusion zone around the S part of the island extends two miles beyond the coastline from Trant's Bay in the E to Garibaldi Hill on the W coast.
Seismicity and SO2 flux. Since 4 February SO2 measurements were carried out using a remote, telemetered Differential Optical Absorption Spectrometer (DOAS) that scans through the plume, yielding over 600 measurements of SO2 emission rates per day. The highest SO2 fluxes were measured after pyroclastic flows. SO2 emission rates decreased dramatically during early March (table 40).
A swarm of hybrid earthquakes on 22 April was followed by increased numbers of long-period events and a surge in the number of rockfalls over the next four days. Banded tremor also followed the swarm. Weak periods of tremor occurred approximately every 20 hours during 26 April-3 May, and each lasted a few hours. Fluctuations in SO2 emission rates in late April appeared to reflect variations in the intensity of rockfall activity.
Morphology of the lava dome. During early February the lava dome continued to grow primarily on the E and NE sides, and by late February growth was focused on the E side. The summit of the dome was blocky and massive, in contrast to the spines of previous weeks. On 19 February the dome was crowned by a large spine inclined steeply up towards the SE. The spine changed in size and shape, as it periodically collapsed or disintegrated and grew again as fresh material was extruded. On 26 February the spine had a height of 90 m above the general level of the summit area. At this stage the top of the spine had an elevation of 1,080 m, the highest point measured during the eruption to date.
Observations in early March revealed that the summit of the dome had a generally spiny appearance and on several occasions was crowned by a large spine directed upwards at a high angle towards the E. During mid-March the summit of the dome was dominated by fast-growing large spines (50-70 m high). Theodolite measurements of the dome taken on 20 March yielded a dome height of 1,039 m.
During mid-April, dome growth shifted to the SE area of the dome complex, although small rockfalls occurred in other areas. The summit area had evolved from a large striated lobe to a series of small spines. By late April the lobe on the SE portion of the dome had reached 1,041 m elevation and the NE lobe, which had been highly active during the previous two weeks, stagnated at a height of 1,020 m elevation. Lava dome growth continued on the E side of the dome complex during early May.
The closest GPS station to the dome showed sustained outward movement of ~0.5 cm per month. During periods of dome building, slow subsidence took place at the closest sites at Hermitage, Whites, and Harris. Since January, the EDM reflector on the N flank showed a 5-cm movement away from the lava dome.
Hazard assessment. On 11 March 2002 the Montserrat Volcano Observatory (MVO) issued the following preliminary statement concerning the history and hazard assessment of the current eruption: "The Soufrière Hills Volcano continues its second phase of sustained dome growth, which began in November 1999. Since September 2001, the dome has grown at an average rate of about 2 m3/s (or 400,000 metric tons per day). The summit region of the dome has now reached an altitude of ~990 m, having filled most of the depression formed by the large dome collapse of 29 July 2001. The dome has mainly grown towards the E, although there was a period during late November and early December 2001 when growth was directed W.
"During [September 2001 to March 2002] there have been fluctuations in activity as recorded in seismicity and gas emissions. Pyroclastic flows and almost continuous rockfalls have occurred, mostly directed down the Tar River Valley. For prolonged periods in the last six months, there have been cyclical patterns of enhanced seismicity lasting for a few hours to about a day, during which rockfall and pyroclastic-flow activity has been more intense.
"Continued growth of the dome over this period has meant that hazard levels close to the volcano have increased slightly compared with . . . September 2001. Risk levels will fluctuate as the configuration of the dome changes. In an extreme scenario, a switch in the direction of growth to the N or NW could result in more hazardous conditions along the margins of the Exclusion Zone. Consequently, increased levels of risk might develop in the populated areas bordering the Belham River. Across the remainder of the island, however, it is considered that the general level of risk to the population from volcanic activity is unchanged.
"The main hazards remain pyroclastic flows, explosions, falls of ash and small stones, and volcanic mudflows. The increasing knowledge of the volcano acquired by the experienced observatory staff allows patterns of eruption behavior to be recognized and some forms of activity to be anticipated. During a large dome collapse or explosion, heavy ashfall and the fall of small rock fragments can be expected in the populated areas if the wind is in an unfavorable direction. However, a detailed study of the hazard due to fall of rock fragments has recently been completed, and this indicates that outside the Exclusion Zone significant falls of rock fragments large enough to cause serious injury are unlikely.
"At the moment there is no sign of the volcanic activity diminishing. It is most likely that the eruption will continue for a number of years, although the volcano may be evolving into a persistently active state with the eruption continuing for even longer periods, either continuously or intermittently."
General References. Baker, P.E., 1985, Volcanic hazards on St. Kitts and Montserrat, West Indies: Journal of the Geological Society, London, v. 142, p. 279-295.
Shepherd, J.B, Tomblin, J.F., and Woo, D.A., 1971, Volcano-seismic crisis in Montserrat, West Indies, 1966-67: Bulletin of Volcanology, v. 35, p. 143-163.
Wadge, G., and Isaacs, M.C., 1988, Mapping the volcanic hazards from Soufriere Hills volcano, Montserrat, West Indies using an image processor: Journal of the Geological Society, London, v. 145, p. 541-551.
Geologic Background. The complex, dominantly andesitic Soufrière Hills volcano occupies the southern half of the island of Montserrat. The summit area consists primarily of a series of lava domes emplaced along an ESE-trending zone. The volcano is flanked by Pleistocene complexes to the north and south. English's Crater, a 1-km-wide crater breached widely to the east by edifice collapse, was formed about 2000 years ago as a result of the youngest of several collapse events producing submarine debris-avalanche deposits. Block-and-ash flow and surge deposits associated with dome growth predominate in flank deposits, including those from an eruption that likely preceded the 1632 CE settlement of the island, allowing cultivation on recently devegetated land to near the summit. Non-eruptive seismic swarms occurred at 30-year intervals in the 20th century, but no historical eruptions were recorded until 1995. Long-term small-to-moderate ash eruptions beginning in that year were later accompanied by lava-dome growth and pyroclastic flows that forced evacuation of the southern half of the island and ultimately destroyed the capital city of Plymouth, causing major social and economic disruption.
Information Contacts: Montserrat Volcano Observatory (MVO), Mongo Hill, Montserrat, West Indies (URL: http://www.mvo.ms/); Washington Volcanic Ash Advisory Center (VAAC), Satellite Analysis Branch (SAB), NOAA/NESDIS E/SP23, NOAA Science Center Room 401, 5200 Auth Road, Camp Springs, MD 20746, USA (URL: http://www.ospo.noaa.gov/Products/atmosphere/vaac/).