Recently Published Bulletin Reports
Manam (Papua New Guinea) Few ash plumes during November-December 2022
Krakatau (Indonesia) Strombolian activity and ash plumes during November 2022-April 2023
Stromboli (Italy) Strombolian explosions and lava flows continue during January-April 2023
Nishinoshima (Japan) Small ash plumes and fumarolic activity during November 2022 through April 2023
Karangetang (Indonesia) Lava flows, incandescent avalanches, and ash plumes during January-June 2023
Ahyi (United States) Intermittent hydroacoustic signals and discolored plumes during November 2022-June 2023
Kadovar (Papua New Guinea) An ash plume and weak thermal anomaly during May 2023
San Miguel (El Salvador) Small gas-and-ash explosions during March and May 2023
Semisopochnoi (United States) Occasional explosions, ash deposits, and gas-and-steam plumes during December 2022-May 2023
Ebeko (Russia) Continued explosions, ash plumes, and ashfall during October 2022-May 2023
Home Reef (Tonga) Discolored plumes continued during November 2022-April 2023
Ambae (Vanuatu) New lava flow, ash plumes, and sulfur dioxide plumes during February-May 2023
Manam (Papua New Guinea) — July 2023  Cite this Report
Manam
Papua New Guinea
4.08°S, 145.037°E; summit elev. 1807 m
All times are local (unless otherwise noted)
Few ash plumes during November-December 2022
Manam is a 10-km-wide island that consists of two active summit craters: the Main summit crater and the South summit crater and is located 13 km off the northern coast of mainland Papua New Guinea. Frequent mild-to-moderate eruptions have been recorded since 1616. The current eruption period began during June 2014 and has more recently been characterized by intermittent ash plumes and thermal activity (BGVN 47:11). This report updates activity that occurred from November 2022 through May 2023 based on information from the Darwin Volcanic Ash Advisory Center (VAAC) and various satellite data.
Ash plumes were reported during November and December 2022 by the Darwin VAAC. On 7 November an ash plume rose to 2.1 km altitude and drifted NE based on satellite images and weather models. On 14 November an ash plume rose to 2.1 km altitude and drifted W based on RVO webcam images. On 20 November ash plumes rose to 1.8 km altitude and drifted NW. On 26 December an ash plume rose to 3 km altitude and drifted S and SSE.
Intermittent sulfur dioxide plumes were detected using the TROPOMI instrument on the Sentinel-5P satellite, some of which exceeded at least two Dobson Units (DU) and drifted in different directions (figure 93). Occasional low-to-moderate power thermal anomalies were recorded by the MIROVA (Middle InfraRed Observation of Volcanic Activity) system; less than five anomalies were recorded each month during November 2022 through May 2023 (figure 94). Two thermal hotspots were detected by the MODVOLC thermal alerts system on 10 December 2022. On clear weather days, thermal activity was also captured in infrared satellite imagery in both the Main and South summit craters, accompanied by gas-and-steam emissions (figure 95).
Geologic Background. The 10-km-wide island of Manam, lying 13 km off the northern coast of mainland Papua New Guinea, is one of the country's most active volcanoes. Four large radial valleys extend from the unvegetated summit of the conical basaltic-andesitic stratovolcano to its lower flanks. These valleys channel lava flows and pyroclastic avalanches that have sometimes reached the coast. Five small satellitic centers are located near the island's shoreline on the northern, southern, and western sides. Two summit craters are present; both are active, although most observed eruptions have originated from the southern crater, concentrating eruptive products during much of the past century into the SE valley. Frequent eruptions, typically of mild-to-moderate scale, have been recorded since 1616. Occasional larger eruptions have produced pyroclastic flows and lava flows that reached flat-lying coastal areas and entered the sea, sometimes impacting populated areas.
Information Contacts: Rabaul Volcano Observatory (RVO), Geohazards Management Division, Department of Mineral Policy and Geohazards Management (DMPGM), PO Box 3386, Kokopo, East New Britain Province, Papua New Guinea; Darwin Volcanic Ash Advisory Centre (VAAC), Bureau of Meteorology, Northern Territory Regional Office, PO Box 40050, Casuarina, NT 0811, Australia (URL: http://www.bom.gov.au/info/vaac/); MIROVA (Middle InfraRed Observation of Volcanic Activity), a collaborative project between the Universities of Turin and Florence (Italy) supported by the Centre for Volcanic Risk of the Italian Civil Protection Department (URL: http://www.mirovaweb.it/); Hawai'i Institute of Geophysics and Planetology (HIGP) - MODVOLC Thermal Alerts System, School of Ocean and Earth Science and Technology (SOEST), Univ. of Hawai'i, 2525 Correa Road, Honolulu, HI 96822, USA (URL: http://modis.higp.hawaii.edu/); NASA Global Sulfur Dioxide Monitoring Page, Atmospheric Chemistry and Dynamics Laboratory, NASA Goddard Space Flight Center (NASA/GSFC), 8800 Greenbelt Road, Goddard, Maryland, USA (URL: https://so2.gsfc.nasa.gov/); Copernicus Browser, Copernicus Data Space Ecosystem, European Space Agency (URL: https://dataspace.copernicus.eu/browser/).
Krakatau (Indonesia) — July 2023 Cite this Report
Krakatau
Indonesia
6.1009°S, 105.4233°E; summit elev. 285 m
All times are local (unless otherwise noted)
Strombolian activity and ash plumes during November 2022-April 2023
Krakatau is located in the Sunda Strait between Java and Sumatra, Indonesia. Caldera collapse during the catastrophic 1883 eruption destroyed Danan and Perbuwatan cones and left only a remnant of Rakata. The post-collapse cone of Anak Krakatau (Child of Krakatau) was constructed within the 1883 caldera at a point between the former Danan and Perbuwatan cones; it has been the site of frequent eruptions since 1927. The current eruption period began in May 2021 and has recently consisted of explosions, ash plumes, and thermal activity (BGVN 47:11). This report covers activity during November 2022 through April 2023 based on information provided by the Indonesian Center for Volcanology and Geological Hazard Mitigation, referred to as Pusat Vulkanologi dan Mitigasi Bencana Geologi (PVMBG), MAGMA Indonesia, the Darwin Volcanic Ash Advisory Center (VAAC), and several sources of satellite data.
Activity was relatively low during November and December 2022. Daily white gas-and-steam plumes rose 25-100 m above the summit and drifted in different directions. Gray ash plumes rose 200 m above the summit and drifted NE at 1047 and at 2343 on 11 November. On 14 November at 0933 ash plumes rose 300 m above the summit and drifted E. An ash plume was reported at 0935 on 15 December that rose 100 m above the summit and drifted NE. An eruptive event at 1031 later that day generated an ash plume that rose 700 m above the summit and drifted NE. A gray ash plume at 1910 rose 100 m above the summit and drifted E. Incandescent material was ejected above the vent based on an image taken at 1936.
During January 2023 daily white gas-and-steam plumes rose 25-300 m above the summit and drifted in multiple directions. Gray-to-brown ash plumes were reported at 1638 on 3 January, at 1410 and 1509 on 4 January, and at 0013 on 5 January that rose 100-750 m above the summit and drifted NE and E; the gray-to-black ash plume at 1509 on 4 January rose as high as 3 km above the summit and drifted E. Gray ash plumes were recorded at 1754, 2241, and 2325 on 11 January and at 0046 on 12 January and rose 200-300 m above the summit and drifted NE. Toward the end of January, PVMBG reported that activity had intensified; Strombolian activity was visible in webcam images taken at 0041, 0043, and 0450 on 23 January. Multiple gray ash plumes throughout the day rose 200-500 m above the summit and drifted E and SE (figure 135). Webcam images showed progressively intensifying Strombolian activity at 1919, 1958, and 2113 on 24 January; a gray ash plume at 1957 rose 300 m above the summit and drifted E (figure 135). Eruptive events at 0231 and 2256 on 25 January and at 0003 on 26 January ejected incandescent material from the vent, based on webcam images. Gray ash plumes observed during 26-27 January rose 300-500 m above the summit and drifted NE, E, and SE.
Low levels of activity were reported during February and March. Daily white gas-and-steam plumes rose 25-300 m above the summit and drifted in different directions. The Darwin VAAC reported that continuous ash emissions rose to 1.5-1.8 km altitude and drifted W and NW during 1240-1300 on 10 March, based on satellite images, weather models, and PVMBG webcams. White-and-gray ash plumes rose 500 m and 300 m above the summit and drifted SW at 1446 and 1846 on 18 March, respectively. An eruptive event was recorded at 2143, though it was not visible due to darkness. Multiple ash plumes were reported during 27-29 March that rose as high as 2.5 km above the summit and drifted NE, W, and SW (figure 136). Webcam images captured incandescent ejecta above the vent at 0415 and around the summit area at 2003 on 28 March and at 0047 above the vent on 29 March.
Daily white gas-and-steam plumes rose 25-300 m above the summit and drifted in multiple directions during April and May. White-and-gray and black plumes rose 50-300 m above the summit on 2 and 9 April. On 11 May at 1241 a gray ash plume rose 1-3 km above the summit and drifted SW. On 12 May at 0920 a gray ash plume rose 2.5 km above the summit and drifted SW and at 2320 an ash plume rose 1.5 km above the summit and drifted SW. An accompanying webcam image showed incandescent ejecta. On 13 May at 0710 a gray ash plume rose 2 km above the summit and drifted SW (figure 137).
The MIROVA (Middle InfraRed Observation of Volcanic Activity) graph of MODIS thermal anomaly data showed intermittent low-to-moderate power thermal anomalies during November 2022 through April 2023 (figure 138). Some of this thermal activity was also visible in infrared satellite imagery at the crater, accompanied by gas-and-steam and ash plumes that drifted in different directions (figure 139).
Geologic Background. The renowned Krakatau (frequently mis-named as Krakatoa) volcano lies in the Sunda Strait between Java and Sumatra. Collapse of an older edifice, perhaps in 416 or 535 CE, formed a 7-km-wide caldera. Remnants of that volcano are preserved in Verlaten and Lang Islands; subsequently the Rakata, Danan, and Perbuwatan cones were formed, coalescing to create the pre-1883 Krakatau Island. Caldera collapse during the catastrophic 1883 eruption destroyed Danan and Perbuwatan, and left only a remnant of Rakata. This eruption caused more than 36,000 fatalities, most as a result of tsunamis that swept the adjacent coastlines of Sumatra and Java. Pyroclastic surges traveled 40 km across the Sunda Strait and reached the Sumatra coast. After a quiescence of less than a half century, the post-collapse cone of Anak Krakatau (Child of Krakatau) was constructed within the 1883 caldera at a point between the former Danan and Perbuwatan cones. Anak Krakatau has been the site of frequent eruptions since 1927.
Information Contacts: Pusat Vulkanologi dan Mitigasi Bencana Geologi (PVMBG, also known as Indonesian Center for Volcanology and Geological Hazard Mitigation, CVGHM), Jalan Diponegoro 57, Bandung 40122, Indonesia (URL: http://www.vsi.esdm.go.id/); MAGMA Indonesia, Kementerian Energi dan Sumber Daya Mineral (URL: https://magma.esdm.go.id/v1); Darwin Volcanic Ash Advisory Centre (VAAC), Bureau of Meteorology, Northern Territory Regional Office, PO Box 40050, Casuarina, NT 0811, Australia (URL: http://www.bom.gov.au/info/vaac/); MIROVA (Middle InfraRed Observation of Volcanic Activity), a collaborative project between the Universities of Turin and Florence (Italy) supported by the Centre for Volcanic Risk of the Italian Civil Protection Department (URL: http://www.mirovaweb.it/); Copernicus Browser, Copernicus Data Space Ecosystem, European Space Agency (URL: https://dataspace.copernicus.eu/browser/).
Stromboli
Italy
38.789°N, 15.213°E; summit elev. 924 m
All times are local (unless otherwise noted)
Strombolian explosions and lava flows continue during January-April 2023
Stromboli, located in Italy, has exhibited nearly constant lava fountains for the past 2,000 years; recorded eruptions date back to 350 BCE. Eruptive activity occurs at the summit from multiple vents, which include a north crater area (N area) and a central-southern crater (CS area) on a terrace known as the ‘terrazza craterica’ at the head of the Sciara del Fuoco, a large scarp that runs from the summit down the NW side of the volcano-island. Activity typically consists of Strombolian explosions, incandescent ejecta, lava flows, and pyroclastic flows. Thermal and visual monitoring cameras are located on the nearby Pizzo Sopra La Fossa, above the terrazza craterica, and at multiple flank locations. The current eruption period has been ongoing since 1934 and recent activity has consisted of frequent Strombolian explosions and lava flows (BGVN 48:02). This report updates activity during January through April 2023 primarily characterized by Strombolian explosions and lava flows based on reports from Italy's Istituto Nazionale di Geofisica e Vulcanologia (INGV) and various satellite data.
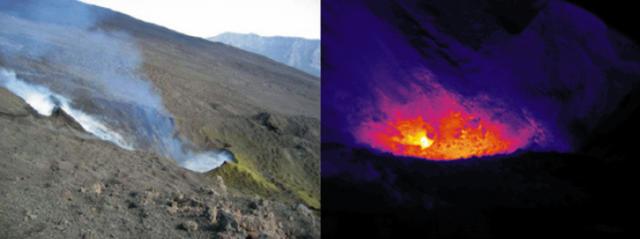
Frequent explosive activity continued throughout the reporting period, generally in the low-to-medium range, based on the number of hourly explosions in the summit crater (figure 253, table 16). Intermittent thermal activity was recorded by the MIROVA (Middle InfraRed Observation of Volcanic Activity) analysis of MODIS satellite data (figure 254). According to data collected by the MODVOLC thermal algorithm, a total of 9 thermal alerts were detected: one on 2 January 2023, one on 1 February, five on 24 March, and two on 26 March. The stronger pulses of thermal activity likely reflected lava flow events. Infrared satellite imagery captured relatively strong thermal hotspots at the two active summit craters on clear weather days, showing an especially strong event on 8 March (figure 255).
Table 16. Summary of type, frequency, and intensity of explosive activity at Stromboli by month during January-April 2023; information from webcam observations. Courtesy of INGV weekly reports.
| Month |
Explosive Activity |
| Jan 2023 |
Typical Strombolian activity with spattering and lava overflows in the N crater area. Explosions were reported from 4 vents in the N area and 1-2 vents in the CS area. The average hourly frequency of explosions was low-to-medium (1-12 events/hour). The intensity of the explosions varied from low (less than 80 m high) to medium (less than 150 m high) in the N crater area and up to high (greater than 150 m high) in the CS crater area. |
| Feb 2023 |
Typical Strombolian activity with spattering in the N crater area. Explosions were reported from 2-3 vents in the N area and 1-4 vents in the CS area. The average hourly frequency of explosions was low-to-medium (1-14 events/hour). The intensity of the explosions varied from low (less than 80 m high) to medium (less than 150 m high) in the N crater area and up to high (greater than 150 m high) in the CS crater area. |
| Mar 2023 |
Typical Strombolian activity with spattering and lava overflows in the N crater area. Explosions were reported from 2-3 vents in the N area and 2-4 vents in the CS area. The average hourly frequency of explosions was low-to-medium (1-18 events/hour). The intensity of the explosions varied from low (less than 80 m high) to medium (less than 150 m high) in the N crater area and up to high (greater than 150 m high) in the CS crater area. |
| Apr 2023 |
Typical Strombolian activity. Explosions were reported from 2 vents in the N area and 2-3 vents in the CS area. The average hourly frequency of explosions was low-to-high (1-16 events/hour). The intensity of the explosions varied from low (less than 80 m high) to medium (less than 150 m high) in both the N and CS crater areas. |
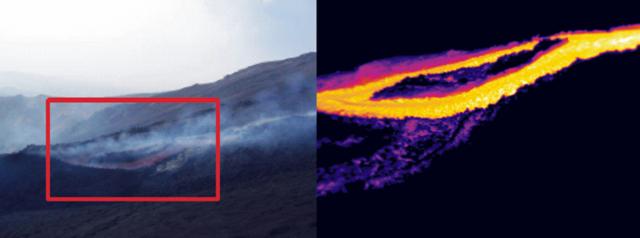
Activity during January-February 2023. Strombolian explosions were reported in the N crater area, as well as lava effusion. Explosive activity in the N crater area ejected coarse material (bombs and lapilli). Intense spattering was observed in both the N1 and N2 craters. In the CS crater area, explosions generally ejected fine material (ash), sometimes to heights greater than 250 m. The intensity of the explosions was characterized as low-to-medium in the N crater and medium-to-high in the CS crater. After intense spattering activity from the N crater area, a lava overflow began at 2136 on 2 January that flowed part way down the Sciara del Fuoco, possibly moving down the drainage that formed in October, out of view from webcams. The flow remained active for a couple of hours before stopping and beginning to cool. A second lava flow was reported at 0224 on 4 January that similarly remained active for a few hours before stopping and cooling. Intense spattering was observed on 11 and 13 January from the N1 crater. After intense spattering activity at the N2 crater at 1052 on 17 January another lava flow started to flow into the upper part of the Sciara del Fuoco (figure 256), dividing into two: one that traveled in the direction of the drainage formed in October, and the other one moving parallel to the point of emission. By the afternoon, the rate of the flow began to decrease, and at 1900 it started to cool. A lava flow was reported at 1519 on 24 January following intense spattering in the N2 area, which began to flow into the upper part of the Sciara del Fuoco. By the morning of 25 January, the lava flow had begun to cool. During 27 January the frequency of eruption in the CS crater area increased to 6-7 events/hour compared to the typical 1-7 events/hour; the following two days showed a decrease in frequency to less than 1 event/hour. Starting at 1007 on 30 January a high-energy explosive sequence was produced by vents in the CS crater area. The sequence began with an initial energetic pulse that lasted 45 seconds, ejecting predominantly coarse products 300 m above the crater that fell in an ESE direction. Subsequent and less intense explosions ejected material 100 m above the crater. The total duration of this event lasted approximately two minutes. During 31 January through 6, 13, and 24 February spattering activity was particularly intense for short periods in the N2 crater.
An explosive sequence was reported on 16 February that was characterized by a major explosion in the CS crater area (figure 257). The sequence began at 1817 near the S2 crater that ejected material radially. A few seconds later, lava fountains were observed in the central part of the crater. Three explosions of medium intensity (material was ejected less than 150 m high) were recorded at the S2 crater. The first part of this sequence lasted approximately one minute, according to INGV, and material rose 300 m above the crater and then was deposited along the Sciara del Fuoco. The second phase began at 1818 at the S1 crater; it lasted seven seconds and material was ejected 150 m above the crater. Another event 20 seconds later lasted 12 seconds, also ejecting material 150 m above the crater. The sequence ended with at least three explosions of mostly fine material from the S1 crater. The total duration of this sequence was about two minutes.
Short, intense spattering activity was noted above the N1 crater on 27 and 28 February. A lava overflow was first reported at 0657 from the N2 crater on 27 February that flowed into the October 2022 drainage. By 1900 the flow had stopped. A second lava overflow also in the N crater area occurred at 2149, which overlapped the first flow and then stopped by 0150 on 28 February. Material detached from both the lava overflows rolled down the Sciara del Fuoco, some of which was visible in webcam images.
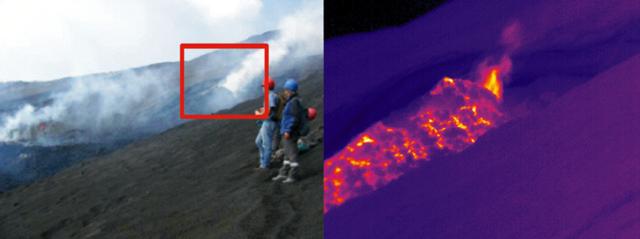
Activity during March-April 2023. Strombolian activity continued with spattering activity and lava overflows in the N crater area during March. Explosive activity at the N crater area varied from low (less than 80 m high) to medium (less than 150 m high) and ejected coarse material, such as bombs and lapilli. Spattering was observed above the N1 crater, while explosive activity at the CS crater area varied from medium to high (greater than 150 m high) and ejected coarse material. Intense spattering activity was observed for short periods on 6 March above the N1 crater. At approximately 0610 a lava overflow was reported around the N2 crater on 8 March, which then flowed into the October 2022 drainage. By 1700 the flow started to cool. A second overflow began at 1712 on 9 March and overlapped the previous flow. It had stopped by 2100. Material from both flows was deposited along the Sciara del Fuoco, though much of the activity was not visible in webcam images. On 11 March a lava overflow was observed at 0215 that overlapped the two previous flows in the October 2022 drainage. By late afternoon on 12 March, it had stopped.
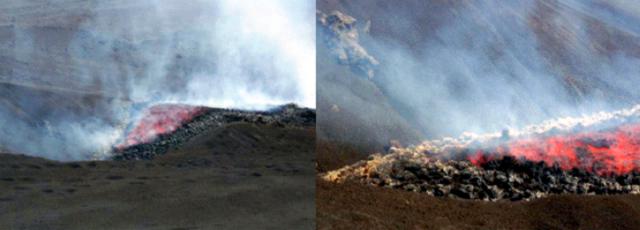
During a field excursion on 16 March, scientists noted that a vent in the central crater area was degassing. Another vent showed occasional Strombolian activity that emitted ash and lapilli. During 1200-1430 low-to-medium intense activity was reported; the N1 crater emitted ash emissions and the N2 crater emitted both ash and coarse material. Some explosions also occurred in the CS crater area that ejected coarse material. The C crater in the CS crater area occasionally showed gas jetting and low intensity explosions on 17 and 22 March; no activity was observed at the S1 crater. Intense, longer periods of spattering were reported in the N1 crater on 19, 24, and 25 March. Around 2242 on 23 March a lava overflow began from the N1 crater that, after about an hour, began moving down the October 2022 drainage and flow along the Sciara del Fuoco (figure 258). Between 0200 and 0400 on 26 March the flow rate increased, which generated avalanches of material from collapses at the advancing flow front. By early afternoon, the flow began to cool. On 25 March at 1548 an explosive sequence began from one of the vents at S2 in the CS crater area (figure 258). Fine ash mixed with coarse material was ejected 300 m above the crater rim and drifted SSE. Some modest explosions around Vent C were detected at 1549 on 25 March, which included an explosion at 1551 that ejected coarse material. The entire explosive sequence lasted approximately three minutes.
During April explosions persisted in both the N and CS crater areas. Fine material was ejected less than 80 m above the N crater rim until 6 April, followed by ejection of coarser material. Fine material was also ejected less than 80 m above the CS crater rim. The C and S2 crater did not show significant eruptive activity. On 7 April an explosive sequence was detected in the CS crater area at 1203 (figure 259). The first explosion lasted approximately 18 seconds and ejected material 400 m above the crater rim, depositing pyroclastic material in the upper part of the Sciara del Fuoco. At 1204 a second, less intense explosion lasted approximately four seconds and deposited pyroclastic products outside the crater area and near Pizzo Sopra La Fossa. A third explosion at 1205 was mainly composed of ash that rose about 150 m above the crater and lasted roughly 20 seconds. A fourth explosion occurred at 1205 about 28 seconds after the third explosion and ejected a mixture of coarse and fine material about 200 m above the crater; the explosion lasted roughly seven seconds. Overall, the entire explosive sequence lasted about two minutes and 20 seconds. After the explosive sequence on 7 April, explosions in both the N and CS crater areas ejected material as high as 150 m above the crater.
On 21 April research scientists from INGV made field observations in the summit area of Stromboli, and some lapilli samples were collected. In the N crater area near the N1 crater, a small cone was observed with at least two active vents, one of which was characterized by Strombolian explosions. The other vent produced explosions that ejected ash and chunks of cooled lava. At the N2 crater at least one vent was active and frequently emitted ash. In the CS crater area, a small cone contained 2-3 degassing vents and a smaller, possible fissure area also showed signs of degassing close to the Pizzo Sopra La Fossa. In the S part of the crater, three vents were active: a small hornito was characterized by modest and rare explosions, a vent that intermittently produced weak Strombolian explosions, and a vent at the end of the terrace that produced frequent ash emissions. Near the S1 crater there was a hornito that generally emitted weak gas-and-steam emissions, sometimes associated with “gas rings”. On 22 April another field inspection was carried out that reported two large sliding surfaces on the Sciara del Fuoco that showed where blocks frequently descended toward the sea. A thermal anomaly was detected at 0150 on 29 April.
Geologic Background. Spectacular incandescent nighttime explosions at Stromboli have long attracted visitors to the "Lighthouse of the Mediterranean" in the NE Aeolian Islands. This volcano has lent its name to the frequent mild explosive activity that has characterized its eruptions throughout much of historical time. The small island is the emergent summit of a volcano that grew in two main eruptive cycles, the last of which formed the western portion of the island. The Neostromboli eruptive period took place between about 13,000 and 5,000 years ago. The active summit vents are located at the head of the Sciara del Fuoco, a prominent scarp that formed about 5,000 years ago due to a series of slope failures which extends to below sea level. The modern volcano has been constructed within this scarp, which funnels pyroclastic ejecta and lava flows to the NW. Essentially continuous mild Strombolian explosions, sometimes accompanied by lava flows, have been recorded for more than a millennium.
Information Contacts: Istituto Nazionale di Geofisica e Vulcanologia (INGV), Sezione di Catania, Piazza Roma 2, 95123 Catania, Italy, (URL: http://www.ct.ingv.it/en/); MIROVA (Middle InfraRed Observation of Volcanic Activity), a collaborative project between the Universities of Turin and Florence (Italy) supported by the Centre for Volcanic Risk of the Italian Civil Protection Department (URL: http://www.mirovaweb.it/); Hawai'i Institute of Geophysics and Planetology (HIGP) - MODVOLC Thermal Alerts System, School of Ocean and Earth Science and Technology (SOEST), Univ. of Hawai'i, 2525 Correa Road, Honolulu, HI 96822, USA (URL: http://modis.higp.hawaii.edu/); Copernicus Browser, Copernicus Data Space Ecosystem, European Space Agency (URL: https://dataspace.copernicus.eu/browser/).
Nishinoshima (Japan) — July 2023 Cite this Report
Nishinoshima
Japan
27.247°N, 140.874°E; summit elev. 100 m
All times are local (unless otherwise noted)
Small ash plumes and fumarolic activity during November 2022 through April 2023
Nishinoshima is a small island located about 1,000 km S of Tokyo in the Ogasawara Arc in Japan. The island is the summit of a massive submarine volcano that has prominent peaks to the S, W, and NE. Eruptions date back to 1973; the most recent eruption period began in October 2022 and was characterized by ash plumes and fumarolic activity (BGVN 47:12). This report describes ash plumes and fumarolic activity during November 2022 through April 2023 based on monthly reports from the Japan Meteorological Agency (JMA) monthly reports and satellite data.
The most recent eruptive activity prior to the reporting internal occurred on 12 October 2022, when an ash plume rose 3.5 km above the crater rim. An aerial observation conducted by the Japan Coast Guard (JCG) on 25 November reported that white fumaroles rose approximately 200 m above the central crater of a pyroclastic cone (figure 119), and multiple plumes were observed on the ESE flank of the cone. Discolored water ranging from reddish-brown to brown and yellowish-green were visible around the perimeter of the island (figure 119). No significant activity was reported in December.
During an overflight conducted by JCG on 25 January 2023 intermittent activity and small, blackish-gray plumes rose 900 m above the central part of the crater were observed (figure 120). The fumarolic zone of the E flank and base of the cone had expanded and emissions had intensified. Dark brown discolored water was visible around the perimeter of the island.
No significant activity was reported during February through March. Ash plumes at 1050 and 1420 on 11 April rose 1.9 km above the crater rim and drifted NW and N. These were the first ash plumes observed since 12 October 2022. On 14 April JCG carried out an overflight and reported that no further eruptive activity was visible, although white gas-and-steam plumes were visible from the central crater and rose 900 m high (figure 121). Brownish and yellow-green discolored water surrounded the island.
Intermittent low-to-moderate power thermal anomalies were recorded in the MIROVA graph (Middle InfraRed Observation of Volcanic Activity) during November 2022 through April 2023 (figure 123). A cluster of six to eight anomalies were detected during November while a smaller number were detected during the following months: two to three during December, one during mid-January 2023, one during February, five during March, and two during April. Thermal activity was also reflected in infrared satellite data at the summit crater, accompanied by occasional gas-and-steam plumes (figure 124).
Geologic Background. The small island of Nishinoshima was enlarged when several new islands coalesced during an eruption in 1973-74. Multiple eruptions that began in 2013 completely covered the previous exposed surface and continued to enlarge the island. The island is the summit of a massive submarine volcano that has prominent peaks to the S, W, and NE. The summit of the southern cone rises to within 214 m of the ocean surface 9 km SSE.
Information Contacts: Japan Meteorological Agency (JMA), 1-3-4 Otemachi, Chiyoda-ku, Tokyo 100-8122, Japan (URL: http://www.jma.go.jp/jma/indexe.html); MIROVA (Middle InfraRed Observation of Volcanic Activity), a collaborative project between the Universities of Turin and Florence (Italy) supported by the Centre for Volcanic Risk of the Italian Civil Protection Department (URL: http://www.mirovaweb.it/); Copernicus Browser, Copernicus Data Space Ecosystem, European Space Agency (URL: https://dataspace.copernicus.eu/browser/).
Karangetang (Indonesia) — July 2023 Cite this Report
Karangetang
Indonesia
2.781°N, 125.407°E; summit elev. 1797 m
All times are local (unless otherwise noted)
Lava flows, incandescent avalanches, and ash plumes during January-June 2023
Karangetang (also known as Api Siau), at the northern end of the island of Siau, Indonesia, contains five summit craters along a N-S line. More than 40 eruptions have been recorded since 1675; recent eruptions have included frequent explosive activity, sometimes accompanied by pyroclastic flows and lahars. Lava dome growth has occurred in the summit craters and collapses of lava flow fronts have produced pyroclastic flows. The two active summit craters are Kawah Dua (the N crater) and Kawah Utama (the S crater, also referred to as the “Main Crater”). The most recent eruption began in late November 2018 and has more recently consisted of weak thermal activity and gas-and-steam emissions (BGVN 48:01). This report updates activity characterized by lava flows, incandescent avalanches, and ash plumes during January through June 2023 using reports from Pusat Vulkanologi dan Mitigasi Bencana Geologi (PVMBG, also known as CVGHM, or the Center of Volcanology and Geological Hazard Mitigation), MAGMA Indonesia, the Darwin VAAC (Volcano Ash Advisory Center), and satellite data.
Activity during January was relatively low and mainly consisted of white gas-and-steam emissions that rose 25-150 m above Main Crater (S crater) and drifted in different directions. Incandescence was visible from the lava dome in Kawah Dua (the N crater). Weather conditions often prevented clear views of the summit. On 18 January the number of seismic signals that indicated avalanches of material began to increase. In addition, there were a total of 71 earthquakes detected during the month.
Activity continued to increase during the first week of February. Material from Main Crater traveled as far as 800 m down the Batuawang (S) and Batang (W) drainages and as far as 1 km W down the Beha (W) drainage on 4 February. On 6 February 43 earthquake events were recorded, and on 7 February, 62 events were recorded. White gas-and-steam emissions rose 25-250 m above both summit craters throughout the month. PVMBG reported an eruption began during the evening of 8 February around 1700. Photos showed incandescent material at Main Crater. Incandescent material had also descended the flank in at least two unconfirmed directions as far as 2 km from Main Crater, accompanied by ash plumes (figure 60). As a result, PVMBG increased the Volcano Alert Level (VAL) to 3 (the second highest level on a 1-4 scale).
Occasional nighttime webcam images showed three main incandescent lava flows of differing lengths traveling down the S, SW, and W flanks (figure 61). Incandescent rocks were visible on the upper flanks, possibly from ejected or collapsed material from the crater, and incandescence was the most intense at the summit. Based on analyses of satellite imagery and weather models, the Darwin VAAC reported that daily ash plumes during 16-20 February rose to 2.1-3 km altitude and drifted NNE, E, and SE. BNPB reported on 16 February that as many as 77 people were evacuated and relocated to the East Siau Museum. A webcam image taken at 2156 on 17 February possibly showed incandescent material descending the SE flank. Ash plumes rose to 2.1 km altitude and drifted SE during 22-23 February, according to the Darwin VAAC.
Incandescent avalanches of material and summit incandescence at Main Crater continued during March. White gas-and-steam emissions during March generally rose 25-150 m above the summit crater; on 31 March gas-and-steam emissions rose 200-400 m high. An ash plume rose to 2.4 km altitude and drifted S at 1710 on 9 March and a large thermal anomaly was visible in images taken at 0550 and 0930 on 10 March. Incandescent material was visible at the summit and on the flanks based on webcam images taken at 0007 and 2345 on 16 March, at 1828 on 17 March, at 1940 on 18 March, at 2311 on 19 March, and at 2351 on 20 March. Incandescence was most intense on 18 and 20 March and webcam images showed possible Strombolian explosions (figure 62). An ash plume rose to 2.4 km altitude and drifted SW on 18 March, accompanied by a thermal anomaly.
Summit crater incandescence at Main Crater and on the flanks persisted during April. Incandescent material at the S crater and on the flanks was reported at 0016 on 1 April. The lava flows had stopped by 1 April according to PVMBG, although incandescence was still visible up to 10 m high. Seismic signals indicating effusion decreased and by 6 April they were no longer detected. Incandescence was visible from both summit craters. On 26 April the VAL was lowered to 2 (the second lowest level on a 1-4 scale). White gas-and-steam emissions rose 25-200 m above the summit crater.
During May white gas-and-steam emissions generally rose 50-250 m above the summit, though it was often cloudy, which prevented clear views; on 21 May gas-and-steam emissions rose 50-400 m high. Nighttime N summit crater incandescence rose 10-25 m above the lava dome, and less intense incandescence was noted above Main Crater, which reached about 10 m above the dome. Sounds of falling rocks at Main Crater were heard on 15 May and the seismic network recorded 32 rockfall events in the crater on 17 May. Avalanches traveled as far as 1.5 km down the SW and S flanks, accompanied by rumbling sounds on 18 May. Incandescent material descending the flanks was captured in a webcam image at 2025 on 19 May (figure 63) and on 29 May; summit crater incandescence was observed in webcam images at 2332 on 26 May and at 2304 on 29 May. On 19 May the VAL was again raised to 3.
Occasional Main Crater incandescence was reported during June, as well as incandescent material on the flanks. White gas-and-steam emissions rose 10-200 m above the summit crater. Ash plumes rose to 2.1 km altitude and drifted SE and E during 2-4 June, according to the Darwin VAAC. Material on the flanks of Main Crater were observed at 2225 on 7 June, at 2051 on 9 June, at 0007 on 17 June, and at 0440 on 18 June. Webcam images taken on 21, 25, and 27 June showed incandescence at Main Crater and from material on the flanks.
MIROVA (Middle InfraRed Observation of Volcanic Activity) analysis of MODIS satellite data showed strong thermal activity during mid-February through March and mid-May through June, which represented incandescent avalanches and lava flows (figure 64). During April through mid-May the power of the anomalies decreased but frequent anomalies were still detected. Brief gaps in activity occurred during late March through early April and during mid-June. Infrared satellite images showed strong lava flows mainly affecting the SW and S flanks, accompanied by gas-and-steam emissions (figure 65). According to data recorded by the MODVOLC thermal algorithm, there were a total of 79 thermal hotspots detected: 28 during February, 24 during March, one during April, five during May, and 21 during June.
Geologic Background. Karangetang (Api Siau) volcano lies at the northern end of the island of Siau, about 125 km NNE of the NE-most point of Sulawesi. The stratovolcano contains five summit craters along a N-S line. It is one of Indonesia's most active volcanoes, with more than 40 eruptions recorded since 1675 and many additional small eruptions that were not documented (Neumann van Padang, 1951). Twentieth-century eruptions have included frequent explosive activity sometimes accompanied by pyroclastic flows and lahars. Lava dome growth has occurred in the summit craters; collapse of lava flow fronts have produced pyroclastic flows.
Information Contacts: Pusat Vulkanologi dan Mitigasi Bencana Geologi (PVMBG, also known as Indonesian Center for Volcanology and Geological Hazard Mitigation, CVGHM), Jalan Diponegoro 57, Bandung 40122, Indonesia (URL: http://www.vsi.esdm.go.id/); MAGMA Indonesia, Kementerian Energi dan Sumber Daya Mineral (URL: https://magma.esdm.go.id/v1); Badan Nasional Penanggulangan Bencana (BNPB), National Disaster Management Agency, Graha BNPB - Jl. Scout Kav.38, East Jakarta 13120, Indonesia (URL: http://www.bnpb.go.id/); Darwin Volcanic Ash Advisory Centre (VAAC), Bureau of Meteorology, Northern Territory Regional Office, PO Box 40050, Casuarina, NT 0811, Australia (URL: http://www.bom.gov.au/info/vaac/); MIROVA (Middle InfraRed Observation of Volcanic Activity), a collaborative project between the Universities of Turin and Florence (Italy) supported by the Centre for Volcanic Risk of the Italian Civil Protection Department (URL: http://www.mirovaweb.it/); Hawai'i Institute of Geophysics and Planetology (HIGP) - MODVOLC Thermal Alerts System, School of Ocean and Earth Science and Technology (SOEST), Univ. of Hawai'i, 2525 Correa Road, Honolulu, HI 96822, USA (URL: http://modis.higp.hawaii.edu/); Copernicus Browser, Copernicus Data Space Ecosystem, European Space Agency (URL: https://dataspace.copernicus.eu/browser/); IDN Times, Jl. Jend. Gatot Subroto Kav. 27 3rd Floor Kuningan, Jakarta, Indonesia 12950, Status of Karangetang Volcano in Sitaro Islands Increases (URL: https://sulsel.idntimes.com/news/indonesia/savi/status-gunung-api-karangetang-di-kepulauan-sitaro-meningkat?page=all).
Ahyi (United States) — July 2023 Cite this Report
Ahyi
United States
20.42°N, 145.03°E; summit elev. -75 m
All times are local (unless otherwise noted)
Intermittent hydroacoustic signals and discolored plumes during November 2022-June 2023
Ahyi seamount is a large, conical submarine volcano that rises to within 75 m of the ocean surface about 18 km SE of the island of Farallon de Pajaros in the Northern Marianas. The remote location of the seamount has made eruptions difficult to document, but seismic stations installed in the region confirmed an eruption in the vicinity in 2001. No new activity was detected until April-May 2014 when an eruption was detected by NOAA (National Oceanic and Atmospheric Administration) divers, hydroacoustic sensors, and seismic stations (BGVN 42:04). New activity was first detected on 15 November by hydroacoustic sensors that were consistent with submarine volcanic activity. This report covers activity during November 2022 through June 2023 based on daily and weekly reports from the US Geological Survey.
Starting in mid-October, hydroacoustic sensors at Wake Island (2.2 km E) recorded signals consistent with submarine volcanic activity, according to a report from the USGS issued on 15 November 2022. A combined analysis of the hydroacoustic signals and seismic stations located at Guam and Chichijima Island, Japan, suggested that the source of this activity was at or near the Ahyi seamount. After a re-analysis of a satellite image of the area that was captured on 6 November, USGS confirmed that there was no evidence of discoloration at the ocean surface. Few hydroacoustic and seismic signals continued through November, including on 18 November, which USGS suggested signified a decline or pause in unrest. A VONA (Volcano Observatory Notice for Aviation) reported that a discolored water plume was persistently visible in satellite data starting on 18 November (figure 6). Though clouds often obscured clear views of the volcano, another discolored water plume was captured in a satellite image on 26 November. The Aviation Color Code (ACC) was raised to Yellow (the second lowest level on a four-color scale) and the Volcano Alert Level (VAL) was raised to Advisory (the second lowest level on a four-level scale) on 29 November.
During December, occasional detections were recorded on the Wake Island hydrophone sensors and discolored water over the seamount remained visible. During 2-7, 10-12, and 16-31 December possible explosion signals were detected. A small area of discolored water was observed in high-resolution Sentinel-2 satellite images during 1-6 December (figure 7). High-resolution satellite images recorded discolored water plumes on 13 December that originated from the summit region; no observations indicated that activity breached the ocean surface. A possible underwater plume was visible in satellite images on 18 December, and during 19-20 December a definite but diffuse underwater plume located SSE from the main vent was reported. An underwater plume was visible in a satellite image taken on 26 December (figure 7).
Hydrophone sensors continued to detect signals consistent with possible explosions during 1-8 January 2023. USGS reported that the number of detections decreased during 4-5 January. The hydrophone sensors experienced a data outage that started at 0118 on 8 January and continued through 10 January, though according to USGS, possible explosions were recorded prior to the data outage and likely continued during the outage. A discolored water plume originating from the summit region was detected in a partly cloudy satellite image on 8 January. On 11-12 and 15-17 January possible explosion signals were recorded again. One small signal was detected during 22-23 January and several signals were recorded on 25 and 31 January. During 27-31 January a plume of discolored water was observed above the seamount in satellite imagery (figure 8).
Low levels of activity continued during February and March, based on data from pressure sensors on Wake Island. During 1 and 4-6 February activity was reported, and a submarine plume was observed on 4 February (figure 8). Possible explosion signals were detected during 7-8, 10, 13-14, and 24 February. During 1-2 and 3-5 March a plume of discolored water was observed in satellite imagery (figure 8). Almost continuous hydroacoustic signals were detected in remote pressure sensor data on Wake Island 2,270 km E from the volcano during 7-13 March. During 12-13 March water discoloration around the seamount was observed in satellite imagery, despite cloudy weather. By 14 March discolored water extended about 35 km, but no direction was noted. USGS reported that the continuous hydroacoustic signals detected during 13-14 March stopped abruptly on 14 March and no new detections were observed. Three 30 second hydroacoustic detections were reported during 17-19 March, but no activity was visible due to cloudy weather. A data outage was reported during 21-22 March, making pressure sensor data unavailable; a discolored water plume was, however, visible in satellite data. A possible underwater explosion signal was detected by pressure sensors at Wake Island on 26, 29, and 31 March, though the cause and origin of these events were unclear.
Similar low activity continued during April, May, and June. Several signals were detected during 1-3 April in pressure sensors at Wake Island. USGS suggested that these may be related to underwater explosions or earthquakes at the volcano, but no underwater plumes were visible in clear satellite images. The pressure sensors had data outages during 12-13 April and no data were recorded; no underwater plumes were visible in satellite images, although cloudy weather obscured most clear views. Eruptive activity was reported starting at 2210 on 21 May. On 22 May a discolored water plume that extended 4 km was visible in satellite images, though no direction was recorded. During 23-24 May some signals were detected by the underwater pressure sensors. Possible hydroacoustic signals were detected during 2-3 and 6-8 June. Multiple hydroacoustic signals were detected during 9-11 and 16-17 June, although no activity was visible in satellite images. One hydroacoustic signal was detected during 23-24 June, but there was some uncertainty about its association with volcanic activity. A single possible hydroacoustic signal was detected during 30 June to 1 July.
Geologic Background. Ahyi seamount is a large conical submarine volcano that rises to within 75 m of the ocean surface ~18 km SE of the island of Farallon de Pajaros in the northern Marianas. Water discoloration has been observed there, and in 1979 the crew of a fishing boat felt shocks over the summit area, followed by upwelling of sulfur-bearing water. On 24-25 April 2001 an explosive eruption was detected seismically by a station on Rangiroa Atoll, Tuamotu Archipelago. The event was well constrained (+/- 15 km) at a location near the southern base of Ahyi. An eruption in April-May 2014 was detected by NOAA divers, hydroacoustic sensors, and seismic stations.
Information Contacts: US Geological Survey, Volcano Hazards Program (USGS-VHP), 12201 Sunrise Valley Drive, Reston, VA, USA, https://volcanoes.usgs.gov/index.html; Copernicus Browser, Copernicus Data Space Ecosystem, European Space Agency (URL: https://dataspace.copernicus.eu/browser/).
Kadovar (Papua New Guinea) — June 2023 Cite this Report
Kadovar
Papua New Guinea
3.608°S, 144.588°E; summit elev. 365 m
All times are local (unless otherwise noted)
An ash plume and weak thermal anomaly during May 2023
Kadovar is a 2-km-wide island that is the emergent summit of a Bismarck Sea stratovolcano. It lies off the coast of New Guinea, about 25 km N of the mouth of the Sepik River. Prior to an eruption that began in 2018, a lava dome formed the high point of the volcano, filling an arcuate landslide scarp open to the S. Submarine debris-avalanche deposits occur to the S of the island. The current eruption began in January 2018 and has comprised lava effusion from vents at the summit and at the E coast; more recent activity has consisted of ash plumes, weak thermal activity, and gas-and-steam plumes (BGVN 48:02). This report covers activity during February through May 2023 using information from the Darwin Volcanic Ash Advisory Center (VAAC) and satellite data.
Activity during the reporting period was relatively low and mainly consisted of white gas-and-steam plumes that were visible in natural color satellite images on clear weather days (figure 67). According to a Darwin VAAC report, at 2040 on 6 May an ash plume rose to 4.6 km altitude and drifted W; by 2300 the plume had dissipated. MODIS satellite instruments using the MODVOLC thermal algorithm detected a single thermal hotspot on the SE side of the island on 7 May. Weak thermal activity was also detected in a satellite image on the E side of the island on 14 May, accompanied by a white gas-and-steam plume that drifted SE (figure 68).
Geologic Background. The 2-km-wide island of Kadovar is the emergent summit of a Bismarck Sea stratovolcano of Holocene age. It is part of the Schouten Islands, and lies off the coast of New Guinea, about 25 km N of the mouth of the Sepik River. Prior to an eruption that began in 2018, a lava dome formed the high point of the andesitic volcano, filling an arcuate landslide scarp open to the south; submarine debris-avalanche deposits occur in that direction. Thick lava flows with columnar jointing forms low cliffs along the coast. The youthful island lacks fringing or offshore reefs. A period of heightened thermal phenomena took place in 1976. An eruption began in January 2018 that included lava effusion from vents at the summit and at the E coast.
Information Contacts: Darwin Volcanic Ash Advisory Centre (VAAC), Bureau of Meteorology, Northern Territory Regional Office, PO Box 40050, Casuarina, NT 0811, Australia (URL: http://www.bom.gov.au/info/vaac/); Hawai'i Institute of Geophysics and Planetology (HIGP) - MODVOLC Thermal Alerts System, School of Ocean and Earth Science and Technology (SOEST), Univ. of Hawai'i, 2525 Correa Road, Honolulu, HI 96822, USA (URL: http://modis.higp.hawaii.edu/); Copernicus Browser, Copernicus Data Space Ecosystem, European Space Agency (URL: https://dataspace.copernicus.eu/browser/).
San Miguel (El Salvador) — June 2023 Cite this Report
San Miguel
El Salvador
13.434°N, 88.269°W; summit elev. 2130 m
All times are local (unless otherwise noted)
Small gas-and-ash explosions during March and May 2023
San Miguel in El Salvador is a broad, deep crater complex that has been frequently modified by eruptions recorded since the early 16th century and consists of the summit known locally as Chaparrastique. Flank eruptions have produced lava flows that extended to the N, NE, and SE during the 17-19th centuries. The most recent activity has consisted of minor ash eruptions from the summit crater. The current eruption period began in November 2022 and has been characterized by frequent phreatic explosions, gas-and-ash emissions, and sulfur dioxide plumes (BGVN 47:12). This report describes small gas-and-ash explosions during December 2022 through May 2023 based on special reports from the Ministero de Medio Ambiente y Recursos Naturales (MARN).
Activity has been relatively low since the last recorded explosions on 29 November 2022. Seismicity recorded by the San Miguel Volcano Station (VSM) located on the N flank at 1.7 km elevation had decreased by 7 December. Sulfur dioxide gas measurements taken with DOAS (Differential Optical Absorption Spectroscopy) mobile equipment were below typical previously recorded values: 300 tons per day (t/d). During December, small explosions were recorded by the seismic network and manifested as gas-and-steam emissions.
Gas-and-ash explosions in the crater occurred during January 2023, which were recorded by the seismic network. Sulfur dioxide values remained low, between 300-400 t/d through 10 March. At 0817 on 14 January a gas-and-ash emission was visible in webcam images, rising just above the crater rim. Some mornings during February, small gas-and-steam plumes were visible in the crater. On 7 March at 2252 MARN noted an increase in degassing from the central crater; gas emissions were constantly observed through the early morning hours on 8 March. During the early morning of 8 March through the afternoon on 9 March, 12 emissions were registered, some accompanied by ash. The last gas-and-ash emission was recorded at 1210 on 9 March; very fine ashfall was reported in El Tránsito (10 km S), La Morita (6 km W), and La Piedrita (3 km W). The smell of sulfur was reported in Piedra Azul (5 km SW). On 16 March MARN reported that gas-and-steam emissions decreased.
Low degassing and very low seismicity were reported during April; no explosions have been detected between 9 March and 27 May. The sulfur dioxide emissions remained between 350-400 t/d; during 13-20 April sulfur dioxide values fluctuated between 30-300 t/d. Activity remained low through most of May; on 23 May seismicity increased. An explosion was detected at 1647 on 27 May generated a gas-and-ash plume that rose 700 m high (figure 32); a decrease in seismicity and gas emissions followed. The DOAS station installed on the W flank recorded sulfur dioxide values that reached 400 t/d on 27 May; subsequent measurements showed a decrease to 268 t/d on 28 May and 100 t/d on 29 May.
Geologic Background. The symmetrical cone of San Miguel, one of the most active volcanoes in El Salvador, rises from near sea level to form one of the country's most prominent landmarks. A broad, deep, crater complex that has been frequently modified by eruptions recorded since the early 16th century caps the truncated unvegetated summit, also known locally as Chaparrastique. Flanks eruptions of the basaltic-andesitic volcano have produced many lava flows, including several during the 17th-19th centuries that extended to the N, NE, and SE. The SE-flank flows are the largest and form broad, sparsely vegetated lava fields crossed by highways and a railroad skirting the base of the volcano. Flank vent locations have migrated higher on the edifice during historical time, and the most recent activity has consisted of minor ash eruptions from the summit crater.
Information Contacts: Ministero de Medio Ambiente y Recursos Naturales (MARN), Km. 5½ Carretera a Nueva San Salvador, Avenida las Mercedes, San Salvador, El Salvador (URL: http://www.snet.gob.sv/ver/vulcanologia).
Semisopochnoi (United States) — June 2023 Cite this Report
Semisopochnoi
United States
51.93°N, 179.58°E; summit elev. 1221 m
All times are local (unless otherwise noted)
Occasional explosions, ash deposits, and gas-and-steam plumes during December 2022-May 2023
Semisopochnoi is located in the western Aleutians, is 20-km-wide at sea level, and contains an 8-km-wide caldera. The three-peaked Mount Young (formerly Cerberus) was constructed within the caldera during the Holocene. Each of these peaks contains a summit crater; the lava flows on the N flank appear younger than those on the S side. The current eruption period began in early February 2021 and has more recently consisted of intermittent explosions and ash emissions (BGVN 47:12). This report updates activity during December 2022 through May 2023 using daily, weekly, and special reports from the Alaska Volcano Observatory (AVO). AVO monitors the volcano using local seismic and infrasound sensors, satellite data, web cameras, and remote infrasound and lightning networks.
Activity during most of December 2022 was relatively quiet; according to AVO no eruptive or explosive activity was observed since 7 November 2022. Intermittent tremor and occasional small earthquakes were observed in geophysical data. Continuous gas-and-steam emissions were observed from the N crater of Mount Young in webcam images on clear weather days (figure 25). On 24 December, there was a slight increase in earthquake activity and several small possible explosion signals were detected in infrasound data. Eruptive activity resumed on 27 December at the N crater of Mount Young; AVO issued a Volcano Activity Notice (VAN) that reported minor ash deposits on the flanks of Mount Young that extended as far as 1 km from the vent, according to webcam images taken during 27-28 December (figure 26). No ash plumes were observed in webcam or satellite imagery, but a persistent gas-and-steam plume that might have contained some ash rose to 1.5 km altitude. As a result, AVO raised the Aviation Color Code (ACC) to Orange (the second highest level on a four-color scale) and the Volcano Alert Level (VAL) to Watch (the second highest level on a four-level scale). Possible explosions were detected during 21 December 2022 through 1 January 2023 and seismic tremor was recorded during 30-31 December.
During January 2023 eruptive activity continued at the active N crater of Mount Young. Minor ash deposits were observed on the flanks, extending about 2 km SSW, based on webcam images from 1 and 3 January. A possible explosion occurred during 1-2 January based on elevated seismicity recorded on local seismometers and an infrasound signal recorded minutes later by an array at Adak. Though no ash plumes were observed in webcam or satellite imagery, a persistent gas-and-steam plume rose to 1.5 km altitude that might have carried minor traces of ash. Ash deposits were accompanied by periods of elevated seismicity and infrasound signals from the local geophysical network, which AVO reported were likely due to weak explosive activity. Low-level explosive activity was also detected during 2-3 January, with minor gas-and-steam emissions and a new ash deposit that was visible in webcam images. Low-level explosive activity was detected in geophysical data during 4-5 January, with elevated seismicity and infrasound signals observed on local stations. Volcanic tremor was detected during 7-9 January and very weak explosive activity was detected in seismic and infrasound data on 9 January. Weak seismic and infrasound signals were recorded on 17 January, which indicated minor explosive activity, but no ash emissions were observed in clear webcam images; a gas-and-steam plume continued to rise to 1.5 km altitude. During 29-30 January, ash deposits near the summit were observed on fresh snow, according to webcam images.
The active N cone at Mount Young continued to produce a gas-and-steam plume during February, but no ash emissions or explosive events were detected. Seismicity remained elevated with faint tremor during early February. Gas-and-steam emissions from the N crater were observed in clear webcam images on 11-13 and 16 February; no explosive activity was detected in seismic, infrasound, or satellite data. Seismicity has also decreased, with no significant seismic tremor observed since 25 January. Therefore, the ACC was lowered to Yellow (the second lowest level on a four-color scale) and the VAL was lowered to Advisory (the second lowest level on a four-color scale) on 22 February.
Gas-and-steam emissions persisted during March from the N cone of Mount Young, based on clear webcam images. A few brief episodes of weak tremor were detected in seismic data, although seismicity decreased over the month. A gas-and-steam plume detected in satellite data extended 150 km on 18 March. Low-level ash emissions from the N cone at Mount Young were observed in several webcam images during 18-19 March, in addition to small explosions and volcanic tremor. The ACC was raised to Orange and the VAL increased to Watch on 19 March. A small explosion was detected in seismic and infrasound data on 21 March.
Low-level unrest continued during April, although cloudy weather often obscured views of the summit; periods of seismic tremor and local earthquakes were recorded. During 3-4 April a gas-and-steam plume was visible traveling more than 200 km overnight; no ash was evident in the plume, according to AVO. A gas-and-steam plume was observed during 4-6 April that extended 400 km but did not seem to contain ash. Small explosions were detected in seismic and infrasound data on 5 April. Occasional clear webcam images showed continuing gas-and-steam emissions rose from Mount Young, but no ash deposits were observed on the snow. On 19 April small explosions and tremor were detected in seismic and infrasound data. A period of seismic tremor was detected during 22-25 April, with possible weak explosions on 25 April. Ash deposits were visible near the crater rim, but it was unclear if these deposits were recent or due to older deposits.
Occasional small earthquakes were recorded during May, but there were no signs of explosive activity seen in geophysical data. Gas-and-steam emissions continued from the N crater of Mount Young, based on webcam images, and seismicity remained slightly elevated. A new, light ash deposit was visible during the morning of 5 May on fresh snow on the NW flank of Mount Young. During 10 May periods of volcanic tremor were observed. The ACC was lowered to Yellow and the VAL to Advisory on 17 May due to no additional evidence of activity.
Geologic Background. Semisopochnoi, the largest subaerial volcano of the western Aleutians, is 20 km wide at sea level and contains an 8-km-wide caldera. It formed as a result of collapse of a low-angle, dominantly basaltic volcano following the eruption of a large volume of dacitic pumice. The high point of the island is Anvil Peak, a double-peaked late-Pleistocene cone that forms much of the island's northern part. The three-peaked Mount Cerberus (renamed Mount Young in 2023) was constructed within the caldera during the Holocene. Each of the peaks contains a summit crater; lava flows on the N flank appear younger than those on the south side. Other post-caldera volcanoes include the symmetrical Sugarloaf Peak SSE of the caldera and Lakeshore Cone, a small cinder cone at the edge of Fenner Lake in the NE part of the caldera. Most documented eruptions have originated from Young, although Coats (1950) considered that both Sugarloaf and Lakeshore Cone could have been recently active.
Information Contacts: Alaska Volcano Observatory (AVO), a cooperative program of a) U.S. Geological Survey, 4200 University Drive, Anchorage, AK 99508-4667 USA (URL: https://avo.alaska.edu/), b) Geophysical Institute, University of Alaska, PO Box 757320, Fairbanks, AK 99775-7320, USA, and c) Alaska Division of Geological & Geophysical Surveys, 794 University Ave., Suite 200, Fairbanks, AK 99709, USA (URL: http://dggs.alaska.gov/).
Ebeko
Russia
50.686°N, 156.014°E; summit elev. 1103 m
All times are local (unless otherwise noted)
Continued explosions, ash plumes, and ashfall during October 2022-May 2023
Ebeko, located on the N end of Paramushir Island in the Kuril Islands, consists of three summit craters along a SSW-NNE line at the northern end of a complex of five volcanic cones. Eruptions date back to the late 18th century and have been characterized as small-to-moderate explosions from the summit crater, accompanied by intense fumarolic activity. The current eruption period began in June 2022 and has recently consisted of frequent explosions, ash plumes, and thermal activity (BGVN 47:10). This report covers similar activity during October 2022 through May 2023, based on information from the Kamchatka Volcanic Eruptions Response Team (KVERT) and satellite data.
Activity during October consisted of explosive activity, ash plumes, and occasional thermal anomalies. Visual data by volcanologists from Severo-Kurilsk showed explosions producing ash clouds up to 2.1-3 km altitude which drifted E, N, NE, and SE during 1-8, 10, 16, and 18 October. KVERT issued several Volcano Observatory Notices for Aviation (VONA) on 7, 13-15, and 27 October 2022, stating that explosions generated ash plumes that rose to 2.3-4 km altitude and drifted 5 km E, NE, and SE. Ashfall was reported in Severo-Kurilsk (Paramushir Island, about 7 km E) on 7 and 13 October. Satellite data showed a thermal anomaly over the volcano on 15-16 October. Visual data showed ash plumes rising to 2.5-3.6 km altitude on 22, 25-29, and 31 October and moving NE due to constant explosions.
Similar activity continued during November, with explosions, ash plumes, and ashfall occurring. KVERT issued VONAs on 1-2, 4, 6-7, 9, 13, and 16 November that reported explosions and resulting ash plumes that rose to 1.7-3.6 km altitude and drifted 3-5 km SE, ESE, E, and NE. On 1 November ash plumes extended as far as 110 km SE. On 5, 8, 12, and 24-25 November explosions and ash plumes rose to 2-3.1 km altitude and drifted N and E. Ashfall was observed in Severo-Kurilsk on 7 and 16 November. A thermal anomaly was visible during 1-4, 16, and 20 November. Explosions during 26 November rose as high as 2.7 km altitude and drifted NE (figure 45).
Explosions and ash plumes continued to occur in December. During 1-2 and 4 December volcanologists from Severo-Kurilsk observed explosions that sent ash to 1.9-2.5 km altitude and drifted NE and SE (figure 46). VONAs were issued on 5, 9, and 16 December reporting that explosions generated ash plumes rising to 1.9 km, 2.6 km, and 2.4 km altitude and drifted 5 km SE, E, and NE, respectively. A thermal anomaly was visible in satellite imagery on 16 December. On 18 and 27-28 December explosions produced ash plumes that rose to 2.5 km altitude and drifted NE and SE. On 31 December an ash plume rose to 2 km altitude and drifted NE.
Explosions continued during January 2023, based on visual observations by volcanologists from Severo-Kurilsk. During 1-7 January explosions generated ash plumes that rose to 4 km altitude and drifted NE, E, W, and SE. According to VONAs issued by KVERT on 2, 4, 10, and 23 January, explosions produced ash plumes that rose to 2-4 km altitude and drifted 5 km N, NE, E, and ENE; the ash plume that rose to 4 km altitude occurred on 10 January (figure 47). Satellite data showed a thermal anomaly during 3-4, 10, 13, 16, 21, 22, and 31 January. KVERT reported that an ash cloud on 4 January moved 12 km NE. On 6 and 9-11 January explosions sent ash plumes to 4.5 km altitude and drifted W and ESE. On 13 January an ash plume rose to 3 km altitude and drifted SE. During 20-24 January ash plumes from explosions rose to 3.7 km altitude and drifted SE, N, and NE. On 21 January the ash plume drifted as far as 40 km NE. During 28-29 and 31 January and 1 February ash plumes rose to 4 km altitude and drifted NE.
During February, explosions, ash plumes, and ashfall were reported. During 1, 4-5 and 7-8 February explosions generated ash plumes that rose to 4.5 km altitude and drifted E and NE; ashfall was observed on 5 and 8 February. On 6 February an explosion produced an ash plume that rose to 3 km altitude and drifted 7 km E, causing ashfall in Severo-Kurilsk. A thermal anomaly was visible in satellite data on 8, 9, 13, and 21 February. Explosions on 9 and 12-13 February produced ash plumes that rose to 4 km altitude and drifted E and NE; the ash cloud on 12 February extended as far as 45 km E. On 22 February explosions sent ash to 3 km altitude that drifted E. During 24 and 26-27 February ash plumes rose to 4 km altitude and drifted E. On 28 February an explosion sent ash to 2.5-3 km altitude and drifted 5 km E; ashfall was observed in Severo-Kurilsk.
Activity continued during March; visual observations showed that explosions generated ash plumes that rose to 3.6 km altitude on 3, 5-7, and 9-12 March and drifted E, NE, and NW. Thermal anomalies were visible on 10, 13, and 29-30 March in satellite imagery. On 18, 21-23, 26, and 29-30 March explosions produced ash plumes that rose to 2.8 km altitude and drifted NE and E; the ash plumes during 22-23 March extended up to 76 km E. A VONA issued on 21 March reported an explosion that produced an ash plume that rose to 2.8 km altitude and drifted 5 km E. Another VONA issued on 23 March reported that satellite data showed an ash plume rising to 3 km altitude and drifted 14 km E.
Explosions during April continued to generate ash plumes. On 1 and 4 April an ash plume rose to 2.8-3.5 km altitude and drifted SE and NE. A thermal anomaly was visible in satellite imagery during 1-6 April. Satellite data showed ash plumes and clouds rising to 2-3 km altitude and drifting up to 12 km SW and E on 3 and 6 April (figure 48). KVERT issued VONAs on 3, 5, 14, 16 April describing explosions that produced ash plumes rising to 3 km, 3.5 km, 3.5 km, and 3 km altitude and drifting 5 km S, 5 km NE and SE, 72 km NNE, and 5 km NE, respectively. According to satellite data, the resulting ash cloud from the explosion on 14 April was 25 x 7 km in size and drifted 72-104 km NNE during 14-15 April. According to visual data by volcanologists from Severo-Kurilsk explosions sent ash up to 3.5 km altitude that drifted NE and E during 15-16, 22, 25-26, and 29 April.
The explosive eruption continued during May. Explosions during 3-4, 6-7, and 9-10 May generated ash plumes that rose to 4 km altitude and drifted SW and E. Satellite data showed a thermal anomaly on 3, 9, 13-14, and 24 May. During 12-16, 23-25, and 27-28 May ash plumes rose to 3.5 km altitude and drifted in different directions due to explosions. Two VONA notices were issued on 16 and 25 May, describing explosions that generated ash plumes rising to 3 km and 3.5 km altitude, respectively and extending 5 km E. The ash cloud on 25 May drifted 75 km SE.
Thermal activity in the summit crater, occasionally accompanied by ash plumes and ash deposits on the SE and E flanks due to frequent explosions, were visible in infrared and true color satellite images (figure 49).
Geologic Background. The flat-topped summit of the central cone of Ebeko volcano, one of the most active in the Kuril Islands, occupies the northern end of Paramushir Island. Three summit craters located along a SSW-NNE line form Ebeko volcano proper, at the northern end of a complex of five volcanic cones. Blocky lava flows extend west from Ebeko and SE from the neighboring Nezametnyi cone. The eastern part of the southern crater contains strong solfataras and a large boiling spring. The central crater is filled by a lake about 20 m deep whose shores are lined with steaming solfataras; the northern crater lies across a narrow, low barrier from the central crater and contains a small, cold crescentic lake. Historical activity, recorded since the late-18th century, has been restricted to small-to-moderate explosive eruptions from the summit craters. Intense fumarolic activity occurs in the summit craters, on the outer flanks of the cone, and in lateral explosion craters.
Information Contacts: Kamchatka Volcanic Eruptions Response Team (KVERT), Far Eastern Branch, Russian Academy of Sciences, 9 Piip Blvd., Petropavlovsk-Kamchatsky, 683006, Russia (URL: http://www.kscnet.ru/ivs/kvert/); MIROVA (Middle InfraRed Observation of Volcanic Activity), a collaborative project between the Universities of Turin and Florence (Italy) supported by the Centre for Volcanic Risk of the Italian Civil Protection Department (URL: http://www.mirovaweb.it/); Copernicus Browser, Copernicus Data Space Ecosystem, European Space Agency (URL: https://dataspace.copernicus.eu/browser/).
Home Reef
Tonga
18.992°S, 174.775°W; summit elev. -10 m
All times are local (unless otherwise noted)
Discolored plumes continued during November 2022-April 2023
Home Reef is a submarine volcano located in the central Tonga islands between Lateiki (Metis Shoal) and Late Island. The first recorded eruption occurred in the mid-19th century, when an ephemeral island formed. An eruption in 1984 produced a 12-km-high eruption plume, a large volume of floating pumice, and an ephemeral island 500 x 1,500 m wide, with cliffs 30-50 m high that enclosed a water-filled crater. Another island-forming eruption in 2006 produced widespread pumice rafts that drifted as far as Australia; by 2008 the island had eroded below sea level. The previous eruption occurred during October 2022 and was characterized by a new island-forming eruption, lava effusion, ash plumes, discolored water, and gas-and-steam plumes (BGVN 47:11). This report covers discolored water plumes during November 2022 through April 2023 using satellite data.
Discolored plumes continued during the reporting period and were observed in true color satellite images on clear weather days. Satellite images show light green-yellow discolored water extending W on 8 and 28 November 2022 (figure 31), and SW on 18 November. Light green-yellow plumes extended W on 3 December, S on 13 December, SW on 18 December, and W and S on 23 December (figure 31). On 12 January 2023 discolored green-yellow plumes extended to the NE, E, SE, and N. The plume moved SE on 17 January and NW on 22 January. Faint discolored water in February was visible moving NE on 1 February. A discolored plume extended NW on 8 and 28 March and NW on 13 March (figure 31). During April, clear weather showed green-blue discolored plumes moving S on 2 April, W on 7 April, and NE and S on 12 April. A strong green-yellow discolored plume extended E and NE on 22 April for several kilometers (figure 31).
Geologic Background. Home Reef, a submarine volcano midway between Metis Shoal and Late Island in the central Tonga islands, was first reported active in the mid-19th century, when an ephemeral island formed. An eruption in 1984 produced a 12-km-high eruption plume, large amounts of floating pumice, and an ephemeral 500 x 1,500 m island, with cliffs 30-50 m high that enclosed a water-filled crater. In 2006 an island-forming eruption produced widespread dacitic pumice rafts that drifted as far as Australia. Another island was built during a September-October 2022 eruption.
Information Contacts: Copernicus Browser, Copernicus Data Space Ecosystem, European Space Agency (URL: https://dataspace.copernicus.eu/browser/).
Ambae
Vanuatu
15.389°S, 167.835°E; summit elev. 1496 m
All times are local (unless otherwise noted)
New lava flow, ash plumes, and sulfur dioxide plumes during February-May 2023
Ambae, also known as Aoba, is a large basaltic shield volcano in Vanuatu. A broad pyroclastic cone containing three crater lakes (Manaro Ngoru, Voui, and Manaro Lakua) is located at the summit within the youngest of at least two nested calderas. Periodic phreatic and pyroclastic explosions have been reported since the 16th century. A large eruption more than 400 years ago resulted in a volcanic cone within the summit crater that is now filled by Lake Voui; the similarly sized Lake Manaro fills the western third of the caldera. The previous eruption ended in August 2022 that was characterized by gas-and-steam and ash emissions and explosions of wet tephra (BGVN 47:10). This report covers a new eruption during February through May 2023 that consisted of a new lava flow, ash plumes, and sulfur dioxide emissions, using information from the Vanuatu Meteorology and Geo-Hazards Department (VMGD) and satellite data.
During the reporting period, the Alert Level remained at a 2 (on a scale of 0-5), which has been in place since December 2021. Activity during October 2022 through March 2023 remained relatively low and mostly consisted of gas-and-steam emissions in Lake Voui. VMGD reported that at 1300 on 15 November a satellite image captured a strong amount of sulfur dioxide rising above the volcano (figure 99), and that seismicity slightly increased. The southern and northern part of the island reported a strong sulfur dioxide smell and heard explosions. On 20 February 2023 a gas-and-ash plume rose 1.3 km above the summit and drifted SSW, according to a webcam image (figure 100). Gas-and-steam and possibly ash emissions continued on 23 February and volcanic earthquakes were recorded by the seismic network.
During April, volcanic earthquakes and gas-and-steam and ash emissions were reported from the cone in Lake Voui. VMGD reported that activity increased during 5-7 April; high gas-and-steam and ash plumes were visible, accompanied by nighttime incandescence. According to a Wellington VAAC report, a low-level ash plume rose as high as 2.5 km above the summit and drifted W and SW on 5 April, based on satellite imagery. Reports in Saratamata stated that a dark ash plume drifted to the WSW, but no loud explosion was heard. Webcam images from 2100 showed incandescence above the crater and reflected in the clouds. According to an aerial survey, field observations, and satellite data, water was no longer present in the lake. A lava flow was reported effusing from the vent and traveling N into the dry Lake Voui, which lasted three days. The next morning at 0745 on 6 April a gas-and-steam and ash plume rose 5.4 km above the summit and drifted ESE, based on information from VMGD (figure 101). The Wellington VAAC also reported that light ashfall was observed on the island. Intermittent gas-and-steam and ash emissions were visible on 7 April, some of which rose to an estimated 3 km above the summit and drifted E. Webcam images during 0107-0730 on 7 April showed continuing ash emissions. A gas-and-steam and ash plume rose 695 m above the summit crater at 0730 on 19 April and drifted ESE, based on a webcam image (figure 102).
According to visual and infrared satellite data, water was visible in Lake Voui as late as 24 March 2023 (figure 103). The vent in the caldera showed a gas-and-steam plume drifted SE. On 3 April thermal activity was first detected, accompanied by a gas-and-ash plume that drifted W (figure 103). The lava flow moved N within the dry lake and was shown cooling by 8 April. By 23 April much of the water in the lake had returned. Occasional sulfur dioxide plumes were detected by the TROPOMI instrument on the Sentinel-5P satellite that exceeded 2 Dobson Units (DU) and drifted in different directions (figure 104).
Geologic Background. The island of Ambae, also known as Aoba, is a massive 2,500 km3 basaltic shield that is the most voluminous volcano of the New Hebrides archipelago. A pronounced NE-SW-trending rift zone with numerous scoria cones gives the 16 x 38 km island an elongated form. A broad pyroclastic cone containing three crater lakes (Manaro Ngoru, Voui, and Manaro Lakua) is located at the summit within the youngest of at least two nested calderas, the largest of which is 6 km in diameter. That large central edifice is also called Manaro Voui or Lombenben volcano. Post-caldera explosive eruptions formed the summit craters about 360 years ago. A tuff cone was constructed within Lake Voui (or Vui) about 60 years later. The latest known flank eruption, about 300 years ago, destroyed the population of the Nduindui area near the western coast.
Information Contacts: Geo-Hazards Division, Vanuatu Meteorology and Geo-Hazards Department (VMGD), Ministry of Climate Change Adaptation, Meteorology, Geo-Hazards, Energy, Environment and Disaster Management, Private Mail Bag 9054, Lini Highway, Port Vila, Vanuatu (URL: http://www.vmgd.gov.vu/, https://www.facebook.com/VanuatuGeohazardsObservatory/); Wellington Volcanic Ash Advisory Centre (VAAC), Meteorological Service of New Zealand Ltd (MetService), PO Box 722, Wellington, New Zealand (URL: http://www.metservice.com/vaac/, http://www.ssd.noaa.gov/VAAC/OTH/NZ/messages.html); MIROVA (Middle InfraRed Observation of Volcanic Activity), a collaborative project between the Universities of Turin and Florence (Italy) supported by the Centre for Volcanic Risk of the Italian Civil Protection Department (URL: http://www.mirovaweb.it/); Global Sulfur Dioxide Monitoring Page, Atmospheric Chemistry and Dynamics Laboratory, NASA Goddard Space Flight Center (NASA/GSFC), 8800 Greenbelt Road, Goddard, Maryland, USA (URL: https://so2.gsfc.nasa.gov/); Copernicus Browser, Copernicus Data Space Ecosystem, European Space Agency (URL: https://dataspace.copernicus.eu/browser/).
Search Bulletin Archive by Publication Date
Select a month and year from the drop-downs and click "Show Issue" to have that issue displayed in this tab.
The default month and year is the latest issue available.
Bulletin of the Global Volcanism Network - Volume 29, Number 09 (September 2004)
Managing Editor: Richard Wunderman
Etna (Italy)
New effusive eruption begins on 7 September and spreads to several fissure vents
Kilauea (United States)
June-October 2004 period has lava entering ocean and ample lava flows
Mauna Loa (United States)
Deep, long-period earthquake swarm and contraction in July and August 2004
Montagu Island (United Kingdom)
1 October 2004 satellite image suggests a complex and ongoing eruption
Negra, Sierra (Ecuador)
12 June-29 August 2004, GPS data indicate 77 cm of caldera-floor uplift
Soufriere Hills (United Kingdom)
Generally low activity; small lake forms in summit crater
St. Helens (United States)
New eruption starts suddenly—first dome-growth in 18 years
Etna
Italy
37.748°N, 14.999°E; summit elev. 3357 m
All times are local (unless otherwise noted)
New effusive eruption begins on 7 September and spreads to several fissure vents
At about 1030 on 7 September 2004 a new effusive eruption started from the summit of Mount Etna. A N110°E-trending eruptive fissure about 230 m long opened at the base of the SE Crater without any significant seismic activity. A degassed lava flow poured from the base of the fissure, spreading towards the Valle del Bove. The lava flow had very low output rate (between 0.2 and 0.5 m3/s), and was ~ 1 m thick, 10 m wide, and up to 250 m long. On the morning of 8 September the lava flow appeared to lack new input from its source, but the eruptive fissure continued to advance down slope. These events were not accompanied by seismicity or explosive activity.
After two days of slow expansion of the fracture field, a new effusive vent opened at a lower elevation, 2,650 m, on the upper western flank of the Valle del Bove. This occurred between 0600 and 0700 on 10 September. Lava poured from this vent, spreading over the upper wall of the Valle del Bove. No explosive activity accompanied the emission of lava, but some phreatic explosions were triggered by lava intersecting a thick cover of snow. The lava flow was degassed and flowed out at a rate of about 2-4 m3/s. It spread E to the Serra Giannicola Piccola before splitting in two branches. At about 0930 the longest branch was about 300 m long and 50 m wide. Due to the high slope-angle, the front of the N lava flow breached. Hot blocks rolled down slope, causing the flow front to expand due to the collapse of hot debris rather than by flowage. At 1400 the lowest elevation of the lava flow front was about 2,250 m elevation within the upper Valle del Bove. At that time, no villages were threatened by the lava flows since they had spread out over a deserted zone at least 10 km away from the nearest village.
Activity appeared similar on 14-15 September 2004, when Mike Burton, Enza Longo, and Margherita Polacci had clear views of the Valle Del Bove in fair weather. Their first observations were carried out at the Southeast Crater (SEC), where the team saw a conspicuous plume emitted from a fumarole field on the SEC's SE rim. This activity, not seen prior to the eruption, had been consistently observed during the previous 3-4 days.
A visit to a vent at 2,830 m elevation revealed behavior similar to previous days, consisting of continuous high-pressure degassing in the absence of explosive activity (figure 104). At this vent, in contrast to the one at 2,630 m (which emitted lava), incandescence was limited to a circular zone at the vent area. No recent scoria were observed near the degassing vent. At this degassing vent the peak temperature, measured with a thermal camera, was ~ 900°C (see thermal image, figure 8).
The team also visited the lava flow at 2,630 m (figure 105). Fresh scoria had fallen along the path leading to the lava flow, and samples were collected. The estimated flux rate of the lava flow was between 2 and 4 m3/s, using an estimated flow velocity of 1 m/s, a width of 2 m, and a depth of 1-2 m. Estimates were obtained by observing the lava flow just above the rock island seen in figure 9. This flux was roughly equal to that seen on 13 September.
A pair of hornitos lay up slope of the lava flow originating at 2,630 m elevation. One hornito sat just behind the spot where lava was first observed on the surface. The second hornito was larger and resided about 20-30 m farther up slope (figure 106). It released gas at high pressure, creating noise. No scoria were emitted during their observation.
Polacci and Burton then walked down to the lava flow that began on 13 September (figure 107). The lava flow's flux rate was low. The team estimated an outflow rate of ~ 1 m3/s, using a width of 2 m, a flow velocity of 0.5 m/s, and a depth of 1 m, dimensions noted near the lava flow's source. The lava flow emanated from a small depression; no scoria deposits were seen nearby. GPS established the flow's source at 2,340 m elevation. The team observed several distinct overflows escaping from the principal lava flow, which originated at 2,630 m elevation (figure 108).
Geologic Background. Mount Etna, towering above Catania on the island of Sicily, has one of the world's longest documented records of volcanism, dating back to 1500 BCE. Historical lava flows of basaltic composition cover much of the surface of this massive volcano, whose edifice is the highest and most voluminous in Italy. The Mongibello stratovolcano, truncated by several small calderas, was constructed during the late Pleistocene and Holocene over an older shield volcano. The most prominent morphological feature of Etna is the Valle del Bove, a 5 x 10 km caldera open to the east. Two styles of eruptive activity typically occur, sometimes simultaneously. Persistent explosive eruptions, sometimes with minor lava emissions, take place from one or more summit craters. Flank vents, typically with higher effusion rates, are less frequently active and originate from fissures that open progressively downward from near the summit (usually accompanied by Strombolian eruptions at the upper end). Cinder cones are commonly constructed over the vents of lower-flank lava flows. Lava flows extend to the foot of the volcano on all sides and have reached the sea over a broad area on the SE flank.
Information Contacts: Sonia Calvari, Mike Burton, Enza Longo, and Margherita Polacci, Istituto Nazionale di Geofisica e Vulcanologia (INGV), Piazza Roma 2, 95123 Catania, Italy.
Kilauea (United States) — September 2004 Cite this Report
Kilauea
United States
19.421°N, 155.287°W; summit elev. 1222 m
All times are local (unless otherwise noted)
June-October 2004 period has lava entering ocean and ample lava flows
Scientists at the Hawaiian Volcano Observatory (HVO) noted that throughout June and July 2004, lava from Kīlauea continued to enter the ocean at several points, culminating in several new lava deltas. Some small littoral explosions were reported, but otherwise the ocean entry was passive. Many small lava flows were observed in the area of the ocean entries, on the coastal flat, in the Paliuli area, and in the Kuhio area. Incandescence and some minor spattering was observed at Pu`u `O`o throughout the week. On 13 June, two collapses occurred at Kīlauea's western lava delta, sending sizable chunks of the delta into the sea.
On 14 June, most lava was being supplied to the ocean through lava tubes, but several surface lava flows were visible on the delta and traveling down the old sea cliff behind the Wilipe`a delta. The larger eastern lava delta had several active lava entries into the ocean, mostly larger than those on the western delta. Seismicity at Pu`u `O`o was moderate to high, but the overall seismicity at Kīlauea was low. Several episodes of inflation and deflation were recorded. Relatively large deflation events occurred on 29 June and 11 July, with no obvious accompanying changes in eruptive activity. An episode of deformation consisting of deflation, inflation, then deflation began at Kīlauea on the morning of 27 July. It was accompanied by increased surface activity at several places. During inflation, seismicity greatly increased below Kīlauea's caldera. Field observers reported that deformation may have occurred at the S flank of Pu`u `O`o. Aside from the deflation-inflation-deflation event, seismicity was weak beneath Kīlauea's summit and tremor at Pu`u `O`o was at moderate-to-high levels.
During August and September 2004, no lava entered the sea. Surface lava flows were active on the coastal flat and the Pulama pali fault scarp, and the vents in the crater of Pu`u `O`o were incandescent. Seismicity was weak beneath Kīlauea's summit and tremor was at moderate-to-high levels at Pu`u `O`o. In addition, there were small periods of inflation and deflation. HVO scientists reported that all vents in Pu`u `O`o's crater were incandescent during parts of both August and September.
From 30 September to 18 October 2004, patches of incandescence were visible at the PKK lava flow on the Pulama pali scarp, and all vents in the crater of Pu`u `O`o were incandescent. Seismicity was weak at Kīlauea's summit, with essentially no tremor recorded. An M 4.0 earthquake occurred on 11 October. It was focused ~ 32 km beneath Kīlauea's summit and affected tilt meters. Taking earthquake- and rainfall-induced tilts into account, the volcanic tilt was minor. On 13 October 2004 an M 4.5 earthquake occurred at 1318 ~ 6 km S of Pu`u `O`o at a depth of ~ 9 km. The earthquake permanently offset the Pu`u `O`o tiltmeter and several others on the volcano. Tremor was moderate at Pu`u `O`o. In addition, small amounts of inflation and deflation occurred.
On the morning of 24 October 2004 HVO scientists noted activity at that the three arms of the PKK flow (the Kuhio flow, named for Prince Kuhio Kalaniana`ole). Largest and most vigorous, the W arm descended down to an elevation of ~ 200 m, well out onto the gentle slope below Pulama pali. A series of channels and incandescent fingers were visible along a 600-m-long stretch, and tiny spots marked the upstream course of the arm, roughly following the E side of the Mother's Day flow.
The middle arm had advanced 100-200 m since the previous morning (23 October) and reached down to an elevation of ~ 335 m. It was the smallest of the three active arms.
The E arm was quite active that morning, its front also located on the gentle slope below Pulama pali at ~ 300 m elevation; it was nearly continuously incandescent up to ~ 440 m elevation. The distance between the W and middle arms was about 400 m and between the middle and E arms, about 600 m. These distances changed constantly as flows widen and narrow. Figures 167 and 168 show lava flows since 1983 to aid the reader in locating features discussed in this Bulletin report.
Moderately bright glow came from the 640- to 670-m elevations farther upstream in the PKK flow. All vents in Pu`u `O`o's crater were incandescent on 24 October, creating a glow visible from several distant places. Seismicity was weak at Kīlauea's summit, with essentially no tremor recorded. Tremor was moderate at Pu`u `O`o. Kīlauea's summit deflated moderately during 23 October and then took a plunge during the middle of the night. It lost about 0.3 microradians before the plunge began just before midnight, and it lost another 0.5 microradians thereafter. Pu`u `O`o, too, was deflating rapidly, shifting up and down a little but maintaining an overall flat tilt until the plunge began. It also lost about 0.5 microradians after midnight.
Geologic Background. Kilauea overlaps the E flank of the massive Mauna Loa shield volcano in the island of Hawaii. Eruptions are prominent in Polynesian legends; written documentation since 1820 records frequent summit and flank lava flow eruptions interspersed with periods of long-term lava lake activity at Halemaumau crater in the summit caldera until 1924. The 3 x 5 km caldera was formed in several stages about 1,500 years ago and during the 18th century; eruptions have also originated from the lengthy East and Southwest rift zones, which extend to the ocean in both directions. About 90% of the surface of the basaltic shield volcano is formed of lava flows less than about 1,100 years old; 70% of the surface is younger than 600 years. The long-term eruption from the East rift zone between 1983 and 2018 produced lava flows covering more than 100 km2, destroyed hundreds of houses, and added new coastline.
Information Contacts: Hawaiian Volcano Observatory (HVO), U.S. Geological Survey, PO Box 51, Hawaii National Park, HI 96718, USA (URL: https://volcanoes.usgs.gov/observatories/hvo/).
Mauna Loa (United States) — September 2004 Cite this Report
Mauna Loa
United States
19.475°N, 155.608°W; summit elev. 4170 m
All times are local (unless otherwise noted)
Deep, long-period earthquake swarm and contraction in July and August 2004
After a swarm of deep earthquakes centered just S of Mauna Loa's summit caldera in late April 2002, seismicity remained barely elevated until July 2004. In other words, seismicity during late April 2002-July 2004 stood far lower than it did in the months prior to the 1975 and 1984 eruptions.
Starting in July 2004, a swarm of small (M < 3), deep (> 40 km), mostly long-period (LP) earthquakes occurred just S of the caldera and adjacent areas. Neither the depth nor the magnitude of the earthquakes changed significantly. Through 13 October 2004 more than 730 related earthquakes occurred beneath the summit caldera and the adjacent part of the SW rift zone.
The location and magnitude of earthquakes making up the recent swarm (seismicity from 24 April-15 October 2004, a 6-month interval) are shown in figure 23. Such a concentration of deep LP earthquakes from this part of Mauna Loa was unprecedented in the modern earthquake record dating back to the 1960s. In contrast, more typical seismicity over a 6-month period at Mauna Loa is shown in a figure in a previous issue (BGVN 27:09). By comparison to the interval 24 April-15 October 2004, earthquakes in a typical 6 month interval are relatively sparse.
Inflation continued at the summit through the start of the earthquake swarm. In late August 2004, however, distances across the summit caldera began to contract significantly, apparently caused by the center of inflation shifting slightly to the S, rather than by deflation. This was the first contraction since inflation started in late April or early May 2002. Toward the end of September, the contraction ended and the line once again began to lengthen. During 2004, the inflation had been at a fairly steady to slightly increasing rate until the contraction in late August. When present, the lengthening, uplift, and tilting were taken to indicate swelling of the magma reservoir within the volcano.
Geologic Background. Massive Mauna Loa is a basaltic shield volcano that rises almost 9 km from the ocean floor to form the world's largest Holocene volcano. Flank eruptions typically occur from the lengthy NE and SW rift zones, and from the Moku'aweoweo summit is caldera, which is within an older and larger 6 x 8 km caldera. Two of the youngest large debris avalanches documented in Hawaii traveled nearly 100 km from Mauna Loa; the second of the Alika avalanches was emplaced about 105,000 years ago (Moore et al., 1989). Almost 90% of the surface of the volcano is covered by lavas less than 4,000 years old (Lockwood and Lipman, 1987). Beginning about 1,500 years ago, a series of voluminous overflows from a summit lava lake covered about 25% of the volcano's surface. Over the last 750 years, from shortly after the formation of Moku'aweoweo caldera until the present, an additional 25% of the volcano has been covered with lava flows, mainly from summit and NW rift zone vents.
Information Contacts: Hawaiian Volcano Observatory (HVO), U.S. Geological Survey, PO Box 51, Hawaii National Park, HI 96718, USA (URL: https://volcanoes.usgs.gov/observatories/hvo/).
Montagu Island (United Kingdom) — September 2004 Cite this Report
Montagu Island
United Kingdom
58.445°S, 26.374°W; summit elev. 1370 m
All times are local (unless otherwise noted)
1 October 2004 satellite image suggests a complex and ongoing eruption
A high-resolution image of Montagu island and volcano of the same name suggests the earlier recognized, ongoing eruption (BGVN 28:02; v. 29, no. 1 ) continued through at least 1 October 2004. On a NASA website, scientist James Garvin posted an image of the 1 October scene (figure 7). Imagery taken prior to late 2001 showed the island as entirely white. The new image deserves and requires considerable study, but some initial observations from James Garvin and Bulletin editors follow.
The 1 October 2004 image shows the N flank of the central cone, Mount Belinda, emitting a NNE-drifting steam plume. Much of Montagu island sat amid a mosaic of floating ice. In contrast, on the previous image taken 7 December 2003 (BGVN 29:01), icebergs were sparse. Several square kilometers of sea ice on the island's lower right appears comparatively coherent and tightly butted against the island's margin. These changes may reflect sea-ice abundance during the S-hemisphere winter.
In addition, the higher detail in the new higher resolution image portrays a variety of patterns and features of volcanological significance that were absent or at least less clearly visible on earlier images. In the new image, the area of apparently continuous lava flows seems to have reached the island's N margin (a distance of ~ 3 km). On the 7 December 2003 image these flows had reached little more than 1 km in length and were considerably narrower, and stood alongside broad, dark swaths of SE- to E-directed ash deposits (BGVN 29:01). These latter ash deposits have become less apparent on the newer image, conceivably due to cover beneath winter's snowfall.
The newer image depicts the S-flank's upper slopes as containing much broader areas of darkened snow and ice. Some of the sea ice N of the previously mentioned lava flows also appears darkened. To the S of the Belinda summit lies a previously unseen, sinuously shaped 'beard,' presumably composed of darkened snow. Another newly visible feature, the black area to the NNW (upper left), presumably reveals lava flows emerging from beneath the ice. This zone of lava flows resides without clear connection to the conspicuous, larger, previously mentioned one flowing from higher up-slope. The black area to the NNW may thus be a new vent area. Alternatively, the black area may represent the spot where a longer sub-glacial lava flow transited some unknown distance beneath the ice and here melted its way to the surface. Another such area may reside on the NNE flanks, midway from the summit area and the coast. On the island's W (left) side exists a newly imaged network of broken ice. It could suggest an episode of fresh crevassing there.
Although the version shown in figure 7 has reduced resolution for print and web distribution, the full-resolution version of the IKONOS color image distributed by NASA has a resolution of 4 m per pixel and another version, 1 m per pixel (creating a 3.20 Mb image). James Garvin noted that dynamic processes such as those on remote, uninhabited islands, can be monitored from orbit, thereby serving to target more intensive field studies when they are justified. As such, IKONOS imaging of localities such as active eruptions involving ice-lava interactions, represents a new form of scientific exploration of planet Earth. The eruption has produced a 'natural laboratory' for studying lava-ice interactions relevant to the biology of extreme environments as well as to processes believed to be important on the planet Mars.
The IKONOS earth-imaging satellite launched in September 1999. IKONOS includes optical, radar, and infrared sensors. These can be combined in a variety of ways to accommodate a wide range of imagery applications (including stereo images).
Geographic terminology. The nomenclature of volcanic features on Montagu Island, particularly in regard to Mount Belinda, has been quite variable. Although the name Montagu has been applied to the major volcanic edifice forming the island (LeMasurier and Thomson, 1990), the name Mount Belinda has been variously applied to the entire volcano, the currently active young cone on the northern side of the island, the 6-km-wide summit caldera, and a peak on the southern caldera rim that is the island's high point. In consultation with John Smellie of the British Antarctic Survey, we have used Montagu to refer to the volcano forming the island and Mount Belinda for the currently active cone.
Reference. LeMasurier, W.E., and Thomson, J.W. (eds.), 1990, Volcanoes of the Antarctic Plate and Southern Oceans: Washington, D C: American Geophysical Union, 487 p.
Geologic Background. The largest of the South Sandwich Islands, Montagu consists of a massive shield volcano cut by a 6-km-wide ice-filled summit caldera. The summit of the 11 x 15 km island rises about 3,000 m from the sea floor between Bristol and Saunders Islands. Around 90% of the island is ice-covered; glaciers extending to the sea typically form vertical ice cliffs. The name Mount Belinda has been applied both to the high point at the southern end of the summit caldera and to the young central cone. Mount Oceanite, an isolated peak at the SE tip of the island, was the source of lava flows exposed at Mathias Point and Allen Point. There was no record of Holocene activity until MODIS satellite data, beginning in late 2001, revealed thermal anomalies consistent with lava lake activity. Apparent plumes and single anomalous pixels were observed intermittently on AVHRR images from March 1995 to February 1998, possibly indicating earlier volcanic activity.
Information Contacts: James B. Garvin, National Aeronautics and Space Administration (NASA), Goddard Space Flight Center (GSFC), Code 921, Greenbelt, MD 20771, USA (URL: https://earthobservatory.nasa.gov/); John Smellie, British Antarctic Survey, Natural Environment Research Council, High Cross, Madingly Road, Cambridge CB3 0ET, United Kingdom (URL: https://www.bas.ac.uk/).
Sierra Negra (Ecuador) — September 2004 Cite this Report
Sierra Negra
Ecuador
0.83°S, 91.17°W; summit elev. 1124 m
All times are local (unless otherwise noted)
12 June-29 August 2004, GPS data indicate 77 cm of caldera-floor uplift
Sierra Negra volcano contains a six-station, continuously monitored GPS network. The instruments were installed in collaboration with a research consortium (UNAVCO) in May 2002 (figure 2).
Starting on 12 June 2004 and continuing through at least 29 August 2004, the rate of uplift of the caldera floor, as measured by this network, had accelerated to 77 cm/year (table 1). This rate was comparable to that inferred from InSAR data in the late 1990s (Amelung and others, 2000). That late 1990's uplift was attributed to trap-door faulting of the caldera floor along its southern margin, a process presumably driven by a shallow (< 2 km) intrusion of magma. Deflation occurred during 2001-2002, and slower uplift of about 12 cm/y prevailed during March 2003-May 2004 (table 1). The 12 June-29 August interval was noteworthy for the high rates of uplift (table 1).
Table 1. A summary of the geophysically derived movement of the caldera floor at Sierra Negra. Courtesy of Dennis Geist, William Chadwick, and Dan Johnson.
| Interval |
Comments |
Measurement Technique |
| 1992-1998 |
240 cm of uplift punctuated by trapdoor uplift in 1997 or 1998 |
InSAR (Amelung and others, 2000) |
| 1998-1999 |
Inflation at 65 cm/year |
InSAR (Amelung and others, 2000) |
| 2000-2001 |
Deceleration of uplift to 7 cm/year |
Campaign GPS (Geist and others, submitted) |
| 2001-Feb 2003 |
Deflation of ~9 cm/year |
Campaign and continuous GPS |
| Mar 2003-May 2004 |
Inflation at ~12 cm/year |
Continuous GPS |
| 12 Jun-29 Aug 2004 |
Inflation at 77 cm/year |
Continuous GPS |
The Instituto Geofísico in Quito, Ecuador monitors seismic activity in the Galápagos, using a network that includes a single station on Sierra Negra. Unfortunately, that network was down for the past year, in need of a variety of hardware, including the seismometer at Sierra Negra. Thus, for the interval of interest, seismic data were absent. Hugo Yepes estimated that to repair the Galápagos system would require about $9,000 (USD) in equipment and $4,000 (USD) in personnel transport and field expenses. He also said that the region requires more stable long-term logistical support.
The 12 June-29 August 2004 uplift was symmetrical about the caldera's center. The pattern and rate of uplift was well modeled as a 2.1 km deep sill intruded by about 12 x 106 m3 of magma since June 2004.
Sierra Negra last erupted in 1979, when nearly 1 km3of lava erupted from a circumferential fissure near the summit, covering its N flank./p>
References. Amelung, F., Jonsson, S., Zebker, H., Segall, P., 2000. Widespread uplift and "trapdoor" faulting on Galápagos volcanoes observed with radar interferometry. Nature 407, 993-998.
Geist, D., Chadwick, W.W., and Johnson, D., Results from new GPS and gravity monitoring networks at Fernandina and Sierra Negra volcanoes, Galápagos, 2000-2002 (submitted to the Journal of Volcanology and Geothermal Research in 2004).
Geologic Background. The broad shield volcano of Sierra Negra at the southern end of Isabela Island contains a shallow 7 x 10.5 km caldera that is the largest in the Galápagos Islands. Flank vents abound, including cinder cones and spatter cones concentrated along an ENE-trending rift system and tuff cones along the coast and forming offshore islands. Although it is the largest of the five major Isabela volcanoes, it has the flattest slopes, averaging less than 5° and diminishing to 2° near the coast. A sinuous 14-km-long, N-S-trending ridge occupies the west part of the caldera floor, which lies only about 100 m below its rim. The Volcán de Azufre fumarolic area lies within a graben between this ridge and the west caldera wall. Lava flows from a major eruption in 1979 extend all the way to the north coast from circumferential fissure vents on the upper northern flank.
Information Contacts: Dennis J. Geist, Department of Geological Sciences, University of Idaho, Moscow, Idaho 83844-3022 USA; William W. Chadwick, Jr., Cooperative Institute for Marine Resources Studies (CIMRS), NOAA Pacific Marine Environmental Laboratory (PMEL), 2115 SE OSU Drive, Newport, OR 97365 USA; Daniel J. Johnson, University of Puget Sound, Department of Geology, 1500 N. Warner, Tacoma, WA 98416, USA; Hugo Yepes, Geophysical Institute (IG), Escuela Politécnica Nacional, Apartado 17-01-2759, Quito, Ecuador (URL: http://www.igepn.edu.ec/).
Soufriere Hills (United Kingdom) — September 2004 Cite this Report
Soufriere Hills
United Kingdom
16.72°N, 62.18°W; summit elev. 915 m
All times are local (unless otherwise noted)
Generally low activity; small lake forms in summit crater
According to reports issued by the Montserrat Volcano Observatory (MVO), activity at Soufrière Hills volcano remained low during 21 May-10 September 2004, becoming slightly elevated from 10 September-15 October 2004. Minor events during this period included mudflows, rockfalls, and several small, shallow earthquakes originating at upper regions of the lava dome and conduit.
On 21 May 2004, heavy rainfall caused large mudflows for about two hours (1420 to 1636). The mudflows traveled into the Belham Valley, an area within the exclusion zone on the volcano's NW side, flooding the entire width of the valley floor at Belham bridge. Scientists from MVO noted that at the peak of flow, standing waves of mud reached 2 m high. Intense rains on 25 July, 14 September, and 16 September again caused up-slope erosion and mudflows descended into the Belham Valley.
Surface water from the intense rain of 21 May percolated into the subsurface of the hot dome and vent complex, converting into steam. Steam venting may have initiated the 44 mixed earthquakes recorded the week of 21-28 May (table 56). The earthquakes were short in duration (~ 30 seconds each), and their amplitude decay characteristics suggested that they originated at shallow depths within the remnant dome and at the top of the conduit. The term 'remnant dome' refers to the fact that the late May 2004 dome was considerably reduced in size compared to the dome of about a year before, in large part because of major collapse events on 12 July 2003 and 3 March 2004.
Table 56. Seismicity recorded at Soufrière Hills, 21 May to 15 October 2004. Courtesy of Montserrat Volcano Observatory.
| Date |
Activity Level |
Hybrid |
Mixed |
Volcano-tectonic |
Long-period |
Rockfall |
| 21 May-28 May 2004 |
Low |
7 |
44 |
-- |
-- |
-- |
| 28 May-04 Jun 2004 |
Low |
4 |
16 |
-- |
-- |
-- |
| 04 Jun-11 Jun 2004 |
Low |
3 |
9 |
-- |
-- |
-- |
| 11 Jun-18 Jun 2004 |
Low |
5 |
-- |
-- |
-- |
10 |
| 18 Jun-25 Jun 2004 |
Low |
5 |
-- |
6 |
-- |
15 |
| 25 Jun-02 Jul 2004 |
Low |
5 |
-- |
6 |
2 |
8 |
| 02 Jul-09 Jul 2004 |
Low |
8 |
-- |
4 |
-- |
10 |
| 09 Jul-16 Aug 2004 |
Low |
6 |
-- |
1 |
1 |
5 |
| 16 Jul-23 Jul 2004 |
Low |
7 |
-- |
-- |
-- |
7 |
| 23 Jul-30 Jul 2004 |
Low |
2 |
-- |
-- |
-- |
8 |
| 30 Jul-06 Aug 2004 |
Low |
1 |
-- |
-- |
-- |
8 |
| 06 Aug-13 Aug 2004 |
Low |
1 |
-- |
-- |
-- |
3 |
| 13 Aug-20 Aug 2004 |
Low |
1 |
-- |
1 |
-- |
1 |
| 20 Aug-27 Aug 2004 |
Low |
1 |
-- |
-- |
-- |
1 |
| 27 Aug-03 Sep 2004 |
Low |
2 |
-- |
-- |
-- |
-- |
| 03 Sep-10 Sep 2004 |
Low |
-- |
-- |
1 |
-- |
2 |
| 10 Sep-17 Sep 2004 |
slightly elevated |
14 |
-- |
-- |
1 |
1 |
| 17 Sep-24 Sep 2004 |
slightly elevated |
8 |
-- |
-- |
2 |
2 |
| 24 Sep-01 Oct 2004 |
slightly elevated |
8 |
-- |
-- |
1 |
3 |
During 18-25 June, winds blew the volcanic plume NE, and the clouds over the volcano's summit lifted, making the tallest remnants of the dome complex visible for the first time since 7 May. Observers noted a loss of material from the upper regions of the dome due to rockfalls.
Later, on 30 August, MVO personnel on an observation flight discovered a small brown pond within the dome complex (figure 5). This pond was the first seen on the volcano since the beginning of its eruption in 1995. The pond lies in a small crater formed by an explosion and dome collapse on 3 March 2004 (figure 57). It probably developed following the cooling of deposits within the crater, and after recent heavy rainfall.
Sulfur dioxide (SO2) emissions typically remained low throughout the period. Measured fluxes ranged between about 90 and 1,100 metric tons per day (table 57). Moderate fluctuations occurred during 21-24 May (225-922 metric tons/day) and 7-11 June (169-788 metric tons/day). During 2-9 July, SO2 emissions dropped to the lowest levels since the collapse event of 12-13 July 2003, and fell even lower during the weeks of 30 July and 17 September.
Table 57. SO2 gas flux estimates made at Soufrière Hills, 21 May to 15 October 2004. Courtesy of Montserrat Volcano Observatory.
| Date |
SO2 emissions (tons/day) |
| 21 May-28 May 2004 |
225-922 |
| 28 May-04 Jun 2004 |
179-496 |
| 04 Jun-11 Jun 2004 |
169-788 |
| 11 Jun-18 Jun 2004 |
240-477 |
| 18 Jun-25 Jun 2004 |
-- |
| 25 Jun-02 Jul 2004 |
177-364 |
| 02 Jul-09 Jul 2004 |
120-160 |
| 09 Jul-16 Aug 2004 |
222-243 |
| 16 Jul-23 Jul 2004 |
170-400 |
| 23 Jul-30 Jul 2004 |
175-300 |
| 30 Jul-06 Aug 2004 |
90-280 |
| 06 Aug-13 Aug 2004 |
126-296 |
| 13 Aug-20 Aug 2004 |
200-622 |
| 20 Aug-27 Aug 2004 |
175-311 |
| 27 Aug-03 Sep 2004 |
240-456 |
| 03 Sep-10 Sep 2004 |
175-405 |
| 10 Sep-17 Sep 2004 |
130-250 |
| 17 Sep-24 Sep 2004 |
87-454 |
| 24 Sep-01 Oct 2004 |
200-540 |
| 01 Oct-08 Oct 2004 |
187-1144 |
| 08 Oct-15 Oct 2004 |
156-553 |
Measurements of expansion made by dilatometers embedded on either side of the Soufriere Hills edifice suggested that in July, the volcano changed from contraction to slight expansion.
Geologic Background. The complex, dominantly andesitic Soufrière Hills volcano occupies the southern half of the island of Montserrat. The summit area consists primarily of a series of lava domes emplaced along an ESE-trending zone. The volcano is flanked by Pleistocene complexes to the north and south. English's Crater, a 1-km-wide crater breached widely to the east by edifice collapse, was formed about 2000 years ago as a result of the youngest of several collapse events producing submarine debris-avalanche deposits. Block-and-ash flow and surge deposits associated with dome growth predominate in flank deposits, including those from an eruption that likely preceded the 1632 CE settlement of the island, allowing cultivation on recently devegetated land to near the summit. Non-eruptive seismic swarms occurred at 30-year intervals in the 20th century, but no historical eruptions were recorded until 1995. Long-term small-to-moderate ash eruptions beginning in that year were later accompanied by lava-dome growth and pyroclastic flows that forced evacuation of the southern half of the island and ultimately destroyed the capital city of Plymouth, causing major social and economic disruption.
Information Contacts: Montserrat Volcano Observatory (MVO), Fleming, Montserrat, West Indies (URL: http://www.mvo.ms/).
St. Helens (United States) — September 2004 Cite this Report
St. Helens
United States
46.2°N, 122.18°W; summit elev. 2549 m
All times are local (unless otherwise noted)
New eruption starts suddenly—first dome-growth in 18 years
After a hiatus of over 13 years, following phreatic eruptions during November 1990 to February 1991, a new eruption began in the crater at Mount St. Helens. Some shallow seismicity preceded the eruption, but this came only 9 days prior to the first ash emission. There was no progression of deep earthquakes propagating upward with time during the preceding months. Also apparently absent were other classical monitored parameters (deformation, gas emissions, geochemical or thermal anomalies) that could help foretell of an eruption several weeks or months ahead.
The eruption extruded a two-pyroxene, hornblende dacite of low vesicularity. The initial extrusions and uplift affected the S dome area and adjacent crater floor to the S. The intrusion included uplift and deformation of glacial ice, as well as some melting of ice, forming a small, short-lived bubbling lake (nicknamed 'the Jacuzzi') and a minor lahar out of the crater.
This report discusses the first 16 days of the eruption, from the first sign, shallow earthquakes, which began on 23 September 2004. This report was chiefly put together from reports posted by the Cascades Volcano Observatory (CVO), but also benefitted from personal communications with James Quick, Marianne Guffanti (both at USGS, Reston, Virginia), and James Vallance (USGS-CVO).
Synopsis. A photograph of the scene several weeks before the eruption came from climbers on the S rim. They visited during the last week of August 2004, a time when all still seemed quiet (figure 46). A chronology of events in the first 16 days (table 4) includes the dates and times of the events, the hazard status to people on the ground and to aviation traffic, and some brief comments on the seismicity and volcanism taking place.
Table 4. A simplified chronology of the events at Mt. St. Helens from 23 September to 8 October 2004. Taken from material posted by the Cascades Volcano Observatory.
| Day |
Date |
Hazard Status |
Comment |
| DAY 1-3 |
23-25 Sep 2004 |
None posted |
Swarm of small, shallow earthquakes (less than M 1) began on morning of the 23rd, peaked mid-day on the 24th, then declined through the afternoon of the 25th. |
| DAY 4 |
26 Sep 2004 |
1 - Notice (green) |
Seismicity increased; ten M 2-2.8 events; volcanic unrest at 1500 hours. First Yellow alert since Oct. 1986. |
| DAY 7 |
29 Sep 2004 |
2 - Advisory (yellow) |
Higher advisory issued at 1040 hours. |
| DAY 8 |
30 Sep 2004 |
2 - Advisory (yellow) |
Deformation S of dome; fissures on ~200 m of ice. |
| DAY 9 |
01 Oct 2004 |
2 - Advisory (yellow) |
Ash emission rose to 3 km altitude. |
| DAY 10 |
02 Oct 2004 |
3 - Alert (red) |
Increased fumaroles, CO2 and H2S detected. |
| DAY 11 |
03 Oct 2004 |
3 - Alert (red) |
Tremor episode; no eruptive plume. Continued detection of CO2 and H2S. Small steam and ash emission with plume to the crater rim. Temporary flight restriction within 9 km radius of summit. |
| DAY 12 |
04 Oct 2004 |
3 - Alert (red) |
Large-scale glacial uplift. Steam and ash emission with plume to 3 km. |
| DAY 13 |
05 Oct 2004 |
3 - Alert (red) |
Most vigorous ash/steam emission from both vent areas. Ash to 5 km. |
| DAY 14 |
06 Oct 2004 |
2 - Advisory (yellow) |
Seismicity and tremor low. |
| DAY 15 |
07 Oct 2004 |
2 - Advisory (yellow) |
Seismic activity low. Weak puffs of steam and a new vigorously erupting vent were observed. |
| DAY 16 |
08 Oct 2004 |
2 - Advisory (yellow) |
Light seismic activity continued (1-2 events/hour; largest ~M 1.5). |
The CVO website contains a complete discussion of the 3-level hazard-status scheme used there during this reporting interval. In brief form, the status rises from 1 - Notice, to 2 - Advisory, to 3 - Alert. (These are short-hand for Notice of Volcanic Unrest: Alert Level One, Volcano Advisory: Alert Level Two, and Volcano Alert: Alert Level Three.) These respective levels of hazard status correspond to an informal color code, rising from green, to yellow, to red (shown in parentheses on table 1). A type of announcement, the Information Statement, discusses events that are unusual or short-lived, or both. On days 1-3, at the start of this crisis, a specific volcanic hazard was not specified.
Description of activity. At about 0200 on the morning of 23 September 2004, an earthquake swarm began at Mount St. Helens. Through 1700 hours on that date about 200 small (less than M 1) earthquakes had been located at the volcano, and many smaller events were recorded throughout the morning. The earthquakes occurred at shallow depths (less than 1 km) mostly under the lava dome that formed between 1980 and 1986.
Such earthquakes are common for the volcano. But a swarm with this many earthquakes has not been recorded for several years. The most recently case was on 3-4 November 2001. By 25 September 2004 seismicity had declined significantly. However it remained elevated above background. On 26 September the character of the swarm changed to include more than ten larger earthquakes (M 2-2.8), the most in a 24-hour period since the eruption of October 1986. Some of the earthquake types suggested pressurized fluids (water and steam) or perhaps magma. As a consequence, CVO and the University of Washington's Pacific Northwest Seismograph Network released the first Notice of Volcanic Unrest at this site in 18 years. The earthquakes occurred at shallow depths (less than 2 km) below the 1980-1986 lava dome.
On 27 September seismicity increased very slowly throughout the day. All earthquake locations were still shallow and beneath the dome. The largest earthquake recorded in the prior 24 hours was about M 1.5. Preliminary results from a gas flight late in the afternoon of 27 September did not indicate any magmatic gas.
Throughout the day of 28 September seismic activity remained at a fairly constant, but high rate of about two small (less than M 2) earthquakes per minute. All earthquake locations were still shallow and in or below the lava dome. That night seismic activity increased significantly. Throughout the day the seismicity remained elevated at 3-4 events per minute. A number of these events were between M 2 and 3. All earthquakes remained in or below the dome. By 30 September and 1 October the seismicity level had increased slightly, including events as large as M 3.3.
Around noon on 1 October a small 25-minute-long eruption occurred from a vent just S of the lava dome. The vent opened in a portion of the glacier that had become increasingly crevassed and uplifted over the past few days. The eruption sent a steam and minor ash plume to an altitude of about 3 km that drifted SW, accompanied by minor, local ashfall. Seismicity dropped several hours after the eruption, but gradually increased with earthquakes (maximum M 3) occurring 1- to 2-times per minute.
A 40-minute steam-and-ash emission started on 2 October at 0943. Steam clouds carrying minor ash billowed out of the crater to an altitude of 3 to 4 km. The emission occurred during a time of gradually increasing seismicity, which dropped slightly after the emission, but continued to increase gradually through the afternoon. CVO's preliminary reports indicated that despite this increase, the event did not generate diagnostic earthquakes or explosion signals. Scientists inferred that hot rock was pushed up into the glacier, which then melted ice and generated the steam.
An interval of tremor lasting 50 minutes occurred immediately after a small steam emission at 1215 on 2 October. When the tremor stopped, the seismic character changed back to the earlier mode with shallow earthquakes under about maximum magnitude M 3 occurring 1- to 2-times per minute. Another period of smaller steam and ash bursts occurred between 1410 and 1440. Visual observations showed that the area of uplift, which includes part of the glacier and a nearby segment of the S flank of the lava dome, continued to rise. Part of the vent for the steam and ash emissions of the past few days was discovered to be covered by a boiling lake.
A gas flight on 3 October found slightly lower concentrations of carbon dioxide. On the other hand, for the first time hydrogen sulfide was detected. The 4 October gas flight detected carbon dioxide, often in association with hydrogen sulfide and occasional sulphur dioxide.
On 5 October at 0943 a 30-minute-long steam-and-ash emission started, and at 1410 a 10-minute-long steam-and-ash emission began. Ashfall on roads SE of the volcano achieved a maximum thickness of 0.2 mm at 8 km from the source. Neither emissions generated diagnostic earthquakes or explosion signals. As on 4 October, steam and ash emissions were associated with sightings of a bubbling lake. After the 4 October emissions, earthquake energy slowly increased to previous high values.
On 5 October continued uplift included part of the glacier and a nearby segment of the dome's S flank. Cracks opened in the dome. Portions of the cracks reached temperatures of 40-50°C (above ambient temperatures at the dome and glacier's surface, but far below the minimum magmatic temperature of ~ 800°C). Rocks avalanched off the dome, falling into the lake and onto the S crater floor. The dome's N flank appeared thermally stable.
The most vigorous steam and ash emission of the reporting period began on 5 October amid an interval with high seismicity shortly after 0900. Steam clouds billowed from the crater for over an hour, with variable ash content. For the first time, the ash content was sufficient to be detected by National Weather Service Doppler Radar. Steam and ash clouds reached about 3 km high and drifted NNE. A light dusting of ash fell in Morton, Randle, and Packwood, Washington, towns about 50 km from the volcano. Seismicity dropped during the emission and stayed relatively low the next day.
On 6 October the low-level tremor observed following the eruption gradually declined. Brief crater observations from Coldwater Visitor Center noted weak steam emissions. Small lahars from the crater traveled N onto the pumice plain during a rainstorm in the early morning of 6 October. Lahars flowed a short distance toward both Spirit Lake and the North Fork of the Toutle river.
The GPS station on the dome's N flank showed a trend of northward displacement totaling 2 cm over the last three days. This is the same sense of movement recorded by the nearby station that was destroyed by the first steam-and-ash emission on 1 October. In contrast, GPS instruments on the outer flanks of the volcano showed no movement.
Additional analysis based on lidar (LIght Detection And Ranging) and photographs of the intensely uplifting area suggested that the total volume change represented by the deformation between late September and 6 October was about 16-20 million cubic meters. The average rate of change was about 2 million cubic meters per day. If this value represents the rate of intrusion of magma into shallow levels of the dome and underlying crater floor, or both, it was an intrusion rate about twice that measured during dome-building eruptions at Mount St. Helens in the 1980s.
The 7 October report noted that a new steam vent opened overnight to join the two that had been present for several days. Steaming from the vents generated a cloud that rose above the lava dome's S side and extended toward the crater rim. Seismic activity was low to moderate with earthquakes of M 1 to 2 occurring about once per minute. Seismicity increased slightly during 7 October. Earthquakes up to M 1 occurred at a rate of ~ 1-1.5 per minute.
Reports issued on 8 October noted seismic activity continued to be low to moderate. Earthquakes occurred at a rate of 1 to 2 per minute with the largest magnitudes about M 1.5. That day field crews reported that there had not been noticeable additional uplift of the S part of the dome and adjacent glacier in the past 24 hours. Measurements from the recent photographs and lidar showed that the intensely deformed and uplifted area on the S side of the lava dome was then about 400 m (N-S) x 500 m (E-W) with a maximum uplift of about 100-130 m.
Seismicity rose gradually for most of 8 October and leveled off overnight. Earthquakes of M 2.4 occurred about once every two minutes. During 10 October seismicity decreased slightly, to levels similar to those observed during the evening hours of 7 October. Earthquakes of 1.0 M or less continued to occur at a rate of about 1 per minute, but most had magnitudes of M 1.0 or less.
On 12 October seismicity remained low. Small earthquakes (maximum about M 1) continued to occur every 5-10 minutes. Thermal imaging around 12 October of the W part of the uplifting area revealed temperatures of 500-600°C, by far the highest yet reported. They were greatest on a large pinkish-gray fin of rock and in nearby fumaroles and cracks. These observations were consistent with new lava having reached the ground surface. Later sampling of adjacent fresh talus using a metal trash can on a line below a helicopter confirmed it's dacitic composition.
Aviation advisories. The Washington VAAC issued advisories beginning on 29 September. Between then and through 8 October, they issued 23 Volcanic Ash Advisories. Some of these were also 'volcano watches.' Most of these were cautionary in nature, and actual plumes were generally minor, frequently steam dominated rather than heavily ash laden.
Geologic Background. Prior to 1980, Mount St. Helens was a conical volcano sometimes known as the Fujisan of America. During the 1980 eruption the upper 400 m of the summit was removed by slope failure, leaving a 2 x 3.5 km breached crater now partially filled by a lava dome. There have been nine major eruptive periods beginning about 40-50,000 years ago, and it has been the most active volcano in the Cascade Range during the Holocene. Prior to 2,200 years ago, tephra, lava domes, and pyroclastic flows were erupted, forming the older edifice, but few lava flows extended beyond the base of the volcano. The modern edifice consists of basaltic as well as andesitic and dacitic products from summit and flank vents. Eruptions in the 19th century originated from the Goat Rocks area on the N flank, and were witnessed by early settlers.
Information Contacts: Cascades Volcano Observatory (USGS/CVO), U.S. Geological Survey, 1300 SE Cardinal Court, Building 10, Suite 100, Vancouver, WA 98683-9589, USA (URL: https://volcanoes.usgs.gov/observatories/cvo/); Pacific Northwest Seismograph Network (PNSN), Seismology Lab, University of Washington, Department of Earth and Space Sciences, Box 351310, Seattle, WA 98195-1310, USA (URL: http://www.pnsn.org/); Ivan Savov, Department of Mineral Sciences, National Museum of Natural History, Smithsonian Institution, Washington, DC 20560-0119, USA; Washington Volcanic Ash Advisory Center (VAAC), Satellite Analysis Branch (SAB), NOAA/NESDIS E/SP23, NOAA Science Center Room 401, 5200 Auth Road, Camp Springs, MD 20746, USA (URL: http://www.ospo.noaa.gov/Products/atmosphere/vaac/).