Recently Published Bulletin Reports
Erebus (Antarctica) Lava lake remains active; most thermal alerts recorded since 2019
Rincon de la Vieja (Costa Rica) Frequent phreatic explosions during July-December 2023
Bezymianny (Russia) Explosion on 18 October 2023 sends ash plume 8 km high; lava flows and incandescent avalanches
Kilauea (United States) Low-level lava effusions in the lava lake at Halema’uma’u during July-December 2022
Nyamulagira (DR Congo) Lava flows and thermal activity during May-October 2023
Bagana (Papua New Guinea) Explosions, ash plumes, ashfall, and lava flows during April-September 2023
Mayon (Philippines) Lava flows, pyroclastic flows, ash emissions, and seismicity during April-September 2023
Nishinoshima (Japan) Eruption plumes and gas-and-steam plumes during May-August 2023
Krakatau (Indonesia) White gas-and-steam plumes and occasional ash plumes during May-August 2023
Villarrica (Chile) Strombolian activity, gas-and-ash emissions, and crater incandescence during April-September 2023
Merapi (Indonesia) Frequent incandescent avalanches during April-September 2023
Ebeko (Russia) Moderate explosive activity with ash plumes continued during June-November 2023
Erebus (Antarctica) — January 2024  Cite this Report
Erebus
Antarctica
77.53°S, 167.17°E; summit elev. 3794 m
All times are local (unless otherwise noted)
Lava lake remains active; most thermal alerts recorded since 2019
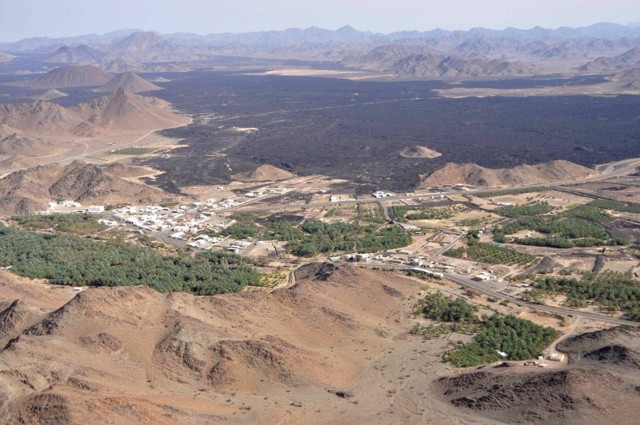
The lava lake in the summit crater of Erebus has been active since at least 1972. Located in Antarctica overlooking the McMurdo Station on Ross Island, it is the southernmost active volcano on the planet. Because of the remote location, activity is primarily monitored by satellites. This report covers activity during 2023.
The number of thermal alerts recorded by the Hawai'i Institute of Geophysics and Planetology’s MODVOLC Thermal Alerts System increased considerably in 2023 compared to the years 2020-2022 (table 9). In contrast to previous years, the MODIS instruments aboard the Aqua and Terra satellites captured data from Erebus every month during 2023. Consistent with previous years, the lowest number of anomalous pixels were recorded in January, November, and December.
Table 9. Number of monthly MODIS-MODVOLC thermal alert pixels recorded at Erebus during 2017-2023. See BGVN 42:06 for data from 2000 through 2016. The table was compiled using data provided by the HIGP – MODVOLC Thermal Alerts System.
| Year |
Jan |
Feb |
Mar |
Apr |
May |
Jun |
Jul |
Aug |
Sep |
Oct |
Nov |
Dec |
SUM |
| 2017 |
0 |
21 |
9 |
0 |
0 |
1 |
11 |
61 |
76 |
52 |
0 |
3 |
234 |
| 2018 |
0 |
21 |
58 |
182 |
55 |
17 |
137 |
172 |
103 |
29 |
0 |
0 |
774 |
| 2019 |
2 |
21 |
162 |
151 |
55 |
56 |
75 |
53 |
29 |
19 |
1 |
0 |
624 |
| 2020 |
0 |
2 |
16 |
18 |
4 |
4 |
1 |
3 |
18 |
3 |
1 |
6 |
76 |
| 2021 |
0 |
9 |
1 |
0 |
2 |
56 |
46 |
47 |
35 |
52 |
5 |
3 |
256 |
| 2022 |
1 |
13 |
55 |
22 |
15 |
32 |
39 |
19 |
31 |
11 |
0 |
0 |
238 |
| 2023 |
2 |
33 |
49 |
82 |
41 |
32 |
70 |
64 |
42 |
17 |
5 |
11 |
448 |
Sentinel-2 infrared images showed one or two prominent heat sources within the summit crater, accompanied by adjacent smaller sources, similar to recent years (see BGVN 46:01, 47:02, and 48:01). A unique image was obtained on 25 November 2023 by the OLI-2 (Operational Land Imager-2) on Landsat 9, showing the upper part of the volcano surrounded by clouds (figure 32).
Geologic Background. Mount Erebus, the world's southernmost historically active volcano, overlooks the McMurdo research station on Ross Island. It is the largest of three major volcanoes forming the crudely triangular Ross Island. The summit of the dominantly phonolitic volcano has been modified by one or two generations of caldera formation. A summit plateau at about 3,200 m elevation marks the rim of the youngest caldera, which formed during the late-Pleistocene and within which the modern cone was constructed. An elliptical 500 x 600 m wide, 110-m-deep crater truncates the summit and contains an active lava lake within a 250-m-wide, 100-m-deep inner crater; other lava lakes are sometimes present. The glacier-covered volcano was erupting when first sighted by Captain James Ross in 1841. Continuous lava-lake activity with minor explosions, punctuated by occasional larger Strombolian explosions that eject bombs onto the crater rim, has been documented since 1972, but has probably been occurring for much of the volcano's recent history.
Information Contacts: Hawai'i Institute of Geophysics and Planetology (HIGP) - MODVOLC Thermal Alerts System, School of Ocean and Earth Science and Technology (SOEST), Univ. of Hawai'i, 2525 Correa Road, Honolulu, HI 96822, USA (URL: http://modis.higp.hawaii.edu/); Copernicus Browser, Copernicus Data Space Ecosystem, European Space Agency (URL: https://dataspace.copernicus.eu/browser/); NASA Earth Observatory, EOS Project Science Office, NASA Goddard Space Flight Center, Goddard, Maryland, USA (URL: https://earthobservatory.nasa.gov/images/152134/erebus-breaks-through).
Rincon de la Vieja (Costa Rica) — January 2024 Cite this Report
Rincon de la Vieja
Costa Rica
10.83°N, 85.324°W; summit elev. 1916 m
All times are local (unless otherwise noted)
Frequent phreatic explosions during July-December 2023
Rincón de la Vieja is a volcanic complex in Costa Rica with a hot convecting acid lake that exhibits frequent weak phreatic explosions, gas-and-steam emissions, and occasional elevated sulfur dioxide levels (BGVN 45:10, 46:03, 46:11). The current eruption period began June 2021. This report covers activity during July-December 2023 and is based on weekly bulletins and occasional daily reports from the Observatorio Vulcanologico Sismologica de Costa Rica-Universidad Nacional (OVSICORI-UNA).
Numerous weak phreatic explosions continued during July-December 2023, along with gas-and-steam emissions and plumes that rose as high as 3 km above the crater rim. Many weekly OVSICORI-UNA bulletins included the previous week's number of explosions and emissions (table 9). For many explosions, the time of explosion was given (table 10). Frequent seismic activity (long-period earthquakes, volcano-tectonic earthquakes, and tremor) accompanied the phreatic activity.
Table 9. Number of reported weekly phreatic explosions and gas-and-steam emissions at Rincón de la Vieja, July-December 2023. Counts are reported for the week before the Weekly Bulletin date; not all reports included these data. Courtesy of OVSICORI-UNA.
| OVSICORI Weekly Bulletin |
Number of explosions |
Number of emissions |
| 28 Jul 2023 |
6 |
14 |
| 4 Aug 2023 |
10 |
12 |
| 1 Sep 2023 |
13 |
11 |
| 22 Sep 2023 |
12 |
13 |
| 29 Sep 2023 |
6 |
11 |
| 6 Oct 2023 |
12 |
5 |
| 13 Oct 2023 |
7 |
9 |
| 20 Oct 2023 |
1 |
15 |
| 27 Oct 2023 |
3 |
23 |
| 3 Nov 2023 |
3 |
10 |
| 17 Nov 2023 |
0 |
Some |
| 24 Nov 2023 |
0 |
14 |
| 8 Dec 2023 |
4 |
16 |
| 22 Dec 2023 |
8 |
18 |
Table 10. Summary of activity at Rincón de la Vieja during July-December 2023. Weak phreatic explosions and gas emissions are noted where the time of explosion was indicated in the weekly or daily bulletins. Height of plumes or emissions are distance above the crater rim. Courtesy of OVSICORI-UNA.
| Date |
Time |
Description of Activity |
| 1 Jul 2023 |
0156 |
Explosion. |
| 2 Jul 2023 |
0305 |
Explosion. |
| 4 Jul 2023 |
0229, 0635 |
Event at 0635 produced a gas-and-steam plume that rose 700 m and drifted W; seen by residents in Liberia (21 km SW). |
| 9 Jul 2023 |
1843 |
Explosion. |
| 21 Jul 2023 |
0705 |
Explosion. |
| 26 Jul 2023 |
1807 |
Explosion. |
| 28 Jul 2023 |
0802 |
Explosion generated a gas-and-steam plume that rose 500 m. |
| 30 Jul 2023 |
1250 |
Explosion. |
| 31 Jul 2023 |
2136 |
Explosion. |
| 11 Aug 2023 |
0828 |
Explosion. |
| 18 Aug 2023 |
1304 |
Explosion. |
| 21 Aug 2023 |
1224 |
Explosion generated gas-and-steam plumes rose 500-600 m. |
| 22 Aug 2023 |
0749 |
Explosion generated gas-and-steam plumes rose 500-600 m. |
| 24 Aug 2023 |
1900 |
Explosion. |
| 25 Aug 2023 |
0828 |
Event produced a steam-and-gas plume that rose 3 km and drifted NW. |
| 27-28 Aug 2023 |
0813 |
Four small events; the event at 0813 on 28 August lasted two minutes and generated a steam-and-gas plume that rose 2.5 km. |
| 1 Sep 2023 |
1526 |
Explosion generated plume that rose 2 km and ejected material onto the flanks. |
| 2-3 Sep 2023 |
- |
Small explosions detected in infrasound data. |
| 4 Sep 2023 |
1251 |
Gas-and-steam plume rose 1 km and drifted W. |
| 7 Nov 2023 |
1113 |
Explosion. |
| 8 Nov 2023 |
0722 |
Explosion. |
| 12 Nov 2023 |
0136 |
Small gas emissions. |
| 14 Nov 2023 |
0415 |
Small gas emissions. |
According to OVSICORI-UNA, during July-October the average weekly sulfur dioxide (SO2) flux ranged from 68 to 240 tonnes/day. However, in mid-November the flux increased to as high as 334 tonnes/day, the highest value measured in recent years. The high SO2 flux in mid-November was also detected by the TROPOMI instrument on the Sentinel-5P satellite (figure 43).
Geologic Background. Rincón de la Vieja, the largest volcano in NW Costa Rica, is a remote volcanic complex in the Guanacaste Range. The volcano consists of an elongated, arcuate NW-SE-trending ridge constructed within the 15-km-wide early Pleistocene Guachipelín caldera, whose rim is exposed on the south side. Sometimes known as the "Colossus of Guanacaste," it has an estimated volume of 130 km3 and contains at least nine major eruptive centers. Activity has migrated to the SE, where the youngest-looking craters are located. The twin cone of Santa María volcano, the highest peak of the complex, is located at the eastern end of a smaller, 5-km-wide caldera and has a 500-m-wide crater. A Plinian eruption producing the 0.25 km3 Río Blanca tephra about 3,500 years ago was the last major magmatic eruption. All subsequent eruptions, including numerous historical eruptions possibly dating back to the 16th century, have been from the prominent active crater containing a 500-m-wide acid lake located ENE of Von Seebach crater.
Information Contacts: Observatorio Vulcanológico Sismológica de Costa Rica-Universidad Nacional (OVSICORI-UNA), Apartado 86-3000, Heredia, Costa Rica (URL: http://www.ovsicori.una.ac.cr/); NASA Global Sulfur Dioxide Monitoring Page, Atmospheric Chemistry and Dynamics Laboratory, NASA Goddard Space Flight Center (NASA/GSFC), 8800 Greenbelt Road, Goddard MD 20771, USA (URL: https://so2.gsfc.nasa.gov/).
Bezymianny (Russia) — November 2023 Cite this Report
Bezymianny
Russia
55.972°N, 160.595°E; summit elev. 2882 m
All times are local (unless otherwise noted)
Explosion on 18 October 2023 sends ash plume 8 km high; lava flows and incandescent avalanches
Bezymianny, located on Russia’s Kamchatka Peninsula, has had eruptions since 1955 characterized by dome growth, explosions, pyroclastic flows, ash plumes, and ashfall. Activity during November 2022-April 2023 included gas-and-steam emissions, lava dome collapses generating avalanches, and persistent thermal activity. Similar eruptive activity continued from May through October 2023, described here based on information from weekly and daily reports of the Kamchatka Volcano Eruptions Response Team (KVERT), notices from Tokyo VAAC (Volcanic Ash Advisory Center), and from satellite data.
Overall activity decreased after the strong period of activity in late March through April 2023, which included ash explosions during 29 March and 7-8 April 2023 that sent plumes as high as 10-12 km altitude, along with dome growth and lava flows (BGVN 48:05). This reduced activity can be seen in the MIROVA thermal detection system graph (figure 56), which was consistent with data from the MODVOLC thermal detection system and with Sentinel-2 satellite images that showed persistent hotspots in the summit crater when conditions allowed observations. A renewed period of strong activity began in mid-October 2023.
Activity increased significantly on 17 October 2023 when large collapses began during 0700-0830 on the E flanks of the lava dome and continued to after 0930 the next day (figure 57). Ash plumes rose to an altitude of 4.5-5 km, extending 220 km NNE by 18 October. A large explosion at 1630 on 18 October produced an ash plume that rose to an altitude of 11 km (8 km above the summit) and drifted NNE and then NW, extending 900 km NW within two days at an altitude of 8 km. Minor ashfall was noted in Kozyrevsk (45 km WNW). At 0820 on 20 October an ash plume was identified in satellite images drifting 100 km ENE at altitudes of 4-4.5 km.
Lava flows and hot avalanches from the dome down the SE flank continued over the next few days, including 23 October when clear conditions allowed good observations (figures 58 and 59). A large thermal anomaly was observed over the volcano through 24 October, and in the summit crater on 30 October (figure 60). Strong fumarolic activity continued, with numerous avalanches and occasional incandescence. By the last week of October, volcanic activity had decreased to a level consistent with that earlier in the reporting period.
Aviation warnings were frequently updated during 17-20 October. KVERT issued a Volcano Observatory Notice for Aviation (VONA) on 17 October at 1419 and 1727 (0219 and 0527 UTC) raising the Aviation Color Code (ACC) from Yellow to Orange (second highest level). The next day, KVERT issued a VONA at 1705 (0505 UTC) raising the ACC to Red (highest level) but lowered it back to Orange at 2117 (0917 UTC). After another decrease to Yellow and back to Orange, the ACC was reduced to Yellow on 20 October at 1204 (0004 UTC). In addition, the Tokyo VAAC issued a series of Volcanic Ash Advisories beginning on 16 October and continuing through 30 October.
Geologic Background. The modern Bezymianny, much smaller than its massive neighbors Kamen and Kliuchevskoi on the Kamchatka Peninsula, was formed about 4,700 years ago over a late-Pleistocene lava-dome complex and an edifice built about 11,000-7,000 years ago. Three periods of intensified activity have occurred during the past 3,000 years. The latest period, which was preceded by a 1,000-year quiescence, began with the dramatic 1955-56 eruption. This eruption, similar to that of St. Helens in 1980, produced a large open crater that was formed by collapse of the summit and an associated lateral blast. Subsequent episodic but ongoing lava-dome growth, accompanied by intermittent explosive activity and pyroclastic flows, has largely filled the 1956 crater.
Information Contacts: Kamchatka Volcanic Eruptions Response Team (KVERT), Far Eastern Branch, Russian Academy of Sciences, 9 Piip Blvd., Petropavlovsk-Kamchatsky, 683006, Russia (URL: http://www.kscnet.ru/ivs/kvert/); Kamchatka Volcanological Station, Kamchatka Branch of Geophysical Survey, (KB GS RAS), Klyuchi, Kamchatka Krai, Russia (URL: http://volkstat.ru/); Tokyo Volcanic Ash Advisory Center (VAAC), 1-3-4 Otemachi, Chiyoda-ku, Tokyo 100-8122, Japan (URL: http://ds.data.jma.go.jp/svd/vaac/data/); Hawai'i Institute of Geophysics and Planetology (HIGP) - MODVOLC Thermal Alerts System, School of Ocean and Earth Science and Technology (SOEST), Univ. of Hawai'i, 2525 Correa Road, Honolulu, HI 96822, USA (URL: http://modis.higp.hawaii.edu/); MIROVA (Middle InfraRed Observation of Volcanic Activity), a collaborative project between the Universities of Turin and Florence (Italy) supported by the Centre for Volcanic Risk of the Italian Civil Protection Department (URL: http://www.mirovaweb.it/); Copernicus Browser, Copernicus Data Space Ecosystem, European Space Agency (URL: https://dataspace.copernicus.eu/browser/).chr
Kilauea (United States) — January 2023 Cite this Report
Kilauea
United States
19.421°N, 155.287°W; summit elev. 1222 m
All times are local (unless otherwise noted)
Low-level lava effusions in the lava lake at Halema’uma’u during July-December 2022
Kīlauea is the southeastern-most volcano in Hawaii and overlaps the E flank of the Mauna Loa volcano. Its East Rift Zone (ERZ) has been intermittently active for at least 2,000 years. An extended eruption period began in January 1983 and was characterized by open lava lakes and lava flows from the summit caldera and the East Rift Zone. During May 2018 magma migrated into the Lower East Rift Zone (LERZ) and opened 24 fissures along a 6-km-long NE-trending fracture zone that produced lava flows traveling in multiple directions. As lava emerged from the fissures, the lava lake at Halema'uma'u drained and explosions sent ash plumes to several kilometers altitude (BGVN 43:10).
The current eruption period started during September 2021 and has recently been characterized by lava effusions, spatter, and sulfur dioxide emissions in the active Halema’uma’u lava lake (BGVN 47:08). Lava effusions, some spatter, and sulfur dioxide emissions have continued during this reporting period of July through December 2022 using daily reports, volcanic activity notices, and abundant photo, map, and video data from the US Geological Survey's (USGS) Hawaiian Volcano Observatory (HVO).
Summary of activity during July-December 2022. Low-level effusions have continued at the western vent of the Halema’uma’u crater during July through early December 2022. Occasional weak ooze-outs (also called lava break outs) would occur along the margins of the crater floor. The overall level of the active lava lake throughout the reporting period gradually increased due to infilling, however it stagnated in mid-September (table 13). During September through November, activity began to decline, though lava effusions persisted at the western vent. By 9 December, the active part of the lava lake had completely crusted over, and incandescence was no longer visible.
Table 13. Summary of measurements taken during overflights at Kīlauea that show a gradual increase in the active lava lake level and the volume of lava effused since 29 September 2021. Lower activity was reported during September-October. Data collected during July-December 2022. Courtesy of HVO.
| Date: |
Level of the active lava lake (m): |
Cumulative volume of lava effused (million cubic meters): |
| 7 Jul 2022 |
130 |
95 |
| 19 Jul 2022 |
133 |
98 |
| 4 Aug 2022 |
136 |
102 |
| 16 Aug 2022 |
137 |
104 |
| 12 Sep 2022 |
143 |
111 |
| 5 Oct 2022 |
143 |
111 |
| 28 Oct 2022 |
143 |
111 |
Activity during July 2022. Lava effusions were reported from the western vent in the Halema’uma’u crater, along with occasional weak ooze-outs along the margins of the crater floor. The height of the lava lake was variable due to deflation-inflation tilt events; for example, the lake level dropped approximately 3-4 m during a summit deflation-inflation event reported on 1 July. Webcam images taken during the night of 6-12 July showed intermittent low-level spattering at the western vent that rose less than 10 m above the vent (figure 519). Measurements made during an overflight on 7 July indicated that the crater floor was infilled about 130 m and that 95 million cubic meters of lava had been effused since 29 September 2021. A single, relatively small lava ooze-out was active to the S of the lava lake. Around midnight on 8 July there were two brief periods of lava overflow onto the lake margins. On 9 July lava ooze-outs were reported near the SE and NE edges of the crater floor and during 10-11 July they occurred near the E, NE, and NW edges. On 16 July crater incandescence was reported, though the ooze-outs and spattering were not visible. On 18 July overnight webcam images showed incandescence in the western vent complex and two ooze-outs were reported around 0000 and 0200 on 19 July. By 0900 there were active ooze-outs along the SW edge of the crater floor. Measurements made from an overflight on 19 July indicated that the crater floor was infilled about 133 m and 98 million cubic meters of lava had erupted since 29 September 2021 (figure 520). On 20 July around 1600 active ooze-outs were visible along the N edge of the crater, which continued through the next day. Extensive ooze-outs occurred along the W margin during 24 July until 1900; on 26 July minor ooze-outs were noted along the N margin. Minor spattering was visible on 29 July along the E margin of the lake. The sulfur dioxide emission rates ranged 650-2,800 tons per day (t/d), the higher of which was measured on 8 July (figure 519).
Activity during August 2022. The eruption continued in the Halema’uma’u crater at the western vent. According to HVO the lava in the active lake remained at the level of the bounding levees. Occasional minor ooze-outs were observed along the margins of the crater floor. Strong nighttime crater incandescence was visible after midnight on 6 August over the western vent cone. During 6-7 August scattered small lava lobes were active along the crater floor and incandescence persisted above the western vent through 9 August. During 7-9 August HVO reported a single lava effusion source was active along the NW margin of the crater floor. Measurements from an overflight on 4 August indicated that the crater floor was infilled about 136 m total and that 102 million cubic meters of lava had been erupted since the start of the eruption. Lava breakouts were reported along the N, NE, E, S, and W margins of the crater during 10-16 August. Another overflight survey conducted on 16 August indicated that the crater floor infilled about 137 m and 104 million cubic meters of lava had been erupted since September 2021. Measured sulfur dioxide emissions rates ranged 1,150-2,450 t/d, the higher of which occurred on 8 August.
Activity during September 2022. During September, lava effusion continued from the western vent into the active lava lake and onto the crater floor. Intermittent minor ooze-outs were reported through the month. A small ooze-out was visible on the W crater floor margin at 0220 on 2 September, which showed decreasing surface activity throughout the day, but remained active through 3 September. On 3 September around 1900 a lava outbreak occurred along the NW margin of the crater floor but had stopped by the evening of 4 September. Field crews monitoring the summit lava lake on 9 September observed spattering on the NE margin of the lake that rose no higher than 10 m, before falling back onto the lava lake crust (figure 521). Overflight measurements on 12 September indicated that the crater floor was infilled a total of 143 m and 111 million cubic meters of lava had been erupted since September 2021. Extensive breakouts in the W and N part of the crater floor were reported at 1600 on 20 September and continued into 26 September. The active part of the lava lake dropped by 10 m while other parts of the crater floor dropped by several meters. Summit tiltmeters recorded a summit seismic swarm of more than 80 earthquakes during 1500-1800 on 21 September, which occurred about 1.5 km below Halema’uma’u; a majority of these were less than Mw 2. By 22 September the active part of the lava lake was infilled about 2 m. On 23 September the western vent areas exhibited several small spatter cones with incandescent openings, along with weak, sporadic spattering (figure 522). The sulfur dioxide emission rate ranged from 930 t/d to 2,000 t/d, the higher of which was measured on 6 September.
Activity during October 2022. Activity during October declined slightly compared to previous months, though lava effusions persisted from the western vent into the active lava lake and onto the crater floor during October (figure 523). Slight variations in the lava lake were noted throughout the month. HVO reported that around 0600 on 3 October the level of the lava lake has lowered slightly. Overflight measurements taken on 5 October indicated that the crater floor was infilled a total of about 143 m and that 111 million cubic meters of lava had been effused since September 2021. During 6-7 October the lake gradually rose 0.5 m. Sulfur dioxide measurements made on 22 October had an emission rate of 700 t/d. Another overflight taken on 28 October showed that there was little to no change in the elevation of the crater floor: the crater floor was infilled a total of 143 m and 111 million cubic meters of lava had erupted since the start of the eruption.
Activity during November 2022. Activity remained low during November, though HVO reported that lava from the western vent continued to effuse into the active lava lake and onto the crater floor throughout the month. The rate of sulfur dioxide emissions during November ranged from 300-600 t/d, the higher amount of which occurred on 9 November.
Activity during December 2022. Similar low activity was reported during December, with lava effusing from the western vent into the active lava lake and onto the crater floor. During 4-5 December the active part of the lava lake was slightly variable in elevation and fluctuated within 1 m. On 9 December HVO reported that lava was no longer erupting from the western vent in the Halema’uma’u crater and that sulfur dioxide emissions had returned to near pre-eruption background levels; during 10-11 December, the lava lake had completely crusted over, and no incandescence was visible (figure 524). Time lapse camera images covering the 4-10 December showed that the crater floor showed weak deflation and no inflation. Some passive events of crustal overturning were reported during 14-15 December, which brought fresh incandescent lava to the lake surface. The sulfur dioxide emission rate was approximately 200 t/d on 14 December. A smaller overturn event on 17 December and another that occurred around 0000 and into the morning of 20 December were also detected. A small seismic swarm was later detected on 30 December.
Geologic Background. Kilauea overlaps the E flank of the massive Mauna Loa shield volcano in the island of Hawaii. Eruptions are prominent in Polynesian legends; written documentation since 1820 records frequent summit and flank lava flow eruptions interspersed with periods of long-term lava lake activity at Halemaumau crater in the summit caldera until 1924. The 3 x 5 km caldera was formed in several stages about 1,500 years ago and during the 18th century; eruptions have also originated from the lengthy East and Southwest rift zones, which extend to the ocean in both directions. About 90% of the surface of the basaltic shield volcano is formed of lava flows less than about 1,100 years old; 70% of the surface is younger than 600 years. The long-term eruption from the East rift zone between 1983 and 2018 produced lava flows covering more than 100 km2, destroyed hundreds of houses, and added new coastline.
Information Contacts: Hawaiian Volcano Observatory (HVO), U.S. Geological Survey, PO Box 51, Hawai'i National Park, HI 96718, USA (URL: http://hvo.wr.usgs.gov/).
Nyamulagira (DR Congo) — November 2023 Cite this Report
Nyamulagira
DR Congo
1.408°S, 29.2°E; summit elev. 3058 m
All times are local (unless otherwise noted)
Lava flows and thermal activity during May-October 2023
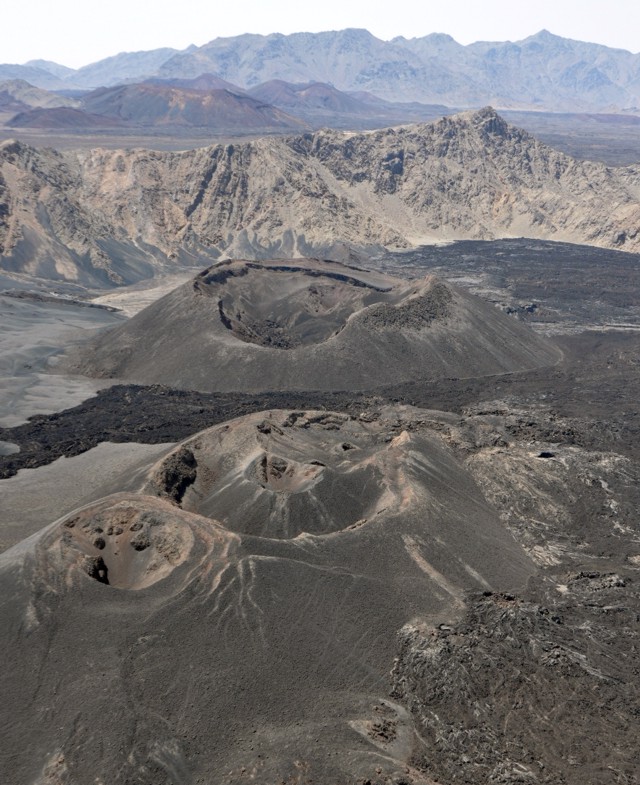
Nyamulagira (also known as Nyamuragira) is a shield volcano in the Democratic Republic of Congo with the summit truncated by a small 2 x 2.3 km caldera with walls up to about 100 m high. Documented eruptions have occurred within the summit caldera, as well as from numerous flank fissures and cinder cones. The current eruption period began in April 2018 and has more recently been characterized by summit crater lava flows and thermal activity (BGVN 48:05). This report describes lava flows and variable thermal activity during May through October 2023, based on information from the Observatoire Volcanologique de Goma (OVG) and various satellite data.
Lava lake activity continued during May. The MIROVA (Middle InfraRed Observation of Volcanic Activity) system recorded moderate-to-strong thermal activity throughout the reporting period; activity was more intense during May and October and relatively weaker from June through September (figure 95). The MODVOLC thermal algorithm, detected a total of 209 thermal alerts. There were 143 hotspots detected during May, eight during June, nine during September, and 49 during October. This activity was also reflected in infrared satellite images, where a lava flow was visible in the NW part of the crater on 7 May and strong activity was seen in the center of the crater on 4 October (figure 96). Another infrared satellite image taken on 12 May showed still active lava flows along the NW margin of the crater. According to OVG lava effusions were active during 7-29 May and moved to the N and NW parts of the crater beginning on 9 May. Strong summit crater incandescence was visible from Goma (27 km S) during the nights of 17, 19, and 20 May (figure 97). On 17 May there was an increase in eruptive activity, which peaked at 0100 on 20 May. Notable sulfur dioxide plumes drifted NW and W during 19-20 May (figure 98). Drone footage acquired in partnership with the USGS (United States Geological Survey) on 20 May captured images of narrow lava flows that traveled about 100 m down the W flank (figure 99). Data from the Rumangabo seismic station indicated a decreasing trend in activity during 17-21 May. Although weather clouds prevented clear views of the summit, a strong thermal signature on the NW flank was visible in an infrared satellite image on 22 May, based on an infrared satellite image. On 28 May the lava flows on the upper W flank began to cool and solidify. By 29 May seismicity returned to levels similar to those recorded before the 17 May increase. Lava effusion continued but was confined to the summit crater; periodic crater incandescence was observed.
Low-level activity was noted during June through October. On 1 June OVG reported that seismicity remained at lower levels and that crater incandescence had been absent for three days, though infrared satellite imagery showed continued lava effusion in the summit crater. The lava flows on the flanks covered an estimated 0.6 km2. Satellite imagery continued to show thermal activity confined to the lava lake through October (figure 96), although no lava flows or significant sulfur dioxide emissions were reported.
Geologic Background. Africa's most active volcano, Nyamulagira (also known as Nyamuragira), is a massive high-potassium basaltic shield about 25 km N of Lake Kivu and 13 km NNW of the steep-sided Nyiragongo volcano. The summit is truncated by a small 2 x 2.3 km caldera that has walls up to about 100 m high. Documented eruptions have occurred within the summit caldera, as well as from the numerous flank fissures and cinder cones. A lava lake in the summit crater, active since at least 1921, drained in 1938, at the time of a major flank eruption. Recent lava flows extend down the flanks more than 30 km from the summit as far as Lake Kivu; extensive lava flows from this volcano have covered 1,500 km2 of the western branch of the East African Rift.
Information Contacts: Observatoire Volcanologique de Goma (OVG), Departement de Geophysique, Centre de Recherche en Sciences Naturelles, Lwiro, D.S. Bukavu, DR Congo; Hawai'i Institute of Geophysics and Planetology (HIGP) - MODVOLC Thermal Alerts System, School of Ocean and Earth Science and Technology (SOEST), Univ. of Hawai'i, 2525 Correa Road, Honolulu, HI 96822, USA (URL: http://modis.higp.hawaii.edu/); MIROVA (Middle InfraRed Observation of Volcanic Activity), a collaborative project between the Universities of Turin and Florence (Italy) supported by the Centre for Volcanic Risk of the Italian Civil Protection Department (URL: http://www.mirovaweb.it/); NASA Global Sulfur Dioxide Monitoring Page, Atmospheric Chemistry and Dynamics Laboratory, NASA Goddard Space Flight Center (NASA/GSFC), 8800 Greenbelt Road, Goddard, Maryland, USA (URL: https://so2.gsfc.nasa.gov/); Copernicus Browser, Copernicus Data Space Ecosystem, European Space Agency (URL: https://dataspace.copernicus.eu/browser/); Charles Balagizi, Goma Volcano Observatory, Departement de Geophysique, Centre de Recherche en Sciences Naturelles, Lwiro, D.S. Bukavu, DR Congo.
Bagana (Papua New Guinea) — October 2023 Cite this Report
Bagana
Papua New Guinea
6.137°S, 155.196°E; summit elev. 1855 m
All times are local (unless otherwise noted)
Explosions, ash plumes, ashfall, and lava flows during April-September 2023
The remote volcano of Bagana is located in central Bougainville Island, Papua New Guinea. Recorded eruptions date back to 1842 and activity has consisted of effusive activity that has built a small lava dome in the summit crater and occasional explosions that produced pyroclastic flows. The most recent eruption has been ongoing since February 2000 and has produced occasional explosions, ash plumes, and lava flows. More recently, activity has been characterized by ongoing effusive activity and ash emissions (BGVN 48:04). This report updates activity from April through September 2023 that has consisted of explosions, ash plumes, ashfall, and lava flows, using information from the Darwin Volcanic Ash Advisory Center (VAAC) and satellite data.
An explosive eruption was reported on 7 July that generated a large gas-and-ash plume to high altitudes and caused significant ashfall in local communities; the eruption plume had reached upper tropospheric (16-18 km altitude) altitudes by 2200, according to satellite images. Sulfur dioxide plumes were detected in satellite images on 8 July and indicated that the plume was likely a mixture of gas, ice, and ash. A report issued by the Autonomous Bougainville Government (ABG) (Torokina District, Education Section) on 10 July noted that significant ash began falling during 2000-2100 on 7 July and covered most areas in the Vuakovi, Gotana (9 km SW), Koromaketo, Laruma (25 km W) and Atsilima (27 km NW) villages. Pyroclastic flows also occurred, according to ground-based reports; small deposits confined to one drainage were inspected by RVO during an overflight on 17 July and were confirmed to be from the 7 July event. Ashfall continued until 10 July and covered vegetation, which destroyed bushes and gardens and contaminated rivers and streams.
RVO reported another eruption on 14 July. The Darwin VAAC stated that an explosive event started around 0830 on 15 July and produced an ash plume that rose to 16.5 km altitude by 1000 and drifted N, according to satellite images. The plume continued to drift N and remained visible through 1900, and by 2150 it had dissipated.
Ashfall likely from both the 7 and 15 July events impacted about 8,111 people in Torokina (20 km SW), including Tsito/Vuakovi, Gotana, Koromaketo, Kenaia, Longkogari, Kenbaki, Piva (13 km SW), and Atsinima, and in the Tsitovi district, according to ABG. Significant ashfall was also reported in Ruruvu (22 km N) in the Wakunai District of Central Bougainville, though the thickness of these deposits could not be confirmed. An evacuation was called for the villages in Wakunai, where heavy ashfall had contaminated water sources; the communities of Ruruvu, Togarau, Kakarapaia, Karauturi, Atao, and Kuritaturi were asked to evacuate to a disaster center at the Wakunai District Station, and communities in Torokina were asked to evacuate to the Piva District station. According to a news article, more than 7,000 people needed temporary accommodations, with about 1,000 people in evacuation shelters. Ashfall had deposited over a broad area, contaminating water supplies, affecting crops, and collapsing some roofs and houses in rural areas. Schools were temporarily shut down. Intermittent ash emissions continued through the end of July and drifted NNW, NW, and SW. Fine ashfall was reported on the coast of Torokina, and ash plumes also drifted toward Laruma and Atsilima.
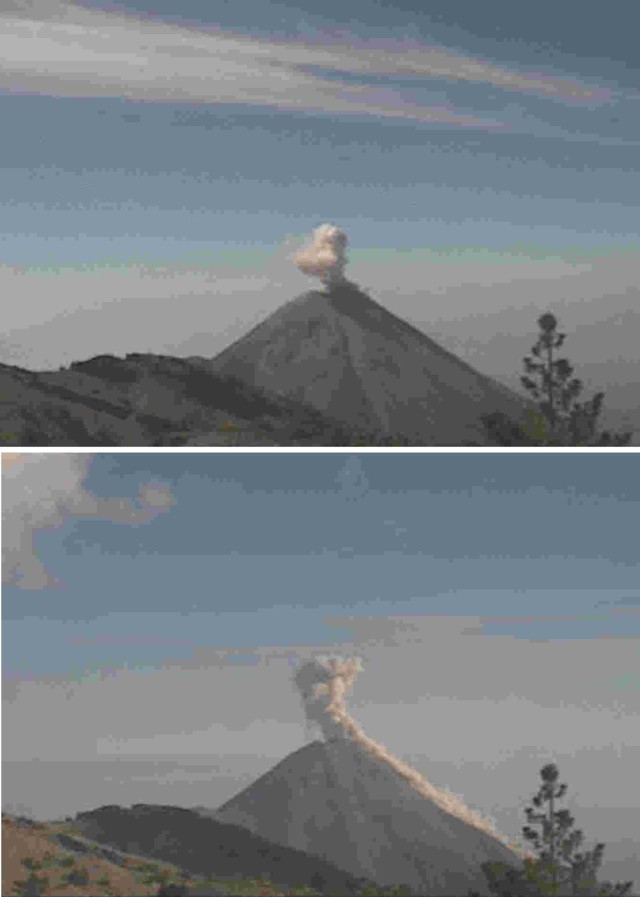
A small explosive eruption occurred at 2130 on 28 July that ejected material from the crater vents, according to reports from Torokina, in addition to a lava flow that contained two lobes. A second explosion was detected at 2157. Incandescence from the lava flow was visible from Piva as it descended the W flank around 2000 on 29 July (figure 47). The Darwin VAAC reported that a strong thermal anomaly was visible in satellite images during 30-31 July and that ash emissions rose to 2.4 km altitude and drifted WSW on 30 July. A ground report from RVO described localized emissions at 0900 on 31 July.
The Darwin VAAC reported that ash plumes were identified in satellite imagery at 0800 and 1220 on 12 August and rose to 2.1 km and 3 km altitude and drifted NW and W, respectively. A news report stated that aid was sent to more than 6,300 people that were adversely affected by the eruption. Photos taken during 17-19 August showed ash emissions rising no higher than 1 km above the summit and drifting SE. A small explosion generated an ash plume during the morning of 19 August. Deposits from small pyroclastic flows were also captured in the photos. Satellite images captured lava flows and pyroclastic flow deposits. Two temporary seismic stations were installed near Bagana on 17 August at distances of 7 km WSW (Vakovi station) and 11 km SW (Kepox station). The Kepox station immediately started to record continuous, low-frequency background seismicity.
Satellite data. Little to no thermal activity was detected during April through mid-July 2023; only one anomaly was recorded during early April and one during early June, according to MIROVA (Middle InfraRed Observation of Volcanic Activity) data (figure 48). Thermal activity increased in both power and frequency during mid-July through September, although there were still some short gaps in detected activity. MODVOLC also detected increased thermal activity during August; thermal hotspots were detected a total of five times on 19, 20, and 27 August. Weak thermal anomalies were also captured in infrared satellite images on clear weather days throughout the reporting period on 7, 12, and 17 April, 27 May, 1, 6, 16, and 31 July, and 19 September (figure 48); a strong thermal anomaly was visible on 31 July. Distinct sulfur dioxide plumes that drifted generally NW were intermittently captured by the TROPOMI instrument on the Sentinel-5P satellite and sometimes exceeded two Dobson Units (DUs) (figure 49).
Geologic Background. Bagana volcano, in a remote portion of central Bougainville Island, is frequently active. This massive symmetrical cone was largely constructed by an accumulation of viscous andesitic lava flows. The entire edifice could have been constructed in about 300 years at its present rate of lava production. Eruptive activity is characterized by non-explosive effusion of viscous lava that maintains a small lava dome in the summit crater, although occasional explosive activity produces pyroclastic flows. Lava flows with tongue-shaped lobes up to 50 m thick and prominent levees descend the flanks on all sides.
Information Contacts: Rabaul Volcano Observatory (RVO), Geohazards Management Division, Department of Mineral Policy and Geohazards Management (DMPGM), PO Box 3386, Kokopo, East New Britain Province, Papua New Guinea; Darwin Volcanic Ash Advisory Centre (VAAC), Bureau of Meteorology, Northern Territory Regional Office, PO Box 40050, Casuarina, NT 0811, Australia (URL: http://www.bom.gov.au/info/vaac/); MIROVA (Middle InfraRed Observation of Volcanic Activity), a collaborative project between the Universities of Turin and Florence (Italy) supported by the Centre for Volcanic Risk of the Italian Civil Protection Department (URL: http://www.mirovaweb.it/); Hawai'i Institute of Geophysics and Planetology (HIGP) - MODVOLC Thermal Alerts System, School of Ocean and Earth Science and Technology (SOEST), Univ. of Hawai'i, 2525 Correa Road, Honolulu, HI 96822, USA (URL: http://modis.higp.hawaii.edu/); NASA Global Sulfur Dioxide Monitoring Page, Atmospheric Chemistry and Dynamics Laboratory, NASA Goddard Space Flight Center (NASA/GSFC), 8800 Greenbelt Road, Goddard, Maryland, USA (URL: https://so2.gsfc.nasa.gov/); Copernicus Browser, Copernicus Data Space Ecosystem, European Space Agency (URL: https://dataspace.copernicus.eu/browser/); Autonomous Bougainville Government, P.O Box 322, Buka, AROB, PNG (URL: https://abg.gov.pg/); Andrew Tupper (Twitter: @andrewcraigtupp); Simon Carn, Geological and Mining Engineering and Sciences, Michigan Technological University, 1400 Townsend Drive, Houghton, MI 49931, USA (URL: http://www.volcarno.com/, Twitter: @simoncarn); Radio NZ (URL: https://www.rnz.co.nz/news/pacific/494464/more-than-7-000-people-in-bougainville-need-temporary-accommodation-after-eruption); USAID, 1300 Pennsylvania Ave, NW, Washington DC 20004, USA (URL: https://www.usaid.gov/pacific-islands/press-releases/aug-08-2023-united-states-provides-immediate-emergency-assistance-support-communities-affected-mount-bagana-volcanic-eruptions).
Mayon (Philippines) — October 2023 Cite this Report
Mayon
Philippines
13.257°N, 123.685°E; summit elev. 2462 m
All times are local (unless otherwise noted)
Lava flows, pyroclastic flows, ash emissions, and seismicity during April-September 2023
Mayon is located in the Philippines and has steep upper slopes capped by a small summit crater. Historical eruptions date back to 1616 CE that have been characterized by Strombolian eruptions, lava flows, pyroclastic flows, and mudflows. Eruptions mostly originated from a central conduit. Pyroclastic flows and mudflows have commonly descended many of the approximately 40 drainages that surround the volcano. The most recent eruption occurred during June through October 2022 and consisted of lava dome growth and gas-and-steam emissions (BGVN 47:12). A new eruption was reported during late April 2023 and has included lava flows, pyroclastic density currents, ash emissions, and seismicity. This report covers activity during April through September 2023 based on daily bulletins from the Philippine Institute of Volcanology and Seismology (PHIVOLCS).
During April through September 2023, PHIVOLCS reported near-daily rockfall events, frequent volcanic earthquakes, and sulfur dioxide measurements. Gas-and-steam emissions rose 100-900 m above the crater and drifted in different directions. Nighttime crater incandescence was often visible during clear weather and was accompanied by incandescent avalanches of material. Activity notably increased during June when lava flows were reported on the S, SE, and E flanks (figure 52). The MIROVA graph (Middle InfraRed Observation of Volcanic Activity) showed strong thermal activity coincident with these lava flows, which remained active through September (figure 53). According to the MODVOLC thermal algorithm, a total of 110 thermal alerts were detected during the reporting period: 17 during June, 40 during July, 27 during August, and 26 during September. During early June, pyroclastic density currents (PDCs) started to occur more frequently.
Low activity was reported during much of April and May; gas-and-steam emissions rose 100-900 m above the crater and generally drifted in different directions. A total of 52 rockfall events and 18 volcanic earthquakes were detected during April and 147 rockfall events and 13 volcanic events during May. Sulfur dioxide flux measurements ranged between 400-576 tons per day (t/d) during April, the latter of which was measured on 29 April and between 162-343 t/d during May, the latter of which was measured on 13 May.
Activity during June increased, characterized by lava flows, pyroclastic density currents (PDCs), crater incandescence and incandescent rockfall events, gas-and-steam emissions, and continued seismicity. Weather clouds often prevented clear views of the summit, but during clear days, moderate gas-and-steam emissions rose 100-2,500 m above the crater and drifted in multiple directions. A total of 6,237 rockfall events and 288 volcanic earthquakes were detected. The rockfall events often deposited material on the S and SE flanks within 700-1,500 m of the summit crater and ash from the events drifted SW, S, SE, NE, and E. Sulfur dioxide emissions ranged between 149-1,205 t/d, the latter of which was measured on 10 June. Short-term observations from EDM and electronic tiltmeter monitoring indicated that the upper slopes were inflating since February 2023. Longer-term ground deformation parameters based on EDM, precise leveling, continuous GPS, and electronic tilt monitoring indicated that the volcano remained inflated, especially on the NW and SE flanks. At 1000 on 5 June the Volcano Alert Level (VAL) was raised to 2 (on a 0-5 scale). PHIVOLCS noted that although low-level volcanic earthquakes, ground deformation, and volcanic gas emissions indicated unrest, the steep increase in rockfall frequency may indicate increased dome activity.
A total of 151 dome-collapse PDCs occurred during 8-9 and 11-30 June, traveled 500-2,000 m, and deposited material on the S flank within 2 km of the summit crater. During 8-9 June the VAL was raised to 3. At approximately 1947 on 11 June lava flow activity was reported; two lobes traveled within 500 m from the crater and deposited material on the S (Mi-isi), SE (Bonga), and E (Basud) flanks. Weak seismicity accompanied the lava flow and slight inflation on the upper flanks. This lava flow remained active through 30 June, moving down the S and SE flank as far as 2.5 km and 1.8 km, respectively and depositing material up to 3.3 km from the crater. During 15-16 June traces of ashfall from the PDCs were reported in Sitio Buga, Nabonton, City of Ligao and Purok, and San Francisco, Municipality of Guinobatan. During 28-29 June there were two PDCs generated by the collapse of the lava flow front, which generated a light-brown ash plume 1 km high. Satellite monitors detected significant concentrations of sulfur dioxide beginning on 29 June. On 30 June PDCs primarily affected the Basud Gully on the E flank, the largest of which occurred at 1301 and lasted eight minutes, based on the seismic record. Four PDCs generated between 1800 and 2000 that lasted approximately four minutes each traveled 3-4 km on the E flank and generated an ash plume that rose 1 km above the crater and drifted N and NW. Ashfall was recorded in Tabaco City.
Similar strong activity continued during July; slow lava effusion remained active on the S and SE flanks and traveled as far as 2.8 km and 2.8 km, respectively and material was deposited as far as 4 km from the crater. There was a total of 6,983 rockfall events and 189 PDCs that affected the S, SE, and E flanks. The volcano network detected a total of 2,124 volcanic earthquakes. Continuous gas-and-steam emissions rose 200-2,000 m above the crater and drifted in multiple directions. Sulfur dioxide emissions averaged 792-4,113 t/d, the latter of which was measured on 28 July. During 2-4 July three PDCs were generated from the collapse of the lava flow and resulting light brown plumes rose 200-300 m above the crater. Continuous tremor pulses were reported beginning at 1547 on 3 July through 7 July at 1200, at 2300 on 8 July and going through 0300 on 10 July, and at 2300 on 16 July, as recorded by the seismic network. During 6-9 July there were 10 lava flow-collapse-related PDCs that generated light brown plumes 300-500 m above the crater. During 10-11 July light ashfall was reported in some areas of Mabinit, Legazpi City, Budiao and Salvacion, Daraga, and Camalig, Albay. By 18 July the lava flow advanced 600 m on the E flank as well.
During 1733 on 18 July and 0434 on 19 July PHIVOLCS reported 30 “ashing” events, which are degassing events accompanied by audible thunder-like sounds and entrained ash at the crater, which produced short, dark plumes that drifted SW. These events each lasted 20-40 seconds, and plume heights ranged from 150-300 m above the crater, as recorded by seismic, infrasound, visual, and thermal monitors. Three more ashing events occurred during 19-20 July. Short-term observations from electronic tilt and GPS monitoring indicate deflation on the E lower flanks in early July and inflation on the NW middle flanks during the third week of July. Longer-term ground deformation parameters from EDM, precise leveling, continuous GPS, and electronic tilt monitoring indicated that the volcano was still generally inflated relative to baseline levels. A short-lived lava pulse lasted 28 seconds at 1956 on 21 July, which was accompanied by seismic and infrasound signals. By 22 July, the only lava flow that remained active was on the SE flank, and continued to extend 3.4 km, while those on the S and E flanks weakened markedly. One ashing event was detected during 30-31 July, whereas there were 57 detected during 31 July-1 August; according to PHIVOLCS beginning at approximately 1800 on 31 July eruptive activity was dominated by phases of intermittent ashing, as well as increased in the apparent rates of lava effusion from the summit crater. The ashing phases consisted of discrete events recorded as low-frequency volcanic earthquakes (LFVQ) typically 30 seconds in duration, based on seismic and infrasound signals. Gray ash plume rose 100 m above the crater and generally drifted NE. Shortly after these ashing events began, new lava began to effuse rapidly from the crater, feeding the established flowed on the SE, E, and E flanks and generating frequent rockfall events.
Intensified unrest persisted during August. There was a total of 4,141 rockfall events, 2,881 volcanic earthquakes, which included volcanic tremor events, 32 ashing events, and 101 PDCs detected throughout the month. On clear weather days, gas-and-steam emissions rose 300-1,500 m above the crater and drifted in different directions (figure 54). Sulfur dioxide emissions averaged 735-4,756 t/d, the higher value of which was measured on 16 August. During 1-2 August the rate of lava effusion decreased, but continued to feed the flows on the SE, S, and E flanks, maintaining their advances to 3.4 km, 2.8 km, and 1.1 km from the crater, respectively (figure 55). Rockfall and PDCs generated by collapses at the lava flow margins and from the summit dome deposited material within 4 km of the crater. During 3-4 August there were 10 tremor events detected that lasted 1-4 minutes. Short-lived lava pulse lasted 35 seconds and was accompanied by seismic and infrasound signals at 0442 on 6 August. Seven collapses were recorded at the front of the lava flow during 12-14 August.
During September, similar activity of slow lava effusion, PDCs, gas-and-steam emissions, and seismicity continued. There was a total of 4,452 rockfall events, 329 volcanic earthquakes, which included volcanic tremor events, two ashing events, and 85 PDCs recorded throughout the month. On clear weather days, gas-and-steam emissions rose 100-1,500 m above the crater and drifted in multiple directions. Sulfur dioxide emissions averaged 609-2,252 t/d, the higher average of which was measured on 6 September. Slow lava effusion continued advancing on the SE, S, and E flanks, maintaining lengths of 3.4 km, 2.8 km, and 1.1 km, respectively. Rockfall and PDC events generated by collapses along the lava flow margins and at the summit dome deposited material within 4 km of the crater.
Geologic Background. Symmetrical Mayon, which rises above the Albay Gulf NW of Legazpi City, is the most active volcano of the Philippines. The steep upper slopes are capped by a small summit crater. Recorded eruptions since 1616 CE range from Strombolian to basaltic Plinian, with cyclical activity beginning with basaltic eruptions, followed by longer periods of andesitic lava flows. Eruptions occur predominately from the central conduit and have also produced lava flows that travel far down the flanks. Pyroclastic density currents and mudflows have commonly swept down many of the approximately 40 ravines that radiate from the summit and have often damaged populated lowland areas. A violent eruption in 1814 killed more than 1,200 people and devastated several towns.
Information Contacts: Philippine Institute of Volcanology and Seismology (PHIVOLCS), Department of Science and Technology, University of the Philippines Campus, Diliman, Quezon City, Philippines (URL: http://www.phivolcs.dost.gov.ph/); MIROVA (Middle InfraRed Observation of Volcanic Activity), a collaborative project between the Universities of Turin and Florence (Italy) supported by the Centre for Volcanic Risk of the Italian Civil Protection Department (URL: http://www.mirovaweb.it/); Hawai'i Institute of Geophysics and Planetology (HIGP) - MODVOLC Thermal Alerts System, School of Ocean and Earth Science and Technology (SOEST), Univ. of Hawai'i, 2525 Correa Road, Honolulu, HI 96822, USA (URL: http://modis.higp.hawaii.edu/); Copernicus Browser, Copernicus Data Space Ecosystem, European Space Agency (URL: https://dataspace.copernicus.eu/browser/); William Rogers, Legazpi City, Albay Province, Philippines.
Nishinoshima (Japan) — October 2023 Cite this Report
Nishinoshima
Japan
27.247°N, 140.874°E; summit elev. 100 m
All times are local (unless otherwise noted)
Eruption plumes and gas-and-steam plumes during May-August 2023
Nishinoshima, located about 1,000 km S of Tokyo, is a small island in the Ogasawara Arc in Japan. The island is the summit of a massive submarine volcano that has prominent submarine peaks to the S, W, and NE. Eruptions date back to 1973 and the current eruption period began in October 2022. Recent activity has consisted of small ash plumes and fumarolic activity (BGVN 48:07). This report covers activity during May through August 2023, using information from monthly reports of the Japan Meteorological Agency (JMA) monthly reports and satellite data.
Activity during May through June was relatively low. The Japan Coast Guard (JCG) did overflights on 14 and 22 June and reported white gas-and-steam emissions rising 600 m and 1,200 m from the central crater of the pyroclastic cone, respectively (figure 125). In addition, multiple white gas-and-steam emissions rose from the inner rim of the W side of the crater and from the SE flank of the pyroclastic cone. Discolored brown-to-green water was observed around almost the entire perimeter of the island; on 22 June light green discolored water was observed off the S coast of the island.
Observations from the Himawari meteorological satellite confirmed an eruption on 9 and 10 July. An eruption plume rose 1.6 km above the crater and drifted N around 1300 on 9 July. Satellite images acquired at 1420 and 2020 on 9 July and at 0220 on 10 July showed continuing emissions that rose 1.3-1.6 km above the crater and drifted NE and N. The Tokyo VAAC reported that an ash plume seen by a pilot and identified in a satellite image at 0630 on 21 July rose to 3 km altitude and drifted S.
Aerial observations conducted by JCG on 8 August showed a white-and-gray plume rising from the central crater of the pyroclastic cone, and multiple white gas-and-steam emissions were rising from the inner edge of the western crater and along the NW-SE flanks of the island (figure 126). Brown-to-green discolored water was also noted around the perimeter of the island.
Intermittent low-to-moderate power thermal anomalies were recorded in the MIROVA graph (Middle InfraRed Observation of Volcanic Activity), showing an increase in both frequency and power beginning in July (figure 127). This increase in activity coincides with eruptive activity on 9 and 10 July, characterized by eruption plumes. According to the MODVOLC thermal alert algorithm, one thermal hotspot was recorded on 20 July. Weak thermal anomalies were also detected in infrared satellite imagery, accompanied by strong gas-and-steam plumes (figure 128).
Geologic Background. The small island of Nishinoshima was enlarged when several new islands coalesced during an eruption in 1973-74. Multiple eruptions that began in 2013 completely covered the previous exposed surface and continued to enlarge the island. The island is the summit of a massive submarine volcano that has prominent peaks to the S, W, and NE. The summit of the southern cone rises to within 214 m of the ocean surface 9 km SSE.
Information Contacts: Japan Meteorological Agency (JMA), 1-3-4 Otemachi, Chiyoda-ku, Tokyo 100-8122, Japan (URL: http://www.jma.go.jp/jma/indexe.html); Tokyo Volcanic Ash Advisory Center (VAAC), 1-3-4 Otemachi, Chiyoda-ku, Tokyo 100-8122, Japan (URL: http://ds.data.jma.go.jp/svd/vaac/data/); MIROVA (Middle InfraRed Observation of Volcanic Activity), a collaborative project between the Universities of Turin and Florence (Italy) supported by the Centre for Volcanic Risk of the Italian Civil Protection Department (URL: http://www.mirovaweb.it/); Copernicus Browser, Copernicus Data Space Ecosystem, European Space Agency (URL: https://dataspace.copernicus.eu/browser/).
Krakatau (Indonesia) — October 2023 Cite this Report
Krakatau
Indonesia
6.1009°S, 105.4233°E; summit elev. 285 m
All times are local (unless otherwise noted)
White gas-and-steam plumes and occasional ash plumes during May-August 2023
Krakatau is located in the Sunda Strait between Java and Sumatra, Indonesia. Caldera collapse during the catastrophic 1883 eruption destroyed Danan and Perbuwatan cones and left only a remnant of Rakata. The post-collapse cone of Anak Krakatau (Child of Krakatau) was constructed within the 1883 caldera at a point between the former Danan and Perbuwatan cones; it has been the site of frequent eruptions since 1927. The current eruption period began in May 2021 and has recently consisted of Strombolian eruptions and ash plumes (BGVN 48:07). This report describes lower levels of activity consisting of ash and white gas-and-steam plumes during May through August 2023, based on information provided by the Indonesian Center for Volcanology and Geological Hazard Mitigation, referred to as Pusat Vulkanologi dan Mitigasi Bencana Geologi (PVMBG), MAGMA Indonesia, and satellite data.
Activity was relatively low during May and June. Daily white gas-and-steam emissions rose 25-200 m above the crater and drifted in different directions. Five ash plumes were detected at 0519 on 10 May, 1241 on 11 May, 0920 on 12 May, 2320 on 12 May, and at 0710 on 13 May, and rose 1-2.5 km above the crater and drifted SW. A webcam image taken on 12 May showed ejection of incandescent material above the vent. A total of nine ash plumes were detected during 6-11 June: at 1434 and 00220 on 6 and 7 June the ash plumes rose 500 m above the crater and drifted NW, at 1537 on 8 June the ash plume rose 1 km above the crater and drifted SW, at 0746 and at 0846 on 9 June the ash plumes rose 800 m and 3 km above the crater and drifted SW, respectively, at 0423, 1431, and 1750 on 10 June the ash plumes rose 2 km, 1.5 km, and 3.5 km above the crater and drifted NW, respectively, and at 0030 on 11 June an ash plume rose 2 km above the crater and drifted NW. Webcam images taken on 10 and 11 June at 0455 and 0102, respectively, showed incandescent material ejected above the vent. On 19 June an ash plume at 0822 rose 1.5 km above the crater and drifted SE.
Similar low activity of white gas-and-steam emissions and few ash plumes were reported during July and August. Daily white gas-and-steam emissions rose 25-300 m above the crater and drifted in multiple directions. Three ash plumes were reported at 0843, 0851, and 0852 on 20 July that rose 500-2,000 m above the crater and drifted NW.
The MIROVA (Middle InfraRed Observation of Volcanic Activity) graph of MODIS thermal anomaly data showed intermittent low-to-moderate power thermal anomalies during May through August 2023 (figure 140). Although activity was often obscured by weather clouds, a thermal anomaly was visible in an infrared satellite image of the crater on 12 May, accompanied by an eruption plume that drifted SW (figure 141).
Geologic Background. The renowned Krakatau (frequently mis-named as Krakatoa) volcano lies in the Sunda Strait between Java and Sumatra. Collapse of an older edifice, perhaps in 416 or 535 CE, formed a 7-km-wide caldera. Remnants of that volcano are preserved in Verlaten and Lang Islands; subsequently the Rakata, Danan, and Perbuwatan cones were formed, coalescing to create the pre-1883 Krakatau Island. Caldera collapse during the catastrophic 1883 eruption destroyed Danan and Perbuwatan, and left only a remnant of Rakata. This eruption caused more than 36,000 fatalities, most as a result of tsunamis that swept the adjacent coastlines of Sumatra and Java. Pyroclastic surges traveled 40 km across the Sunda Strait and reached the Sumatra coast. After a quiescence of less than a half century, the post-collapse cone of Anak Krakatau (Child of Krakatau) was constructed within the 1883 caldera at a point between the former Danan and Perbuwatan cones. Anak Krakatau has been the site of frequent eruptions since 1927.
Information Contacts: Pusat Vulkanologi dan Mitigasi Bencana Geologi (PVMBG, also known as Indonesian Center for Volcanology and Geological Hazard Mitigation, CVGHM), Jalan Diponegoro 57, Bandung 40122, Indonesia (URL: http://www.vsi.esdm.go.id/); MAGMA Indonesia, Kementerian Energi dan Sumber Daya Mineral (URL: https://magma.esdm.go.id/v1); MIROVA (Middle InfraRed Observation of Volcanic Activity), a collaborative project between the Universities of Turin and Florence (Italy) supported by the Centre for Volcanic Risk of the Italian Civil Protection Department (URL: http://www.mirovaweb.it/); Copernicus Browser, Copernicus Data Space Ecosystem, European Space Agency (URL: https://dataspace.copernicus.eu/browser/).
Villarrica (Chile) — October 2023 Cite this Report
Villarrica
Chile
39.42°S, 71.93°W; summit elev. 2847 m
All times are local (unless otherwise noted)
Strombolian activity, gas-and-ash emissions, and crater incandescence during April-September 2023
Villarrica, in central Chile, consists of a 2-km-wide caldera that formed about 3,500 years ago and is located at the base of the presently active cone at the NW margin of a 6-km-wide caldera. Historical eruptions eruptions date back to 1558 and have been characterized by mild-to-moderate explosive activity with occasional lava effusions. The current eruption period began in December 2014 and has recently consisted of nighttime crater incandescence, ash emissions, and seismicity (BGVN 48:04). This report covers activity during April through September 2023 and describes occasional Strombolian activity, gas-and-ash emissions, and nighttime crater incandescence. Information for this report primarily comes from the Southern Andes Volcano Observatory (Observatorio Volcanológico de Los Andes del Sur, OVDAS), part of Chile's National Service of Geology and Mining (Servicio Nacional de Geología y Minería, SERNAGEOMIN) and satellite data.
Seismicity during April consisted of long period (LP) events and tremor (TRE); a total of 9,413 LP-type events and 759 TR-type events were detected throughout the month. Nighttime crater incandescence persisted and was visible in the degassing column. Sulfur dioxide data was obtained using Differential Absorption Optical Spectroscopy Equipment (DOAS) that showed an average value of 1,450 ± 198 tons per day (t/d) during 1-15 April and 1,129 ± 201 t/d during 16-30 April, with a maximum daily value of 2,784 t/d on 9 April. Gas-and-steam emissions of variable intensities rose above the active crater as high as 1.3 km above the crater on 13 April. Strombolian explosions were not observed and there was a slight decrease in the lava lake level.
There were 14,123 LP-type events and 727 TR-type events detected during May. According to sulfur dioxide measurements taken with DOAS equipment, the active crater emitted an average value of 1,826 ± 482 t/d during 1-15 May and 912 ± 41 t/d during 16-30 May, with a daily maximum value of 5,155 t/d on 13 May. Surveillance cameras showed continuous white gas-and-steam emissions that rose as high as 430 m above the crater on 27 May. Nighttime incandescence illuminated the gas column less than 300 m above the crater rim was and no pyroclastic emissions were reported. A landslide was identified on 13 May on the E flank of the volcano 50 m from the crater rim and extending 300 m away; SERNAGEOMIN noted that this event may have occurred on 12 May. During the morning of 27 and 28 May minor Strombolian explosions characterized by incandescent ejecta were recorded at the crater rim; the last reported Strombolian explosions had occurred at the end of March.
Seismic activity during June consisted of five volcano-tectonic (VT)-type events, 21,606 LP-type events, and 2,085 TR-type events. The average value of sulfur dioxide flux obtained by DOAS equipment was 1,420 ± 217 t/d during 1-15 June and 2,562 ± 804 t/d, with a maximum daily value of 4,810 t/d on 17 June. White gas-and-steam emissions rose less than 480 m above the crater; frequent nighttime crater incandescence was reflected in the degassing plume. On 12 June an emission rose 100 m above the crater and drifted NNW. On 15 June one or several emissions resulted in ashfall to the NE as far as 5.5 km from the crater, based on a Skysat satellite image. Several Strombolian explosions occurred within the crater; activity on 15 June was higher energy and ejected blocks 200-300 m on the NE slope. Surveillance cameras showed white gas-and-steam emissions rising 480 m above the crater on 16 June. On 19 and 24 June low-intensity Strombolian activity was observed, ejecting material as far as 200 m from the center of the crater to the E.
During July, seismicity included 29,319 LP-type events, 3,736 TR-type events, and two VT-type events. DOAS equipment recorded two days of sulfur dioxide emissions of 4,220 t/d and 1,009 t/d on 1 and 13 July, respectively. Constant nighttime incandescence was also recorded and was particularly noticeable when accompanied by eruptive columns on 12 and 16 July. Minor explosive events were detected in the crater. According to Skysat satellite images taken on 12, 13, and 16 July, ashfall deposits were identified 155 m S of the crater. According to POVI, incandescence was visible from two vents on the crater floor around 0336 on 12 July. Gas-and-ash emissions rose as high as 1.2 km above the crater on 13 July and drifted E and NW. A series of gas-and-steam pulses containing some ash deposited material on the upper E flank around 1551 on 13 July. During 16-31 July, average sulfur dioxide emissions of 1,679 ± 406 t/d were recorded, with a maximum daily value of 2,343 t/d on 28 July. Fine ash emissions were also reported on 16, 17, and 23 July.
Seismicity persisted during August, characterized by 27,011 LP-type events, 3,323 TR-type events, and three VT-type events. The average value of sulfur dioxide measurements taken during 1-15 August was 1,642 ± 270 t/d and 2,207 ± 4,549 t/d during 16-31 August, with a maximum daily value of 3,294 t/d on 27 August. Nighttime crater incandescence remained visible in degassing columns. White gas-and-steam emissions rose 480 m above the crater on 6 August. According to a Skysat satellite image from 6 August, ash accumulation was observed proximal to the crater and was mainly distributed toward the E slope. White gas-and-steam emissions rose 320 m above the crater on 26 August. Nighttime incandescence and Strombolian activity that generated ash emissions were reported on 27 August.
Seismicity during September was characterized by five VT-type events, 12,057 LP-type events, and 2,058 TR-type events. Nighttime incandescence persisted. On 2 September an ash emission rose 180 m above the crater and drifted SE at 1643 (figure 125) and a white gas-and-steam plume rose 320 m above the crater. According to the Buenos Aires VAAC, periods of continuous gas-and-ash emissions were visible in webcam images from 1830 on 2 September to 0110 on 3 September. Strombolian activity was observed on 2 September and during the early morning of 3 September, the latter event of which generated an ash emission that rose 60 m above the crater and drifted 100 m from the center of the crater to the NE and SW. Ashfall was reported to the SE and S as far as 750 m from the crater. The lava lake was active during 3-4 September and lava fountaining was visible for the first time since 26 March 2023, according to POVI. Fountains captured in webcam images at 2133 on 3 September and at 0054 on 4 September rose as high as 60 m above the crater rim and ejected material onto the upper W flank. Sulfur dioxide flux of 1,730 t/d and 1,281 t/d was measured on 3 and 4 September, respectively, according to data obtained by DOAS equipment.
Strong Strombolian activity and larger gas-and-ash plumes were reported during 18-20 September. On 18 September activity was also associated with energetic LP-type events and notable sulfur dioxide fluxes (as high as 4,277 t/d). On 19 September Strombolian activity and incandescence were observed. On 20 September at 0914 ash emissions rose 50 m above the crater and drifted SSE, accompanied by Strombolian activity that ejected material less than 100 m SSE, causing fall deposits on that respective flank. SERNAGEOMIN reported that a Planet Scope satellite image taken on 20 September showed the lava lake in the crater, measuring 32 m x 35 m and an area of 0.001 km2. Several ash emissions were recorded at 0841, 0910, 1251, 1306, 1312, 1315, and 1324 on 23 September and rose less than 150 m above the crater. The sulfur dioxide flux value was 698 t/d on 23 September and 1,097 t/d on 24 September. On 24 September the Volcanic Alert Level (VAL) was raised to Orange (the third level on a four-color scale). SENAPRED maintained the Alert Level at Yellow (the middle level on a three-color scale) for the communities of Villarrica, Pucón (16 km N), Curarrehue, and Panguipulli.
During 24-25 September there was an increase in seismic energy (observed at TR-events) and acoustic signals, characterized by 1 VT-type event, 213 LP-type events, and 124 TR-type events. Mainly white gas-and-steam emissions, in addition to occasional fine ash emissions were recorded. During the early morning of 25 September Strombolian explosions were reported and ejected material 250 m in all directions, though dominantly toward the NW. On 25 September the average value of sulfur dioxide flux was 760 t/d. Seismicity during 25-30 September consisted of five VT-type events, 1,937 LP-type events, and 456 TR-type events.
During 25-29 September moderate Strombolian activity was observed and ejected material as far as the crater rim. In addition, ash pulses lasting roughly 50 minutes were observed around 0700 and dispersed ENE. During 26-27 September a TR episode lasted 6.5 hours and was accompanied by discrete acoustic signals. Satellite images from 26 September showed a spatter cone on the crater floor with one vent that measured 10 x 14 m and a smaller vent about 35 m NE of the cone. SERNAGEOMIN reported an abundant number of bomb-sized blocks up to 150 m from the crater, as well as impact marks on the snow, which indicated explosive activity. A low-altitude ash emission was observed drifting NW around 1140 on 28 September, based on webcam images. Between 0620 and 0850 on 29 September an ash emission rose 60 m above the crater and drifted NW. During an overflight taken around 1000 on 29 September scientists observed molten material in the vent, a large accumulation of pyroclasts inside the crater, and energetic degassing, some of which contained a small amount of ash. Block-sized pyroclasts were deposited on the internal walls and near the crater, and a distal ash deposit was also visible. The average sulfur dioxide flux measured on 28 September was 344 t/d. Satellite images taken on 29 September ashfall was deposited roughly 3 km WNW from the crater and nighttime crater incandescence remained visible. The average sulfur dioxide flux value from 29 September was 199 t/d. On 30 September at 0740 a pulsating ash emission rose 1.1 km above the crater and drifted NNW (figure 126). Deposits on the S flank extended as far as 4.5 km from the crater rim, based on satellite images from 30 September.
Infrared MODIS satellite data processed by MIROVA (Middle InfraRed Observation of Volcanic Activity) showed intermittent thermal activity during April through September, with slightly stronger activity detected during late September (figure 127). Small clusters of thermal activity were detected during mid-June, early July, early August, and late September. According to the MODVOLC thermal alert system, a total of four thermal hotspots were detected on 7 July and 3 and 23 September. This activity was also intermittently captured in infrared satellite imagery on clear weather days (figure 128).
Geologic Background. The glacier-covered Villarrica stratovolcano, in the northern Lakes District of central Chile, is ~15 km south of the city of Pucon. A 2-km-wide caldera that formed about 3,500 years ago is located at the base of the presently active, dominantly basaltic to basaltic andesite cone at the NW margin of a 6-km-wide Pleistocene caldera. More than 30 scoria cones and fissure vents are present on the flanks. Plinian eruptions and pyroclastic flows that have extended up to 20 km from the volcano were produced during the Holocene. Lava flows up to 18 km long have issued from summit and flank vents. Eruptions documented since 1558 CE have consisted largely of mild-to-moderate explosive activity with occasional lava effusion. Glaciers cover 40 km2 of the volcano, and lahars have damaged towns on its flanks.
Information Contacts: Servicio Nacional de Geología y Minería (SERNAGEOMIN), Observatorio Volcanológico de Los Andes del Sur (OVDAS), Avda Sta María No. 0104, Santiago, Chile (URL: http://www.sernageomin.cl/); Proyecto Observación Villarrica Internet (POVI) (URL: http://www.povi.cl/); Sistema y Servicio Nacional de Prevención y Repuesta Ante Desastres (SENAPRED), Av. Beauchef 1671, Santiago, Chile (URL: https://web.senapred.cl/); Buenos Aires Volcanic Ash Advisory Center (VAAC), Servicio Meteorológico Nacional-Fuerza Aérea Argentina, 25 de mayo 658, Buenos Aires, Argentina (URL: http://www.smn.gov.ar/vaac/buenosaires/inicio.php); MIROVA (Middle InfraRed Observation of Volcanic Activity), a collaborative project between the Universities of Turin and Florence (Italy) supported by the Centre for Volcanic Risk of the Italian Civil Protection Department (URL: http://www.mirovaweb.it/); Hawai'i Institute of Geophysics and Planetology (HIGP) - MODVOLC Thermal Alerts System, School of Ocean and Earth Science and Technology (SOEST), Univ. of Hawai'i, 2525 Correa Road, Honolulu, HI 96822, USA (URL: http://modis.higp.hawaii.edu/); Copernicus Browser, Copernicus Data Space Ecosystem, European Space Agency (URL: https://dataspace.copernicus.eu/browser/).
Merapi (Indonesia) — October 2023 Cite this Report
Merapi
Indonesia
7.54°S, 110.446°E; summit elev. 2910 m
All times are local (unless otherwise noted)
Frequent incandescent avalanches during April-September 2023
Merapi, located just north of the major city of Yogyakarta in central Java, Indonesia, has had activity within the last 20 years characterized by pyroclastic flows and lahars accompanying growth and collapse of the steep-sided active summit lava dome. The current eruption period began in late December 2020 and has more recently consisted of ash plumes, intermittent incandescent avalanches of material, and pyroclastic flows (BGVN 48:04). This report covers activity during April through September 2023, based on information from Balai Penyelidikan dan Pengembangan Teknologi Kebencanaan Geologi (BPPTKG), the Center for Research and Development of Geological Disaster Technology, a branch of PVMBG which specifically monitors Merapi. Additional information comes from the Pusat Vulkanologi dan Mitigasi Bencana Geologi (PVMBG, also known as Indonesian Center for Volcanology and Geological Hazard Mitigation, CVGHM), MAGMA Indonesia, the Darwin Volcanic Ash Advisory Centre (VAAC), and various satellite data.
Activity during April through September 2023 primarily consisted of incandescent avalanches of material that mainly affected the SW and W flanks and traveled as far as 2.3 km from the summit (table 25) and white gas-and-steam emissions that rose 10-1,000 m above the crater.
Table 25. Monthly summary of avalanches and avalanche distances recorded at Merapi during April through September 2023. The number of reported avalanches does not include instances where possible avalanches were heard but could not be visually confirmed as a result of inclement weather. Data courtesy of BPPTKG (April-September 2023 daily reports).
| Month |
Average number of avalanches per day |
Distance avalanches traveled (m) |
| Apr 2023 |
19 |
1,200-2,000 |
| May 2023 |
22 |
500-2,000 |
| Jun 2023 |
18 |
1,200-2,000 |
| Jul 2023 |
30 |
300-2,000 |
| Aug 2023 |
25 |
400-2,300 |
| Sep 2023 |
23 |
600-2,000 |
BPPTKG reported that during April and May white gas-and-steam emissions rose 10-750 m above the crater, incandescent avalanches descended 500-2,000 m on the SW and W flanks (figure 135). Cloudy weather often prevented clear views of the summit, and sometimes avalanches could not be confirmed. According to a webcam image, a pyroclastic flow was visible on 17 April at 0531. During the week of 28 April and 4 May a pyroclastic flow was reported on the SW flank, traveling up to 2.5 km. According to a drone overflight taken on 17 May the SW lava dome volume was an estimated 2,372,800 cubic meters and the dome in the main crater was an estimated 2,337,300 cubic meters.
During June and July similar activity persisted with white gas-and-steam emissions rising 10-350 m above the crater and frequent incandescent avalanches that traveled 300-2,000 m down the SW, W, and S flanks (figure 136). Based on an analysis of aerial photos taken on 24 June the volume of the SW lava dome was approximately 2.5 million cubic meters. A pyroclastic flow was observed on 5 July that traveled 2.7 km on the SW flank. According to the Darwin VAAC multiple minor ash plumes were identified in satellite images on 19 July that rose to 3.7 km altitude and drifted S and SW. During 22, 25, and 26 July a total of 17 avalanches descended as far as 1.8 km on the S flank.
Frequent white gas-and-steam emissions continued during August and September, rising 10-450 m above the crater. Incandescent avalanches mainly affected the SW and W flanks and traveled 400-2,300 m from the vent (figure 137). An aerial survey conducted on 10 August was analyzed and reported that estimates of the SW dome volume was 2,764,300 cubic meters and the dome in the main crater was 2,369,800 cubic meters.
Frequent and moderate-power thermal activity continued throughout the reporting period, according to a MIROVA (Middle InfraRed Observation of Volcanic Activity) analysis of MODIS satellite data (figure 138). There was an increase in the number of detected anomalies during mid-May. The MODVOLC thermal algorithm recorded a total of 47 thermal hotspots: six during April, nine during May, eight during June, 15 during July, four during August, and five during September. Some of this activity was captured in infrared satellite imagery on clear weather days, sometimes accompanied by incandescent material on the SW flank (figure 139).
Geologic Background. Merapi, one of Indonesia's most active volcanoes, lies in one of the world's most densely populated areas and dominates the landscape immediately north of the major city of Yogyakarta. It is the youngest and southernmost of a volcanic chain extending NNW to Ungaran volcano. Growth of Old Merapi during the Pleistocene ended with major edifice collapse perhaps about 2,000 years ago, leaving a large arcuate scarp cutting the eroded older Batulawang volcano. Subsequent growth of the steep-sided Young Merapi edifice, its upper part unvegetated due to frequent activity, began SW of the earlier collapse scarp. Pyroclastic flows and lahars accompanying growth and collapse of the steep-sided active summit lava dome have devastated cultivated lands on the western-to-southern flanks and caused many fatalities.
Information Contacts: Balai Penyelidikan dan Pengembangan Teknologi Kebencanaan Geologi (BPPTKG), Center for Research and Development of Geological Disaster Technology (URL: http://merapi.bgl.esdm.go.id/, Twitter: @BPPTKG); MAGMA Indonesia, Kementerian Energi dan Sumber Daya Mineral (URL: https://magma.esdm.go.id/v1); Pusat Vulkanologi dan Mitigasi Bencana Geologi (PVMBG, also known as Indonesian Center for Volcanology and Geological Hazard Mitigation, CVGHM), Jalan Diponegoro 57, Bandung 40122, Indonesia (URL: http://www.vsi.esdm.go.id/); Darwin Volcanic Ash Advisory Centre (VAAC), Bureau of Meteorology, Northern Territory Regional Office, PO Box 40050, Casuarina, NT 0811, Australia (URL: http://www.bom.gov.au/info/vaac/); MIROVA (Middle InfraRed Observation of Volcanic Activity), a collaborative project between the Universities of Turin and Florence (Italy) supported by the Centre for Volcanic Risk of the Italian Civil Protection Department (URL: http://www.mirovaweb.it/); Hawai'i Institute of Geophysics and Planetology (HIGP) - MODVOLC Thermal Alerts System, School of Ocean and Earth Science and Technology (SOEST), Univ. of Hawai'i, 2525 Correa Road, Honolulu, HI 96822, USA (URL: http://modis.higp.hawaii.edu/); Copernicus Browser, Copernicus Data Space Ecosystem, European Space Agency (URL: https://dataspace.copernicus.eu/browser/); Øystein Lund Andersen (URL: https://www.oysteinlundandersen.com/, https://twitter.com/oysteinvolcano).
Ebeko
Russia
50.686°N, 156.014°E; summit elev. 1103 m
All times are local (unless otherwise noted)
Moderate explosive activity with ash plumes continued during June-November 2023
Ebeko, located on the N end of Paramushir Island in Russia’s Kuril Islands just S of the Kamchatka Peninsula, consists of three summit craters along a SSW-NNE line at the northern end of a complex of five volcanic cones. Observed eruptions date back to the late 18th century and have been characterized as small-to-moderate explosions from the summit crater, accompanied by intense fumarolic activity. The current eruptive period began in June 2022, consisting of frequent explosions, ash plumes, and thermal activity (BGVN 47:10, 48:06). This report covers similar activity during June-November 2023, based on information from the Kamchatka Volcanic Eruptions Response Team (KVERT) and satellite data.
Moderate explosive activity continued during June-November 2023 (figures 50 and 51). According to visual data from Severo-Kurilsk, explosions sent ash 2-3.5 km above the summit (3-4.5 km altitude) during most days during June through mid-September. Activity after mid-September was slightly weaker, with ash usually reaching less than 2 km above the summit. According to KVERT the volcano in October and November was, with a few exceptions, either quiet or obscured by clouds that prevented satellite observations. KVERT issued Volcano Observatory Notices for Aviation (VONA) on 8 and 12 June, 13 and 22 July, 3 and 21 August, and 31 October warning of potential aviation hazards from ash plumes drifting 3-15 km from the volcano. Based on satellite data, KVERT reported a persistent thermal anomaly whenever weather clouds permitted viewing.
Geologic Background. The flat-topped summit of the central cone of Ebeko volcano, one of the most active in the Kuril Islands, occupies the northern end of Paramushir Island. Three summit craters located along a SSW-NNE line form Ebeko volcano proper, at the northern end of a complex of five volcanic cones. Blocky lava flows extend west from Ebeko and SE from the neighboring Nezametnyi cone. The eastern part of the southern crater contains strong solfataras and a large boiling spring. The central crater is filled by a lake about 20 m deep whose shores are lined with steaming solfataras; the northern crater lies across a narrow, low barrier from the central crater and contains a small, cold crescentic lake. Historical activity, recorded since the late-18th century, has been restricted to small-to-moderate explosive eruptions from the summit craters. Intense fumarolic activity occurs in the summit craters, on the outer flanks of the cone, and in lateral explosion craters.
Information Contacts: Kamchatka Volcanic Eruptions Response Team (KVERT), Far Eastern Branch, Russian Academy of Sciences, 9 Piip Blvd., Petropavlovsk-Kamchatsky, 683006, Russia (URL: http://www.kscnet.ru/ivs/kvert/).
Search Bulletin Archive by Publication Date
Select a month and year from the drop-downs and click "Show Issue" to have that issue displayed in this tab.
The default month and year is the latest issue available.
Bulletin of the Global Volcanism Network - Volume 36, Number 03 (March 2011)
Managing Editor: Richard Wunderman
Barren Island (India)
Lava takes new path to shore by 30 March 2009; ongoing (2011) thermal alerts
Bulusan (Philippines)
Earthquakes and explosions during 6 November 2010-early March 2011
Colima (Mexico)
Dome growth continues in 2010-2011; eroding, ~55-m-long lobe
Dukono (Indonesia)
Intermittent weak ash plumes persist through 4 April 2011
Lunayyir, Harrat (Saudi Arabia)
2009 seismic swarm, deformation, and 8 km surface rupture
Sinabung (Indonesia)
Decreased activity following August-September 2010 eruption
Tengger Caldera (Indonesia)
Ongoing emissions, 2004-2011
Ulawun (Papua New Guinea)
Modest eruptions included ash plumes to 4 km through February 2011
Barren Island (India) — March 2011 Cite this Report
Barren Island
India
12.278°N, 93.858°E; summit elev. 354 m
All times are local (unless otherwise noted)
Lava takes new path to shore by 30 March 2009; ongoing (2011) thermal alerts
Sheth and others (2009) and reports of the Geological Survey of India (e.g., GSI, 2009) present many new field observations about Barren Island's volcanism, particularly during the years 2005-2009. Although historically lava had flowed out of the caldera towards the W, Sheth and others (2009) noted that by 30 March 2009 a new channelized 'a'a lava flow had overtaken the N caldera wall. The escaping lava had arrived at the sea along the island's NNW coast and began to form a delta there.
Barren Island is a young and growing mafic, island-arc volcano in the Andaman Sea (figure 15). It produced its first historically recorded eruption in 1787 and a series of eruptions followed in later years, including pulsating activity in the past few decades. Our last report on Barren Island (BGVN 35:01) reported occasional ash plumes and decreasing thermal alerts through January 2010. When searched in mid-April 2011, the Darwin Volcanic Ash Advisory Center reported on Barren Island plumes as late as April 2010, with an unconfirmed pilot report in July 2010. A search of MODVOLC-based satellite thermal alerts found they extended through 2010 and into 2011.
2009 visit. At the end of their paper, Sheth and others (2009) inserted a 'note added in proof' describing an ongoing eruption witnessed first hand on 30 March 2009. We present that note here (with minor omissions, and broken into several paragraphs).
"We would like to report a confirmed, ongoing, lava eruption on Barren Island. The first four authors of this paper and Neeraj Awasthi visited Barren Island yet again, on 30th March 2009, on board the Indian Coast Guard vessel the ICGS Bhikaiji Cama (Captain: Commandant M. Bhatia). The volcano's central cinder cone was continuously emitting dark ash clouds every few seconds from its central crater (reminiscent of the activity in 2007 . . .), and these clouds were expanding and getting deflected towards the S. The pre-existing valley between the cinder cone and the northern caldera wall has been filled up by deposition of new ash in the past year, which has enabled the new, active lava flow to completely abandon the westerly route (taken by all historic and recent lava flows) and to reach the sea over the northern caldera wall.
"This [active] lava flow is not ensuing from the summit crater, but apparently from an intermediate elevation on the cinder cone, though details were hard to distinguish given the distance of the ship from the island. The new, channelized lava flow is currently descending at a steep angle over the northern caldera wall's outer cliff face, and into the sea. Incandescent lava is seen at a few places in it, particularly in the dark. A sizeable steam plume is currently rising from the sea where this new lava flow is entering the sea. The new lava flow has built a structure resembling an alluvial fan along the shore.
"We were able to reach this fan by using a Gemini (inflatable rubber boat) from the ship, carefully circumventing the steam plume and through seawater which was very hot (an estimated ~60-70°C). We could also collect lava samples from the southern edge of this "fan", which are typical clinkery as basalt in hand specimen. A full account of this eruption with photographs and petrological study of the rock will be attempted separately. An interesting possibility is that, were this activity to continue, the new embryonic lava delta will grow thicker and laterally, and merge with the existing lava delta on the western side of the volcano.... In summary, Barren Island is evidently a very active volcano, meriting close study."
References. GSI, 2009, The Barren Island Volcano, Explosive Strombolian type eruption observed during January 2009; Geological Survey of India — Kolkata; Jan 2009 URL: http://www.portal.gsi.gov.in/gsiImages/information/N_BarrenJan09Note.pdf).
Sheth, HC, Ray, JS, Bhutani, R, Kumar, A, and Smitha, RS, 2009, Volcanology and Eruptive Styles of Barren Island: An Active Mafic Stratovolcano in the Andaman Sea, NE Indian Ocean, Bull Volcanol (Apr 2009) 71:1021-1039, DOI: 10.1007/s00445-009-0280-z.
Geologic Background. Barren Island, a possession of India in the Andaman Sea about 135 km NE of Port Blair in the Andaman Islands, is the only historically active volcano along the N-S volcanic arc extending between Sumatra and Burma (Myanmar). It is the emergent summit of a volcano that rises from a depth of about 2250 m. The small, uninhabited 3-km-wide island contains a roughly 2-km-wide caldera with walls 250-350 m high. The caldera, which is open to the sea on the west, was created during a major explosive eruption in the late Pleistocene that produced pyroclastic-flow and -surge deposits. Historical eruptions have changed the morphology of the pyroclastic cone in the center of the caldera, and lava flows that fill much of the caldera floor have reached the sea along the western coast.
Information Contacts: Darwin Volcanic Ash Advisory Centre (VAAC), Bureau of Meteorology, Northern Territory Regional Office, PO Box 40050, Casuarina, NT 0811, Australia (URL: http://www.bom.gov.au/info/vaac/); Hawai'i Institute of Geophysics and Planetology (HIGP) MODVOLC Thermal Alerts System, School of Ocean and Earth Science and Technology (SOEST), Univ. of Hawai'i, 2525 Correa Road, Honolulu, HI 96822, USA (URL: http://modis.higp.hawaii.edu/).
Bulusan (Philippines) — March 2011 Cite this Report
Bulusan
Philippines
12.769°N, 124.056°E; summit elev. 1535 m
All times are local (unless otherwise noted)
Earthquakes and explosions during 6 November 2010-early March 2011
The current report describes activity at Bulusan during 2008 through early March 2011, an interval punctuated by seismic signals indicative of explosions and occasional cases where ash fell up to 70 km away. During 2007, there were explosions, ash and steam plumes, and some ground inflation (BGVN 33:02).
Quiet during 2008 through October 2010. According to the Philippine Institute of Volcanology and Seismology (PHIVOLCS), seismic events were infrequent after the middle of 2008 through 2009. In addition, ground deformation surveys in 2009 showed deflation of the volcanic edifice. These observations were indicative of a decline in the overall activity of the volcano. Thus, the Alert Level was lowered from 1 to 0 (out of 5) on 15 May 2009. Maps appear below (figures 8 and 9).
Quiet ends in November 2010. A volcanic, explosion-type earthquake occurred on 6 November 2010 coincident with a steam-and-ash plume that rose 600 m above the crater. Trace amounts of ashfall were reported in multiple areas 6-10 km NW. The Alert Level was raised from 0 to 1, and PHIVOLCS reminded the public not to enter the permanent danger zone, defined as a 4-km radius around the volcano.
After 6 November and during late 2010 to early 2011, Bullusan experienced a number of earthquakes (table 5), and steam was often observed rising from the crater and known thermal vents, especially after an explosion. However, cloud cover frequently obscured the summit area. The Tokyo Volcanic Ash Advisory Center (VAAC) occasionally reported the presence of ash plumes (table 6).
Table 5. Earthquakes at Bulusan recorded by the seismic network between 1 November 2010-8 March 2011. Based on reports from PHIVOLCS.
| Date |
Number of earthquakes |
Type of earthquake |
| 06 Nov 2010 |
1 |
Explosion-type |
| 10-11 Nov 2010 |
18 |
Volcanic-tectonic |
| 12 Nov 2010 |
4 |
Volcanic-tectonic |
| 21 Nov 2010 |
1 |
Explosion-type |
| 26 Nov 2010 |
1 |
Explosion-type |
| 01-06 Dec 2010 |
Detected |
Volcanic |
| 08-12 Dec 2010 |
40544 |
Volcanic |
| 13 Dec 2010 |
7 |
Volcanic |
| 23 Dec 2010 |
1 |
Explosion-type |
| 30-31 Dec 2010 |
8 |
Volcanic-tectonic |
| 04-10 Jan 2011 |
2-8 daily |
Volcanic |
| 11-17 Jan 2011 |
Up to 2 daily |
Volcanic |
| 18-19 Jan 2011 |
11 |
Volcanic |
| 20-27 Jan 2011 |
Up to 5 daily |
Volcanic |
| 29-30 Jan |
Up to 5 daily |
Volcanic |
| 17-20 Feb 2011 |
Up to 3 daily |
Volcanic |
| 21-22 Feb 2011 |
16 |
Volcanic |
| 24 Feb-01 Mar 2011 |
Up to 5 daily |
Volcanic |
| 02-08 Mar 2011 |
Up to 4 daily |
Volcanic |
Table 6. Volcanic ash emissions from Bulusan during 6 November 2010-26 March 2011. Based on reports from the Tokyo VAAC. The line indicated by "x" refers to an ash plume that was reported to authorities but not identifiable on imagery.
| Date |
Altitude (km) |
Plume direction |
| 06 Nov 2010 |
2.4 |
SW |
| 08 Nov 2010 |
2.4 |
-- |
| 09 Nov 2010 |
2.7 |
SW |
| 12 Nov 2010 |
2.4 |
-- |
| 21 Nov 2010 |
3.7 |
SW |
| 24 Nov 2010 |
2.7 |
SW |
| 25 Nov 2010 |
2.1 |
-- |
| 16 Dec 2010 |
2.1 |
SW |
| 23 Dec 2010 |
2.1 |
S |
| 24 Dec 2010 |
2.1 |
SW |
| 29 Dec 2010 |
x |
-- |
| 30 Dec 2010 |
x |
-- |
| 05 Jan 2011 |
x |
-- |
| 06 Jan 2011 |
x |
-- |
| 07 Jan 2011 |
x |
-- |
| 14 Jan 2011 |
x |
-- |
| 04 Feb 2011 |
x |
-- |
| 21 Feb< 2011/td>3.7 -4.9W |
| 22 Feb 2011 |
x |
-- |
| 24 Feb |
x |
-- |
| 26 Feb 2011 |
x |
-- |
| 27 Feb 2011 |
x |
-- |
| 28 Feb 2011 |
x |
-- |
| 03 Mar 2011 |
x |
-- |
| 04 Mar 2011 |
x |
-- |
| 18 Mar 2011 |
x |
-- |
| 20 Mar 2011 |
x |
-- |
| 25 Mar 2011 |
x |
-- |
| 26 Mar 2011 |
x |
-- |
On 7 November, PHIVOLCS noted that seismic activity had increased during the previous 24 hours. A phreatic explosion on 8 November produced a brownish-to-light-gray plume that rose 700 m above the crater. Several neighborhoods to the NW, W, and WSW reported ashfall. Steam rose from the crater after the explosion. On 9 November two consecutive ash explosions, accompanied by rumbling sounds, produced ash plumes that rose as high as 1 km above the crater and drifted SW. Ashfall up to 2 mm thick was reported in areas to the SW and WNW.
On 11 November 2010, white steam plumes rose 150 m above the crater and drifted ENE. An aerial survey noted that recent explosions resulted in the joining of two of the 2006-2007 craters into one. PHIVOLCS scientists also found that deposits from an explosion on 9 November did not contain juvenile material. On 12 November an ash explosion produced an ash-and-steam plume that rose 700 m above the crater and drifted SW. Multiple neighborhoods to the W and SW reported light ashfall. During 12-14 November, some steaming from the crater was observed. An explosion late at night on 15 November was followed by ashfall in nearby neighborhoods.
An explosion earthquake on 21 November 2010 was coincident with rumbling sounds and an ash plume that rose 2 km above the crater. Ashfall up to 3 mm thick was reported in multiple areas. According to news reports (Philippine Daily Inquirer), about 500 families evacuated and some local roads were impassable.
On 24 November 2010, PHIVOLCS reported that an explosion, recorded for almost six minutes by seismographs, produced an ash plume that rose 1 km above the crater, drifted SW, and dissipated. Ashfall was not observed outside of the permanent danger zone, defined as a 4-km radius from the summit, suggesting that ashfall was confined to the upper flanks. On 26 November, an explosion-type earthquake was recorded.
On 17 December 2010, PHIVOLCS reported that an explosion, recorded for about 3 minutes by seismographs, produced an ash-and-steam plume that rose 500 m above the crater and drifted SW. Another explosion on 23 December followed tremor that lasted for almost 31 minutes. A grayish steam-and-ash plume rose to about 500 m above the crater rim and drifted S-SW.
Seismic activity continued into 2011 with volcanic earthquakes, frequent steam emissions, and an occasional explosion. Tokyo VAAC reported ash plumes from Bulusan, although cloud cover frequently obscured the summit area.
An explosion on 18 January 2011 was accompanied by a rumbling sound audible in Monbon, a barangay (neighborhood) in the municipality of Irosin, 6 km to the SW. Trace amounts of ashfall were observed in Monbon. A deformation survey conducted during 25-29 January showed slight deflation relative to a December 2010 survey.
An explosion on 21 February 2011 produced a gray ash plume that rose ~3 km above the crater and drifted SW. Rumbling sounds were heard up to 10 km away in the town of Juban (NW). The event was recorded by the seismic network as an explosion-type earthquake lasting for about 19 minutes. Field investigations confirmed ash deposits in the towns of Irosin (up to 5 mm) 8 km SSW, and Bulan (up to 3 mm) 22 km SW. Traces of ashfall were also reported in the municipalities of Juban and Magallanes (24 km WNW), and in Masbate City, Masbate (70 km SW). According to news articles (Xinhua), about 2,000 people evacuated.
There were 13 lahar-related seismic signals detected during 27-28 February 2011. Continuous heavy rain caused small lahars on the flanks and in river channels, including the Cogon and Monbon rivers to the SW. A map showing the susceptible lahar areas appeared in BGVN 32:04.
Based on notices from the Manila airport and satellite image observations, the Tokyo VAAC reported that ash plumes were detected occasionally during and after the explosion of 6 November 2010.
Table 6 denotes the substantial ash plumes reported by the Tokyo Volcanic Ash Advisory Center (VAAC) through 26 March 2011.
During the reporting period, there were no thermal alerts derived from the Hawai'i Institute of Geophysics and Planetology Thermal Alerts System (MODVOLC).
Geologic Background. Luzon's southernmost volcano, Bulusan, was constructed along the rim of the 11-km-diameter dacitic-to-rhyolitic Irosin caldera, which was formed about 36,000 years ago. It lies at the SE end of the Bicol volcanic arc occupying the peninsula of the same name that forms the elongated SE tip of Luzon. A broad, flat moat is located below the topographically prominent SW rim of Irosin caldera; the NE rim is buried by the andesitic complex. Bulusan is flanked by several other large intracaldera lava domes and cones, including the prominent Mount Jormajan lava dome on the SW flank and Sharp Peak to the NE. The summit is unvegetated and contains a 300-m-wide, 50-m-deep crater. Three small craters are located on the SE flank. Many moderate explosive eruptions have been recorded since the mid-19th century.
Information Contacts: Philippine Institute of Volcanology and Seismology (PHIVOLCS), University of the Philippines Campus, Diliman, Quezon City, Philippines (URL: http://www.phivolcs.dost.gov.ph/); Southern Luzon Bureau; Tokyo Volcanic Ash Advisory Center (VAAC), Tokyo, Japan (URL: http://ds.data.jma.go.jp/svd/vaac/data/); Hawai'i Institute of Geophysics and Planetology (HIGP) MODVOLC Thermal Alerts System, School of Ocean and Earth Science and Technology (SOEST), Univ. of Hawai'i, 2525 Correa Road, Honolulu, HI 96822, USA (URL: http://modis.higp.hawaii.edu/); Philippine Daily Inquirer (URL: http://www.inquirer.net/); Xinhua (URL: http://www.xinhuanet.com/english2010/).
Colima
Mexico
19.514°N, 103.62°W; summit elev. 3850 m
All times are local (unless otherwise noted)
Dome growth continues in 2010-2011; eroding, ~55-m-long lobe
The Observatorio Vulcanologico de la Universidad de Colima (Colima Volcanological Observatory) reported that during 2010-2011, lava extrusion at Colima continued at the dome that was first recognized in February 2007. The slow growth of a small lobe of lava within the W sector of the crater of the volcano commenced during February 2010 (BGVN 35:05), and this process continued through March 2011. The rate of growth of this lobe was ~0.1 m3/s, and was accompanied by numerous rockfalls and small explosions (figures 97 and 98). Explosions often remained in the range of 3 to 15 per day during January 2009 through March 2011. As previously noted (BGVN 35:05), rockfalls suddenly became very common in February 2010. The rockfalls reached a maximum of over 60 per day, and through March 2011 they remained in the range of 15 to 42 per day (figure 97).
The active lobe's width was ~10-15 m; its length was ~50-60 m. Loss of material from the lobe's distal end generated frequent rockfalls. According to a report from the Observatory, " . . . extrusive activity of the volcano has changed from endogenic [i.e., intrusion within the dome], observed during 2007-2009, to exogenic [i.e., extrusion to the dome's surface or margin] with the development of the new lava lobe." Figure 99 illustrates this change in the eruptive process (endogenic in the upper frame, switching to exogenic).
Satellite image, January 2011. A natural-color satellite image of Colima was acquired 22 January 2011 (figure 100). The perspective of the image (straight down) flattens the appearance of the classic steep-sided stratovolcano, according to the image's NASA Earth Observatory analysts. Similarly, they noted that the image's relatively low resolution (10 m per pixel) falsely gives a smooth appearance to what are actually very rough-surfaced block lava flows.
The image in figure 100 shows evidence of four types of volcanic activity: lava dome growth, explosive eruptions, flank collapse, and lava flows. The active lava dome nearly fills Colima's summit crater. The top of the dome is higher than the crater rim, and material occasionally tumbles down the volcano's W and S slopes. A light colored plume, probably dust from rockfalls off the dome, extends to the E (right) of the summit. Colima's summit crater developed during a 1913 explosive eruption that removed 100 m off the summit.
To the N of Colima's summit is a rim ('flank-collapse rim') of a 5-km-wide caldera, formed about 4,300 years ago in a massive flank collapse, similar to the 18 May 1980 eruption of Mount St. Helens. Modern Colima volcano rises near the center of this caldera. Recent lava flows (erupted since 1961), cover the upper slopes of the volcano. Older lava flows (erupted in the 1800s and earlier) are covered in green vegetation.
MODVOLC. The MODVOLC satellite thermal alerts system showed thermal alerts of 4 pixels at 0845 UTC on 29 December 2010 and 2 pixels at 0520 UTC on 20 January 2011, confirming recent hot material at and near the dome. Press reports also noted incandescent lava flows. The alerts mentioned above were the only significant ones measured since 2005, when major explosions occurred (BGVN 30:06 and 31:03).
Geologic Background. The Colima complex is the most prominent volcanic center of the western Mexican Volcanic Belt. It consists of two southward-younging volcanoes, Nevado de Colima (the high point of the complex) on the north and the historically active Volcán de Colima at the south. A group of late-Pleistocene cinder cones is located on the floor of the Colima graben west and east of the complex. Volcán de Colima (also known as Volcán Fuego) is a youthful stratovolcano constructed within a 5-km-wide scarp, breached to the south, that has been the source of large debris avalanches. Major slope failures have occurred repeatedly from both the Nevado and Colima cones, producing thick debris-avalanche deposits on three sides of the complex. Frequent recorded eruptions date back to the 16th century. Occasional major explosive eruptions have destroyed the summit (most recently in 1913) and left a deep, steep-sided crater that was slowly refilled and then overtopped by lava dome growth.
Information Contacts: Observatorio Vulcanologico de la Universidad de Colima (Colima Volcanological Observatory), Calle Manuel Payno, 209 Colima, Col., 28045 Mexico (URL: http://www.ucol.mex/volc/); NASA Earth Observatory (URL: http://earthobservatory.nasa.gov/); Hawai'i Institute of Geophysics and Planetology (HIGP) MODVOLC Thermal Alerts System, School of Ocean and Earth Science and Technology (SOEST), Univ. of Hawai'i, 2525 Correa Road, Honolulu, HI 96822, USA (URL: http://modis.higp.hawaii.edu/).
Dukono
Indonesia
1.6992°N, 127.8783°E; summit elev. 1273 m
All times are local (unless otherwise noted)
Intermittent weak ash plumes persist through 4 April 2011
Dukono has generated intermittent minor ash plumes since before July 2008 (BGVN 33:08, 33:11, 35:04). The Darwin Volcanic Ash Advisory Centre (VAAC) has provided satellite surveillance. Table 11 extends the table of ash plumes presented in BGVN 35:04 through 4 April 2011.
Table 11. Ash plumes reported from Dukono between 30 May 2010 and 4 April 2011, based on data from the Darwin Volcanic Ash Advisory Centre. Each date or date range represents at least one plume.
| Date (UTC) |
Plume Altitude |
Plume Direction |
Plume Distance |
| 02 Jun 2010 |
2.4 km |
NW |
110 km |
| 07 Jun 2010 |
3 km |
W |
110 km |
| 09-10 Jun 2010 |
-- |
W |
130 km |
| 18-20 Jun 2010 |
2.4 km |
W |
120 km |
| 23-24 Jun 2010 |
2.4 km |
W |
120-225 km |
| 29 Jun 2010 |
2.4 km |
W |
120-225 km |
| 30 Jun-02 Jul 2010 |
2.4 km |
W, NW |
90-225 km |
| 06 Jul 2010 |
2.4 km |
W, NW |
90-225 km |
| 07 Jul 2010 |
2.4 km |
N, NW |
35-75 km |
| 09-10 Jul 2010 |
2.4 km |
N, NW |
35-75 km |
| 24 Jul 2010 |
3 km |
W |
110 km |
| 31 Jul 2010 |
3 km |
W |
90 km |
| 03 Aug 2010 |
3 km |
NNE |
130 km |
| 12-22 Aug 2010 |
3 km |
W, NW, SW |
25-225 km |
| 25-29 Aug 2010 |
2.1-3 km |
W, NE |
35-110 km |
| 01-02 Sep 2010 |
2.4 km |
W, NW |
95 km |
| 06-11 Sep 2010 |
2.4 |
W, NW, SW |
35-95 km |
| 14-18 Sep 2010 |
2.4 km |
W, NW, SW |
35-260 km |
| 20-25 Sep 2010 |
2.4 km |
W, NW |
35-260 km |
| 01-04 Oct 2010 |
2.4 km |
W, NW |
55-205 km |
| 06-07 Oct 2010 |
2.4 km |
W |
75-110 km |
| 01-02 Nov 2010 |
3 km |
NW, SW |
45-75 km |
| 23-27 Nov 2010 |
2.4 km |
W |
75-130 km |
| 03-05 Dec 2010 |
3 km |
W |
55-110 km |
| 21 Dec 2010 |
2.7 km |
NW |
55 km |
| 05-07 Jan 2011 |
2.4-3.7 km |
W |
65-130 km |
| 11 Feb 2011 |
2.4 km |
N |
75 km |
| 16-17 Feb 2011 |
3 km |
W, SW |
150-185 km |
| 11-12 Mar 2011 |
2.1 km |
SW |
110-165 km |
| 18-19 Mar 2011 |
2.1 km |
N, NW, NE |
37-75 km |
| 04 Apr 2011 |
2.4 km |
E |
185 km |
During the reporting period (1 June 2010- 4 April 2011), there were four thermal alerts derived from the Hawai'i Institute of Geophysics and Planetology Thermal Alerts System (MODVOLC). They were on 1 and 10 September and 6 and 20 November 2010.
Arnold Binas uploaded photos and video showing Dukono ongoing ash emissions during late January 2010 (Binas, 2010, 2011). The video takes the form of an excursion from an adjacent settlement, approach to the volcano, and finally some shots taken at the crater rim. In addition, he posted several still photos of Dukono on Flickr (Binas, 2010). The photo titled "Inside the Dukono crater" noted frequent pulses of ash rising from the crater and his 6 hours on the crater rim led to only one partial view into the crater interior.
References. Binas, A., 2011, Halmahera ? Dukono Volcano 2010, YouTube (URL: http://www.youtube.com/watch?v=NqMax2hqxMo).
Binas, A., 2010, Indonesian volcanoes 2010, hshdude photostream, Flickr (URL: http://www.flickr.com/photos/hshdude/sets/72157623718033396).
Geologic Background. The Dukono complex in northern Halmahera is on an edifice with a broad, low profile containing multiple peaks and overlapping craters. Almost continuous explosive eruptions, sometimes accompanied by lava flows, have occurred since 1933. During a major eruption in 1550 CE, a lava flow filled in the strait between Halmahera and the Gunung Mamuya cone, 10 km NE. Malupang Wariang, 1 km SW of the summit crater complex, contains a 700 x 570 m crater that has also had reported eruptions.
Information Contacts: Darwin Volcanic Ash Advisory Centre (VAAC), Bureau of Meteorology, Northern Territory Regional Office, PO Box 40050, Casuarina, NT 0811, Australia (URL: http://www.bom.gov.au/info/vaac/); Hawai'i Institute of Geophysics and Planetology (HIGP) MODVOLC Thermal Alerts System, School of Ocean and Earth Science and Technology (SOEST), Univ. of Hawai'i, 2525 Correa Road, Honolulu, HI 96822, USA (URL: http://modis.higp.hawaii.edu/); Arnold Binas (aka, hshdude), Australia.
Harrat Lunayyir (Saudi Arabia) — March 2011 Cite this Report
Harrat Lunayyir
Saudi Arabia
25.17°N, 37.75°E; summit elev. 1370 m
All times are local (unless otherwise noted)
2009 seismic swarm, deformation, and 8 km surface rupture
An intense seismic swarm coupled with surface deformation spurred the evacuation of over 30,000 residents, led to an 8 km long surface rupture, and was consistent with the injection of a shallow dike that never reached the surface. Between April and June 2009 more than 30,000 earthquakes occurred beneath one of the lava fields of Saudi Arabia adjacent the N-central portion of the Red Sea and centered inland ~50 km ENE from the port city of Umm Lajj (figure 1). The field is known as Harrat Lunayyir (the words harrat and haarrat indicate a volcanic field, named and unnamed, respectively). Ultimately a narrow, 8 km long surface rupture developed and the seismicity declined. The event was interpreted as due to a shallow intrusion that did not reach the surface. Table 1 at the end of this report gives an overview of the crisis, which included evacuations.
This report is based on Pallister and others (2010) as well as a report from scientists from the USGS-USAID Volcano Disaster Assistance Program (VDAP) and the Saudi Geological Survey (SGS). The government of Saudi Arabia evacuated more than 30,000 people from the town of Al Ays on the SE margin of the volcanic field, due to fears that further larger earthquakes could occur or that there could be a volcanic eruption (figures 2 and 3). In response to this situation, SGS increased their presence in the region and installed a permanent telemetered seismic network of seven broadband seismometers in the area to better monitor the seismicity.
A punctuated earthquake swarm began at Harrat Lunayyir in April 2009, with a peak on 19 May when 19 earthquakes of M 4 or greater occurred. The largest of those earthquakes was variably assessed as M 5.4 (SGS) and M 5.7 (USGS National Earthquake Information Center). It struck at 1735 UTC (2035 local time). The earthquake caused minor damage to structures in the town of Al Ays (40 km SE of the epicenter).
Surface rupture. In the northern central part of the lava field the initial surface rupture extended 3 km, trended NW, and appeared during the week preceding 19 May (when maximum earthquake magnitudes exceeded M 4). Associated with the M 5.4 earthquake on 19 May, the rupture lengthened to 8 km. The rupture had local vertical offsets of more than 1 meter and was several meters deep (figures 4 and 5). Event rates decreased dramatically on 20 May and maintained a relatively constant level, except for a few increases in event rate lasting 24 hours.
Combining seismic with InSAR and modeling. Results from InSAR data and geodetic modeling were consistent with the timing of the seismic swarm. InSAR data showed that 75% of the deformation occurred during 8-27 May 2009, and 20% occurred during 27 May to 17 June (figure 6). Interferograms from May and June showed a broad area of deformation of about 2,000 km2, which is indicative of dyke intrusion. Envisat interferograms showed about 40 cm of uplift and over 1 m of E-W extension.
Earthquakes suggestive of volcanism. Initially, scientists were unsure if the earthquakes were tectonic or volcanic in origin. On 12 June two members of a VDAP team deployed to Saudia Arabia at the request of the SGS to provide technical assistance. The VDAP and SGS teams determined that the earthquake pattern was that of a volcanic earthquake swarm. It was characterized by several ten's of thousands of small (under M 3) earthquakes during 24 April-31 July 2009, in a pattern of seismicity that waxed and waned. Earthquakes occurred of both varying magnitude and lacking tectonic mainshock-aftershock sequences. RSAM (real-time seismic-amplitude measurement) data showed that energy increased dramatically on 29 April, peaking on 19 May with the previously mentioned largest (M 5.4) event.
Other common volcanic-swarm characteristics included a high rate of occurrence of small compared to large events, and shallow event locations clustered beneath the lava field at around 5-10 km in depth. The event types included those of high-frequency (13-28 Hz), very low-frequency (less than 1 Hz), and high-frequency tremor. The latter contained embedded spasmodic bursts of high-frequency earthquakes (13-28 Hz).
An unusual aspect of the swarm was that both low- and very low-frequency earthquakes occurred, events that are usually associated with movements of fluids (magma, water or gas) and Strombolian explosions, but in this case both gas emissions and explosions were absent.
The VDAP and SGS teams concluded that there were three key lines of evidence that the earthquakes were volcanic. First, the earthquakes were occurring in a volcanically active area. Second, deformation was measured and interpreted to indicate a shallow dyke intrusion. Third, the types of earthquakes that occurred were characteristic of volcano-related seismicity.
The volcanic risk was relatively low due to the small population living near Harrat Lunayyir. On 19 June the team made a forecast that there was a moderate probability of a basaltic eruption and a low probability of additional large earthquakes of M 5 or greater occurring within the following 2 months. The forecast was based on the maximum magnitudes of earthquakes that typically accompany eruptions at other volcanoes, on the proportion of eruptions following multiple intrusions at dozens of volcanoes studied by VDAP, and on initial models of the InSAR anomaly. The team determined that the seismic swarm had ended by August 2009 when there was a decline in seismic activity and InSAR-detected deformation. After the forecast and after the buildings in Al Ays had been assessed for damage, evacuees were permitted to return to their homes.
Table 1. Chronology summarizing the 2009 Lunayyir earthquake swarm, surface rupture, and hazards response.
| Date |
Observations and actions taken |
| Apr 2009 |
Earthquakes began |
| ~20 Apr 2009 |
Evacuation started at Al Ays |
| 29 Apr 2009 |
Earthquake energy increased |
| ~12-19 May 2009 |
3-km-long surface rupture opened |
| 19 May 2009 |
M 5.4-5.7 earthquake; surface rupture grew to 8 km long |
| 20 May 2009 |
Earthquake energy decreased dramatically |
| Aug 2009 |
Earthquakes ceased |
| Aug 2009 |
Evacuees returned to Al Ays |
References. Pallister, J.S., McCausland, W.A., Jonsson, S., Lu, Z., Zahran, H.M., Hadidy, S.E., Aburukbah, A., Stewart, I.C.F., Lundgren, P.R., White, R.A., and Moufti, M.R.H., 2010, Broad Accommodation of Rift-Related Extension Recorded by Dyke Intrusion in Saudi Arabia. Nature Geoscience, 26 September 2010, pp. 1-8.
SGS, 2011, Volcanism in Saudi Arabia, Saudi Geological Survey (SGS) (URL: http://www.sgs.org.sa/English/NaturalHazards/Pages/Volcanoes.aspx).
Geologic Background. Harrat Lunayyir is a basaltic volcanic field in NW Saudi Arabia, east of the Red Sea port of Umm Lajj. It contains about 50 volcanic cones that were constructed over Precambrian crystalline rocks along a N-S axis. Harrat Lunayyir is one of the smallest of the Holocene lava fields of Saudi Arabia, but individual flow lobes radiate long distances from the center of the Harrat, and flows reached the Red Sea in two places. Lava flows are basaltic to basanitic in composition, and the Holocene flows are alkali olivine basalts. One of the cones may have erupted around the 10th century CE or earlier. A seismic swarm in May 2009 was interpreted to be consistent with intrusion of an 8-km-long dike to shallow crustal levels.
Information Contacts: John Pallister, US Geological Survey-USAID Volcano Disaster Assistance Program, 1300 SE Cardinal Court, Building 10, Suite 100, Vancouver, WA 98683-9589, USA (URL: http://volcanoes.usgs.gov/vdap/); Hani M. Zahran, National Centre for Earthquakes and Volcanoes, Saudi Geological Survey (SGS), P.O. Box: 54141, Jeddah, 21514 Saudi Arabia (URL: http://www.sgs.org.sa/English/NaturalHazards/Pages/Earthquakes.aspx).
Sinabung (Indonesia) — March 2011 Cite this Report
Sinabung
Indonesia
3.17°N, 98.392°E; summit elev. 2460 m
All times are local (unless otherwise noted)
Decreased activity following August-September 2010 eruption
Sinabung, which sits 80 km NNW of Toba caldera, produced its first confirmed historical eruption in August 2010 (BGVN 35:07). We present clarifications on our previous report, some seismic data from the interval 2-4 September 2010 that included large local tectonic earthquakes, episodes of continuous volcanic tremor, and the return of calm after mid-September 2010.
Clarifications. Kus Hendratno (of the Center of Volcanology and Geological Hazard Mitigation, CVGHM) provided additional information about the first figure in our last Sinabung report (BGVN 35:07), which we had captioned as undated. The upper photo, taken from the SW, showed the second eruption on 3 September (in the evening) and shows a plume he considered to be deflected down the E flank by strong winds blowing down-slope. The lower photo was taken on 30 August from the NE. Hedratno did not know the date that the eruption ended. In addition, we described the 27 August 2010 eruption as the "first Holocene eruption" in BGVN 35:07. There was an unconfirmed historical eruption in 1881, and there may yet emerge evidence for other Holocene eruptions. Thus, we now prefer to refer to the 27 August eruption as the first confirmed historical eruption.
Additional information about 2-4 September 2010 activity. Table 2 presents some basic data on 2 to 4 September seismicity. These data are but a portion of a 4 September report by Agus Budianto (head of a geophysical team that responded to the crisis). The seismic data reflect both the presence of volcanic earthquakes, earthquakes interpreted as associated with emissions, far tectonic earthquakes, and tremor. The latter continued in all but one 6-hour time slot on the table, and in two cases, 1800-2400 on the 3rd and 0000-0600 on the 4th, tremor reached dominant amplitudes of 50 mm.
Table 2. Details about seismicity observed at Sinabung during 2-4 September 2010. Terminology as follows: "12@3-63 mm" refers to 12 earthquakes with amplitudes of 3-63 mm; "5-15 s," to duration times. Courtesy of Agus Budianto (affiliation listed in Information contacts).
| Date |
Time |
Volcanic earthquakes |
Shallow volcanic earthquakes |
Emission earthquake |
Tremor amplitudes |
| 02 Sep 2010 |
0000-0600 |
12 at 3-63 mm; 5-15 s; S & P 0.5-4 s |
7 at 3.5-10 mm; 3.5-6 s |
2 at 2-6 mm; 48-53 s |
-- |
| 02 Sep 2010 |
0600-1200 |
12 at 6-44 mm; 4.5-16 s; S&P 1-4 s |
-- |
6 at 2-4 mm; 5-11 s |
Continous (3 mm) |
| 02 Sep 2010 |
1200-1800 |
5 at 9-75 mm; 5-11 s; S&P, 0.5-4s |
-- |
-- |
Continous (3 mm) |
| 02 Sep 2010 |
1800-2400 |
-- |
-- |
-- |
Continous |
| |
| 03 Sep 2010 |
0000-0600 |
-- |
-- |
-- |
Continous |
| 03 Sep 2010 |
0600-1200 |
-- |
-- |
-- |
Continous |
| 03 Sep 2010 |
1200-1800 |
-- |
-- |
-- |
Continous |
| 03 Sep 2010 |
1800-2400 |
21 at 10-30 mm; 10-30 s; S&P 0.5-1.5 s |
-- |
-- |
Continous |
| |
| 04 Sep 2010 |
0000-0600 |
2 at 21.5-25 mm;14-15 s; S&P 2.5-3 |
1 at 18.5 mm; 5 s |
-- |
Continous |
| 04 Sep 2010 |
0600- 1200 |
6 at 9-100 mm; 10-32.5 s; S&P 1.5-2 |
4 at 2.5 mm; 7.5-9.5 s |
-- |
Continous (7 mm) |
| 04 Sep 2010 |
1200-1800 |
1 at 50mm; 17 s;S&P 1.5s |
-- |
-- |
Continous (8 mm) |
During 2-4 September, fog often obscured the view. An eruption at 0438 on 3 September was accompanied by a roaring sounds and vibrations that were felt up to 8 km SE. A thick black plume erupted up to 3 km above the crater and drifted E. An eruption on the same day during the hours 1759 to 1801 also caused a roaring sound and weak vibrations that were felt up to 8 km away. Visual observations showed several periods of the eruption; early in the eruption, a black plume soared as high as 1 km above the crater and drifted E. Then, a plume that appeared "clotted" moved approximately 2 km down the E slopes, with most of the ash falling on the E slope. Finally, a plume rose vertically and took the shape of a mushroom. Electronic distance measurements after the eruption at 1759 on 3 September 2010 showed deflation (up to 4.5 mm). On 4 September, the weather was clear, and a thick white plume was visible reaching up to 50 m above the crater and drifting as far as 100 m down the E slope.
Activity during mid- to late-September 2010. CVGHM reported a few noteworthy eruptions, emissions, and changes occurred after early September. During 8-11 September observers saw white-to-gray plumes rising 30-100 m above the crater and generally drifting E. Deformation measurements during 8-14 September showed a slow rate of inflation. Based on analyses of satellite imagery and the CVGHM web camera, the Darwin VAAC reported that on 12 and 14 September ash plumes rose to altitudes of 4.3-4.6 km altitude.
During 15 September-21 September 2010, based on information from CVGHM and views through a web camera, the Darwin VAAC reported ash plumes rising to an altitude of 4.3 km and drifting W. CVGHM reported a slow rate of inflation during 15-18 September followed by deflation during 19-21 September. Fog mostly prevented visual observations. On 20 September diffuse white plumes rose 30 m above the crater and drifted NE.
On 22 September a white plume rose as high as 100 m above the crater. The decrease in activity based on visual observations, seismicity, deformation, and SO2 concentration prompted CVGHM to lower the Alert Level to 3 (on a scale of 1-4) on 23 September, where it remained through at least mid-March 2011.
Geologic Background. Gunung Sinabung is a Pleistocene-to-Holocene stratovolcano with many lava flows on its flanks. The migration of summit vents along a N-S line gives the summit crater complex an elongated form. The youngest crater of this conical andesitic-to-dacitic edifice is at the southern end of the four overlapping summit craters. The youngest deposit is a SE-flank pyroclastic flow 14C dated by Hendrasto et al. (2012) at 740-880 CE. An unconfirmed eruption was noted in 1881, and solfataric activity was seen at the summit and upper flanks in 1912. No confirmed historical eruptions were recorded prior to explosive eruptions during August-September 2010 that produced ash plumes to 5 km above the summit.
Information Contacts: Kus Hendratno, Center of Volcanology and Geological Hazard Mitigation (CVGHM), Jalan Diponegoro 57, Bandung 40122, Indonesia (URL: http://vsi.esdm.go.id/); Camera URL: http://merapi.bgl.esdm.go.id/aktivitas_merapi.php?page=aktivitas-merapi&subpage=kamera-g-sinabung); Agus Budianto, Kementerian Energi Dan Sumber Daya Mineral, Republik Indonesia, Badan Geologi, Jalan Diponegoro No. 57 Bandung 40122 Indonesia.
Tengger Caldera (Indonesia) — March 2011 Cite this Report
Tengger Caldera
Indonesia
7.942°S, 112.95°E; summit elev. 2329 m
All times are local (unless otherwise noted)
Ongoing emissions, 2004-2011
Tengger Caldera contains the frequently erupting Bromo cone, which has repeatedly erupted since about the year 1590. Under normal conditions, Bromo emits a white, sparse-to- dense vapor reaching heights of 75-150 m above the rim, with an acrid smell of sulphur. Our last report noted the eruption on 8 June 2004 (BGVN 29:07); small plumes and seismic signals suggestive of emissions continued through the previous reporting interval, which ended 18 July 2004. According to a December 2010 report from the Center of Volcanology and Geological Hazard Mitigation (CVGHM), during 1994, 1996, 2000, and 2004, Bromo's eruptions ejected glowing lava that fell in the vicinity of the crater. The countryside around Bromo is not densely populated, since it lies within the Bromo-Tengger-Semeru National Park, but the volcano is a popular tourist destination.
On 16 August 2004, due to a decrease in seismic and volcanic activity at Tengger, the Center of Volcanology and Geological Hazard Mitigation (CVGHM) decreased the Alert Level from 2 to 1 (on a scale of 1-4).
The next report we received on Tengger was from the Darwin Volcanic Ash Advisory Center (VAAC), which noted that a small plume was visible on a satellite image on 14 July 2006. No ash was detected.
On 1 September 2006, CVGHM raised the Alert Level for Tengger to 2 due to heightened activity and a strong smell of sulfur. On 9 September, the Alert Level was raised to 3 due to an increase in tremor, but lowered to 2 on 18 September due to decreased activity.
According to CVGHM, during 18-25 June 2007, diffuse but ash-free plumes rose to an altitude of 2.4 km. Nineteen tectonic earthquakes, one local-tectonic earthquake, and continuous tremor with a maximum amplitude of 0.5-1 mm was noted between 11 June-1 July 2007.
No further reports were received until November 2010, when seismicity increased. Volcanic tremor was first detected on 8 November. According to volcanologist and photographer Richard Roscoe (Photovolcanica), tremor became almost continuous by 22 November along with degassing. CVGHM noted that the heights of gas-and-steam plumes increased during the month, from 75 m above the crater during 1-7 November to 100-250 m above the crater during 8-23 November. The Alert Level was raised to 3 on 23 November. Residents and tourists were not permitted within a 3-km-radius of the active crater. Later that night, seismic activity increased, and a white-to-gray plume rose 200-300 m above the crater. The Alert Level was raised to 4. The tourist areas surrounding the volcano was closed.
Bromo erupted on 26 November 2010, triggering the first significant ash emission, according to Richard Roscoe. He noted that the output of ash was high at several stages during the eruption, which led to significant damage to vegetation in downwind areas. According to the Darwin VAAC, on that day the cloud tops reached 13.7 km and volcanic ash was thought to be "entrained into deep convective clouds."
During 27-29 November satellite imagery showed ash plumes drifting 55-165 km at an altitude of 4.3 km. According to a news article (Agence France-Presse), Malang city's domestic airport, 25 km W, closed on 29 November due to ash. Cloud cover prevented observations during 29-30 November.
On 6 December, CVGHM reported that seismicity at Bromo had declined since 30 November, and deformation measurements showed deflation. White-to-gray plumes rose 200-300 m above the crater rim and drifted N. The Alert Level was lowered to 3. Residents and tourists were not permitted within a 2-km-radius of the active crater.
CVGHM reported that during 8-19 December gray-to-brown plumes from Bromo rose 400-800 m above the crater and drifted E, NE, and N. Tremors continued with a maximum amplitude of 17-32 mm. On 19 December, explosions produced an ash plume that rose 2 km above the crater rim. Ashfall was heavy around the crater and was reported in areas as far away as the Juanda Airport (70 km NNW) in Surabaya. The ash damaged agricultural land, affected trees and river valleys, and disrupted the transportation infrastructure. According to the Darwin VAAC, a possible ash plume from Bromo cone rose to an altitude of 6.1 km on 20 December and drifted about 95 km S.
CVGHM noted that between 19-23 December, tremor continued with a maximum amplitude of 5-30 mm, and 17 eruptive earthquakes occurred with a maximum amplitude of 40 mm and a duration of about 17 to167 seconds each. Tiltmeter deformation measurements showed slight inflation (5 microradians) from 25 November to 14 December; from 15 December through at least February 2011, both its radial and tangential components remained relatively stable. Similarly, measurements of deformation using EDM from 25 November to 20 December 2010 showed relative stability.
According to CVGHM, during 20-25 December, gray-to-brown plumes rose 800-1,200 m above the crater and drifted N and NE. Ejected material fell back around the crater. On 25 December, ash and occasional lapilli fell at the Bromo observation post, about 2 km away. The ashfall was about 20 cm thick. A news report (Reuters) indicated that some flights were cancelled on 20 December between Australia and Bali due to ash, but the emitting volcano was not identified. CVGHM noted that the ash had damaged agricultural land and trees on the slopes and in river valleys, and had paralyzed transportation in the Cemoro Lawang area. Heavy rain during this time raised concern for potential lahars and landslides.
During 24-25 December, tremor continued with a maximum amplitude of 15-40 mm. Two eruptive earthquakes were noted, with a maximum amplitude of 40 mm and a duration of 25 seconds.
The Darwin VAAC reported that during 26-27 December an ash plume rose to an altitude of 5.5 km and drifted 150 km NE. Another ash plume rose to an altitude of 4.3 km on 30 December and drifted about 95 km to the E.
CVGHM reported that during 22-23 January 2011, continuous tremor occurred (maximum amplitude 15-38 mm) and gray-to-brown plumes from Bromo rose 400-800 m above the crater and drifted E. Incandescent material was ejected 200 m above the crater and landed as far as 500 m away. The Darwin VAAC reported that on 24 January an ash plume rose to an altitude of 3.7 km and drifted more than 220 km E. The VAAC report noted that CVGHM had confirmed the eruption and observers had sensed elevated sulfur-dioxide gas in the area.
According to news reports (The West Australian, Sydney Morning Herald), ash plumes from Bromo disrupted flights between Australia (Perth, Sydney, Darwin) and Bali during 27-28 January. An ash plume on 28 January rose to an altitude of 5.5 km and drifted 370 km E and SE. Another ash plume on 29 January rose to an altitude of 3.7 km and drifted 93 km E. During 29-31 January, ash plumes rose to an altitude of 3.7 km and drifted 55 km NW.
CVGHM reported that on 5 February volcanic bombs ejected from Bromo were found 1.2-1.4 km from the crater rim. During 5-9 February and 17-18 February, gray-to-brown ash plumes rose 400-800 m above the crater and drifted E and ENE, causing ashfall in nearby villages. Incandescent material was ejected 200-300 m above the crater and landed as far as 500 m away. Roaring and booming noises were noted. Ash fell at the Bromo observation post, and in nearby villages, including Ngadirejo (10 km WNW), Sukapura (14 km NE), and Sumber (18 km E). High-amplitude seismicity and volcanic tremor were detected. During 5-9 February, the maximum amplitude of the tremor was 17-40 mm.
Based on pilot observation, the Darwin VAAC reported that on 9 February an eruption produced a plume that rose to an altitude of 7 km and drifted W. On 11 February satellite imagery showed an ash plume drifting 37 km SE at an altitude of 3 km. Additional ash plumes on 12 February rose to altitudes of 3-7.9 km and drifted 37-167 km NW and SE.
On 10 March 2011, according to CVGHM, ash fell in areas to the E and NE, including in the Probolinggo district (35 km NE). During 18-20 March, 22-25 March, and 29 March-4 April 2011, gray-to-brown ash plumes rose 400-800 m above the crater and drifted in multiple directions. Incandescent material was ejected 300 m above the crater and landed up to 500 m away. Roaring and booming noises were also noted. According to the Darwin VAAC, during 18-20 March, ash plumes rose to an altitude of 3 km and drifted 27-150 km NW, SW, and S. Ash plumes on 27-28 March rose to an altitude of 4.3 km and drifted 55 km NE.
According to Richard Roscoe, activity in mid-March 2011 could be distinguished into largely Strombolian phases accompanied by little ash and variable levels of degassing, and phases during which significant amounts of ash were released. (Roscoe, 2011). Strombolian phases were sometimes accompanied by powerful shockwaves, often after short periods (10-30 seconds) of complete calm, presumably signifying blockage of the vent causing pressure buildup. (Roscoe, 2011).
Photo gallery. Several sets of photos from mid-March 2011 documented substantial ash plumes and multiple incandescent bombs escaping Bromo's crater, in many cases Strombolian eruptions with bombs falling on the upper flanks. Some of the 30-second night exposures had streaks documenting more than 10 bombs.
Richard Roscoe presented an album that also contained considerable text, including references (Roscoe, 2011).
A second set of photos was taken in March 2011 by Indonesian travel consultant Aris Yanto (Yanto, 2011). It shows the eruption in a wide variety of conditions from locations near and at distance from the vent (showing many plumes in profile).
References. Roscoe, R, 2011, Bromo Volcano (Tengger Caldera), Photovolcanoica, 86 photographs (URL: http://www.photovolcanica.com/VolcanoInfo/Bromo/Bromo.html).
Yanto, A, 2011, Mt. Bromo on 17-20 [March], 2011; Aris Yanto's gallery, Picasa Web Albums, 40 photos, 640 x 361 pixels (URL: https://picasaweb.google.com/ndesoadventure/MTBromoOn17202011).
Geologic Background. The 16-km-wide Tengger caldera is located at the northern end of a volcanic massif extending from Semeru volcano. The massive volcanic complex dates back to about 820,000 years ago and consists of five overlapping stratovolcanoes, each truncated by a caldera. Lava domes, pyroclastic cones, and a maar occupy the flanks of the massif. The Ngadisari caldera at the NE end of the complex formed about 150,000 years ago and is now drained through the Sapikerep valley. The most recent of the calderas is the 9 x 10 km wide Sandsea caldera at the SW end of the complex, which formed incrementally during the late Pleistocene and early Holocene. An overlapping cluster of post-caldera cones was constructed on the floor of the Sandsea caldera within the past several thousand years. The youngest of these is Bromo, one of Java's most active and most frequently visited volcanoes.
Information Contacts: Center of Volcanology and Geological Hazard Mitigation (CVGHM), Jalan Diponegoro 57, Bandung 40122, Indonesia (URL: http://vsi.esdm.go.id/); Darwin Volcanic Ash Advisory Centre (VAAC), Bureau of Meteorology, Northern Territory Regional Office, PO Box 40050, Casuarina, NT 0811, Australia (URL: http://www.bom.gov.au/info/vaac/); Agence France-Presse (URL: http://www.afp.com/afpcom/en/); The Sydney Morning Herald (URL: http://www.smh.com.au/); The West Australian (URL: http://au.news.yahoo.com/thewest/); Reuters (URL: http://www.reuters.com/); Richard Roscoe, Photovolcanica (URL: http://www.photovolcanica.com/).
Ulawun (Papua New Guinea) — March 2011 Cite this Report
Ulawun
Papua New Guinea
5.05°S, 151.33°E; summit elev. 2334 m
All times are local (unless otherwise noted)
Modest eruptions included ash plumes to 4 km through February 2011
This report discusses volcanism and seismicity at Ulawun between early 2010 through February 2011, a period when the volcano (figure 14) discharged several ash plumes to as high as 3-4 km altitude. In one case, ash plumes were seen in satellite imagery drifting for almost 200 km. Our previous reporting noted steam plumes and increased seismicity in February 2010 (BGVN 35:02), which followed a multi-year interval of comparative quiet (BGVN 33:03 and 34:10).
As an overview of this report, the Rabaul Volcano Observatory (RVO) noted that during May 2010, the volcano produced occasional gray plumes, incandescence, audible noises, and increased seismicity. Accordingly, RVO recommended that the hazard status be set at Stage 1 Alert (in their 4-stage alert system), where it stayed through the rest of the reporting interval. Large regional earthquakes took place in June and July 2010 (figure 14).
Activity during May-July 2010. During 1-21 May, RVO reported variable amounts of white vapor; during late May to July, emissions were darker in color, with some specific examples highlighted below. Based on analyses of satellite imagery, the Darwin Volcanic Ash Advisory Centre (VAAC) reported ash plumes during 22-25 May that drifted 35-130 km at an altitude of 3 km. During late May through late June, RVO reported that white to gray plumes rose up to 1 km high and at times ashfall occurred. RVO noted gray plumes on 22, 25, and 29 May. People on the S part of New Britain observed fluctuating incandescence on 28-29 May.
Very fine ashfall was reported on 30 May in areas to the SSW, S, and SSE. It was again reported on 3 and 8 June, ~10 km NW (in Ulamona). During 9-25 June, fine ashfall was reported almost daily on the NW, SW, and sometimes W flanks.
Between late May and early July, low roaring or rumbling noises often were reported. Fluctuating incandescence from the crater was observed at night during 28-29 May, 6-10 June, 13 June, and 16-25 June.
On 18 and 19 June, seismicity increased to a high level and was dominated by volcanic tremor. The next day, seismicity declined to a moderate level and continued to do so after 26 June.
According to the Darwin VAAC, during 1-5 July ash plumes drifted 55-195 km at an altitude of 3 km. RVO reported that, at times during late June and July, white-to-gray plumes rose up to 500 m above the volcano. During 27 June-9 July fine ash fell in areas to Ulawun's SW, W, and NW.
During 5-8 July RVO noted a slight increase in seismicity (above moderate levels), which included tremor. During 16-21 July, volcanic tremors continued, but overall seismicity declined slightly. Seismic amplitude (RSAM) values remained moderate.
RVO reported that on 23-24 July ash plumes were observed.
Large regional earthquakes. RVO reported that several large earthquakes occurred during June and July (table 4). The largest of those were the adjacent 18 July earthquakes, a foreshock of Mw 6.9 and a mainshock of Mw 7.3. The latter, which was destructive, was the largest in about a decade. The Provincial Disaster Office reported significant building damage near the epicenter and in the town of Kimbe (65 km NW of the mainshock's epicenter, figure 14). The mainshock's epicenter was also ~45 km S of Pago volcano and 134 km SW of Ulawun. Many damaged houses had been constructed of bush materials, but some houses also included modern building materials. At least one death was reported. Numerous aftershocks followed the main Mw 7.3 shock.
Table 4. Large regional earthquakes near Ulawun that occurred on the days 2, 3, and 24 June and 18 July 2010. Courtesy of RVO.
| Date |
Time (local) |
Mw |
Type |
Depth (km) |
Location and comments |
| 02 Jun 2010 |
1929 |
5.8 |
Regional earthquake |
80 |
Offshore near Kandrian |
| 03 Jun 2010 |
1715 |
-- |
High-frequency volcano-tectonic earthquake |
-- |
Felt by island residents with Modified Mercalli (MM) intensity up to IV |
| 24 Jun 2010 |
1532 |
6.2 |
Tectonic earthquake |
70-80 |
In central New Britain centered~30-40 km SSE of Bialla town (70-80 km). MM Intensity of ~IV at Rabaul Town |
| 18 Jul 2010 |
2304 |
6.9 |
Foreshock |
42 |
Both earthquakes occurred on the S side of West New Britain Province near Gasmata. Residents felt them very strongly near the epicenter and in Kimbe area. |
| 18 Jul 2010 |
2335 |
7.3 |
Mainshock |
35 |
-- |
Highlights of behavior, August 2010 through February 2011. During 6-24 August, white and gray-to-brown plumes rose no more than 300 m above Ulawun, and fine ash fell on the NW and W flanks. Seismicity decreased compared to previous weeks.
During 26 November 2010, based on analyses of satellite imagery and information from RVO, the Darwin VAAC reported that an ash plume rose to an altitude of 3.7 km and drifted 55 km NE.
RVO reported that mild activity continued during 1 January through at least 28 February 2011, characterized by brown-to-gray ash plumes that rose less than 500 m. These produced fine ashfall to the SE. Sulfur dioxide plumes drifted SE on 5 and 31 January. During 23-26 February, gray ash plumes occasionally drifted NE, SW, and NW.
Geologic Background. The symmetrical basaltic-to-andesitic Ulawun stratovolcano is the highest volcano of the Bismarck arc, and one of Papua New Guinea's most frequently active. The volcano, also known as the Father, rises above the N coast of the island of New Britain across a low saddle NE of Bamus volcano, the South Son. The upper 1,000 m is unvegetated. A prominent E-W escarpment on the south may be the result of large-scale slumping. Satellitic cones occupy the NW and E flanks. A steep-walled valley cuts the NW side, and a flank lava-flow complex lies to the south of this valley. Historical eruptions date back to the beginning of the 18th century. Twentieth-century eruptions were mildly explosive until 1967, but after 1970 several larger eruptions produced lava flows and basaltic pyroclastic flows, greatly modifying the summit crater.
Information Contacts: Rabaul Volcano Observatory (RVO), P.O. Box 386, Rabaul, Papua New Guinea; Darwin Volcanic Ash Advisory Centre (VAAC), Commonwealth Bureau of Meteorology, Northern Territory Regional Office, PO Box 40050, Casuarina, NT 0811, Australia (URL: http://www.bom.gov.au/info/vaac/).