Recently Published Bulletin Reports
Erebus (Antarctica) Lava lake remains active; most thermal alerts recorded since 2019
Rincon de la Vieja (Costa Rica) Frequent phreatic explosions during July-December 2023
Bezymianny (Russia) Explosion on 18 October 2023 sends ash plume 8 km high; lava flows and incandescent avalanches
Kilauea (United States) Low-level lava effusions in the lava lake at Halema’uma’u during July-December 2022
Nyamulagira (DR Congo) Lava flows and thermal activity during May-October 2023
Bagana (Papua New Guinea) Explosions, ash plumes, ashfall, and lava flows during April-September 2023
Mayon (Philippines) Lava flows, pyroclastic flows, ash emissions, and seismicity during April-September 2023
Nishinoshima (Japan) Eruption plumes and gas-and-steam plumes during May-August 2023
Krakatau (Indonesia) White gas-and-steam plumes and occasional ash plumes during May-August 2023
Villarrica (Chile) Strombolian activity, gas-and-ash emissions, and crater incandescence during April-September 2023
Merapi (Indonesia) Frequent incandescent avalanches during April-September 2023
Ebeko (Russia) Moderate explosive activity with ash plumes continued during June-November 2023
Erebus (Antarctica) — January 2024  Cite this Report
Erebus
Antarctica
77.53°S, 167.17°E; summit elev. 3794 m
All times are local (unless otherwise noted)
Lava lake remains active; most thermal alerts recorded since 2019
The lava lake in the summit crater of Erebus has been active since at least 1972. Located in Antarctica overlooking the McMurdo Station on Ross Island, it is the southernmost active volcano on the planet. Because of the remote location, activity is primarily monitored by satellites. This report covers activity during 2023.
The number of thermal alerts recorded by the Hawai'i Institute of Geophysics and Planetology’s MODVOLC Thermal Alerts System increased considerably in 2023 compared to the years 2020-2022 (table 9). In contrast to previous years, the MODIS instruments aboard the Aqua and Terra satellites captured data from Erebus every month during 2023. Consistent with previous years, the lowest number of anomalous pixels were recorded in January, November, and December.
Table 9. Number of monthly MODIS-MODVOLC thermal alert pixels recorded at Erebus during 2017-2023. See BGVN 42:06 for data from 2000 through 2016. The table was compiled using data provided by the HIGP – MODVOLC Thermal Alerts System.
| Year |
Jan |
Feb |
Mar |
Apr |
May |
Jun |
Jul |
Aug |
Sep |
Oct |
Nov |
Dec |
SUM |
| 2017 |
0 |
21 |
9 |
0 |
0 |
1 |
11 |
61 |
76 |
52 |
0 |
3 |
234 |
| 2018 |
0 |
21 |
58 |
182 |
55 |
17 |
137 |
172 |
103 |
29 |
0 |
0 |
774 |
| 2019 |
2 |
21 |
162 |
151 |
55 |
56 |
75 |
53 |
29 |
19 |
1 |
0 |
624 |
| 2020 |
0 |
2 |
16 |
18 |
4 |
4 |
1 |
3 |
18 |
3 |
1 |
6 |
76 |
| 2021 |
0 |
9 |
1 |
0 |
2 |
56 |
46 |
47 |
35 |
52 |
5 |
3 |
256 |
| 2022 |
1 |
13 |
55 |
22 |
15 |
32 |
39 |
19 |
31 |
11 |
0 |
0 |
238 |
| 2023 |
2 |
33 |
49 |
82 |
41 |
32 |
70 |
64 |
42 |
17 |
5 |
11 |
448 |
Sentinel-2 infrared images showed one or two prominent heat sources within the summit crater, accompanied by adjacent smaller sources, similar to recent years (see BGVN 46:01, 47:02, and 48:01). A unique image was obtained on 25 November 2023 by the OLI-2 (Operational Land Imager-2) on Landsat 9, showing the upper part of the volcano surrounded by clouds (figure 32).
Geologic Background. Mount Erebus, the world's southernmost historically active volcano, overlooks the McMurdo research station on Ross Island. It is the largest of three major volcanoes forming the crudely triangular Ross Island. The summit of the dominantly phonolitic volcano has been modified by one or two generations of caldera formation. A summit plateau at about 3,200 m elevation marks the rim of the youngest caldera, which formed during the late-Pleistocene and within which the modern cone was constructed. An elliptical 500 x 600 m wide, 110-m-deep crater truncates the summit and contains an active lava lake within a 250-m-wide, 100-m-deep inner crater; other lava lakes are sometimes present. The glacier-covered volcano was erupting when first sighted by Captain James Ross in 1841. Continuous lava-lake activity with minor explosions, punctuated by occasional larger Strombolian explosions that eject bombs onto the crater rim, has been documented since 1972, but has probably been occurring for much of the volcano's recent history.
Information Contacts: Hawai'i Institute of Geophysics and Planetology (HIGP) - MODVOLC Thermal Alerts System, School of Ocean and Earth Science and Technology (SOEST), Univ. of Hawai'i, 2525 Correa Road, Honolulu, HI 96822, USA (URL: http://modis.higp.hawaii.edu/); Copernicus Browser, Copernicus Data Space Ecosystem, European Space Agency (URL: https://dataspace.copernicus.eu/browser/); NASA Earth Observatory, EOS Project Science Office, NASA Goddard Space Flight Center, Goddard, Maryland, USA (URL: https://earthobservatory.nasa.gov/images/152134/erebus-breaks-through).
Rincon de la Vieja (Costa Rica) — January 2024 Cite this Report
Rincon de la Vieja
Costa Rica
10.83°N, 85.324°W; summit elev. 1916 m
All times are local (unless otherwise noted)
Frequent phreatic explosions during July-December 2023
Rincón de la Vieja is a volcanic complex in Costa Rica with a hot convecting acid lake that exhibits frequent weak phreatic explosions, gas-and-steam emissions, and occasional elevated sulfur dioxide levels (BGVN 45:10, 46:03, 46:11). The current eruption period began June 2021. This report covers activity during July-December 2023 and is based on weekly bulletins and occasional daily reports from the Observatorio Vulcanologico Sismologica de Costa Rica-Universidad Nacional (OVSICORI-UNA).
Numerous weak phreatic explosions continued during July-December 2023, along with gas-and-steam emissions and plumes that rose as high as 3 km above the crater rim. Many weekly OVSICORI-UNA bulletins included the previous week's number of explosions and emissions (table 9). For many explosions, the time of explosion was given (table 10). Frequent seismic activity (long-period earthquakes, volcano-tectonic earthquakes, and tremor) accompanied the phreatic activity.
Table 9. Number of reported weekly phreatic explosions and gas-and-steam emissions at Rincón de la Vieja, July-December 2023. Counts are reported for the week before the Weekly Bulletin date; not all reports included these data. Courtesy of OVSICORI-UNA.
| OVSICORI Weekly Bulletin |
Number of explosions |
Number of emissions |
| 28 Jul 2023 |
6 |
14 |
| 4 Aug 2023 |
10 |
12 |
| 1 Sep 2023 |
13 |
11 |
| 22 Sep 2023 |
12 |
13 |
| 29 Sep 2023 |
6 |
11 |
| 6 Oct 2023 |
12 |
5 |
| 13 Oct 2023 |
7 |
9 |
| 20 Oct 2023 |
1 |
15 |
| 27 Oct 2023 |
3 |
23 |
| 3 Nov 2023 |
3 |
10 |
| 17 Nov 2023 |
0 |
Some |
| 24 Nov 2023 |
0 |
14 |
| 8 Dec 2023 |
4 |
16 |
| 22 Dec 2023 |
8 |
18 |
Table 10. Summary of activity at Rincón de la Vieja during July-December 2023. Weak phreatic explosions and gas emissions are noted where the time of explosion was indicated in the weekly or daily bulletins. Height of plumes or emissions are distance above the crater rim. Courtesy of OVSICORI-UNA.
| Date |
Time |
Description of Activity |
| 1 Jul 2023 |
0156 |
Explosion. |
| 2 Jul 2023 |
0305 |
Explosion. |
| 4 Jul 2023 |
0229, 0635 |
Event at 0635 produced a gas-and-steam plume that rose 700 m and drifted W; seen by residents in Liberia (21 km SW). |
| 9 Jul 2023 |
1843 |
Explosion. |
| 21 Jul 2023 |
0705 |
Explosion. |
| 26 Jul 2023 |
1807 |
Explosion. |
| 28 Jul 2023 |
0802 |
Explosion generated a gas-and-steam plume that rose 500 m. |
| 30 Jul 2023 |
1250 |
Explosion. |
| 31 Jul 2023 |
2136 |
Explosion. |
| 11 Aug 2023 |
0828 |
Explosion. |
| 18 Aug 2023 |
1304 |
Explosion. |
| 21 Aug 2023 |
1224 |
Explosion generated gas-and-steam plumes rose 500-600 m. |
| 22 Aug 2023 |
0749 |
Explosion generated gas-and-steam plumes rose 500-600 m. |
| 24 Aug 2023 |
1900 |
Explosion. |
| 25 Aug 2023 |
0828 |
Event produced a steam-and-gas plume that rose 3 km and drifted NW. |
| 27-28 Aug 2023 |
0813 |
Four small events; the event at 0813 on 28 August lasted two minutes and generated a steam-and-gas plume that rose 2.5 km. |
| 1 Sep 2023 |
1526 |
Explosion generated plume that rose 2 km and ejected material onto the flanks. |
| 2-3 Sep 2023 |
- |
Small explosions detected in infrasound data. |
| 4 Sep 2023 |
1251 |
Gas-and-steam plume rose 1 km and drifted W. |
| 7 Nov 2023 |
1113 |
Explosion. |
| 8 Nov 2023 |
0722 |
Explosion. |
| 12 Nov 2023 |
0136 |
Small gas emissions. |
| 14 Nov 2023 |
0415 |
Small gas emissions. |
According to OVSICORI-UNA, during July-October the average weekly sulfur dioxide (SO2) flux ranged from 68 to 240 tonnes/day. However, in mid-November the flux increased to as high as 334 tonnes/day, the highest value measured in recent years. The high SO2 flux in mid-November was also detected by the TROPOMI instrument on the Sentinel-5P satellite (figure 43).
Geologic Background. Rincón de la Vieja, the largest volcano in NW Costa Rica, is a remote volcanic complex in the Guanacaste Range. The volcano consists of an elongated, arcuate NW-SE-trending ridge constructed within the 15-km-wide early Pleistocene Guachipelín caldera, whose rim is exposed on the south side. Sometimes known as the "Colossus of Guanacaste," it has an estimated volume of 130 km3 and contains at least nine major eruptive centers. Activity has migrated to the SE, where the youngest-looking craters are located. The twin cone of Santa María volcano, the highest peak of the complex, is located at the eastern end of a smaller, 5-km-wide caldera and has a 500-m-wide crater. A Plinian eruption producing the 0.25 km3 Río Blanca tephra about 3,500 years ago was the last major magmatic eruption. All subsequent eruptions, including numerous historical eruptions possibly dating back to the 16th century, have been from the prominent active crater containing a 500-m-wide acid lake located ENE of Von Seebach crater.
Information Contacts: Observatorio Vulcanológico Sismológica de Costa Rica-Universidad Nacional (OVSICORI-UNA), Apartado 86-3000, Heredia, Costa Rica (URL: http://www.ovsicori.una.ac.cr/); NASA Global Sulfur Dioxide Monitoring Page, Atmospheric Chemistry and Dynamics Laboratory, NASA Goddard Space Flight Center (NASA/GSFC), 8800 Greenbelt Road, Goddard MD 20771, USA (URL: https://so2.gsfc.nasa.gov/).
Bezymianny (Russia) — November 2023 Cite this Report
Bezymianny
Russia
55.972°N, 160.595°E; summit elev. 2882 m
All times are local (unless otherwise noted)
Explosion on 18 October 2023 sends ash plume 8 km high; lava flows and incandescent avalanches
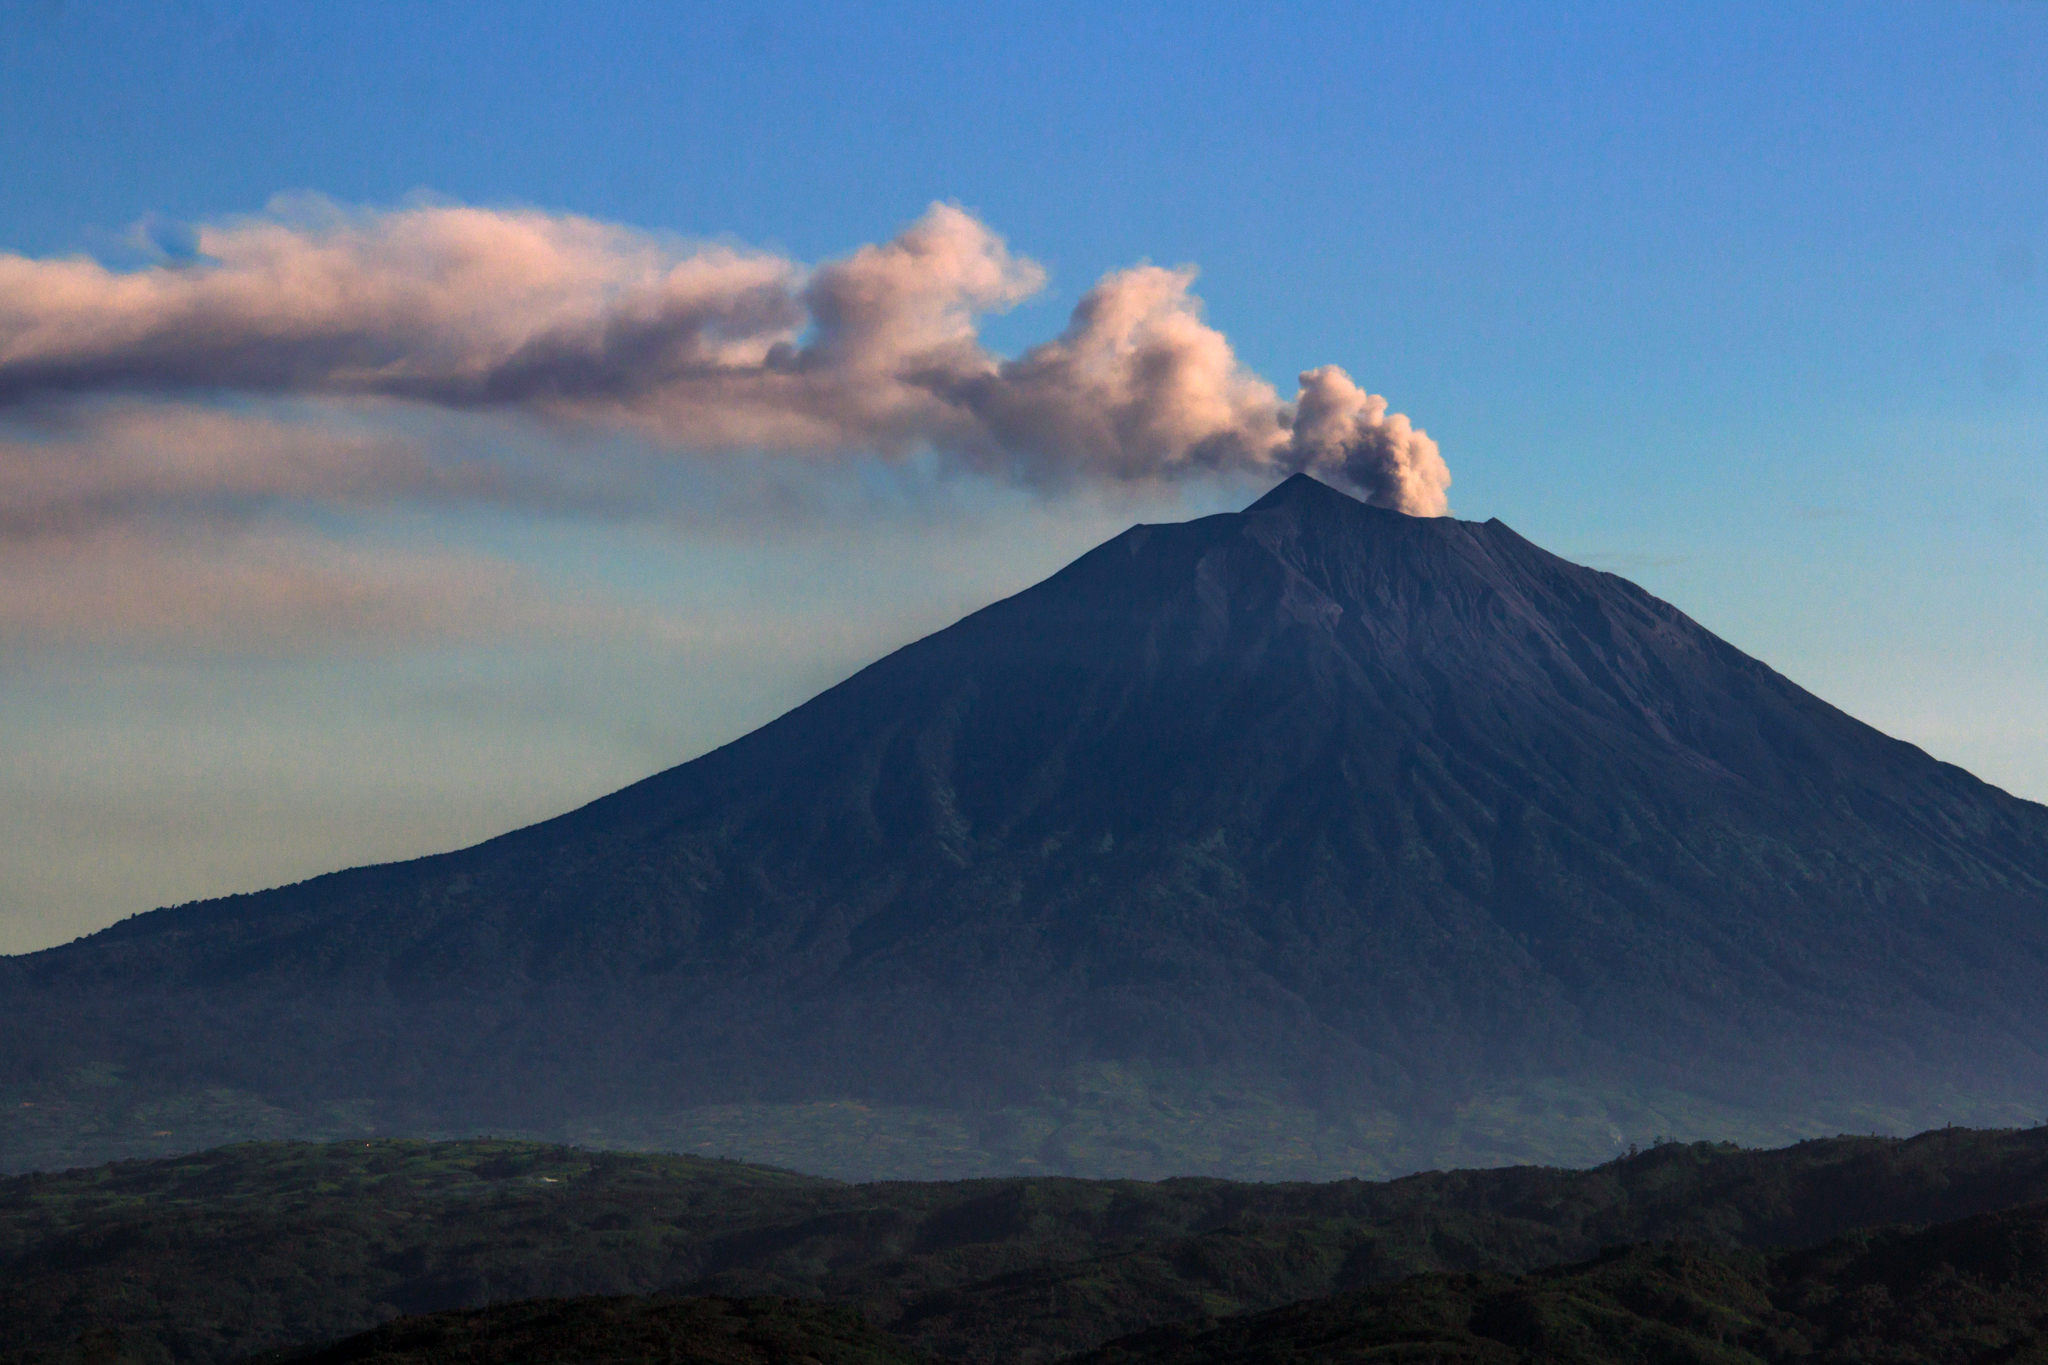
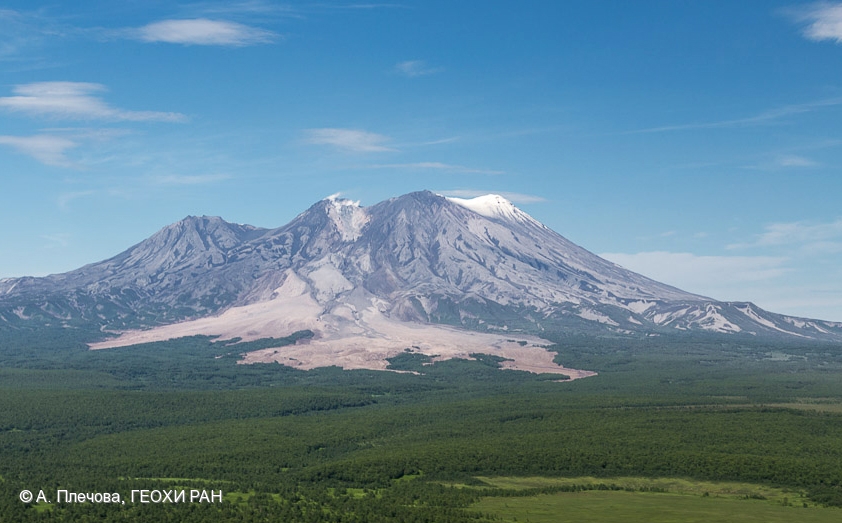
Bezymianny, located on Russia’s Kamchatka Peninsula, has had eruptions since 1955 characterized by dome growth, explosions, pyroclastic flows, ash plumes, and ashfall. Activity during November 2022-April 2023 included gas-and-steam emissions, lava dome collapses generating avalanches, and persistent thermal activity. Similar eruptive activity continued from May through October 2023, described here based on information from weekly and daily reports of the Kamchatka Volcano Eruptions Response Team (KVERT), notices from Tokyo VAAC (Volcanic Ash Advisory Center), and from satellite data.
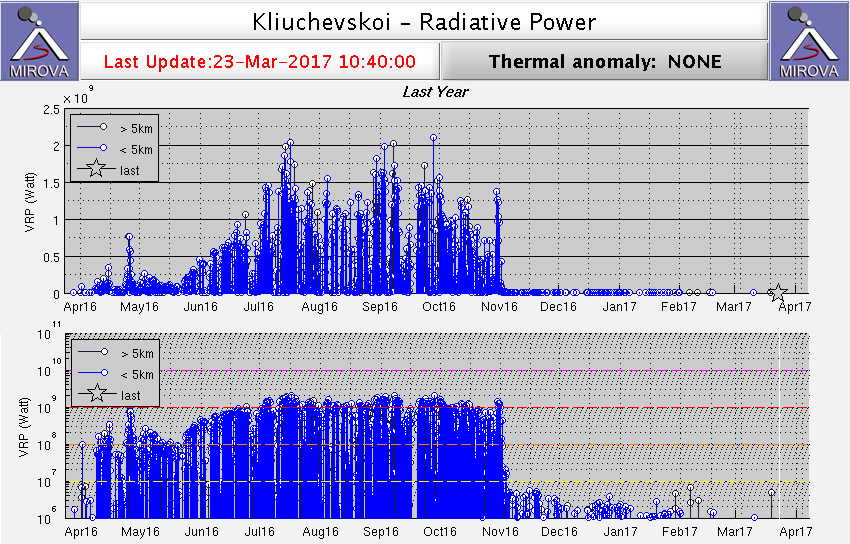
Overall activity decreased after the strong period of activity in late March through April 2023, which included ash explosions during 29 March and 7-8 April 2023 that sent plumes as high as 10-12 km altitude, along with dome growth and lava flows (BGVN 48:05). This reduced activity can be seen in the MIROVA thermal detection system graph (figure 56), which was consistent with data from the MODVOLC thermal detection system and with Sentinel-2 satellite images that showed persistent hotspots in the summit crater when conditions allowed observations. A renewed period of strong activity began in mid-October 2023.
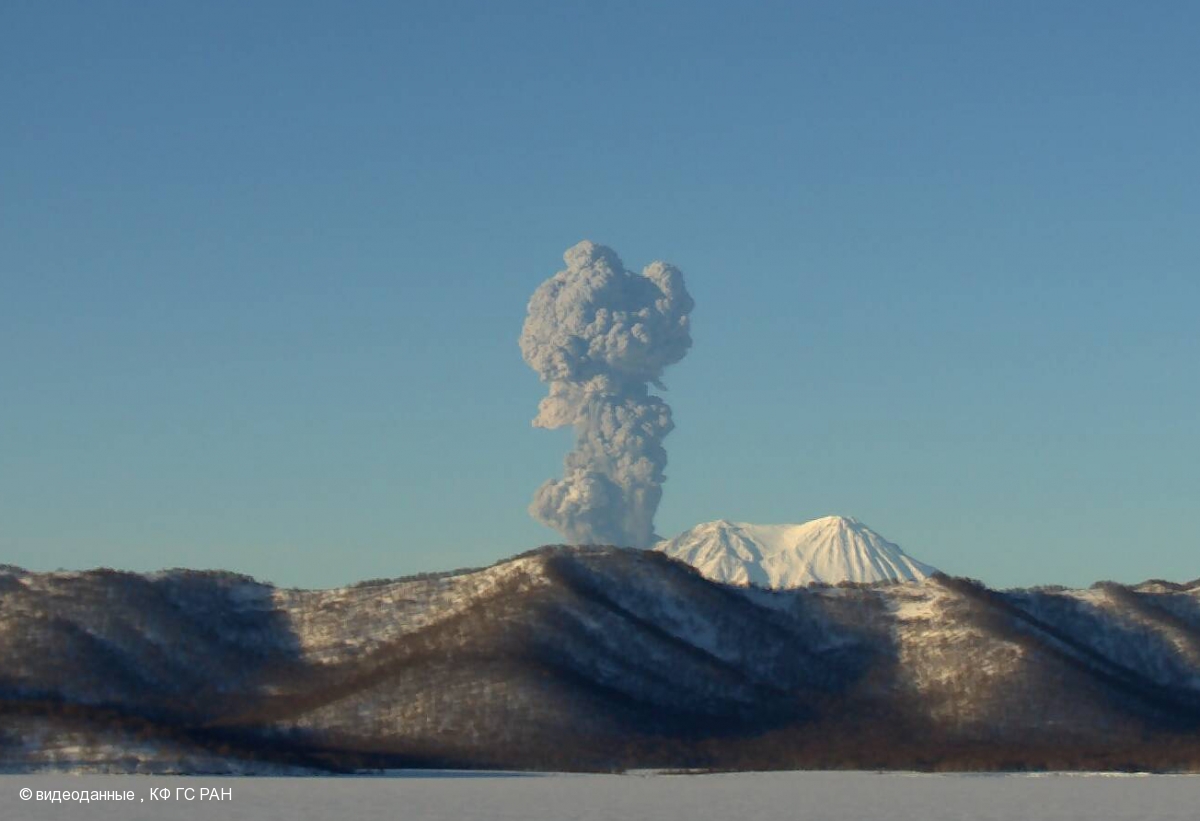
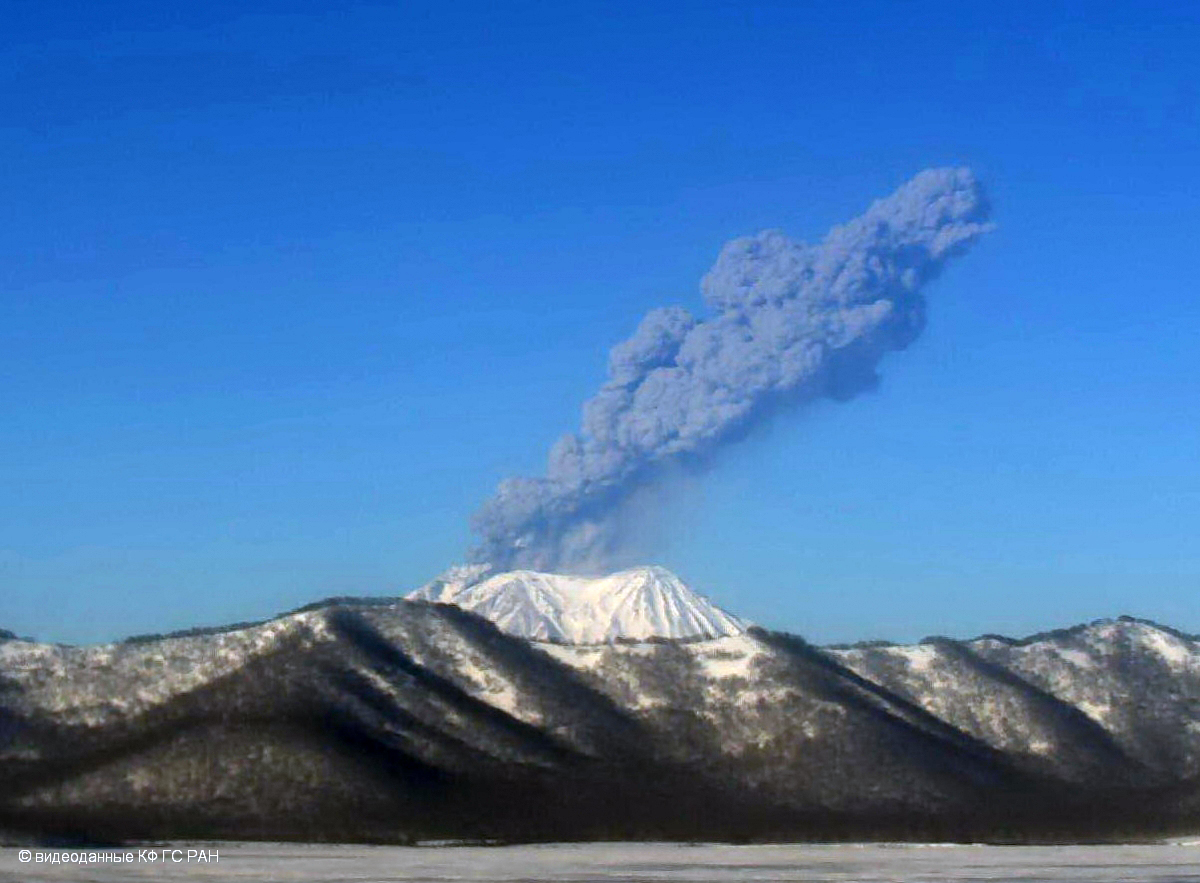
Activity increased significantly on 17 October 2023 when large collapses began during 0700-0830 on the E flanks of the lava dome and continued to after 0930 the next day (figure 57). Ash plumes rose to an altitude of 4.5-5 km, extending 220 km NNE by 18 October. A large explosion at 1630 on 18 October produced an ash plume that rose to an altitude of 11 km (8 km above the summit) and drifted NNE and then NW, extending 900 km NW within two days at an altitude of 8 km. Minor ashfall was noted in Kozyrevsk (45 km WNW). At 0820 on 20 October an ash plume was identified in satellite images drifting 100 km ENE at altitudes of 4-4.5 km.
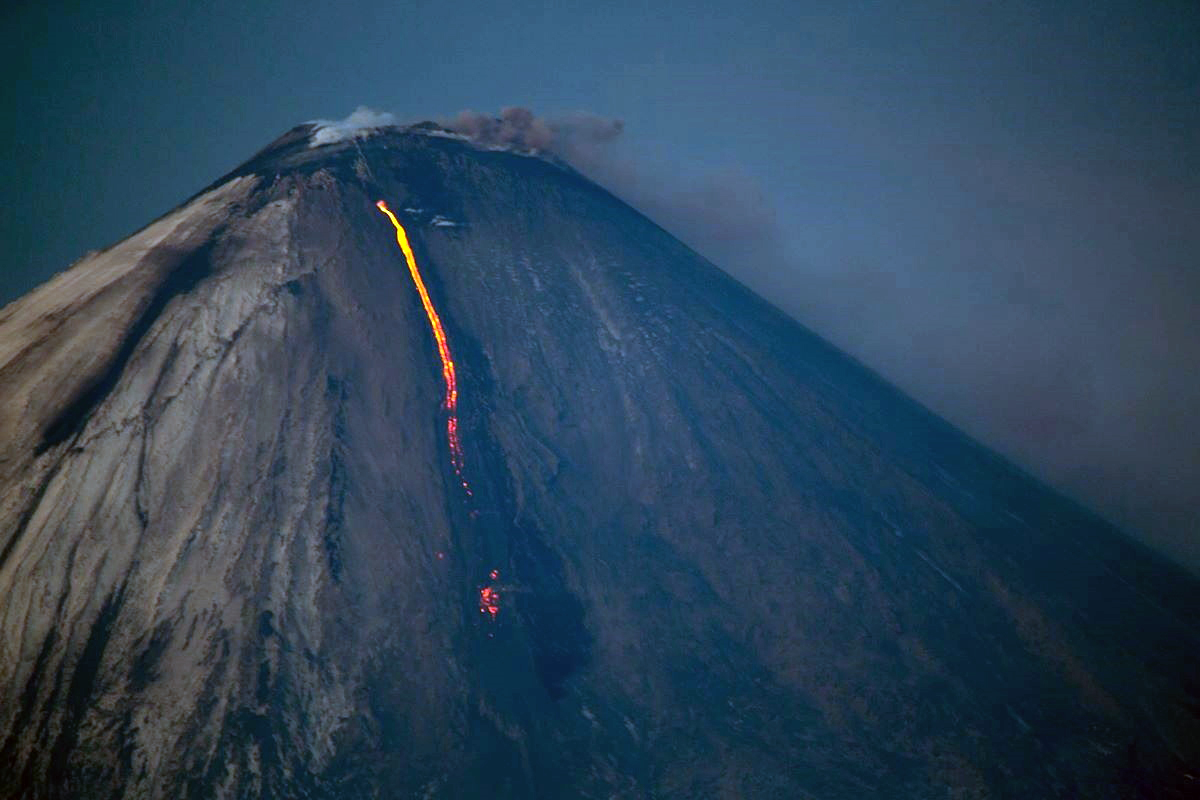
Lava flows and hot avalanches from the dome down the SE flank continued over the next few days, including 23 October when clear conditions allowed good observations (figures 58 and 59). A large thermal anomaly was observed over the volcano through 24 October, and in the summit crater on 30 October (figure 60). Strong fumarolic activity continued, with numerous avalanches and occasional incandescence. By the last week of October, volcanic activity had decreased to a level consistent with that earlier in the reporting period.
Aviation warnings were frequently updated during 17-20 October. KVERT issued a Volcano Observatory Notice for Aviation (VONA) on 17 October at 1419 and 1727 (0219 and 0527 UTC) raising the Aviation Color Code (ACC) from Yellow to Orange (second highest level). The next day, KVERT issued a VONA at 1705 (0505 UTC) raising the ACC to Red (highest level) but lowered it back to Orange at 2117 (0917 UTC). After another decrease to Yellow and back to Orange, the ACC was reduced to Yellow on 20 October at 1204 (0004 UTC). In addition, the Tokyo VAAC issued a series of Volcanic Ash Advisories beginning on 16 October and continuing through 30 October.
Geologic Background. The modern Bezymianny, much smaller than its massive neighbors Kamen and Kliuchevskoi on the Kamchatka Peninsula, was formed about 4,700 years ago over a late-Pleistocene lava-dome complex and an edifice built about 11,000-7,000 years ago. Three periods of intensified activity have occurred during the past 3,000 years. The latest period, which was preceded by a 1,000-year quiescence, began with the dramatic 1955-56 eruption. This eruption, similar to that of St. Helens in 1980, produced a large open crater that was formed by collapse of the summit and an associated lateral blast. Subsequent episodic but ongoing lava-dome growth, accompanied by intermittent explosive activity and pyroclastic flows, has largely filled the 1956 crater.
Information Contacts: Kamchatka Volcanic Eruptions Response Team (KVERT), Far Eastern Branch, Russian Academy of Sciences, 9 Piip Blvd., Petropavlovsk-Kamchatsky, 683006, Russia (URL: http://www.kscnet.ru/ivs/kvert/); Kamchatka Volcanological Station, Kamchatka Branch of Geophysical Survey, (KB GS RAS), Klyuchi, Kamchatka Krai, Russia (URL: http://volkstat.ru/); Tokyo Volcanic Ash Advisory Center (VAAC), 1-3-4 Otemachi, Chiyoda-ku, Tokyo 100-8122, Japan (URL: http://ds.data.jma.go.jp/svd/vaac/data/); Hawai'i Institute of Geophysics and Planetology (HIGP) - MODVOLC Thermal Alerts System, School of Ocean and Earth Science and Technology (SOEST), Univ. of Hawai'i, 2525 Correa Road, Honolulu, HI 96822, USA (URL: http://modis.higp.hawaii.edu/); MIROVA (Middle InfraRed Observation of Volcanic Activity), a collaborative project between the Universities of Turin and Florence (Italy) supported by the Centre for Volcanic Risk of the Italian Civil Protection Department (URL: http://www.mirovaweb.it/); Copernicus Browser, Copernicus Data Space Ecosystem, European Space Agency (URL: https://dataspace.copernicus.eu/browser/).chr
Kilauea (United States) — January 2023 Cite this Report
Kilauea
United States
19.421°N, 155.287°W; summit elev. 1222 m
All times are local (unless otherwise noted)
Low-level lava effusions in the lava lake at Halema’uma’u during July-December 2022
Kīlauea is the southeastern-most volcano in Hawaii and overlaps the E flank of the Mauna Loa volcano. Its East Rift Zone (ERZ) has been intermittently active for at least 2,000 years. An extended eruption period began in January 1983 and was characterized by open lava lakes and lava flows from the summit caldera and the East Rift Zone. During May 2018 magma migrated into the Lower East Rift Zone (LERZ) and opened 24 fissures along a 6-km-long NE-trending fracture zone that produced lava flows traveling in multiple directions. As lava emerged from the fissures, the lava lake at Halema'uma'u drained and explosions sent ash plumes to several kilometers altitude (BGVN 43:10).
The current eruption period started during September 2021 and has recently been characterized by lava effusions, spatter, and sulfur dioxide emissions in the active Halema’uma’u lava lake (BGVN 47:08). Lava effusions, some spatter, and sulfur dioxide emissions have continued during this reporting period of July through December 2022 using daily reports, volcanic activity notices, and abundant photo, map, and video data from the US Geological Survey's (USGS) Hawaiian Volcano Observatory (HVO).
Summary of activity during July-December 2022. Low-level effusions have continued at the western vent of the Halema’uma’u crater during July through early December 2022. Occasional weak ooze-outs (also called lava break outs) would occur along the margins of the crater floor. The overall level of the active lava lake throughout the reporting period gradually increased due to infilling, however it stagnated in mid-September (table 13). During September through November, activity began to decline, though lava effusions persisted at the western vent. By 9 December, the active part of the lava lake had completely crusted over, and incandescence was no longer visible.
Table 13. Summary of measurements taken during overflights at Kīlauea that show a gradual increase in the active lava lake level and the volume of lava effused since 29 September 2021. Lower activity was reported during September-October. Data collected during July-December 2022. Courtesy of HVO.
| Date: |
Level of the active lava lake (m): |
Cumulative volume of lava effused (million cubic meters): |
| 7 Jul 2022 |
130 |
95 |
| 19 Jul 2022 |
133 |
98 |
| 4 Aug 2022 |
136 |
102 |
| 16 Aug 2022 |
137 |
104 |
| 12 Sep 2022 |
143 |
111 |
| 5 Oct 2022 |
143 |
111 |
| 28 Oct 2022 |
143 |
111 |
Activity during July 2022. Lava effusions were reported from the western vent in the Halema’uma’u crater, along with occasional weak ooze-outs along the margins of the crater floor. The height of the lava lake was variable due to deflation-inflation tilt events; for example, the lake level dropped approximately 3-4 m during a summit deflation-inflation event reported on 1 July. Webcam images taken during the night of 6-12 July showed intermittent low-level spattering at the western vent that rose less than 10 m above the vent (figure 519). Measurements made during an overflight on 7 July indicated that the crater floor was infilled about 130 m and that 95 million cubic meters of lava had been effused since 29 September 2021. A single, relatively small lava ooze-out was active to the S of the lava lake. Around midnight on 8 July there were two brief periods of lava overflow onto the lake margins. On 9 July lava ooze-outs were reported near the SE and NE edges of the crater floor and during 10-11 July they occurred near the E, NE, and NW edges. On 16 July crater incandescence was reported, though the ooze-outs and spattering were not visible. On 18 July overnight webcam images showed incandescence in the western vent complex and two ooze-outs were reported around 0000 and 0200 on 19 July. By 0900 there were active ooze-outs along the SW edge of the crater floor. Measurements made from an overflight on 19 July indicated that the crater floor was infilled about 133 m and 98 million cubic meters of lava had erupted since 29 September 2021 (figure 520). On 20 July around 1600 active ooze-outs were visible along the N edge of the crater, which continued through the next day. Extensive ooze-outs occurred along the W margin during 24 July until 1900; on 26 July minor ooze-outs were noted along the N margin. Minor spattering was visible on 29 July along the E margin of the lake. The sulfur dioxide emission rates ranged 650-2,800 tons per day (t/d), the higher of which was measured on 8 July (figure 519).
Activity during August 2022. The eruption continued in the Halema’uma’u crater at the western vent. According to HVO the lava in the active lake remained at the level of the bounding levees. Occasional minor ooze-outs were observed along the margins of the crater floor. Strong nighttime crater incandescence was visible after midnight on 6 August over the western vent cone. During 6-7 August scattered small lava lobes were active along the crater floor and incandescence persisted above the western vent through 9 August. During 7-9 August HVO reported a single lava effusion source was active along the NW margin of the crater floor. Measurements from an overflight on 4 August indicated that the crater floor was infilled about 136 m total and that 102 million cubic meters of lava had been erupted since the start of the eruption. Lava breakouts were reported along the N, NE, E, S, and W margins of the crater during 10-16 August. Another overflight survey conducted on 16 August indicated that the crater floor infilled about 137 m and 104 million cubic meters of lava had been erupted since September 2021. Measured sulfur dioxide emissions rates ranged 1,150-2,450 t/d, the higher of which occurred on 8 August.
Activity during September 2022. During September, lava effusion continued from the western vent into the active lava lake and onto the crater floor. Intermittent minor ooze-outs were reported through the month. A small ooze-out was visible on the W crater floor margin at 0220 on 2 September, which showed decreasing surface activity throughout the day, but remained active through 3 September. On 3 September around 1900 a lava outbreak occurred along the NW margin of the crater floor but had stopped by the evening of 4 September. Field crews monitoring the summit lava lake on 9 September observed spattering on the NE margin of the lake that rose no higher than 10 m, before falling back onto the lava lake crust (figure 521). Overflight measurements on 12 September indicated that the crater floor was infilled a total of 143 m and 111 million cubic meters of lava had been erupted since September 2021. Extensive breakouts in the W and N part of the crater floor were reported at 1600 on 20 September and continued into 26 September. The active part of the lava lake dropped by 10 m while other parts of the crater floor dropped by several meters. Summit tiltmeters recorded a summit seismic swarm of more than 80 earthquakes during 1500-1800 on 21 September, which occurred about 1.5 km below Halema’uma’u; a majority of these were less than Mw 2. By 22 September the active part of the lava lake was infilled about 2 m. On 23 September the western vent areas exhibited several small spatter cones with incandescent openings, along with weak, sporadic spattering (figure 522). The sulfur dioxide emission rate ranged from 930 t/d to 2,000 t/d, the higher of which was measured on 6 September.
Activity during October 2022. Activity during October declined slightly compared to previous months, though lava effusions persisted from the western vent into the active lava lake and onto the crater floor during October (figure 523). Slight variations in the lava lake were noted throughout the month. HVO reported that around 0600 on 3 October the level of the lava lake has lowered slightly. Overflight measurements taken on 5 October indicated that the crater floor was infilled a total of about 143 m and that 111 million cubic meters of lava had been effused since September 2021. During 6-7 October the lake gradually rose 0.5 m. Sulfur dioxide measurements made on 22 October had an emission rate of 700 t/d. Another overflight taken on 28 October showed that there was little to no change in the elevation of the crater floor: the crater floor was infilled a total of 143 m and 111 million cubic meters of lava had erupted since the start of the eruption.
Activity during November 2022. Activity remained low during November, though HVO reported that lava from the western vent continued to effuse into the active lava lake and onto the crater floor throughout the month. The rate of sulfur dioxide emissions during November ranged from 300-600 t/d, the higher amount of which occurred on 9 November.
Activity during December 2022. Similar low activity was reported during December, with lava effusing from the western vent into the active lava lake and onto the crater floor. During 4-5 December the active part of the lava lake was slightly variable in elevation and fluctuated within 1 m. On 9 December HVO reported that lava was no longer erupting from the western vent in the Halema’uma’u crater and that sulfur dioxide emissions had returned to near pre-eruption background levels; during 10-11 December, the lava lake had completely crusted over, and no incandescence was visible (figure 524). Time lapse camera images covering the 4-10 December showed that the crater floor showed weak deflation and no inflation. Some passive events of crustal overturning were reported during 14-15 December, which brought fresh incandescent lava to the lake surface. The sulfur dioxide emission rate was approximately 200 t/d on 14 December. A smaller overturn event on 17 December and another that occurred around 0000 and into the morning of 20 December were also detected. A small seismic swarm was later detected on 30 December.
Geologic Background. Kilauea overlaps the E flank of the massive Mauna Loa shield volcano in the island of Hawaii. Eruptions are prominent in Polynesian legends; written documentation since 1820 records frequent summit and flank lava flow eruptions interspersed with periods of long-term lava lake activity at Halemaumau crater in the summit caldera until 1924. The 3 x 5 km caldera was formed in several stages about 1,500 years ago and during the 18th century; eruptions have also originated from the lengthy East and Southwest rift zones, which extend to the ocean in both directions. About 90% of the surface of the basaltic shield volcano is formed of lava flows less than about 1,100 years old; 70% of the surface is younger than 600 years. The long-term eruption from the East rift zone between 1983 and 2018 produced lava flows covering more than 100 km2, destroyed hundreds of houses, and added new coastline.
Information Contacts: Hawaiian Volcano Observatory (HVO), U.S. Geological Survey, PO Box 51, Hawai'i National Park, HI 96718, USA (URL: http://hvo.wr.usgs.gov/).
Nyamulagira (DR Congo) — November 2023 Cite this Report
Nyamulagira
DR Congo
1.408°S, 29.2°E; summit elev. 3058 m
All times are local (unless otherwise noted)
Lava flows and thermal activity during May-October 2023
Nyamulagira (also known as Nyamuragira) is a shield volcano in the Democratic Republic of Congo with the summit truncated by a small 2 x 2.3 km caldera with walls up to about 100 m high. Documented eruptions have occurred within the summit caldera, as well as from numerous flank fissures and cinder cones. The current eruption period began in April 2018 and has more recently been characterized by summit crater lava flows and thermal activity (BGVN 48:05). This report describes lava flows and variable thermal activity during May through October 2023, based on information from the Observatoire Volcanologique de Goma (OVG) and various satellite data.
Lava lake activity continued during May. The MIROVA (Middle InfraRed Observation of Volcanic Activity) system recorded moderate-to-strong thermal activity throughout the reporting period; activity was more intense during May and October and relatively weaker from June through September (figure 95). The MODVOLC thermal algorithm, detected a total of 209 thermal alerts. There were 143 hotspots detected during May, eight during June, nine during September, and 49 during October. This activity was also reflected in infrared satellite images, where a lava flow was visible in the NW part of the crater on 7 May and strong activity was seen in the center of the crater on 4 October (figure 96). Another infrared satellite image taken on 12 May showed still active lava flows along the NW margin of the crater. According to OVG lava effusions were active during 7-29 May and moved to the N and NW parts of the crater beginning on 9 May. Strong summit crater incandescence was visible from Goma (27 km S) during the nights of 17, 19, and 20 May (figure 97). On 17 May there was an increase in eruptive activity, which peaked at 0100 on 20 May. Notable sulfur dioxide plumes drifted NW and W during 19-20 May (figure 98). Drone footage acquired in partnership with the USGS (United States Geological Survey) on 20 May captured images of narrow lava flows that traveled about 100 m down the W flank (figure 99). Data from the Rumangabo seismic station indicated a decreasing trend in activity during 17-21 May. Although weather clouds prevented clear views of the summit, a strong thermal signature on the NW flank was visible in an infrared satellite image on 22 May, based on an infrared satellite image. On 28 May the lava flows on the upper W flank began to cool and solidify. By 29 May seismicity returned to levels similar to those recorded before the 17 May increase. Lava effusion continued but was confined to the summit crater; periodic crater incandescence was observed.
Low-level activity was noted during June through October. On 1 June OVG reported that seismicity remained at lower levels and that crater incandescence had been absent for three days, though infrared satellite imagery showed continued lava effusion in the summit crater. The lava flows on the flanks covered an estimated 0.6 km2. Satellite imagery continued to show thermal activity confined to the lava lake through October (figure 96), although no lava flows or significant sulfur dioxide emissions were reported.
Geologic Background. Africa's most active volcano, Nyamulagira (also known as Nyamuragira), is a massive high-potassium basaltic shield about 25 km N of Lake Kivu and 13 km NNW of the steep-sided Nyiragongo volcano. The summit is truncated by a small 2 x 2.3 km caldera that has walls up to about 100 m high. Documented eruptions have occurred within the summit caldera, as well as from the numerous flank fissures and cinder cones. A lava lake in the summit crater, active since at least 1921, drained in 1938, at the time of a major flank eruption. Recent lava flows extend down the flanks more than 30 km from the summit as far as Lake Kivu; extensive lava flows from this volcano have covered 1,500 km2 of the western branch of the East African Rift.
Information Contacts: Observatoire Volcanologique de Goma (OVG), Departement de Geophysique, Centre de Recherche en Sciences Naturelles, Lwiro, D.S. Bukavu, DR Congo; Hawai'i Institute of Geophysics and Planetology (HIGP) - MODVOLC Thermal Alerts System, School of Ocean and Earth Science and Technology (SOEST), Univ. of Hawai'i, 2525 Correa Road, Honolulu, HI 96822, USA (URL: http://modis.higp.hawaii.edu/); MIROVA (Middle InfraRed Observation of Volcanic Activity), a collaborative project between the Universities of Turin and Florence (Italy) supported by the Centre for Volcanic Risk of the Italian Civil Protection Department (URL: http://www.mirovaweb.it/); NASA Global Sulfur Dioxide Monitoring Page, Atmospheric Chemistry and Dynamics Laboratory, NASA Goddard Space Flight Center (NASA/GSFC), 8800 Greenbelt Road, Goddard, Maryland, USA (URL: https://so2.gsfc.nasa.gov/); Copernicus Browser, Copernicus Data Space Ecosystem, European Space Agency (URL: https://dataspace.copernicus.eu/browser/); Charles Balagizi, Goma Volcano Observatory, Departement de Geophysique, Centre de Recherche en Sciences Naturelles, Lwiro, D.S. Bukavu, DR Congo.
Bagana (Papua New Guinea) — October 2023 Cite this Report
Bagana
Papua New Guinea
6.137°S, 155.196°E; summit elev. 1855 m
All times are local (unless otherwise noted)
Explosions, ash plumes, ashfall, and lava flows during April-September 2023
The remote volcano of Bagana is located in central Bougainville Island, Papua New Guinea. Recorded eruptions date back to 1842 and activity has consisted of effusive activity that has built a small lava dome in the summit crater and occasional explosions that produced pyroclastic flows. The most recent eruption has been ongoing since February 2000 and has produced occasional explosions, ash plumes, and lava flows. More recently, activity has been characterized by ongoing effusive activity and ash emissions (BGVN 48:04). This report updates activity from April through September 2023 that has consisted of explosions, ash plumes, ashfall, and lava flows, using information from the Darwin Volcanic Ash Advisory Center (VAAC) and satellite data.
An explosive eruption was reported on 7 July that generated a large gas-and-ash plume to high altitudes and caused significant ashfall in local communities; the eruption plume had reached upper tropospheric (16-18 km altitude) altitudes by 2200, according to satellite images. Sulfur dioxide plumes were detected in satellite images on 8 July and indicated that the plume was likely a mixture of gas, ice, and ash. A report issued by the Autonomous Bougainville Government (ABG) (Torokina District, Education Section) on 10 July noted that significant ash began falling during 2000-2100 on 7 July and covered most areas in the Vuakovi, Gotana (9 km SW), Koromaketo, Laruma (25 km W) and Atsilima (27 km NW) villages. Pyroclastic flows also occurred, according to ground-based reports; small deposits confined to one drainage were inspected by RVO during an overflight on 17 July and were confirmed to be from the 7 July event. Ashfall continued until 10 July and covered vegetation, which destroyed bushes and gardens and contaminated rivers and streams.
RVO reported another eruption on 14 July. The Darwin VAAC stated that an explosive event started around 0830 on 15 July and produced an ash plume that rose to 16.5 km altitude by 1000 and drifted N, according to satellite images. The plume continued to drift N and remained visible through 1900, and by 2150 it had dissipated.
Ashfall likely from both the 7 and 15 July events impacted about 8,111 people in Torokina (20 km SW), including Tsito/Vuakovi, Gotana, Koromaketo, Kenaia, Longkogari, Kenbaki, Piva (13 km SW), and Atsinima, and in the Tsitovi district, according to ABG. Significant ashfall was also reported in Ruruvu (22 km N) in the Wakunai District of Central Bougainville, though the thickness of these deposits could not be confirmed. An evacuation was called for the villages in Wakunai, where heavy ashfall had contaminated water sources; the communities of Ruruvu, Togarau, Kakarapaia, Karauturi, Atao, and Kuritaturi were asked to evacuate to a disaster center at the Wakunai District Station, and communities in Torokina were asked to evacuate to the Piva District station. According to a news article, more than 7,000 people needed temporary accommodations, with about 1,000 people in evacuation shelters. Ashfall had deposited over a broad area, contaminating water supplies, affecting crops, and collapsing some roofs and houses in rural areas. Schools were temporarily shut down. Intermittent ash emissions continued through the end of July and drifted NNW, NW, and SW. Fine ashfall was reported on the coast of Torokina, and ash plumes also drifted toward Laruma and Atsilima.
A small explosive eruption occurred at 2130 on 28 July that ejected material from the crater vents, according to reports from Torokina, in addition to a lava flow that contained two lobes. A second explosion was detected at 2157. Incandescence from the lava flow was visible from Piva as it descended the W flank around 2000 on 29 July (figure 47). The Darwin VAAC reported that a strong thermal anomaly was visible in satellite images during 30-31 July and that ash emissions rose to 2.4 km altitude and drifted WSW on 30 July. A ground report from RVO described localized emissions at 0900 on 31 July.
The Darwin VAAC reported that ash plumes were identified in satellite imagery at 0800 and 1220 on 12 August and rose to 2.1 km and 3 km altitude and drifted NW and W, respectively. A news report stated that aid was sent to more than 6,300 people that were adversely affected by the eruption. Photos taken during 17-19 August showed ash emissions rising no higher than 1 km above the summit and drifting SE. A small explosion generated an ash plume during the morning of 19 August. Deposits from small pyroclastic flows were also captured in the photos. Satellite images captured lava flows and pyroclastic flow deposits. Two temporary seismic stations were installed near Bagana on 17 August at distances of 7 km WSW (Vakovi station) and 11 km SW (Kepox station). The Kepox station immediately started to record continuous, low-frequency background seismicity.
Satellite data. Little to no thermal activity was detected during April through mid-July 2023; only one anomaly was recorded during early April and one during early June, according to MIROVA (Middle InfraRed Observation of Volcanic Activity) data (figure 48). Thermal activity increased in both power and frequency during mid-July through September, although there were still some short gaps in detected activity. MODVOLC also detected increased thermal activity during August; thermal hotspots were detected a total of five times on 19, 20, and 27 August. Weak thermal anomalies were also captured in infrared satellite images on clear weather days throughout the reporting period on 7, 12, and 17 April, 27 May, 1, 6, 16, and 31 July, and 19 September (figure 48); a strong thermal anomaly was visible on 31 July. Distinct sulfur dioxide plumes that drifted generally NW were intermittently captured by the TROPOMI instrument on the Sentinel-5P satellite and sometimes exceeded two Dobson Units (DUs) (figure 49).
Geologic Background. Bagana volcano, in a remote portion of central Bougainville Island, is frequently active. This massive symmetrical cone was largely constructed by an accumulation of viscous andesitic lava flows. The entire edifice could have been constructed in about 300 years at its present rate of lava production. Eruptive activity is characterized by non-explosive effusion of viscous lava that maintains a small lava dome in the summit crater, although occasional explosive activity produces pyroclastic flows. Lava flows with tongue-shaped lobes up to 50 m thick and prominent levees descend the flanks on all sides.
Information Contacts: Rabaul Volcano Observatory (RVO), Geohazards Management Division, Department of Mineral Policy and Geohazards Management (DMPGM), PO Box 3386, Kokopo, East New Britain Province, Papua New Guinea; Darwin Volcanic Ash Advisory Centre (VAAC), Bureau of Meteorology, Northern Territory Regional Office, PO Box 40050, Casuarina, NT 0811, Australia (URL: http://www.bom.gov.au/info/vaac/); MIROVA (Middle InfraRed Observation of Volcanic Activity), a collaborative project between the Universities of Turin and Florence (Italy) supported by the Centre for Volcanic Risk of the Italian Civil Protection Department (URL: http://www.mirovaweb.it/); Hawai'i Institute of Geophysics and Planetology (HIGP) - MODVOLC Thermal Alerts System, School of Ocean and Earth Science and Technology (SOEST), Univ. of Hawai'i, 2525 Correa Road, Honolulu, HI 96822, USA (URL: http://modis.higp.hawaii.edu/); NASA Global Sulfur Dioxide Monitoring Page, Atmospheric Chemistry and Dynamics Laboratory, NASA Goddard Space Flight Center (NASA/GSFC), 8800 Greenbelt Road, Goddard, Maryland, USA (URL: https://so2.gsfc.nasa.gov/); Copernicus Browser, Copernicus Data Space Ecosystem, European Space Agency (URL: https://dataspace.copernicus.eu/browser/); Autonomous Bougainville Government, P.O Box 322, Buka, AROB, PNG (URL: https://abg.gov.pg/); Andrew Tupper (Twitter: @andrewcraigtupp); Simon Carn, Geological and Mining Engineering and Sciences, Michigan Technological University, 1400 Townsend Drive, Houghton, MI 49931, USA (URL: http://www.volcarno.com/, Twitter: @simoncarn); Radio NZ (URL: https://www.rnz.co.nz/news/pacific/494464/more-than-7-000-people-in-bougainville-need-temporary-accommodation-after-eruption); USAID, 1300 Pennsylvania Ave, NW, Washington DC 20004, USA (URL: https://www.usaid.gov/pacific-islands/press-releases/aug-08-2023-united-states-provides-immediate-emergency-assistance-support-communities-affected-mount-bagana-volcanic-eruptions).
Mayon (Philippines) — October 2023 Cite this Report
Mayon
Philippines
13.257°N, 123.685°E; summit elev. 2462 m
All times are local (unless otherwise noted)
Lava flows, pyroclastic flows, ash emissions, and seismicity during April-September 2023
Mayon is located in the Philippines and has steep upper slopes capped by a small summit crater. Historical eruptions date back to 1616 CE that have been characterized by Strombolian eruptions, lava flows, pyroclastic flows, and mudflows. Eruptions mostly originated from a central conduit. Pyroclastic flows and mudflows have commonly descended many of the approximately 40 drainages that surround the volcano. The most recent eruption occurred during June through October 2022 and consisted of lava dome growth and gas-and-steam emissions (BGVN 47:12). A new eruption was reported during late April 2023 and has included lava flows, pyroclastic density currents, ash emissions, and seismicity. This report covers activity during April through September 2023 based on daily bulletins from the Philippine Institute of Volcanology and Seismology (PHIVOLCS).
During April through September 2023, PHIVOLCS reported near-daily rockfall events, frequent volcanic earthquakes, and sulfur dioxide measurements. Gas-and-steam emissions rose 100-900 m above the crater and drifted in different directions. Nighttime crater incandescence was often visible during clear weather and was accompanied by incandescent avalanches of material. Activity notably increased during June when lava flows were reported on the S, SE, and E flanks (figure 52). The MIROVA graph (Middle InfraRed Observation of Volcanic Activity) showed strong thermal activity coincident with these lava flows, which remained active through September (figure 53). According to the MODVOLC thermal algorithm, a total of 110 thermal alerts were detected during the reporting period: 17 during June, 40 during July, 27 during August, and 26 during September. During early June, pyroclastic density currents (PDCs) started to occur more frequently.
Low activity was reported during much of April and May; gas-and-steam emissions rose 100-900 m above the crater and generally drifted in different directions. A total of 52 rockfall events and 18 volcanic earthquakes were detected during April and 147 rockfall events and 13 volcanic events during May. Sulfur dioxide flux measurements ranged between 400-576 tons per day (t/d) during April, the latter of which was measured on 29 April and between 162-343 t/d during May, the latter of which was measured on 13 May.
Activity during June increased, characterized by lava flows, pyroclastic density currents (PDCs), crater incandescence and incandescent rockfall events, gas-and-steam emissions, and continued seismicity. Weather clouds often prevented clear views of the summit, but during clear days, moderate gas-and-steam emissions rose 100-2,500 m above the crater and drifted in multiple directions. A total of 6,237 rockfall events and 288 volcanic earthquakes were detected. The rockfall events often deposited material on the S and SE flanks within 700-1,500 m of the summit crater and ash from the events drifted SW, S, SE, NE, and E. Sulfur dioxide emissions ranged between 149-1,205 t/d, the latter of which was measured on 10 June. Short-term observations from EDM and electronic tiltmeter monitoring indicated that the upper slopes were inflating since February 2023. Longer-term ground deformation parameters based on EDM, precise leveling, continuous GPS, and electronic tilt monitoring indicated that the volcano remained inflated, especially on the NW and SE flanks. At 1000 on 5 June the Volcano Alert Level (VAL) was raised to 2 (on a 0-5 scale). PHIVOLCS noted that although low-level volcanic earthquakes, ground deformation, and volcanic gas emissions indicated unrest, the steep increase in rockfall frequency may indicate increased dome activity.
A total of 151 dome-collapse PDCs occurred during 8-9 and 11-30 June, traveled 500-2,000 m, and deposited material on the S flank within 2 km of the summit crater. During 8-9 June the VAL was raised to 3. At approximately 1947 on 11 June lava flow activity was reported; two lobes traveled within 500 m from the crater and deposited material on the S (Mi-isi), SE (Bonga), and E (Basud) flanks. Weak seismicity accompanied the lava flow and slight inflation on the upper flanks. This lava flow remained active through 30 June, moving down the S and SE flank as far as 2.5 km and 1.8 km, respectively and depositing material up to 3.3 km from the crater. During 15-16 June traces of ashfall from the PDCs were reported in Sitio Buga, Nabonton, City of Ligao and Purok, and San Francisco, Municipality of Guinobatan. During 28-29 June there were two PDCs generated by the collapse of the lava flow front, which generated a light-brown ash plume 1 km high. Satellite monitors detected significant concentrations of sulfur dioxide beginning on 29 June. On 30 June PDCs primarily affected the Basud Gully on the E flank, the largest of which occurred at 1301 and lasted eight minutes, based on the seismic record. Four PDCs generated between 1800 and 2000 that lasted approximately four minutes each traveled 3-4 km on the E flank and generated an ash plume that rose 1 km above the crater and drifted N and NW. Ashfall was recorded in Tabaco City.
Similar strong activity continued during July; slow lava effusion remained active on the S and SE flanks and traveled as far as 2.8 km and 2.8 km, respectively and material was deposited as far as 4 km from the crater. There was a total of 6,983 rockfall events and 189 PDCs that affected the S, SE, and E flanks. The volcano network detected a total of 2,124 volcanic earthquakes. Continuous gas-and-steam emissions rose 200-2,000 m above the crater and drifted in multiple directions. Sulfur dioxide emissions averaged 792-4,113 t/d, the latter of which was measured on 28 July. During 2-4 July three PDCs were generated from the collapse of the lava flow and resulting light brown plumes rose 200-300 m above the crater. Continuous tremor pulses were reported beginning at 1547 on 3 July through 7 July at 1200, at 2300 on 8 July and going through 0300 on 10 July, and at 2300 on 16 July, as recorded by the seismic network. During 6-9 July there were 10 lava flow-collapse-related PDCs that generated light brown plumes 300-500 m above the crater. During 10-11 July light ashfall was reported in some areas of Mabinit, Legazpi City, Budiao and Salvacion, Daraga, and Camalig, Albay. By 18 July the lava flow advanced 600 m on the E flank as well.
During 1733 on 18 July and 0434 on 19 July PHIVOLCS reported 30 “ashing” events, which are degassing events accompanied by audible thunder-like sounds and entrained ash at the crater, which produced short, dark plumes that drifted SW. These events each lasted 20-40 seconds, and plume heights ranged from 150-300 m above the crater, as recorded by seismic, infrasound, visual, and thermal monitors. Three more ashing events occurred during 19-20 July. Short-term observations from electronic tilt and GPS monitoring indicate deflation on the E lower flanks in early July and inflation on the NW middle flanks during the third week of July. Longer-term ground deformation parameters from EDM, precise leveling, continuous GPS, and electronic tilt monitoring indicated that the volcano was still generally inflated relative to baseline levels. A short-lived lava pulse lasted 28 seconds at 1956 on 21 July, which was accompanied by seismic and infrasound signals. By 22 July, the only lava flow that remained active was on the SE flank, and continued to extend 3.4 km, while those on the S and E flanks weakened markedly. One ashing event was detected during 30-31 July, whereas there were 57 detected during 31 July-1 August; according to PHIVOLCS beginning at approximately 1800 on 31 July eruptive activity was dominated by phases of intermittent ashing, as well as increased in the apparent rates of lava effusion from the summit crater. The ashing phases consisted of discrete events recorded as low-frequency volcanic earthquakes (LFVQ) typically 30 seconds in duration, based on seismic and infrasound signals. Gray ash plume rose 100 m above the crater and generally drifted NE. Shortly after these ashing events began, new lava began to effuse rapidly from the crater, feeding the established flowed on the SE, E, and E flanks and generating frequent rockfall events.
Intensified unrest persisted during August. There was a total of 4,141 rockfall events, 2,881 volcanic earthquakes, which included volcanic tremor events, 32 ashing events, and 101 PDCs detected throughout the month. On clear weather days, gas-and-steam emissions rose 300-1,500 m above the crater and drifted in different directions (figure 54). Sulfur dioxide emissions averaged 735-4,756 t/d, the higher value of which was measured on 16 August. During 1-2 August the rate of lava effusion decreased, but continued to feed the flows on the SE, S, and E flanks, maintaining their advances to 3.4 km, 2.8 km, and 1.1 km from the crater, respectively (figure 55). Rockfall and PDCs generated by collapses at the lava flow margins and from the summit dome deposited material within 4 km of the crater. During 3-4 August there were 10 tremor events detected that lasted 1-4 minutes. Short-lived lava pulse lasted 35 seconds and was accompanied by seismic and infrasound signals at 0442 on 6 August. Seven collapses were recorded at the front of the lava flow during 12-14 August.
During September, similar activity of slow lava effusion, PDCs, gas-and-steam emissions, and seismicity continued. There was a total of 4,452 rockfall events, 329 volcanic earthquakes, which included volcanic tremor events, two ashing events, and 85 PDCs recorded throughout the month. On clear weather days, gas-and-steam emissions rose 100-1,500 m above the crater and drifted in multiple directions. Sulfur dioxide emissions averaged 609-2,252 t/d, the higher average of which was measured on 6 September. Slow lava effusion continued advancing on the SE, S, and E flanks, maintaining lengths of 3.4 km, 2.8 km, and 1.1 km, respectively. Rockfall and PDC events generated by collapses along the lava flow margins and at the summit dome deposited material within 4 km of the crater.
Geologic Background. Symmetrical Mayon, which rises above the Albay Gulf NW of Legazpi City, is the most active volcano of the Philippines. The steep upper slopes are capped by a small summit crater. Recorded eruptions since 1616 CE range from Strombolian to basaltic Plinian, with cyclical activity beginning with basaltic eruptions, followed by longer periods of andesitic lava flows. Eruptions occur predominately from the central conduit and have also produced lava flows that travel far down the flanks. Pyroclastic density currents and mudflows have commonly swept down many of the approximately 40 ravines that radiate from the summit and have often damaged populated lowland areas. A violent eruption in 1814 killed more than 1,200 people and devastated several towns.
Information Contacts: Philippine Institute of Volcanology and Seismology (PHIVOLCS), Department of Science and Technology, University of the Philippines Campus, Diliman, Quezon City, Philippines (URL: http://www.phivolcs.dost.gov.ph/); MIROVA (Middle InfraRed Observation of Volcanic Activity), a collaborative project between the Universities of Turin and Florence (Italy) supported by the Centre for Volcanic Risk of the Italian Civil Protection Department (URL: http://www.mirovaweb.it/); Hawai'i Institute of Geophysics and Planetology (HIGP) - MODVOLC Thermal Alerts System, School of Ocean and Earth Science and Technology (SOEST), Univ. of Hawai'i, 2525 Correa Road, Honolulu, HI 96822, USA (URL: http://modis.higp.hawaii.edu/); Copernicus Browser, Copernicus Data Space Ecosystem, European Space Agency (URL: https://dataspace.copernicus.eu/browser/); William Rogers, Legazpi City, Albay Province, Philippines.
Nishinoshima (Japan) — October 2023 Cite this Report
Nishinoshima
Japan
27.247°N, 140.874°E; summit elev. 100 m
All times are local (unless otherwise noted)
Eruption plumes and gas-and-steam plumes during May-August 2023
Nishinoshima, located about 1,000 km S of Tokyo, is a small island in the Ogasawara Arc in Japan. The island is the summit of a massive submarine volcano that has prominent submarine peaks to the S, W, and NE. Eruptions date back to 1973 and the current eruption period began in October 2022. Recent activity has consisted of small ash plumes and fumarolic activity (BGVN 48:07). This report covers activity during May through August 2023, using information from monthly reports of the Japan Meteorological Agency (JMA) monthly reports and satellite data.
Activity during May through June was relatively low. The Japan Coast Guard (JCG) did overflights on 14 and 22 June and reported white gas-and-steam emissions rising 600 m and 1,200 m from the central crater of the pyroclastic cone, respectively (figure 125). In addition, multiple white gas-and-steam emissions rose from the inner rim of the W side of the crater and from the SE flank of the pyroclastic cone. Discolored brown-to-green water was observed around almost the entire perimeter of the island; on 22 June light green discolored water was observed off the S coast of the island.
Observations from the Himawari meteorological satellite confirmed an eruption on 9 and 10 July. An eruption plume rose 1.6 km above the crater and drifted N around 1300 on 9 July. Satellite images acquired at 1420 and 2020 on 9 July and at 0220 on 10 July showed continuing emissions that rose 1.3-1.6 km above the crater and drifted NE and N. The Tokyo VAAC reported that an ash plume seen by a pilot and identified in a satellite image at 0630 on 21 July rose to 3 km altitude and drifted S.
Aerial observations conducted by JCG on 8 August showed a white-and-gray plume rising from the central crater of the pyroclastic cone, and multiple white gas-and-steam emissions were rising from the inner edge of the western crater and along the NW-SE flanks of the island (figure 126). Brown-to-green discolored water was also noted around the perimeter of the island.
Intermittent low-to-moderate power thermal anomalies were recorded in the MIROVA graph (Middle InfraRed Observation of Volcanic Activity), showing an increase in both frequency and power beginning in July (figure 127). This increase in activity coincides with eruptive activity on 9 and 10 July, characterized by eruption plumes. According to the MODVOLC thermal alert algorithm, one thermal hotspot was recorded on 20 July. Weak thermal anomalies were also detected in infrared satellite imagery, accompanied by strong gas-and-steam plumes (figure 128).
Geologic Background. The small island of Nishinoshima was enlarged when several new islands coalesced during an eruption in 1973-74. Multiple eruptions that began in 2013 completely covered the previous exposed surface and continued to enlarge the island. The island is the summit of a massive submarine volcano that has prominent peaks to the S, W, and NE. The summit of the southern cone rises to within 214 m of the ocean surface 9 km SSE.
Information Contacts: Japan Meteorological Agency (JMA), 1-3-4 Otemachi, Chiyoda-ku, Tokyo 100-8122, Japan (URL: http://www.jma.go.jp/jma/indexe.html); Tokyo Volcanic Ash Advisory Center (VAAC), 1-3-4 Otemachi, Chiyoda-ku, Tokyo 100-8122, Japan (URL: http://ds.data.jma.go.jp/svd/vaac/data/); MIROVA (Middle InfraRed Observation of Volcanic Activity), a collaborative project between the Universities of Turin and Florence (Italy) supported by the Centre for Volcanic Risk of the Italian Civil Protection Department (URL: http://www.mirovaweb.it/); Copernicus Browser, Copernicus Data Space Ecosystem, European Space Agency (URL: https://dataspace.copernicus.eu/browser/).
Krakatau (Indonesia) — October 2023 Cite this Report
Krakatau
Indonesia
6.1009°S, 105.4233°E; summit elev. 285 m
All times are local (unless otherwise noted)
White gas-and-steam plumes and occasional ash plumes during May-August 2023
Krakatau is located in the Sunda Strait between Java and Sumatra, Indonesia. Caldera collapse during the catastrophic 1883 eruption destroyed Danan and Perbuwatan cones and left only a remnant of Rakata. The post-collapse cone of Anak Krakatau (Child of Krakatau) was constructed within the 1883 caldera at a point between the former Danan and Perbuwatan cones; it has been the site of frequent eruptions since 1927. The current eruption period began in May 2021 and has recently consisted of Strombolian eruptions and ash plumes (BGVN 48:07). This report describes lower levels of activity consisting of ash and white gas-and-steam plumes during May through August 2023, based on information provided by the Indonesian Center for Volcanology and Geological Hazard Mitigation, referred to as Pusat Vulkanologi dan Mitigasi Bencana Geologi (PVMBG), MAGMA Indonesia, and satellite data.
Activity was relatively low during May and June. Daily white gas-and-steam emissions rose 25-200 m above the crater and drifted in different directions. Five ash plumes were detected at 0519 on 10 May, 1241 on 11 May, 0920 on 12 May, 2320 on 12 May, and at 0710 on 13 May, and rose 1-2.5 km above the crater and drifted SW. A webcam image taken on 12 May showed ejection of incandescent material above the vent. A total of nine ash plumes were detected during 6-11 June: at 1434 and 00220 on 6 and 7 June the ash plumes rose 500 m above the crater and drifted NW, at 1537 on 8 June the ash plume rose 1 km above the crater and drifted SW, at 0746 and at 0846 on 9 June the ash plumes rose 800 m and 3 km above the crater and drifted SW, respectively, at 0423, 1431, and 1750 on 10 June the ash plumes rose 2 km, 1.5 km, and 3.5 km above the crater and drifted NW, respectively, and at 0030 on 11 June an ash plume rose 2 km above the crater and drifted NW. Webcam images taken on 10 and 11 June at 0455 and 0102, respectively, showed incandescent material ejected above the vent. On 19 June an ash plume at 0822 rose 1.5 km above the crater and drifted SE.
Similar low activity of white gas-and-steam emissions and few ash plumes were reported during July and August. Daily white gas-and-steam emissions rose 25-300 m above the crater and drifted in multiple directions. Three ash plumes were reported at 0843, 0851, and 0852 on 20 July that rose 500-2,000 m above the crater and drifted NW.
The MIROVA (Middle InfraRed Observation of Volcanic Activity) graph of MODIS thermal anomaly data showed intermittent low-to-moderate power thermal anomalies during May through August 2023 (figure 140). Although activity was often obscured by weather clouds, a thermal anomaly was visible in an infrared satellite image of the crater on 12 May, accompanied by an eruption plume that drifted SW (figure 141).
Geologic Background. The renowned Krakatau (frequently mis-named as Krakatoa) volcano lies in the Sunda Strait between Java and Sumatra. Collapse of an older edifice, perhaps in 416 or 535 CE, formed a 7-km-wide caldera. Remnants of that volcano are preserved in Verlaten and Lang Islands; subsequently the Rakata, Danan, and Perbuwatan cones were formed, coalescing to create the pre-1883 Krakatau Island. Caldera collapse during the catastrophic 1883 eruption destroyed Danan and Perbuwatan, and left only a remnant of Rakata. This eruption caused more than 36,000 fatalities, most as a result of tsunamis that swept the adjacent coastlines of Sumatra and Java. Pyroclastic surges traveled 40 km across the Sunda Strait and reached the Sumatra coast. After a quiescence of less than a half century, the post-collapse cone of Anak Krakatau (Child of Krakatau) was constructed within the 1883 caldera at a point between the former Danan and Perbuwatan cones. Anak Krakatau has been the site of frequent eruptions since 1927.
Information Contacts: Pusat Vulkanologi dan Mitigasi Bencana Geologi (PVMBG, also known as Indonesian Center for Volcanology and Geological Hazard Mitigation, CVGHM), Jalan Diponegoro 57, Bandung 40122, Indonesia (URL: http://www.vsi.esdm.go.id/); MAGMA Indonesia, Kementerian Energi dan Sumber Daya Mineral (URL: https://magma.esdm.go.id/v1); MIROVA (Middle InfraRed Observation of Volcanic Activity), a collaborative project between the Universities of Turin and Florence (Italy) supported by the Centre for Volcanic Risk of the Italian Civil Protection Department (URL: http://www.mirovaweb.it/); Copernicus Browser, Copernicus Data Space Ecosystem, European Space Agency (URL: https://dataspace.copernicus.eu/browser/).
Villarrica (Chile) — October 2023 Cite this Report
Villarrica
Chile
39.42°S, 71.93°W; summit elev. 2847 m
All times are local (unless otherwise noted)
Strombolian activity, gas-and-ash emissions, and crater incandescence during April-September 2023
Villarrica, in central Chile, consists of a 2-km-wide caldera that formed about 3,500 years ago and is located at the base of the presently active cone at the NW margin of a 6-km-wide caldera. Historical eruptions eruptions date back to 1558 and have been characterized by mild-to-moderate explosive activity with occasional lava effusions. The current eruption period began in December 2014 and has recently consisted of nighttime crater incandescence, ash emissions, and seismicity (BGVN 48:04). This report covers activity during April through September 2023 and describes occasional Strombolian activity, gas-and-ash emissions, and nighttime crater incandescence. Information for this report primarily comes from the Southern Andes Volcano Observatory (Observatorio Volcanológico de Los Andes del Sur, OVDAS), part of Chile's National Service of Geology and Mining (Servicio Nacional de Geología y Minería, SERNAGEOMIN) and satellite data.
Seismicity during April consisted of long period (LP) events and tremor (TRE); a total of 9,413 LP-type events and 759 TR-type events were detected throughout the month. Nighttime crater incandescence persisted and was visible in the degassing column. Sulfur dioxide data was obtained using Differential Absorption Optical Spectroscopy Equipment (DOAS) that showed an average value of 1,450 ± 198 tons per day (t/d) during 1-15 April and 1,129 ± 201 t/d during 16-30 April, with a maximum daily value of 2,784 t/d on 9 April. Gas-and-steam emissions of variable intensities rose above the active crater as high as 1.3 km above the crater on 13 April. Strombolian explosions were not observed and there was a slight decrease in the lava lake level.
There were 14,123 LP-type events and 727 TR-type events detected during May. According to sulfur dioxide measurements taken with DOAS equipment, the active crater emitted an average value of 1,826 ± 482 t/d during 1-15 May and 912 ± 41 t/d during 16-30 May, with a daily maximum value of 5,155 t/d on 13 May. Surveillance cameras showed continuous white gas-and-steam emissions that rose as high as 430 m above the crater on 27 May. Nighttime incandescence illuminated the gas column less than 300 m above the crater rim was and no pyroclastic emissions were reported. A landslide was identified on 13 May on the E flank of the volcano 50 m from the crater rim and extending 300 m away; SERNAGEOMIN noted that this event may have occurred on 12 May. During the morning of 27 and 28 May minor Strombolian explosions characterized by incandescent ejecta were recorded at the crater rim; the last reported Strombolian explosions had occurred at the end of March.
Seismic activity during June consisted of five volcano-tectonic (VT)-type events, 21,606 LP-type events, and 2,085 TR-type events. The average value of sulfur dioxide flux obtained by DOAS equipment was 1,420 ± 217 t/d during 1-15 June and 2,562 ± 804 t/d, with a maximum daily value of 4,810 t/d on 17 June. White gas-and-steam emissions rose less than 480 m above the crater; frequent nighttime crater incandescence was reflected in the degassing plume. On 12 June an emission rose 100 m above the crater and drifted NNW. On 15 June one or several emissions resulted in ashfall to the NE as far as 5.5 km from the crater, based on a Skysat satellite image. Several Strombolian explosions occurred within the crater; activity on 15 June was higher energy and ejected blocks 200-300 m on the NE slope. Surveillance cameras showed white gas-and-steam emissions rising 480 m above the crater on 16 June. On 19 and 24 June low-intensity Strombolian activity was observed, ejecting material as far as 200 m from the center of the crater to the E.
During July, seismicity included 29,319 LP-type events, 3,736 TR-type events, and two VT-type events. DOAS equipment recorded two days of sulfur dioxide emissions of 4,220 t/d and 1,009 t/d on 1 and 13 July, respectively. Constant nighttime incandescence was also recorded and was particularly noticeable when accompanied by eruptive columns on 12 and 16 July. Minor explosive events were detected in the crater. According to Skysat satellite images taken on 12, 13, and 16 July, ashfall deposits were identified 155 m S of the crater. According to POVI, incandescence was visible from two vents on the crater floor around 0336 on 12 July. Gas-and-ash emissions rose as high as 1.2 km above the crater on 13 July and drifted E and NW. A series of gas-and-steam pulses containing some ash deposited material on the upper E flank around 1551 on 13 July. During 16-31 July, average sulfur dioxide emissions of 1,679 ± 406 t/d were recorded, with a maximum daily value of 2,343 t/d on 28 July. Fine ash emissions were also reported on 16, 17, and 23 July.
Seismicity persisted during August, characterized by 27,011 LP-type events, 3,323 TR-type events, and three VT-type events. The average value of sulfur dioxide measurements taken during 1-15 August was 1,642 ± 270 t/d and 2,207 ± 4,549 t/d during 16-31 August, with a maximum daily value of 3,294 t/d on 27 August. Nighttime crater incandescence remained visible in degassing columns. White gas-and-steam emissions rose 480 m above the crater on 6 August. According to a Skysat satellite image from 6 August, ash accumulation was observed proximal to the crater and was mainly distributed toward the E slope. White gas-and-steam emissions rose 320 m above the crater on 26 August. Nighttime incandescence and Strombolian activity that generated ash emissions were reported on 27 August.
Seismicity during September was characterized by five VT-type events, 12,057 LP-type events, and 2,058 TR-type events. Nighttime incandescence persisted. On 2 September an ash emission rose 180 m above the crater and drifted SE at 1643 (figure 125) and a white gas-and-steam plume rose 320 m above the crater. According to the Buenos Aires VAAC, periods of continuous gas-and-ash emissions were visible in webcam images from 1830 on 2 September to 0110 on 3 September. Strombolian activity was observed on 2 September and during the early morning of 3 September, the latter event of which generated an ash emission that rose 60 m above the crater and drifted 100 m from the center of the crater to the NE and SW. Ashfall was reported to the SE and S as far as 750 m from the crater. The lava lake was active during 3-4 September and lava fountaining was visible for the first time since 26 March 2023, according to POVI. Fountains captured in webcam images at 2133 on 3 September and at 0054 on 4 September rose as high as 60 m above the crater rim and ejected material onto the upper W flank. Sulfur dioxide flux of 1,730 t/d and 1,281 t/d was measured on 3 and 4 September, respectively, according to data obtained by DOAS equipment.
Strong Strombolian activity and larger gas-and-ash plumes were reported during 18-20 September. On 18 September activity was also associated with energetic LP-type events and notable sulfur dioxide fluxes (as high as 4,277 t/d). On 19 September Strombolian activity and incandescence were observed. On 20 September at 0914 ash emissions rose 50 m above the crater and drifted SSE, accompanied by Strombolian activity that ejected material less than 100 m SSE, causing fall deposits on that respective flank. SERNAGEOMIN reported that a Planet Scope satellite image taken on 20 September showed the lava lake in the crater, measuring 32 m x 35 m and an area of 0.001 km2. Several ash emissions were recorded at 0841, 0910, 1251, 1306, 1312, 1315, and 1324 on 23 September and rose less than 150 m above the crater. The sulfur dioxide flux value was 698 t/d on 23 September and 1,097 t/d on 24 September. On 24 September the Volcanic Alert Level (VAL) was raised to Orange (the third level on a four-color scale). SENAPRED maintained the Alert Level at Yellow (the middle level on a three-color scale) for the communities of Villarrica, Pucón (16 km N), Curarrehue, and Panguipulli.
During 24-25 September there was an increase in seismic energy (observed at TR-events) and acoustic signals, characterized by 1 VT-type event, 213 LP-type events, and 124 TR-type events. Mainly white gas-and-steam emissions, in addition to occasional fine ash emissions were recorded. During the early morning of 25 September Strombolian explosions were reported and ejected material 250 m in all directions, though dominantly toward the NW. On 25 September the average value of sulfur dioxide flux was 760 t/d. Seismicity during 25-30 September consisted of five VT-type events, 1,937 LP-type events, and 456 TR-type events.
During 25-29 September moderate Strombolian activity was observed and ejected material as far as the crater rim. In addition, ash pulses lasting roughly 50 minutes were observed around 0700 and dispersed ENE. During 26-27 September a TR episode lasted 6.5 hours and was accompanied by discrete acoustic signals. Satellite images from 26 September showed a spatter cone on the crater floor with one vent that measured 10 x 14 m and a smaller vent about 35 m NE of the cone. SERNAGEOMIN reported an abundant number of bomb-sized blocks up to 150 m from the crater, as well as impact marks on the snow, which indicated explosive activity. A low-altitude ash emission was observed drifting NW around 1140 on 28 September, based on webcam images. Between 0620 and 0850 on 29 September an ash emission rose 60 m above the crater and drifted NW. During an overflight taken around 1000 on 29 September scientists observed molten material in the vent, a large accumulation of pyroclasts inside the crater, and energetic degassing, some of which contained a small amount of ash. Block-sized pyroclasts were deposited on the internal walls and near the crater, and a distal ash deposit was also visible. The average sulfur dioxide flux measured on 28 September was 344 t/d. Satellite images taken on 29 September ashfall was deposited roughly 3 km WNW from the crater and nighttime crater incandescence remained visible. The average sulfur dioxide flux value from 29 September was 199 t/d. On 30 September at 0740 a pulsating ash emission rose 1.1 km above the crater and drifted NNW (figure 126). Deposits on the S flank extended as far as 4.5 km from the crater rim, based on satellite images from 30 September.
Infrared MODIS satellite data processed by MIROVA (Middle InfraRed Observation of Volcanic Activity) showed intermittent thermal activity during April through September, with slightly stronger activity detected during late September (figure 127). Small clusters of thermal activity were detected during mid-June, early July, early August, and late September. According to the MODVOLC thermal alert system, a total of four thermal hotspots were detected on 7 July and 3 and 23 September. This activity was also intermittently captured in infrared satellite imagery on clear weather days (figure 128).
Geologic Background. The glacier-covered Villarrica stratovolcano, in the northern Lakes District of central Chile, is ~15 km south of the city of Pucon. A 2-km-wide caldera that formed about 3,500 years ago is located at the base of the presently active, dominantly basaltic to basaltic andesite cone at the NW margin of a 6-km-wide Pleistocene caldera. More than 30 scoria cones and fissure vents are present on the flanks. Plinian eruptions and pyroclastic flows that have extended up to 20 km from the volcano were produced during the Holocene. Lava flows up to 18 km long have issued from summit and flank vents. Eruptions documented since 1558 CE have consisted largely of mild-to-moderate explosive activity with occasional lava effusion. Glaciers cover 40 km2 of the volcano, and lahars have damaged towns on its flanks.
Information Contacts: Servicio Nacional de Geología y Minería (SERNAGEOMIN), Observatorio Volcanológico de Los Andes del Sur (OVDAS), Avda Sta María No. 0104, Santiago, Chile (URL: http://www.sernageomin.cl/); Proyecto Observación Villarrica Internet (POVI) (URL: http://www.povi.cl/); Sistema y Servicio Nacional de Prevención y Repuesta Ante Desastres (SENAPRED), Av. Beauchef 1671, Santiago, Chile (URL: https://web.senapred.cl/); Buenos Aires Volcanic Ash Advisory Center (VAAC), Servicio Meteorológico Nacional-Fuerza Aérea Argentina, 25 de mayo 658, Buenos Aires, Argentina (URL: http://www.smn.gov.ar/vaac/buenosaires/inicio.php); MIROVA (Middle InfraRed Observation of Volcanic Activity), a collaborative project between the Universities of Turin and Florence (Italy) supported by the Centre for Volcanic Risk of the Italian Civil Protection Department (URL: http://www.mirovaweb.it/); Hawai'i Institute of Geophysics and Planetology (HIGP) - MODVOLC Thermal Alerts System, School of Ocean and Earth Science and Technology (SOEST), Univ. of Hawai'i, 2525 Correa Road, Honolulu, HI 96822, USA (URL: http://modis.higp.hawaii.edu/); Copernicus Browser, Copernicus Data Space Ecosystem, European Space Agency (URL: https://dataspace.copernicus.eu/browser/).
Merapi (Indonesia) — October 2023 Cite this Report
Merapi
Indonesia
7.54°S, 110.446°E; summit elev. 2910 m
All times are local (unless otherwise noted)
Frequent incandescent avalanches during April-September 2023
Merapi, located just north of the major city of Yogyakarta in central Java, Indonesia, has had activity within the last 20 years characterized by pyroclastic flows and lahars accompanying growth and collapse of the steep-sided active summit lava dome. The current eruption period began in late December 2020 and has more recently consisted of ash plumes, intermittent incandescent avalanches of material, and pyroclastic flows (BGVN 48:04). This report covers activity during April through September 2023, based on information from Balai Penyelidikan dan Pengembangan Teknologi Kebencanaan Geologi (BPPTKG), the Center for Research and Development of Geological Disaster Technology, a branch of PVMBG which specifically monitors Merapi. Additional information comes from the Pusat Vulkanologi dan Mitigasi Bencana Geologi (PVMBG, also known as Indonesian Center for Volcanology and Geological Hazard Mitigation, CVGHM), MAGMA Indonesia, the Darwin Volcanic Ash Advisory Centre (VAAC), and various satellite data.
Activity during April through September 2023 primarily consisted of incandescent avalanches of material that mainly affected the SW and W flanks and traveled as far as 2.3 km from the summit (table 25) and white gas-and-steam emissions that rose 10-1,000 m above the crater.
Table 25. Monthly summary of avalanches and avalanche distances recorded at Merapi during April through September 2023. The number of reported avalanches does not include instances where possible avalanches were heard but could not be visually confirmed as a result of inclement weather. Data courtesy of BPPTKG (April-September 2023 daily reports).
| Month |
Average number of avalanches per day |
Distance avalanches traveled (m) |
| Apr 2023 |
19 |
1,200-2,000 |
| May 2023 |
22 |
500-2,000 |
| Jun 2023 |
18 |
1,200-2,000 |
| Jul 2023 |
30 |
300-2,000 |
| Aug 2023 |
25 |
400-2,300 |
| Sep 2023 |
23 |
600-2,000 |
BPPTKG reported that during April and May white gas-and-steam emissions rose 10-750 m above the crater, incandescent avalanches descended 500-2,000 m on the SW and W flanks (figure 135). Cloudy weather often prevented clear views of the summit, and sometimes avalanches could not be confirmed. According to a webcam image, a pyroclastic flow was visible on 17 April at 0531. During the week of 28 April and 4 May a pyroclastic flow was reported on the SW flank, traveling up to 2.5 km. According to a drone overflight taken on 17 May the SW lava dome volume was an estimated 2,372,800 cubic meters and the dome in the main crater was an estimated 2,337,300 cubic meters.
During June and July similar activity persisted with white gas-and-steam emissions rising 10-350 m above the crater and frequent incandescent avalanches that traveled 300-2,000 m down the SW, W, and S flanks (figure 136). Based on an analysis of aerial photos taken on 24 June the volume of the SW lava dome was approximately 2.5 million cubic meters. A pyroclastic flow was observed on 5 July that traveled 2.7 km on the SW flank. According to the Darwin VAAC multiple minor ash plumes were identified in satellite images on 19 July that rose to 3.7 km altitude and drifted S and SW. During 22, 25, and 26 July a total of 17 avalanches descended as far as 1.8 km on the S flank.
Frequent white gas-and-steam emissions continued during August and September, rising 10-450 m above the crater. Incandescent avalanches mainly affected the SW and W flanks and traveled 400-2,300 m from the vent (figure 137). An aerial survey conducted on 10 August was analyzed and reported that estimates of the SW dome volume was 2,764,300 cubic meters and the dome in the main crater was 2,369,800 cubic meters.
Frequent and moderate-power thermal activity continued throughout the reporting period, according to a MIROVA (Middle InfraRed Observation of Volcanic Activity) analysis of MODIS satellite data (figure 138). There was an increase in the number of detected anomalies during mid-May. The MODVOLC thermal algorithm recorded a total of 47 thermal hotspots: six during April, nine during May, eight during June, 15 during July, four during August, and five during September. Some of this activity was captured in infrared satellite imagery on clear weather days, sometimes accompanied by incandescent material on the SW flank (figure 139).
Geologic Background. Merapi, one of Indonesia's most active volcanoes, lies in one of the world's most densely populated areas and dominates the landscape immediately north of the major city of Yogyakarta. It is the youngest and southernmost of a volcanic chain extending NNW to Ungaran volcano. Growth of Old Merapi during the Pleistocene ended with major edifice collapse perhaps about 2,000 years ago, leaving a large arcuate scarp cutting the eroded older Batulawang volcano. Subsequent growth of the steep-sided Young Merapi edifice, its upper part unvegetated due to frequent activity, began SW of the earlier collapse scarp. Pyroclastic flows and lahars accompanying growth and collapse of the steep-sided active summit lava dome have devastated cultivated lands on the western-to-southern flanks and caused many fatalities.
Information Contacts: Balai Penyelidikan dan Pengembangan Teknologi Kebencanaan Geologi (BPPTKG), Center for Research and Development of Geological Disaster Technology (URL: http://merapi.bgl.esdm.go.id/, Twitter: @BPPTKG); MAGMA Indonesia, Kementerian Energi dan Sumber Daya Mineral (URL: https://magma.esdm.go.id/v1); Pusat Vulkanologi dan Mitigasi Bencana Geologi (PVMBG, also known as Indonesian Center for Volcanology and Geological Hazard Mitigation, CVGHM), Jalan Diponegoro 57, Bandung 40122, Indonesia (URL: http://www.vsi.esdm.go.id/); Darwin Volcanic Ash Advisory Centre (VAAC), Bureau of Meteorology, Northern Territory Regional Office, PO Box 40050, Casuarina, NT 0811, Australia (URL: http://www.bom.gov.au/info/vaac/); MIROVA (Middle InfraRed Observation of Volcanic Activity), a collaborative project between the Universities of Turin and Florence (Italy) supported by the Centre for Volcanic Risk of the Italian Civil Protection Department (URL: http://www.mirovaweb.it/); Hawai'i Institute of Geophysics and Planetology (HIGP) - MODVOLC Thermal Alerts System, School of Ocean and Earth Science and Technology (SOEST), Univ. of Hawai'i, 2525 Correa Road, Honolulu, HI 96822, USA (URL: http://modis.higp.hawaii.edu/); Copernicus Browser, Copernicus Data Space Ecosystem, European Space Agency (URL: https://dataspace.copernicus.eu/browser/); Øystein Lund Andersen (URL: https://www.oysteinlundandersen.com/, https://twitter.com/oysteinvolcano).
Ebeko
Russia
50.686°N, 156.014°E; summit elev. 1103 m
All times are local (unless otherwise noted)
Moderate explosive activity with ash plumes continued during June-November 2023
Ebeko, located on the N end of Paramushir Island in Russia’s Kuril Islands just S of the Kamchatka Peninsula, consists of three summit craters along a SSW-NNE line at the northern end of a complex of five volcanic cones. Observed eruptions date back to the late 18th century and have been characterized as small-to-moderate explosions from the summit crater, accompanied by intense fumarolic activity. The current eruptive period began in June 2022, consisting of frequent explosions, ash plumes, and thermal activity (BGVN 47:10, 48:06). This report covers similar activity during June-November 2023, based on information from the Kamchatka Volcanic Eruptions Response Team (KVERT) and satellite data.
Moderate explosive activity continued during June-November 2023 (figures 50 and 51). According to visual data from Severo-Kurilsk, explosions sent ash 2-3.5 km above the summit (3-4.5 km altitude) during most days during June through mid-September. Activity after mid-September was slightly weaker, with ash usually reaching less than 2 km above the summit. According to KVERT the volcano in October and November was, with a few exceptions, either quiet or obscured by clouds that prevented satellite observations. KVERT issued Volcano Observatory Notices for Aviation (VONA) on 8 and 12 June, 13 and 22 July, 3 and 21 August, and 31 October warning of potential aviation hazards from ash plumes drifting 3-15 km from the volcano. Based on satellite data, KVERT reported a persistent thermal anomaly whenever weather clouds permitted viewing.
Geologic Background. The flat-topped summit of the central cone of Ebeko volcano, one of the most active in the Kuril Islands, occupies the northern end of Paramushir Island. Three summit craters located along a SSW-NNE line form Ebeko volcano proper, at the northern end of a complex of five volcanic cones. Blocky lava flows extend west from Ebeko and SE from the neighboring Nezametnyi cone. The eastern part of the southern crater contains strong solfataras and a large boiling spring. The central crater is filled by a lake about 20 m deep whose shores are lined with steaming solfataras; the northern crater lies across a narrow, low barrier from the central crater and contains a small, cold crescentic lake. Historical activity, recorded since the late-18th century, has been restricted to small-to-moderate explosive eruptions from the summit craters. Intense fumarolic activity occurs in the summit craters, on the outer flanks of the cone, and in lateral explosion craters.
Information Contacts: Kamchatka Volcanic Eruptions Response Team (KVERT), Far Eastern Branch, Russian Academy of Sciences, 9 Piip Blvd., Petropavlovsk-Kamchatsky, 683006, Russia (URL: http://www.kscnet.ru/ivs/kvert/).
Search Bulletin Archive by Publication Date
Select a month and year from the drop-downs and click "Show Issue" to have that issue displayed in this tab.
The default month and year is the latest issue available.
Bulletin of the Global Volcanism Network - Volume 42, Number 04 (April 2017)
Managing Editor: Edward Venzke
Ahyi (United States)
Hydrothermal activity continues in December 2014
Alaid (Russia)
Ash plumes and lava flow, October 2015 to August 2016
Cleveland (United States)
Growth and destruction of six lava domes between June 2014 and February 2017
Copahue (Chile-Argentina)
Eruptive activity consisting of Strombolian explosions and gas-and-ash plumes ends in late December 2016
Daikoku (United States)
Explorations in 2014 and 2016 reveal active hydrothermal plumes and sulfur chimney formation
Kerinci (Indonesia)
Brief ash eruptions in December 2011, June 2013, March-June 2016, and November 2016
Klyuchevskoy (Russia)
Mixed explosive and effusive eruption ongoing from August 2015 through March 2017
Pacaya (Guatemala)
Summary of 2004-2010 eruptions including a fatality in May 2010; lava flows in 2013-2014
Paluweh (Indonesia)
Two major pyroclastic flows in February and August 2013; five fatalities on 10 August 2013
Zhupanovsky (Russia)
Moderate ash plumes continued until 24 March, then an explosion on 20 November 2016
Ahyi (United States) — April 2017 Cite this Report
Ahyi
United States
20.42°N, 145.03°E; summit elev. -75 m
All times are local (unless otherwise noted)
Hydrothermal activity continues in December 2014
Ahyi seamount is one of a long string of submarine seamounts at the northern edge of the Northern Mariana Islands, part of the Mariana Back-arc segment of the Izu-Bonin trench in the western Pacific Ocean. The remote location of the seamount has made eruptions difficult to document, but seismic stations installed in the region confirmed an eruption in the vicinity in 2001. No further activity was reported until a new eruption was detected by seismic stations and felt by divers in the immediate area in April 2014. Volcanic activity in the Commonwealth of the Northern Mariana Islands is monitored by the US Geological Survey's Volcano Hazards Program, and observations are sometimes gathered by NOAA (National Oceanic and Atmospheric Administration) expeditions. The 2014 eruption and follow-up observations from December 2014 are summarized here.
The eruption at Ahyi seamount between 24 April and 17 May 2014 (BGVN 39:02; Haney et al., 2014) was first recorded as T-phase signals that were detected by various seismometers in the Mariana Islands. Submarine explosions were also heard and felt by NOAA scuba divers conducting coral reef research on the SE coastline of Farallon de Pajaros (Uracas) Island, about 20 km NW of Ahyi. In the same area, the NOAA crew reported sighting mats of orange-yellow bubbles on the water surface that extended up to 1 km from the shoreline. T-phase seismic signals registered across the Northern Mariana Islands (NMI) seismic network at a rate of approximately 10 per hour until 8 May, and then sporadically until 17 May (Haney et al., 2014).
During mid-May, the NOAA ship Hi'ialakai gathered multibeam sonar bathymetry and took three water-column CTD casts (Conductivity, Temperature, and Depth sensor; it gives scientists a precise and comprehensive charting of the distribution and variation of water temperature, salinity, and density). The May 2014 bathymetry revealed that the minimum depth to the summit was about 90 m, notably deeper than the 60 m measured during a 2003 survey. In addition a new crater about 100 m deep had formed at the summit, replacing the summit cone. Also, a distinct landslide chute descended the SE slope 2,300 m, removing material from the head and depositing debris at the base (see figure 4, BGVN 39:02). Significant particle plumes were detected with all three CTD casts, indicating ongoing hydrothermal activity. Plumes with optical anomalies up to 0.4 NTU (nephelometric turbidity units) were found S and W of Ahyi at 100-175 m water depth, corresponding to the depth of the new summit crater. NTU's are light backscattering measurements done by optical sensors in sea water to determine the presence of hydrothermal plumes in the water column.
On 4 December 2014, the NOAA Expedition "Submarine Ring of Fire 2014 – Ironman" visited Ahyi, and again used a CTD sensor to assess the hydrothermal status of the volcano. EM122 multibeam bathymetry data imaged CO2 gas bubbles rising from the summit (figure 5), and clearly revealed the new summit crater. When the CTD sensor and sampling package was lowered into the water, it measured a thick plume of particles indicating ongoing hydrothermal activity near 150 m depth, close to the base of the new crater that formed during the eruption in April-May 2014.
References: Haney, M. M., Chadwick, W., Merle, S. G., Buck, N. J., Butterfield, D. A., Coombs, M. L., Evers, L. G., Heaney, K. D., Lyons, J. J., Searcy, C. K., Walker, S. L., Young, C., and Embley, R. W., The 2014 Submarine Eruption of Ahyi Volcano, Northern Mariana Islands, American Geophysical Union, Fall Meeting 2014, abstract V11B-4727.
Geologic Background. Ahyi seamount is a large conical submarine volcano that rises to within 75 m of the ocean surface ~18 km SE of the island of Farallon de Pajaros in the northern Marianas. Water discoloration has been observed there, and in 1979 the crew of a fishing boat felt shocks over the summit area, followed by upwelling of sulfur-bearing water. On 24-25 April 2001 an explosive eruption was detected seismically by a station on Rangiroa Atoll, Tuamotu Archipelago. The event was well constrained (+/- 15 km) at a location near the southern base of Ahyi. An eruption in April-May 2014 was detected by NOAA divers, hydroacoustic sensors, and seismic stations.
Information Contacts: National Oceanic and Atmospheric Administration (NOAA), Office of Ocean Exploration and Research, 1315 East-West Highway, Silver Spring, Maryland, USA (URL: http://oceanexplorer.noaa.gov/welcome.html); US Geological Survey, Volcano Hazards Program (USGS-VHP), 12201 Sunrise Valley Drive, Reston, VA, USA (URL: https://volcanoes.usgs.gov/index.html).
Alaid
Russia
50.861°N, 155.565°E; summit elev. 2285 m
All times are local (unless otherwise noted)
Ash plumes and lava flow, October 2015 to August 2016
Russia's Alaid volcano, located just off the southern tip of the Kamchatka Peninsula, is the northernmost of the chain of volcanoes that comprise the Kuril archipelago. A number of strong explosive eruptions have been recorded there in the last 200 years, including VEI 4 explosions in 1790 and 1981. The last eruption occurred between 5 October and 12 December 2012 when repeated thermal anomalies and ash plumes from the summit crater were observed. A new eruption was first reported on 29 September 2015 by the Tokyo Volcanic Ash Advisory Center (VAAC) (BGVN 41:06). Alaid is monitored by the Kamchatka Volcanic Eruptions Response Team (KVERT); valuable information about this remote site is also gathered from satellite thermal infrared data reported by both the University of Hawai'i's MODVOLC system and the Italian MIROVA system.
A new eruption at Alaid was reported on 29 September 2015. It was characterized by strong thermal anomalies and intermittent gas-and-ash plumes. The thermal anomalies were interpreted by KVERT as Strombolian eruptions and lava flows. The first episode of the eruption exhibited strong thermal anomalies with only two reports of ash, and lasted until 4 January 2016. The second episode began with the reappearance of a strong thermal anomaly and an ash plume on 20 February 2016. This was followed by a series of low-level ash plumes in March and April, and ongoing strong thermal anomalies through early May. The anomalies decreased during mid-May and June, but then a large spike of intense anomalies in the first week of July was accompanied by ash plumes and observations by KVERT of Strombolian eruptions at the summit crater and a lava flow down the SW flank. Thermal activity decreased substantially following this spike, and tapered off completely by the second week of August 2016.
The Tokyo VAAC reported an eruption at Alaid at 2120 UTC on 28 September (0720 on 29 September local time) 2015. They reported it as below 6.1 km altitude, and volcanic ash was not identifiable in satellite images. KVERT raised the Aviation Color Code from Green to Yellow early on 2 October 2015 (local time) based on an intense thermal anomaly observed during the night that they interpreted to be the beginning of a new Strombolian eruption. The first thermal anomalies identified by MIROVA (Middle InfraRed Observation of Volcanic Activity) also appear during the first two days of October (figure 5). MODVOLC thermal alerts first appeared on 5 October and were essentially continuous with no more than a few days break until 4 January 2016. The MIROVA signal remained steady until about the same date when it abruptly decreased. KVERT reported consistent and usually intense thermal anomalies, when the volcano was not obscured by clouds, until 4 January. They observed anomalies in satellite images with decreasing frequency and intensity during the rest of January and into early February.
The first report of observed gas-and-steam activity (after the Tokyo VAAC report on 29 September) was by KVERT on 16 December. Visual observations from nearby Paramushir Island (45 km SE) noted a small amount of ash in the steam-and-gas plumes on 28 and 29 December. The Tokyo VAAC also reported a plume of volcanic ash at 4.6 km altitude on 29 December drifting SW. On 5 February 2016 local time KVERT lowered the Aviation Color Code (ACC) to Green, noting decreased thermal activity and only moderate continuing fumarole activity during the previous weeks. A break in the thermal activity between early January and late February is also recorded in the MIROVA data (figure 5).
Another eruptive episode began with the appearance of a strong thermal anomaly and a weak ash emission sending a plume 50 km E on 20 February UTC, leading KVERT to raise the ACC back to Yellow. Renewed MIROVA thermal anomalies appeared on 16 or 17 February (figure 5). The first MODVOLC thermal alert was reported 23 February, and they were essentially continuous (except for probable cloudy days) until 5 May 2016. MIROVA thermal anomalies values remained consistently in the 'High' (VRP of 108-109 Watts) range until the second week of May when they dropped back to 'Low' (VRP of 106-107 Watts).
KVERT reported gas-and-steam plumes containing a small amount of ash on 20 and 24 February 2016. Minor ashfall (less than 1 mm) was reported on 24 February in Severo-Kurilsk, 45 km SE on Paramushir Island. The Tokyo VAAC also reported a possible eruption that day with a plume to 3 km altitude extending NE. An ash plume was reported by KVERT and the Tokyo VAAC on 3 March 2016 at 3 km altitude drifting 52 km WSW. This prompted KVERT to raise the ACC to Orange. Ash emissions continued for the next two days, rising to 3.4-3.9 km and drifting S and SW, according to the Tokyo VAAC. KVERT reported visual data from Paramushir Island confirming an ash plume extending SW on 6 March, and satellite data showing the plume 90 km SW that same day.
Possible eruptions were again reported on 11 and 12 March 2016 by the Tokyo VAAC under 3 km altitude, and on 12 and 14 March by KVERT as visual observations from Paramushir extending 85 km E. Weak ash emissions were reported several more times in March and April rising to between 3 and 4.3 km altitude and drifting in various directions (some as far as 90 km) on 22, 26, and 30-31 March, and 1, 9, 14, 18, 21, and 24 April. KVERT noted that on 21 and 23 April the ash plumes extended about 260 km SE. Moderate thermal anomalies were reported by KVERT from mid-May through the beginning of July, and MIROVA anomalies registered in the 'Low' range during this time. KVERT reported on 12 May that satellite data showed a lava flow on the SW flank. They noted continuing thermal anomalies over the volcano during clear weather throughout May and June, but no ash plumes were reported.
KVERT and the Tokyo VAAC once again noted ash plumes that drifted 150 km SW during 3-4 July. This is consistent with an Aura/OMI image of an SO2 plume drifting SW from Alaid on 4 July (figure 6). On 7 July, KVERT reported Strombolian activity from a new cinder cone in the summit crater and a lava flow effusing down the SW flank. A sudden spike in the MIROVA data with values rising to 109 W of Radiative Power during 3-7 July (figure 5) corroborates the KVERT observation of the lava flow; the MODVOLC data also shows a strong signal between 3 and 7 July, including several alert pixels on the SW flank of the volcano (figure 7).
The last ash plume was observed by the Tokyo VAAC on 3 July 2016. The final thermal alert was recorded by MODVOLC on 7 July. MIROVA anomalies continued steadily, however, at low levels through the first week in August before ceasing. Two additional MIROVA anomalies appeared briefly in the first and last weeks of September. KVERT reported thermal anomalies continuing until early August. They also noted a gas-and-steam plume extending 155 km NE on 26 July. In their VONA (Volcano Observatory Notice for Aviation) issued on 11 August 2016 at 2305 UTC (1105 on 12 August KST), KVERT lowered the ACC to Yellow based on decreasing intensity of thermal anomalies, and no additional ash plumes since 4 July; they lowered it again to Green on 19 August (local time) citing no further evidence for volcanic activity since the last thermal anomaly on 11 August.
Geologic Background. The highest and northernmost volcano of the Kuril Islands, Alaid is a symmetrical stratovolcano when viewed from the north, but has a 1.5-km-wide summit crater that is breached open to the south. This basaltic to basaltic andesite volcano is the northernmost of a chain constructed west of the main Kuril archipelago. Numerous pyroclastic cones are present the lower flanks, particularly on the NW and SE sides, including an offshore cone formed during the 1933-34 eruption. Strong explosive eruptions have occurred from the summit crater beginning in the 18th century. Reports of eruptions in 1770, 1789, 1821, 1829, 1843, 1848, and 1858 were considered incorrect by Gorshkov (1970). Explosive eruptions in 1790 and 1981 were among the largest reported in the Kuril Islands.
Information Contacts: Kamchatka Volcanic Eruptions Response Team (KVERT), Far East Division, Russian Academy of Sciences, 9 Piip Blvd., Petropavlovsk-Kamchatsky, 683006, Russia (URL: http://www.kscnet.ru/ivs/); Tokyo Volcanic Ash Advisory Center (VAAC), 1-3-4 Otemachi, Chiyoda-ku, Tokyo, Japan (URL: http://ds.data.jma.go.jp/svd/vaac/data/); MIROVA (Middle InfraRed Observation of Volcanic Activity), a collaborative project between the Universities of Turin and Florence (Italy) supported by the Centre for Volcanic Risk of the Italian Civil Protection Department (URL: http://www.mirovaweb.it/); Hawai'i Institute of Geophysics and Planetology (HIGP), MODVOLC Thermal Alerts System, School of Ocean and Earth Science and Technology (SOEST), Univ. of Hawai'i, 2525 Correa Road, Honolulu, HI 96822, USA (URL: http://modis.higp.hawaii.edu/, http://modis.higp.hawaii.edu/); NASA Goddard Space Flight Center (NASA/GSFC), Global Sulfur Dioxide Monitoring Page, Atmospheric Chemistry and Dynamics Laboratory, 8800 Greenbelt Road, Goddard, Maryland, USA (URL: https://so2.gsfc.nasa.gov/).
Cleveland (United States) — April 2017 Cite this Report
Cleveland
United States
52.825°N, 169.944°W; summit elev. 1730 m
All times are local (unless otherwise noted)
Growth and destruction of six lava domes between June 2014 and February 2017
Large lava flows descend the flanks of Alaska's Cleveland volcano, located on Chuginadak Island in the Aleutians, slightly over 1,500 km SW of Anchorage (figure 18). However, dome growth and destruction by frequent small ash explosions have been more typical behavior in recent years; historical activity, including three large (VEI 3) eruptions, is recorded back to 1893. The Alaska Volcano Observatory (AVO) and the Anchorage Volcanic Ash Advisory Center (VAAC) are responsible for monitoring activity and notifying air traffic of aviation hazards associated with Cleveland. This report summarizes activity between July 2011 and June 2014, and provides details of activity from June 2014 through February 2017.
Summary of activity during July 2011-June 2014. Dome growth and destruction characterized activity at Cleveland during 2011-2014. Eruptive episodes are challenging to determine due to weather conditions and the remoteness of the volcano; detectible ash plumes are intermittent, and thermal anomalies caused by dome growth are often obscured in satellite imagery. Seismic and infrasound data on explosions often provide valuable information. Dome growth was clearly documented between late July and October 2011 (BGVN 36:08, 37:01). An ash cloud observed on 29 December 2011 was followed by observations of dome growth in satellite data on 30 January 2012. Significant ash explosions occurred during April and June 2012 (BGVN 38:10). AVO also reported ash plumes on 12 July and 20 August 2012. Another small ash cloud was noted by AVO on 10 Nov 2012.
Details of the 2013 activity are provided in Dixon et al. (2015) and summarized here. Elevated temperatures in mid-January 2013 were followed by observations of a new lava dome that measured 100 m in diameter on 30 January 2013, and a second lava extrusion on 9 February. Elevated surface temperatures were intermittently observed until the next ash explosion on 4 May 2013, which was followed by a larger series of explosions on 6 May that filled the crater with tephra and created flowage deposits on the NE, E, and SE flanks. On 26 July, analysis of a satellite images suggested a new lava flow within the summit crater.
From August through 28 December 2013 the infrasound and seismic networks detected a number of additional explosions and periods of infrasonic tremor (see table 8 in Dixon et al., 2015). Most of these events did not have an accompanying ash signal in AVHRR satellite images, suggesting minor to no ash emissions. A detectible ash cloud on 30 December 2013 was preceded by strongly elevated surface temperature readings in the summit area on 28 December (BVGN 39:08). Ash plumes were again detected at the summit on 2 January, 25 February, and 6 March 2014. Cleveland was quiet for almost three months until an explosion on 5 June with a weak ash signal was detected.
Summary of activity during June 2014-February 2017. The growth and explosive destruction of six lava domes at Cleveland were recorded between June 2014 and February 2017. Although an explosion on 5 June 2014 was the last recorded explosion with confirmed ash until 14 June 2015, thermal and visual satellite evidence suggested dome growth activity during July-September and late November 2014. Weakly elevated surface temperatures at the summit were intermittent through February 2015. Minor ash deposits on the flanks were observed on 14 June 2015 in addition to stronger elevated surface temperatures, suggesting a new dome growth episode. An explosion on 21 July 2015 was thought to have destroyed the dome, and strongly elevated surface temperatures indicating new dome growth continued through July and August.
Moderately-elevated surface temperatures were detected at the summit in satellite data from January through 16 April 2016 when a new explosion was recorded. Satellite views in late April indicated that the August 2015 lava dome had been replaced with a small cinder cone within the summit crater. Explosions with no ash reported occurred twice in May, before the extrusion of a small amount of lava forming a new lava dome was observed on 17 May 2016, and which continued to grow for about one week. Moderately-elevated surface temperatures reappeared in mid-July, and field crews observed incandescence in a vent at the summit in late July. Satellite thermal anomalies were persistent from mid-May through September 2016. A new explosion on 24 October 2016 destroyed the dome emplaced in May; satellite views in November showed a deep pit within the summit crater. Weakly elevated surface temperatures reappeared in early December 2016. Moderately-elevated surface temperatures reappeared on 31 January 2017, [followed on 3 February by satellite observations that indicated] a new dome of similar size to earlier ones was once again filling the summit crater.
Activity during June 2014-February 2015. An ash-bearing explosion occurred in the late evening hours of 5 June 2014, resulting in a detached cloud with a weak ash signal observed in a satellite image that rapidly dissipated; no additional ash explosions were observed over the next 12 months. Weakly elevated surface temperatures were observed in satellite data on 7 July, and a vigorous steam-and-gas plume was observed on 8 and 9 July. Typical steam-and-gas emissions and persistent elevated surface temperatures in the summit crater were noted in satellite observations during clear periods through July and August, but AVO received no reports from pilots or mariners of any eruptive activity. Scientists working on the island in early August noted incandescence and puffing activity of steam and gas at the summit, and witnessed several small rockfall events. A newly installed webcam and other geophysical equipment at station CLCO near Concord Point on the SE coast of Chuginadak Island, about 15 km E of the volcano's summit, became operational in September 2014. In mid-September several rockfall signals were detected by the new local seismic network, and indicated the continued instability of volcanic debris on the steep upper flanks of the volcano.
Elevated surface temperatures were observed at the summit on clear days with occasional minor steaming visible in webcam images from late September to late October 2014. On 14 November AVO reported that vigorous steaming from the summit crater was observed in webcam images during the prior week, although they remarked that steam emissions are routinely observed at Cleveland and do not necessarily indicate an increase in unrest. On 28 November, they noted that a small mound of lava in the crater was observed in clear satellite views earlier that week that may have corresponded with the appearance of a faint thermal signal in the satellite data; the lava possibly extruded around 24 November. Satellite views on 19 December 2014 showed weakly elevated surface temperatures at the summit vent.
Low-density gas emissions and weakly elevated surface temperatures in the summit region were observed on 1 January 2015, and during clear weather up to 9 January. After this, nothing of note was observed in satellite or webcam images, and no significant activity was detected in seismic or infrasound (air pressure) data until weakly elevated surface temperatures were again detected in satellite data on 25 February. A low-level steam-and-gas plume emanated from the summit on 24 February, and again was identified in multiple satellite images on 28 February. During March, April, and May 2015, no significant activity, except for occasional steaming from the summit crater, was observed during periods of clear weather, causing AVO to downgrade both the Aviation Color Code (ACC) and the Volcano Alert Level (VAL) to Unassigned on 28 May 2015.
Activity during June 2015-March 2016. AVO issued a new VONA (Volcano Observatory Notice for Aviation) on 17 June 2015 returning the Aviation Color Code to Yellow (Yellow is 2nd lowest on a 4-color scale), and the Volcano Alert Level to Advisory (also 2nd lowest on a 4-level scale). This was based on satellite detection of elevated surface temperatures at the summit and an image from 14 June showing very minor ash deposits on the upper flanks. They interpreted the increase in temperature as consistent with renewed growth of the small lava dome within the crater. Elevated summit surface temperatures were again observed on 30 June, and during three clear days in early July. On 21 July AVO detected an explosion in both infrasound and seismic data, and raised the ACC to Orange and the VAL to WATCH. Satellite views were obscured by clouds, though a dusting of ash on the upper flanks was noted by a nearby field crew and recorded by the webcam later in the day. The explosion destroyed the dome that had formed in November 2014. Strongly elevated surface temperatures were recorded at the summit during the last week of July, including a thermal alert pixel from the MODVOLC system on 31 July.
Slightly elevated surface temperatures were recorded at the summit during the first week of August 2015. On 4 August, a field crew working in the area reported a small amount of lava covering the crater floor. Surface temperatures of the cooling lava measured by the crew were in the range of 550-600°C. Minor ash-and-gas emissions were also observed. A small explosion occurred on 6 August at 2203 AKDT, but no ash cloud was identified. Strongly elevated surface temperatures suggestive of lava effusion were noted in satellite data through 18 August, and weakly elevated temperatures were recorded for the rest of August and September. A small swarm of earthquakes was detected on 29 August.
AVO lowered the ACC to Yellow and the VAL to ADVISORY on 14 October 2015, citing the likely cessation of lava effusion, while minor steaming, weakly elevated surface temperatures, and slightly above-background seismicity continued through November 2015. Exceptionally clear weather during late November allowed many views of the volcano, showing only modest steaming from the summit. Elevated surface temperatures were detected twice during December, and an increase in frequency of small VT (Volcano-Tectonic) events was noted on 22 and 23 December, but otherwise no significant seismicity or emissions (other than steam plumes) were detected.
Moderately-elevated surface temperatures were detected at the beginning of the second week in January 2016, followed by several small earthquakes per day during the third week, and weakly elevated temperatures. Low-level seismicity and elevated surface temperatures were next observed during the last week of February; a brief burst of small local earthquakes was recorded on 28 February followed by weakly elevated surface temperatures during the first week of March. Moderately-elevated surface temperatures were again observed during the last week of March.
Activity during April-September 2016. A new explosion on 16 April 2016 was detected in both infrasound and seismic data, but satellite views were obscured by clouds. AVO raised the ACC to Orange until 29 April, when they noted that recent satellite imagery indicated that the August 2015 lava dome had been replaced with a small cinder cone within the summit crater; seismic activity remained lower after the explosion. Another explosion on 5 May at 1844 local time led AVO to raise the ACC back to Orange, although no ash emissions were observed above the cloud deck. A brief explosive event on 10 May was detected by pressure sensors near the volcano, and again no ash was reported.
A small volume of lava was extruded from the summit on 17 or 18 May, as confirmed in satellite data. The low-relief, 50-m-diameter dome was similar in size and shape to the ten domes observed since 2011, the most recent of which was extruded and destroyed earlier in May. During the week of 20 May, this lava dome enlarged to about 60 m in diameter. Dome growth appeared to have paused or ceased by 23 May. Weakly elevated surface temperatures were observed in mostly clear views by satellite on 25 and 26 May, which is consistent with the presence of the new lava dome. The Aviation Color Code was lowered from Orange to Yellow by AVO on 3 June when no other signs of eruptive activity were observed. Occasional clear satellite views detected weakly elevated surface temperatures that AVO interpreted as consistent with cooling lava during June 2016.
The MIROVA infrared data suggests ongoing thermal anomalies from late May through September 2016 (figure 19). AVO reported weakly-to-moderately-elevated surface temperatures reappearing during the second and third weeks of July. Field crews conducted an overflight during the last week of July and observed incandescence from a vent in the summit crater. Low-level steam plumes and minor degassing were observed a number of times during August. A small swarm of earthquakes occurred on 29 August; owing to the small number of telemetered seismometers on Cleveland, the locations and magnitudes of the earthquakes could not be determined precisely. Thermal anomalies were observed in satellite data during the last week of August and slightly elevated surface temperatures were observed on clear satellite images a number of times in September.
Activity during October 2016-February 2017. AVO detected an explosion at 1310 local time on 24 October 2016 that was heard by residents in Nikolski (75 km E), prompting AVO to raise the ACC to Orange and the VAL to WATCH. No evidence of an eruption cloud was detected above the weather cloud present at 8.5 km altitude, and no ashfall was reported in Nikolski. However, clear post-explosion webcam views of the volcano showed a darkened area around the summit crater which may have been the result of minor ash fallout. Narrow dark streaks were also observed extending down the upper snow-covered part of the edifice, which according to AVO may have been produced by small flows of meltwater and ash. They lowered the ACC back to Yellow on 4 November 2016. Satellite views from early November indicated that the lava dome emplaced in late May was mostly destroyed in the 24 October explosion, and was replaced with a deep pit within the summit crater. Minor steaming was observed from the summit during a few periods of clear weather in November.
Observations of weakly-elevated surface temperatures returned 8 and 9 December, with minor steaming at the summit observed on clear days. A MIROVA thermal anomaly signal reappeared around 25 December. This was followed by AVO's observation of weak-to-moderate elevated surface temperatures during first week of January 2017. Low-level steam plumes were seen on clear days later in the month. Moderately-elevated surface temperatures appeared in satellite data on 31 January. [On 3 February 2017 the appearance of a new dome] led AVO to raise the ACC to Orange. Satellite observations indicated that a new lava dome had been extruded and was partially filling the summit crater. The new dome was about 70 m in diameter and similar in size to previous lava domes that have developed on the floor of the crater.
References: Dixon, J.P., Cameron, C., McGimsey R.G., Neal, D.A., and Waythomas, C., 2015, 2013 Volcanic activity in Alaska-Summary of events and response of the Alaska Volcano Observatory: U.S. Geological Survey Scientific Investigations Report 2015-5110, 92 p., http://dx.doi.org/10.3133/sir20155110 .
Geologic Background. The beautifully symmetrical Mount Cleveland stratovolcano is situated at the western end of the uninhabited Chuginadak Island. It lies SE across Carlisle Pass strait from Carlisle volcano and NE across Chuginadak Pass strait from Herbert volcano. Joined to the rest of Chuginadak Island by a low isthmus, Cleveland is the highest of the Islands of the Four Mountains group and is one of the most active of the Aleutian Islands. The native name, Chuginadak, refers to the Aleut goddess of fire, who was thought to reside on the volcano. Numerous large lava flows descend the steep-sided flanks. It is possible that some 18th-to-19th century eruptions attributed to Carlisle should be ascribed to Cleveland (Miller et al., 1998). In 1944 it produced the only known fatality from an Aleutian eruption. Recent eruptions have been characterized by short-lived explosive ash emissions, at times accompanied by lava fountaining and lava flows down the flanks.
Information Contacts: Alaska Volcano Observatory (AVO), a cooperative program of a) U.S. Geological Survey, 4200 University Drive, Anchorage, AK 99508-4667 USA (URL: http://www.avo.alaska.edu/), b) Geophysical Institute, University of Alaska, PO Box 757320, Fairbanks, AK 99775-7320, USA, and c) Alaska Division of Geological & Geophysical Surveys, 794 University Ave., Suite 200, Fairbanks, AK 99709, USA (URL: http://www.dggs.alaska.gov/); Anchorage Volcanic Ash Advisory Center (VAAC), Alaska Aviation Weather Unit, NWS NOAA US Dept of Commerce, 6930 Sand Lake Road, Anchorage, AK 99502-1845(URL: http://www.ssd.noaa.gov/); Hawai'i Institute of Geophysics and Planetology (HIGP), MODVOLC Thermal Alerts System, School of Ocean and Earth Science and Technology (SOEST), Univ. of Hawai'i, 2525 Correa Road, Honolulu, HI 96822, USA (URL: http://modis.higp.hawaii.edu/); MIROVA (Middle InfraRed Observation of Volcanic Activity), a collaborative project between the Universities of Turin and Florence (Italy) supported by the Centre for Volcanic Risk of the Italian Civil Protection Department (URL: http://www.mirovaweb.it/); NASA Earth Observatory, EOS Project Science Office, NASA Goddard Space Flight Center, Goddard, Maryland, USA (URL: http://earthobservatory.nasa.gov/).
Copahue (Chile-Argentina) — April 2017 Cite this Report
Copahue
Chile-Argentina
37.856°S, 71.183°W; summit elev. 2953 m
All times are local (unless otherwise noted)
Eruptive activity consisting of Strombolian explosions and gas-and-ash plumes ends in late December 2016
Recent activity at Copahue through January 2016 (BGVN 41:03) consisted of gas and steam plumes with minor amounts of ash. This report, based on information obtained from the Buenos Aires Volcanic Ash Advisory Center (VAAC), the Southern Andes Volcanological Observatory (OVDAS), and the Servicio Nacional de Geología y Minería (National Geology and Mining Service) (SERNAGEOMIN), covers similar activity from mid-January through December 2016. Volcano Alert Levels were maintained by SERNAGEOMIN (on a four-color scale) and by the Chilean Oficina Nacional de Emergencia del Ministerio del Interior (National Office of Emergency of the Interior Ministry) (ONEMI), on a three-color scale), for alerts to individual communes in the region.
Reports from the Buenos Aires VAAC between 13 January and 26 March 2016, based on Significant Meteorological Information (SIGMET) notices, satellites, and webcam views, indicated continuous gas-and-steam plumes containing minor amounts of ash. The plumes rose as high as 3.3-4.3 km altitude (during 24-25 and 28 February) and drifted as far as 160 km (trending SE and SW) between 28 January and 2 February, and more generally as far as 150 km in a variety of directions.
The Buenos Aires VAAC next reported steam-and-gas emissions, possibly containing minor amounts of ash on 11 June, based on webcam recordings. OVDAS-SERNAGEOMIN reported an eruption during 16-30 June characterized by phreato-magmatic explosions and Strombolian activity. During an overflight on 3 July, SERNAGEOMIN scientists observed Strombolian activity from a pyroclastic cone that was forming on the floor of El Agrio crater (figure 17).
Based on webcam and satellite views, the Buenos Aires VAAC reported that during 7-8 July diffuse gas-and-steam plumes with minor amounts of ash rose to an altitude of 3 km and drifted E and SE. The Alert Level remained at Yellow (second highest level on a four-color scale).
Activity renewed in September and lasted through December 2016. Based on satellite and webcam images, notices from the Buenos Aires VAAC after 23 September described gas and water vapor plumes with minor ash content rising above the summit. The plumes rose as high as 5.2 km a.s.l. (during 23-25 and 27-29 November) and drifted based on wind direction SW, S, SSE, ESE, SE, E, ENE, NE, and N. On 2 December OVDAS-SERNAGEOMIN reported that activity continued to be dominated by weak Strombolian explosions, likely from a pyroclastic cone forming on the floor of El Agrio crater. The last VAAC reports of activity during 2016 were for gas-and-ash emissions to altitudes of 3.6-3.9 km drifting in S and E directions.
The only MODVOLC thermal anomaly during the entire reporting period was on 26 October 2016 (1 pixel). The MIROVA volcano hotspot detection system, also based on analysis of MODIS data, detected low level thermal anomalies that became more frequent during the latter part of June through early July 2016 and thereafter occurred less often. The last anomalies recorded by MIROVA (as of early April 2017) were in about the third week of December 2016 (figure 18).
At some point after the December 2016 activity, SERNAGEOMIN lowered the Alert Level to Green, the lowest of the four levels. No additional reports of activity were issued from any agency through March 2017.
Geologic Background. Volcán Copahue is an elongated composite cone constructed along the Chile-Argentina border within the 6.5 x 8.5 km wide Trapa-Trapa caldera that formed between 0.6 and 0.4 million years ago near the NW margin of the 20 x 15 km Pliocene Caviahue (Del Agrio) caldera. The eastern summit crater, part of a 2-km-long, ENE-WSW line of nine craters, contains a briny, acidic 300-m-wide crater lake (also referred to as El Agrio or Del Agrio) and displays intense fumarolic activity. Acidic hot springs occur below the eastern outlet of the crater lake, contributing to the acidity of the Río Agrio, and another geothermal zone is located within Caviahue caldera about 7 km NE of the summit. Infrequent mild-to-moderate explosive eruptions have been recorded since the 18th century. Twentieth-century eruptions from the crater lake have ejected pyroclastic rocks and chilled liquid sulfur fragments.
Information Contacts: Servicio Nacional de Geología y Minería, (SERNAGEOMIN), Observatorio Volcanológico de Los Andes del Sur (OVDAS), Avda Sta María No. 0104, Santiago, Chile ( URL: http://www.sernageomin.cl/); Oficina Nacional de Emergencia - Ministerio del Interior (ONEMI), Beaucheff 1637/1671, Santiago, Chile (URL: http://www.onemi.cl/); Buenos Aires Volcanic Ash Advisory Center (VAAC), Servicio Meteorológico Nacional-Fuerza Aérea Argentina, 25 de mayo 658, Buenos Aires, Argentina (URL: http://www.smn.gov.ar/vaac/buenosaires/inicio.php?lang=es); Hawai'i Institute of Geophysics and Planetology (HIGP), MODVOLC Thermal Alerts System, School of Ocean and Earth Science and Technology (SOEST), Univ. of Hawai'i, 2525 Correa Road, Honolulu, HI 96822, USA (URL: http://modis.higp.hawaii.edu/); MIROVA (Middle InfraRed Observation of Volcanic Activity), a collaborative project between the Universities of Turin and Florence (Italy) supported by the Centre for Volcanic Risk of the Italian Civil Protection Department (URL: http://www.mirovaweb.it/).
Daikoku (United States) — April 2017 Cite this Report
Daikoku
United States
21.324°N, 144.194°E; summit elev. -323 m
All times are local (unless otherwise noted)
Explorations in 2014 and 2016 reveal active hydrothermal plumes and sulfur chimney formation
Daikoku seamount lies in the Northern Seamount Province of the Mariana Arc, and is about 850 km due N of Guam in the western Pacific Ocean. The summit is about 325 m below sea level and was first shown to be hydrothermally active in 2003 (figure 3). NOAA (National Oceanic and Atmospheric Administration) has conducted four expeditions to the Northern Mariana Islands in 2003, 2004, 2006, and 2014 under their Ocean Explorer program, specifically to study the volcanoes and the marine life they support. A comparison of the bathymetry recorded in 2003 and 2014 suggests that an explosion may have occurred at Daikoku during that interval, and both geochemical data and rock sampling indicate ongoing hydrothermal activity. In 2016, a research cruise conducted by the Schmidt Ocean Institute included a visit to Daikoku that revealed sulfur chimney formation.
Geochemical sampling of the seawater is carried out with an instrument package that measures conductivity, temperature, and depth, commonly referred to as a CTD. Turbidity of the water, which estimates the concentration of particulate matter suspended in the plumes, is also measured. The CTD carries bottles for seawater sampling which is then geochemically analyzed.
On 15 April 2004 the NOAA 'Submarine Ring of Fire 2004' expedition made a single dive at Daikoku and noted warm water present over large areas of sandy sediment deposits near the summit, and small flatfish in great abundance in the venting areas. The 'Submarine Ring of Fire 2006' expedition again visited Daikoku on 4 May 2006 and discovered a "cauldron" of molten sulfur (BGVN 31:05). They also observed extensive sulfur crusts in the vicinity of the cauldron, suggesting past emissions of liquid sulfur; they were able to sample a large piece of sulfur crust (figure 4). At that time, they also mapped two large craters on the summit. One pit was reported as over 100 m deep and about 80 m in diameter, and a large plume of white fluid was observed rising out of it.
Researchers from the NOAA Ocean Explorer program visited Daikoku again on 14 December 2014 during its 'Submarine Ring of Fire 2014 – Ironman' expedition, which was conducted from the R/V (Research Vessel) Revelle between 29 November and 22 December 2014. They gathered geochemical and bathymetric data which they were able to compare with 2003 data. The CTD information gathered in 2014 showed very strong plumes coming from the top of the seamount. The plumes had high turbidity, low pH, strong anomalies in reduced chemicals, and very high levels of hydrogen (figure 5).
The 2014 bathymetry data revealed two summit craters; the larger one measured 150 m across and 100 m deep on the N side of the summit with a crater floor depth of 452 m below sea level, and the smaller one, about 50 m across on the NE flank, had a crater floor depth of 443 m below sea level. The bathymetry data from 2003 show only one small crater on the N side of the summit about 50 m across with a floor depth of 400 m below sea level (figure 6). The larger pit appeared to be about 70 m wider in 2014 than in 2006.
On 3 and 4 December 2016, the Schmidt Ocean Institute Research Vessel R/V Falkor traveled to the Mariana back-arc with a multidisciplinary team of scientists to gather evidence of active hydrothermal vents and the life they support. They were able to make two ROV (Remotely Operated Vehicle) dives at Daikoku and collected data on the seamount and sea life living there. On their first dive they observed (and sampled) a fissure with a sulfur chimney caked with yellow sulfur, emitting white bubbles and particulates in 70°C water (figure 7).
On their second dive on 4 December 2016, they collected tube worms and crabs, and recorded the formation of "sulfur needles," tadpole-shaped fragments of sulfur that were previously observed in sampled sediments and seen floating in the water column. They appear to form when gas bubbles (probably CO2) rise through molten sulfur, forming a coating of sulfur around the bubble before the gas escapes (figure 8). Their video shows a sulfur chimney caked with yellow sulfur emitting yellow, white, and orange droplets of sulfur.
The cruise scientists used the ship's EM302/710 multibeam echosounder to get a 2-m-resolution image of the summit crater, which they combined with water column data to create an image showing both the bathymetry of the volcano and the shape of the hydrothermal plume emitting from the summit (figure 9).
Geologic Background. The conical summit of Daikoku seamount lies along an E-W ridge SE of Eifuku and rises to within 323 m of the sea surface. A steep-walled, 50-m-wide crater on the N flank, about 75 m below the summit, is at least 135 m deep and was observed to emit cloudy hydrothermal fluid. During a NOAA expedition in 2006, scientists observed a convecting black pool of liquid sulfur with a partly solidified, undulating sulfur crust at a depth of 420 m below the summit. Gases, particulates with the appearance of smoke, and liquid sulfur were bubbling up from an edge of the sulfur pool.
Information Contacts: Office of Ocean Exploration and Research, National Oceanic and Atmospheric Administration (NOAA), 1315 East-West Highway, Silver Spring, MD 20910, USA (URL: http://oceanexplorer.noaa.gov/, Cruise logs at: http://oceanexplorer.noaa.gov/explorations/03fire/logs/summary/summary.html, http://oceanexplorer.noaa.gov/explorations/04fire/logs/april15/april15.html, http://oceanexplorer.noaa.gov/explorations/06fire/logs/may4/may4.html, http://oceanexplorer.noaa.gov/explorations/14fire/logs/december14/december14.html); Schmidt Ocean Institute, 555 Bryant Street #374, Palo Alto, CA 94301, USA (URL: https://schmidtocean.org/, https://schmidtocean.org/cruise/searching-life-mariana-back-arc/).
Kerinci (Indonesia) — April 2017 Cite this Report
Kerinci
Indonesia
1.697°S, 101.264°E; summit elev. 3800 m
All times are local (unless otherwise noted)
Brief ash eruptions in December 2011, June 2013, March-June 2016, and November 2016
After an eruption in April 2009 (BGVN 34:12), Kerinci was quiet until it erupted again in December 2011. The Indonesian agency responsible for volcano monitoring is the Pusat Vulkanologi dan Mitigasi Bencana Geologi (PVMBG), also known as the Center for Volcanology and Geological Hazard Mitigation (CVGHM). Since mid-December 2011 there have been four instances where there was an emission of ash, qualifying the event as an eruption. These took place in December 2011, June 2013, and twice in 2016. The eruptions in 2016 were separated by five months, so are treated as distinct eruptions.
PVMBG mentioned in its 2015 reports on Kerinci that an eruption on 15 December 2011 generated an ash plume that rose about 600 m above the summit (summit elevation is 3.8 km). No other details were given.
A brief eruption was reported by PVMBG on 2 June 2013, from 0843 to 0848, that generated an ash plume 1 km above the crater. Ashfall as thick as 5 mm was reported in areas to the E, including Tangkil (7.5 km SE). In a Jakarta Post story, a resident of Sungai Rumpun village (about 10 km SE) reported hearing a loud bang and black plumes with a sulfur odor. The article noted that several villages in Gunung Tujuh district (an area that includes the SE flank of the volcano) received heavy ashfall, but it was washed off the crops by rain.
Although PVMBG reported white plumes during 1 February-12 July 2015 that rose 50-300 m and drifted E and W, no clear eruptive activity was noted. Seismicity during this period was dominated by signals indicating emissions and shallow volcanic earthquakes. Climbers who reached the summit around this time (exact dates not reported, images uploaded 17 January 2016) photographed steam plumes (figure 1) and solid lava flows (figure 2) in the crater.
Based on satellite images and ground reports from PVMBG, the Darwin Volcanic Ash Advisory Centre (VAAC) reported that during 15 days between 31 March and 9 June 2016 ash plumes rose to altitudes of 4.0-4.9 km and drifted N, NW, NE, E, and WSW. On 29 April an ash plume rose to an altitude of 6.1 km.
Ash plumes were again reported on 15-19, and 21 November 2016 based on observations of satellite data by the Darwin VAAC. The plumes rose to altitudes of 4.3-4.6 km and drifted NE, ENE, SE, and S. On 15 and 17 November they drifted almost 30 km downwind. The Alert Level remained at 2 (on a scale of 1-4), where it has been since September 2007, and PVMBG advised residents and visitors not to enter an area within 3 km of the summit.
Geologic Background. Gunung Kerinci in central Sumatra forms Indonesia's highest volcano and is one of the most active in Sumatra. It is capped by an unvegetated young summit cone that was constructed NE of an older crater remnant. There is a deep 600-m-wide summit crater often partially filled by a small crater lake that lies on the NE crater floor, opposite the SW-rim summit. The massive 13 x 25 km wide volcano towers 2400-3300 m above surrounding plains and is elongated in a N-S direction. Frequently active, Kerinci has been the source of numerous moderate explosive eruptions since its first recorded eruption in 1838.
Information Contacts: Pusat Vulkanologi dan Mitigasi Bencana Geologi (PVMBG, also known as Indonesian Center for Volcanology and Geological Hazard Mitigation, CVGHM), Jalan Diponegoro 57, Bandung 40122, Indonesia (URL: http://www.vsi.esdm.go.id/); Darwin Volcanic Ash Advisory Centre (VAAC), Bureau of Meteorology, Northern Territory Regional Office, PO Box 40050, Casuarina, NT 0811, Australia (URL: http://www.bom.gov.au/info/vaac/); Bernhard Huber (URL: https://www.flickr.com/photos/97278656@N08/, https://creativecommons.org/licenses/by-nc-nd/2.0/); Luke Mackin (URL: https://www.flickr.com/photos/wildsumatra/, https://creativecommons.org/licenses/by-nc-sa/2.0/); Jakarta Post (URL: http://www.thejakartapost.com/news/2013/06/02/mt-kerinci-erupts.html).
Klyuchevskoy (Russia) — April 2017 Cite this Report
Klyuchevskoy
Russia
56.056°N, 160.642°E; summit elev. 4754 m
All times are local (unless otherwise noted)
Mixed explosive and effusive eruption ongoing from August 2015 through March 2017
Klyuchevskoy has been quite active for many decades, with eruptive periods alternating with less active times (BGVN 35:06, 38:07, and 39:10). Recent eruptions took place during August-December 2013, with another period of activity beginning in January 2015 and continuing at least into March 2015 (BGVN 39:10). MODVOLC thermal alert pixels, based on MODIS satellite data, were frequent starting on 3 January but had stopped after 26 February 2015. Moderate activity continued until 10 May 2015, when the eruption that began in January ended. Eruptive activity was again observed in late August 2015, and fluctuating activity has continued through March 2017. The Kamchatkan Volcanic Eruption Response Team (KVERT) is responsible for monitoring this volcano, and is the primary source of information. Times are in UTC (local time is UTC + 12 hours).
Activity during April-July 2015. KVERT lowered the Aviation Color Code (ACC) to Green, the lowest of four levels, on 6 April 2015, although moderate gas-and-steam activity continued. On 13 April, gas-and-steam emissions increased at 0840, and continued at least through 1215 on 14 April, with incandescence at the summit possibly indicative of renewed Strombolian activity. KVERT raised the ACC from Green to Yellow. Strong gas-and-steam activity continued through the rest of April; the plumes sometimes contained small amounts of ash. Satellite data showed a weak thermal anomaly when not obscured by clouds, and incandescence at the summit was occasionally observed. On 18 April, KVERT reported that Strombolian activity was continuing, and that a webcam had recorded a narrow ash plume rising 1-2 km and drifting 100 km SE; the ACC was raised to Orange. Satellite images showed a weak thermal anomaly during 16-17 and 23 April; a gas plume containing a small amount of ash drifted 147 km E on 21 April. On 26 April the ACC was lowered to Yellow; KVERT noted that gas-and-steam activity and tremor continued.
Satellite data showed ash-bearing plumes during 2-5 May that drifted more than 450 km SE, and moderate activity continued through 9 May. The ACC was briefly raised to Orange before again being set at Yellow on 12 May. Moderate activity prevailed though the rest of the month. Satellite data showed occasional gas-and-steam plumes, sometimes containing small amounts of ash; weak thermal anomalies were often observed over the volcano when clouds did not obscure viewing.
On 22 May, KVERT described activity as weak. This remained the case through 27 August 2015. Gas-and-steam emissions continued, and satellite data often showed a thermal anomaly when the volcano was not obscured by clouds. Gas-steam plumes drifted 20 km SE on 26-27 May. On 20 July, the ACC was lowered to Green.
Activity during August 2015-March 2016. On 27 August, KVERT reported that a moderate Strombolian explosion had occurred, which continued into 28 August. At 1544 UTC on 27 August, incandescence of the crater was observed. The ACC was raised to Yellow.
Thereafter, through 17 September 2015, KVERT described activity as moderate, with moderate gas-steam activity. Strombolian explosions occurred on 27-28 August and 8-10 September. Satellite data showed occasional weak thermal anomalies when the volcano was not obscured by clouds. On 13-14 September, a diffuse ash plume rose to about 1.5 km and drifted E.
During 24 September-30 November 2015, KVERT described the activity as a "weak explosive eruption." According to video data, moderate gas-and-steam activity continued and a weak thermal anomaly was sometimes observed when the volcano was not obscured by clouds. Occasionally, incandescence of the summit volcanic crater was noted.
KVERT again described activity as moderate during December 2015-March 2016, with strong gas-steam emissions, although the volcano was usually either quiet or obscured by clouds. KVERT reported thermal anomalies each month, ranging from two during December 2015 to 12 during both January and February 2016. Video often recorded incandescence at the summit during the latter part of December.
Activity during April 2016-November 2016. On 3 April 2016, activity increased with Strombolian explosions. Detection of very frequent thermal anomalies by the MODVOLC system began again on 8 April and continued being reported almost daily through 2 November 2016. Thermal data identified by the MIROVA system showed strong anomalies over the same time period (figure 18). The MIROVA data also indicated a steady increase in radiative power beginning in the second half of May 2016.
Strong gas-steam emissions continued, and plumes extended to about 100 km SE on 10 April and about 55 km NE on 14-15 April. Satellite data by KVERT through June showed persistent intense thermal anomalies when not obscured by clouds. On 24 April, activity increased again. According to video and satellite data, a lava flow began to effuse on the S and SE flank of the volcano (along Apakhonchich chute). An ash plume drifted about 500 km SW on 23-24 April. The ACC was raised to Orange.
The explosive-effusive eruption continued from May through September 2016. Lava continued to effuse along the SE flank. Satellite data showed an ash plume extending 88 km SE on 2 May, up to 80 km E and SE on 13 May and 16 May, 47 km W on 13 June, about 30 km E on 18 June, and 60 km W and E on 27-28 June. Gas-steam plumes drifted about 60 km W and E on 27 and 28 June. On 24 June, at 2115 and 2350 UTC, video data showed two rock collapses into the Apakhonchich chute and ash plumes drifted W, then NW. According to video and satellite data, Strombolian activity of the summit crater continued on 24 June.
According to video data, the eruption intensified on 6 July. Strong explosions sent ash to an altitude of 7.5 km and the plumes drifted about 350 km SW, S, and SE. A large bright thermal anomaly was observed all that week. On 6-7 July, dense ash plumes drifted about 400 km SE and E, and numerous ash plumes were observed thereafter through September. Bursts of volcanic bombs shot up to 200-300 m above the summit crater and up to 50 m above the cinder cone into the Apakhonchich chute along the SE flank. Lava continued to flow on the SE flank along the chute (figure 19). Strong gas-steam activity within two volcanic centers emitted various amounts of ash. On 10, 13 and 15 September, explosions shot ash up to an altitude of 7 km and ash plumes extended for about 50 km SE and NE.
During the second week of September, KVERT reported that lava began to effuse on the E and SW flanks. Explosions sent ash up to an altitude of 7.5 km and ash plumes extended for about 530 km in various directions. Small ash layers were observed over Koryaksky and Avachinsky volcanoes on 8 September. On 10, 13, 15, and 20-22 September, explosions sent ash up to an altitude of 6-7 km and ash plumes extended for up to 165 km in various directions. In their 29 September and 6 October reports, KVERT noted that bursts of volcanic ash that rose above the summit crater and cinder cone fell into Apakhonchich chute.
Explosions during the first week of October sent ash to an altitude of 5-6 km and plumes extended about 260 km E. On 7-8 October, gas-steam plumes containing ash drifted about 390 km E and SE. By 13 October, activity had apparently diminished, with moderate gas-steam emissions containing some ash. A weak thermal anomaly was noted on 7 and 12 October.
By 20 October the explosive-effusive activity had returned with a lava flow on the E flank, a large strong thermal anomaly, and strong gas-steam emissions containing various amounts of ash. Explosions sent ash to 5-6 km altitude and plumes extended for about 300 km E, SE, and NW on 14 and 18-19 October. On 20-21 and 23-27 October explosions sent ash up to an altitude of 5-7 km; gas-steam plumes containing ash extended for about 335 km in various directions. On 30-31 October and 1-3 November, explosions sent ash up to an altitude of 5-8 km and gas-steam plumes containing ash extended for about 277 km E and SE. Strong thermal anomalies detected from satellite by the MODIS instrument decreased significantly in strength after 2 November.
On 3-5 November, ash plumes extended up to 116 km E. KVERT's report on 10 November noted that activity had decreased significantly during the previous week. Lava effusion onto the flanks was last noted on 3 November; the next day the thermal anomaly was weaker. Ash plumes were last detected in satellite images during 3-4 November. The ACC was lowered to Yellow on 7 November. However, moderate activity continued and thermal anomalies and Strombolian activity could still be observed. Strong gas-and-steam emissions continued. On 16 November, an ash plume extended up to 85 km NW. KVERT reported a daily thermal anomaly visible in satellite images during 18-25 November.
Activity during December 2016-March 2017. Thermal anomaly data after early November 2016 was not sufficient to cause alerts on MODVOLC, and was seen to be very weak and fluctuating in MIROVA plots before ending completely in mid-February 2017 (see figure 19). On 26 December KVERT reported that a weak thermal anomaly had been detected and that gas-and-steam plumes sometimes contained small amounts of ash. Over the next few months the ACC was frequently changed between Yellwo and Orange, depending on the ash plume hazard to aviation.
Explosions on 1 January 2017 generated ash plumes that rose to an altitude of 5 km and drifted 114 km SE, resulting in KVERT raising the ACC to Orange. Daily satellite imagery showed a thermal anomaly over the volcano during 2-6 January. Gas-and-steam emissions sometimes with minor ash, along with thermal anomalies, continued through 20 January. During 9-10 January ash plumes drifted 160 km ESE, and on 22 January an ash plume rose to 5-5.5 km and drifted 45 km E.
KVERT reported that a thermal anomaly was identified in satellite data during 25 February and 1-3, 5, and 8-9 March. At 1340 on 2 March a gas, steam, and ash plume recorded by the webcam rose to altitudes of 8-9 km and drifted 110 km NE and NW. Explosions on 8 March produced ash plumes that rose to 5.5 km altitude and drifted about 20 km NW. As of 24 March gas-and-steam emissions continued to rise from the crater, and a weak thermal anomaly was sometimes identified in satellite images, but no explosions had been detected since 8 March. On 24 March the ACC was lowered to Green.
A gas, steam, and ash plume identified in satellite data on 28 March rose to altitudes of 5-6 km and drifted 108 km ENE, resulting in the ACC being raised to Yellow. Another ash plume the next day that rose to as high as 7.5 km altitude and drifted 75 km SW prompted an Orange ACC status. Additional explosions during 27-30 March generated ash plumes to an altitude of 7 km that drifted 300 km in multiple directions.
Geologic Background. Klyuchevskoy is the highest and most active volcano on the Kamchatka Peninsula. Since its origin about 6,000 years ago, this symmetrical, basaltic stratovolcano has produced frequent moderate-volume explosive and effusive eruptions without major periods of inactivity. It rises above a saddle NE of Kamen volcano and lies SE of the broad Ushkovsky massif. More than 100 flank eruptions have occurred during approximately the past 3,000 years, with most lateral craters and cones occurring along radial fissures between the unconfined NE-to-SE flanks of the conical volcano between 500 and 3,600 m elevation. Eruptions recorded since the late 17th century have resulted in frequent changes to the morphology of the 700-m-wide summit crater. These eruptions over the past 400 years have originated primarily from the summit crater, but have also included numerous major explosive and effusive eruptions from flank craters.
Information Contacts: Kamchatka Volcanic Eruptions Response Team (KVERT), Far East Division, Russian Academy of Sciences, 9 Piip Blvd., Petropavlovsk-Kamchatsky, 683006, Russia (URL: http://www.kscnet.ru/ivs/); Hawai'i Institute of Geophysics and Planetology (HIGP), MODVOLC Thermal Alerts System, School of Ocean and Earth Science and Technology (SOEST), Univ. of Hawai'i, 2525 Correa Road, Honolulu, HI 96822, USA (URL: http://modis.higp.hawaii.edu/); MIROVA (Middle InfraRed Observation of Volcanic Activity), a collaborative project between the Universities of Turin and Florence (Italy) supported by the Centre for Volcanic Risk of the Italian Civil Protection Department (URL: http://www.mirovaweb.it/).
Pacaya
Guatemala
14.382°N, 90.601°W; summit elev. 2569 m
All times are local (unless otherwise noted)
Summary of 2004-2010 eruptions including a fatality in May 2010; lava flows in 2013-2014
Guatemala's Pacaya volcano has a 450-year record of observations of frequent activity, in addition to confirmed radiocarbon dating of eruptions over the last 1,500 years. Its location, approximately 30 km south of the capital of Guatemala City, makes it both a popular tourist attraction as a national park, and a hazard to the several million people that live within 50 km. Activity during the last 50 years has been characterized by extensive lava flows, bomb-laden Strombolian explosions, and large and small ash plumes that have dispersed ash to cities and towns across the region.
This report summarizes activity at Pacaya during the long-lived 2004-2010 eruptive episode, and continues with the details of activity during the next eruption between March 2013 and April 2014. Most of the information is provided by the Instituto Nacional de Sismologia, Vulcanologia, Meteorologia e Hydrologia (INSIVUMEH), the Coordinadora Nacional para la Reducción de Desastres (CONRED) of Guatemala, and the Washington Volcanic Ash Advisory Center (VAAC), which provides air traffic advisories. Information is also gathered from remote sensing satellite data provided through the University of Hawai'i's MODVOLC program and from Google Earth images.
Renewed Strombolian activity was observed on 19 July 2004 after two years of mostly steam emissions, and again in early December 2004. Intermittent Strombolian explosions accompanied near-continuous lava flows down most flanks of MacKenney Cone from December until 11 September 2005. An explosion on 9 March 2006 was the beginning of a new, lengthy episode characterized by extensive lava flows and few significant ash plumes. Multiple strong thermal anomalies were recorded every month from March 2006 through June 2010, excepting December 2006. It climaxed with a major explosion of ash and lava flows during 27- 28 May 2010, and ended with the last Strombolian explosions recorded on 26 October 2010. After two and a half years of quiet, a new period of Strombolian activity began on 5 March 2013, which included intermittent lava flows. This continued until an outbreak of more extensive lava flows during the second half of January 2014. After a final burst of lava flows in early March, a small ash plume on 10 April 2014 was the last reported activity for four months.
Activity during June 2004-September 2005. Renewed periods of near-continuous tremor and frequent long-period earthquakes were recorded during June- August 2004, after the end of visible incandescence from a long-lived lava lake in June 2001. Incandescence was first reported on 14 June 2004, followed by ejection of lava fragments from a vent at the bottom of the central crater of MacKenney Cone on 19 July (BGVN 30:10). Incandescence was observed during the next few months, and tephra was expelled from the cone during 7-9 December 2004.
A sequence of substantial lava flows was first observed by INSIVUMEH in January 2005; strong thermal signatures were initially captured by MODVOLC beginning on 24 December 2004 and persisted until 28 August 2005. During this period, most of the lava flows covered the NW, N, and NE flanks of the central crater, but some extended up to 300 m down the W and SW flanks (figure 62). An INSIVUMEH report from 2008 noted that in March and April 2005 the growth of N-S oriented cracks on the MacKenney Crater created a new vent on the cone's ENE side. In just a few days, the flow field from this vent grew to about 800 m long and curved westward down the N flank, filling much of the depression formed by the cracks in the subsequent months (BGVN 33:08).
Strombolian explosions reached 100 m above the crater, and avalanches of ejected incandescent blocks produced small ash clouds to low levels during much of 2005. Thermal anomalies ceased at Pacaya after 28 August 2005, although observations by INSIVUMEH of occasional Strombolian activity and ejected bombs were made until 11 September. After that, only weak incandescence was reported in early November and January 2006; a new Strombolian explosion occurred on 9 March 2006.
Activity during 2006-2009. The Strombolian explosions that began on 9 March 2006 ejected material tens of meters above the volcano in pulses of activity lasting 10-30 seconds; on 12 March material rose 250 m above MacKenney Cone. Significant lava flows began in late March, advancing about 150 m from the S and SW edges of the crater. A new flow on 13 April was reported by INSIVUMEH as issuing from a parasitic cone, at the ENE base of the main cone, and was 125 m long by 17 April. During the rest of 2006, lava flows from this vent reached lengths of more than 800 m NW of the summit cone and covered an area N, NE, and NW of the cone, known as the 'meseta' (plateau) popular with visitors to the Park (see figures 39, 40, and 41, BGVN 33:08). The Washington VAAC issued only one ash advisory in 2006, on 28 August, and noted possible ash emissions at 3 km altitude drifting 16 km W.
Throughout 2007, 2008, and 2009, multiple vigorous lava flows traveled in different directions from MacKenney Cone. The new lava flows that emerged from a vent on the ENE flank during March and April 2006 also continued to flow NE and N, and then curved to the W in multiple branches, covering large areas of the plateau between the active cone and the three older cones (Cerro Grande, Cerro Chiquito and Cerro Chino) to the N. These flows were most active through November 2008 (figure 63). Flows down the S and SW flanks continued intermittently and reached lengths of several hundred meters. They were most active between August 2008 and the end of 2009; reaching 800 m long in December 2008. Lava flow volume and explosive activity increased during April 2009; the flows traveled down the S and SW flanks for distances up to 400 m. During July, they traveled as far as 600 m down the flanks, and remained vigorous throughout the rest of the year.
Strombolian explosions were intermittent during this three year period, only reported a handful of times in January, June, and December 2007, February, May, and July 2008, and March and April 2009, with explosions of material to a few tens of meters above the summit cone. These explosions often created gas plumes reported by INSIVUMEH to altitudes of 2-3 km. They reported that material from explosions in March 2009 enlarged the cones in the summit crater, and vigorous degassing contributed to substantial noise. A small spatter cone, 4 m high, was detected in the S part of the crater in late April.
There were only three series of VAAC reports during 2007-2009, two in 2007 and one in 2008. A small ash plume was observed on 6 April 2007 at 4.6 km altitude that drifted less than 10 km SSE before dissipating. On 17 November 2007 a narrow plume was observed in satellite imagery extending 15-25 km NW of the summit at an altitude of 4.3 km. A brief emission of gas and possible ash was reported on 2 November 2008, but dissipated within three hours.
Activity during 2010. During January 2010, the lava flows that had descended the S, SW, and W flanks of MacKenney Cone since 2006 ceased flowing. Strombolian explosions were observed again in early February and new flows originating from a depression on the NE flank of the cone traveled 400 m down the E and NE flanks toward the meseta. Avalanches of blocks from the flow fronts set fire to local vegetation. Significant tephra explosions reached up to 150 m high in late February and lava flows traveled 800 m E (figure 64). Multiple lava flows on the SW flank of MacKenney cone on 20 May 2010 traveled 1.6 km, farther than previously recorded flows.
This increasing activity culminated in a large Strombolian eruption on 27 and 28 May 2010. On 29 May a 90-m-wide lava flow traveled SSE down the flank at an estimated rate of 100 m per hour and burned three houses on the Pacaya Grande ranch (see details in BGVN 39:05). The eruption was characterized in a report from CONRED as having constant explosions that ejected material 500 m into the air. INSIVUMEH reported a continuing series of explosions 5-10 seconds apart that ejected black ash up to 1 km above the crater on 28 May.
Numerous weather clouds prevented the Washington VAAC from determining an altitude of the ash plume until late on 28 May, when it was visible in satellite imagery at about 13 km altitude. Ash plumes drifted 20-30 km NW, causing ashfall as thick as 10 cm in areas downwind, including in Guatemala City, about 30 km NNE. INSIVUMEH reported 5-7 mm of ashfall during 27-28 May at the Aurora International Airport. CONRED reported on 28 May that about 1,600 people had been evacuated from six towns 3-4 km W, NNW, N, and NNE, and that the airport was closed. According to a map posted by CONRED, blocks fell in areas as far as 12 km NE, and ash was reported in areas E of Chinautla, 37 km NNE. Reuters News Agency reported that one person (a reporter) died and three children were missing.
The lava flow moving down the SSE flank of MacKenney Cone was shown by MODVOLC thermal alert pixels that persisted through much of June 2010 (figure 65). The lava flowed to within 450 m of several properties including El Chupadero, located 2-2.5 km S of the crater, and disrupted an access road from El Caracol (3 km SW) and Los Pocitos (5.5 km S).
Intermittent Strombolian activity continued into June 2010, with tephra ejected as high as 700 m above the crater. The lava flows on the SE flank remained active through mid-June and had traveled as far as 3.5 km before cooling. By late June, the cone was primarily emitting white and blue fumarolic plumes to several hundred meters. Significant ash emissions and small pyroclastic flows were again reported during the last two weeks of July, causing an evacuation of 150 people from nearby areas. A Washington VAAC report on 22 July noted a plume at an altitude of 4.1 km drifting N, that produced ashfall within 10 km. Strombolian explosions on 24 and 25 July were strong enough to cause a MODVOLC thermal alert pixel at the summit, and to eject tephra blocks onto the flanks.
The last eruptive events of this multi-year eruption were ash plumes emitted in August and Strombolian activity in October 2010. Small ash plumes rose to 800 m above the crater causing ashfall 5 km away on 2 and 3 August. This was followed by a burst of Strombolian explosions during 21-22 and 26 October. After this, only fumarolic emissions of primarily water vapor were reported at Pacaya until a plume of ash-and-gas was reported by INSIVUMEH on 5 March 2013.
A comparison of a geologic map prepared by INSIVUMEH's Rudiger Escobar Wolf in 2010 (also published in BGVN 39:05) and a Google Earth image from December 2010 readily shows the impact of the extensive flows at Pacaya during the 2006-2010 eruptive episode (figure 66).
Activity during March 2013-August 2014. Pacaya remained quiet between October 2010 and March 2013 except for intermittent pulses of seismicity and minor water vapor and gas emissions. An increase in explosions was noted beginning late in 2012, but only steam plumes were observed rising less than 500 m above the summit during January and February 2013. A single MODVOLC thermal alert pixel captured on 2 Feb 2013 to the SE of MacKenney Cone is likely the result of agricultural, not volcanic, activity.
The first report of renewed activity was on 5 March 2013 when INSIVUMEH noted that a thin plume of brown ash accompanied the fumarolic plumes, and dispersed to the S. Weak gas-and-ash plumes recurred several more times during March. On 24 April tephra was ejected 25 m high by weak explosions; incandescence and explosions were detected the next day and again on 29 April. Incandescence was regularly observed during May, and more substantial Strombolian activity started on 20 May and carried through to the end of the month. Tephra ejections rose to 25 m above the crater, and continuous explosions a few minutes apart that ejected bombs and generated rumbles, were heard 4 km away. An explosion on 30 May ejected ash and lapilli 200 m above the crater that was then deposited within 400 m of the crater.
Strombolian activity on 27 June 2013 again ejected small amounts of tephra that were deposited on the W flank. An investigation of the summit crater of MacKenney Cone during June determined that a 15 m high cone had been the source of the most recent explosive activity. An increase in seismicity in late July indicated the continued growth of the pyroclastic cone which had risen to 4 m above the crater rim by 24 July, doubling its total height from June to more than 30 m high. Weak explosions and incandescence were observed the next night, and a Strombolian eruption on 30 July lasted for four hours and ejected material 250 m above the cone. A diffuse ash plume drifted 2 km N, causing ashfall in areas downwind, and another ash plume drifted 5 km S. A prominent hot spot at the summit was reported by the Washington VAAC.
During 9 and 10 August seismicity increased again and Strombolian explosions ejected tephra 200 m above MacKenney Crater and onto the flanks, 400 m from the crater, causing small avalanches on the flanks. Another explosion during the night of 14-15 August produced a 300-m-long lava flow that traveled W from MacKenney Crater; new emissions of ash and gases to 500 m above the crater were reported by the Washington VAAC the next day. Tremors and explosions of incandescent material continued through August and the first half of September ejecting material and sending small ash plumes a few kilometers above the cone. Incandescence was reported as visible from the capital to the N by mid-September. Two MODVOLC thermal anomaly pixels were recorded on 30 August and 3 September confirming the increased thermal activity reported by INSIVUMEH.
In late November 2013 INSIVUMEH reported that activity remained unchanged with weak explosions, gas emissions and tephra ejections continuing. Pilots reported that ash plumes rose to 2.7 km and drifted 10 km SW. This continued into early January 2014 when activity at the main crater increased; seismographs recorded constant tremor, and beginning on 11 January, INSIVUMEH observed tephra explosions to 100 m, gas plumes to 600 m, and new craters on the E, S, and W flanks that produced extensive new lava flows. These flows emitted strong thermal anomaly signatures that were captured by MODVOLC for the next two weeks (figure 67).
At the beginning of this event (on 11 January) CONRED reported evacuations from Villa Canales (14 km NW), El Chupadero (2-2.5 km S), and San Vicente Pacaya (5 km NW). Lava flows had reached 3 km by 13 January. A report on 21 January noted that the S-flank lava flow was 3.6 km long and continued to slowly advance, burning vegetation (figure 68) between the Rodeo and Los Pocitos roads.
Volcanologists observed that the cone in MacKenney Crater had been completely destroyed during the January events, leaving a deep crater that produced fumarolic activity. The Washington VAAC noted an ash plume on 11 January that rose to 3.4 km and extended 55 km SSW from the summit. After that, a prominent hot spot was visible but there was no further indication of ash in satellite imagery. Separate Google Earth images captured in December 2013 and April 2014 show the extent of the new lava flows on the S flank of MacKenney Cone (figure 69) during January 2014.
The next episode of activity began with increased gas-and-vapor plumes during 27-28 February 2014 and included ejection of fine pyroclastic material 600 m S and SW from the crater. INSIVUMEH and CONRED noted increased activity on 2 March; at 0515 Strombolian activity at MacKenney Crater ejected material as high as 800 m and lava flows descended the W flank (figure 70). Explosions produced dense ash plumes that initially rose 2.5 km and drifted 15 km S, SW, and W. Ashfall was reported in El Rodeo (4 km WSW), Patrocinio (about 5 km W), and Francisco de Sales (5 km N). By the next day, activity had decreased, but lava flows traveled up to 1.3 km S and ejected tephra drifted 600 m S and SW. Small explosions and lava flows continued to be active for the next week. MODVOLC thermal alerts were captured around the summit on 2 and 3 March, but no additional thermal alerts were recorded in 2014. The Washington VAAC also noted emissions of gas and volcanic ash on 2 March that rose to 4.9 km altitude and extended over 200 km W before the end of the day. By 3 March an area of light ash remained 370 km W of the volcano off the southern Mexico coast and dissipated during the day.
After INSIVUMEH reported a small ash plume on 10 April 2014, only minor episodes of increased seismicity and steam plumes rising a few tens of meters above the summit were observed through August.
Geologic Background. Eruptions from Pacaya are frequently visible from Guatemala City, the nation's capital. This complex basaltic volcano was constructed just outside the southern topographic rim of the 14 x 16 km Pleistocene Amatitlán caldera. A cluster of dacitic lava domes occupies the southern caldera floor. The post-caldera Pacaya massif includes the older Pacaya Viejo and Cerro Grande stratovolcanoes and the currently active Mackenney stratovolcano. Collapse of Pacaya Viejo between 600 and 1,500 years ago produced a debris-avalanche deposit that extends 25 km onto the Pacific coastal plain and left an arcuate scarp inside which the modern Pacaya volcano (Mackenney cone) grew. The NW-flank Cerro Chino crater was last active in the 19th century. During the past several decades, activity has consisted of frequent Strombolian eruptions with intermittent lava flow extrusion that has partially filled in the caldera moat and covered the flanks of Mackenney cone, punctuated by occasional larger explosive eruptions that partially destroy the summit.
Information Contacts: Instituto Nacional de Sismologia, Vulcanologia, Meteorologia e Hydrologia (INSIVUMEH), Unit of Volcanology, Geologic Department of Investigation and Services, 7a Av. 14-57, Zona 13, Guatemala City, Guatemala (URL: http://www.insivumeh.gob.gt/); Coordinadora Nacional para la Reducción de Desastres (CONRED), Av. Hincapié 21-72, Zona 13, Guatemala City, Guatemala (URL: http://conred.gob.gt/www/index.php); Washington Volcanic Ash Advisory Center (VAAC), Satellite Analysis Branch (SAB), NOAA/NESDIS OSPO, NOAA Science Center Room 401, 5200 Auth Rd, Camp Springs, MD 20746, USA (URL: http://www.ospo.noaa.gov/Products/atmosphere/vaac/, archive at: http://www.ssd.noaa.gov/VAAC/archive.html); Hawai'i Institute of Geophysics and Planetology (HIGP), MODVOLC Thermal Alerts System, School of Ocean and Earth Science and Technology (SOEST), Univ. of Hawai'i, 2525 Correa Road, Honolulu, HI 96822, USA (URL: http://modis.higp.hawaii.edu/); Google Earth (URL: https://www.google.com/earth/); Reuters News Agency (URL: http://www.reuters.com/article/us-guatemala-volcano-idUSTRE64R11M20100528?pageNumber=2).
Paluweh (Indonesia) — April 2017 Cite this Report
Paluweh
Indonesia
8.32°S, 121.708°E; summit elev. 875 m
All times are local (unless otherwise noted)
Two major pyroclastic flows in February and August 2013; five fatalities on 10 August 2013
Mount Rokatenda, or Paluweh, on the island of Palu'e, lies north of the primary volcanic arc that cuts across Flores Island in Indonesia's Lesser Sunda Islands, and has seen infrequent activity in modern times. The previous eruption in 1985 from a summit lava dome spread 3 cm of ash over villages on the W side of the island. This report is a summary of the October 2012 to August 2013 eruption, and an update through 2016 that includes information provided by Pusat Vulkanologi dan Mitigasi Bencana Geologi (PVMBG, also known as Indonesian Center for Volcanology and Geological Hazard Mitigation, CVGHM), the Darwin Volcanic Ash Advisory Center (VAAC), and the University of Hawai'i's MODVOLC thermal alert reporting system. Numerous news reports also covered the major explosions during 2013.
Two brief periods of increased seismicity in April 2009 and January 2012 were the only recorded activity at Paluweh since 1985, prior to an eruption that began in October 2012 and continued through August 2013. PVMBG noted the beginning of lava dome growth on 8 October. A substantial number of MODVOLC thermal alert pixels from MODIS satellite data were first recorded on 11 October 2012 and recurred regularly through 20 July 2013. The first ash plumes were reported by the Darwin VAAC on 11 November 2012 and continued several times each month through May 2013, and then again in late June and during 10-12 August. Plumes generally rose to 2-3 km and drifted between 50 and 100 km in various directions, although a large ash plume on 3 February 2013 rose to higher than 13 km and drifted over 500 km SE, S and SW, briefly impacting air travel in NW Australia. A major explosion on 10 August 2013 created a large pyroclastic flow to the NW from the summit that killed five people on the beach. No further explosions were specifically dated after 12 August 2013, and seismicity gradually decreased over the next several months.
Activity during October 2012-April 2013. PVMBG noted lava dome growth, incandescent avalanches, pyroclastic flows, and ash plumes during October 2012 through January 2013. Ejecta as large as 6 cm in diameter was deposited up to 3 km from the summit, and ashfall affected the entire island, averaging 2 cm thick in places; lahars and ash damaged homes and infrastructure on the island (BGVN 39:01). A large eruption on 2 February 2013, which produced a 13-km-high ash plume the next day, generated a substantial SO2 signature, pyroclastic flows to the S and SW, and avalanches. Residents of eight villages were evacuated and significant ashfall was reported up to 1 mm thick in Ende (60 km S on East Nusa Tenggara Island). Thick ashfall was also reported in Ona (SE part of the island) and thin deposits were reported in other areas of the island to the W, N, and E. During a field expedition on 7 February, PVMBG staff observed that about 25% of the S portion of the dome was lost; the lava-dome volume had been an estimated 5.1 million cubic meters on 13 January, prior to the explosion.
After the large early February 2013 explosion, many intermittent low-level ash emissions continued through the last week in May, with over 175 VAAC reports issued from the Darwin VAAC during the period. NASA's Earth Observatory (EO) identified an ash plume in MODIS satellite images drifting over 440 km SW on 24 March 2013, and discoloration of the seawater from ash W of the island (figure 7).
Another NASA-EO image captured on 19 April 2013 shows the extent of ash deposits covering areas of the S and E sides of the summit where the plumes most commonly drift. A delta extending S into the Flores Sea, which was visible in imagery on 12 February and likely created by a pyroclastic flow during the large 2-3 February explosion (figure 8), was also visible.
Activity during May-August 2013. There was a three-week break in reported ash plumes between 25 May and 19 June when a low level plume rising to 2.4 km was observed drifting 37 km SE. After this, no further activity was reported until 10 August. A large and deadly explosion took place on 10 August, producing an ash plume that rose to 4.3 km and drifted 130 km W. Details of the explosion are given in BGVN 39:01 and additional information is provided in this report. According to PVMBG, a substantial pyroclastic flow traveled NW from the summit down the Ojaubi drainage towards a village on the beach and killed five fisherman. Rescuers noted that the ground was hot and covered with 10-20 cm of ash. NASA-EO captured images before and after the 10 August 2013 eruption where the path of the pyroclastic flow to the NW is clearly visible (figure 9).
Activity during 2014-2016. In April 2014, PVMBG noted that the last major explosion had been on 10 August 2013. The last 2013 ash plume recorded by the Darwin VAAC was on 12 August 2013. Visual observations of occasional eruptive activity were noted until November 2013; small explosion earthquakes were also reported as being last recorded in November. No changes were observed in the lava dome between September 2013 and March 2014. PVMBG lowered the Alert level from III to II (on a scale of 1-4) on 7 April 2014.
No additional reports of activity at Paluweh appeared until late 2015, when PVMBG noted that steam plumes rising 75-200 m above the summit were common between August and October 2015. Seismicity remained low but variable during this time as well. From November 2015 through January 2016, steam plume heights ranged from 5-150 m. Seismicity remained low; earthquakes indicating rock avalanches and fumarolic emissions were the most common type recorded (figure 10). Paluweh remained quiet throughout 2016, although in February 2017 it was still listed by PVMBG at Alert Level II, with a potential for eruptive activity.
Geologic Background. Paluweh, also known as Rokatenda, forms the 8-km-wide island of Palu'e north of the volcanic arc that cuts across Flores Island. The broad irregular summit region contains overlapping craters up to 900 m wide and several lava domes. Several flank vents occur along a NW-trending fissure. A large eruption in 1928 included strong explosive activity accompanied by landslide-induced tsunamis and lava dome emplacement. Pyroclastic flows in August 2013 resulted in fatalities.
Information Contacts: Pusat Vulkanologi dan Mitigasi Bencana Geologi (PVMBG, also known as Indonesian Center for Volcanology and Geological Hazard Mitigation, CVGHM), Jalan Diponegoro 57, Bandung 40122, Indonesia (URL: http://www.vsi.esdm.go.id/); Darwin Volcanic Ash Advisory Centre (VAAC), Bureau of Meteorology, Northern Territory Regional Office, PO Box 40050, Casuarina, NT 0811, Australia (URL: http://www.bom.gov.au/info/vaac/); Hawai'i Institute of Geophysics and Planetology (HIGP), MODVOLC Thermal Alerts System, School of Ocean and Earth Science and Technology (SOEST), Univ. of Hawai'i, 2525 Correa Road, Honolulu, HI 96822, USA (URL: http://modis.higp.hawaii.edu/); NASA Earth Observatory, EOS Project Science Office, NASA Goddard Space Flight Center, Goddard, Maryland, USA (URL: http://earthobservatory.nasa.gov/).
Zhupanovsky (Russia) — April 2017 Cite this Report
Zhupanovsky
Russia
53.589°N, 159.15°E; summit elev. 2899 m
All times are local (unless otherwise noted)
Moderate ash plumes continued until 24 March, then an explosion on 20 November 2016
A brief eruption that began on 23 October 2013 was the first reported activity at Zhupanovsky since 1959 (BGVN 39:09). After another eight months of quiet, eruptive activity began again in early June 2014 that was characterized by periods of frequent, moderate, ash-generating explosions that continued through the end of that year (BGVN 39:09). As described below, similar activity continued from January 2015 through 24 March 2016, with periods of strong explosions generating ash plumes as high as 10 km altitude. Another long period of eight months without observed activity was broken by a large eruption on 20 November 2016. No additional activity was reported through March 2017. Most of the data comes from Kamchatka Volcanic Eruption Response Team (KVERT) reports. Often, the volcano is obscured by clouds. All reported dates are UTC unless otherwise noted (local = -12 hours).
Activity during 2015. According to KVERT, the moderate eruption with explosions generating ash plumes continued into 2015 (table 3). The Aviation Color Code remained Orange (third level on a four-color scale) between 1 January and 15 May 2015. After an explosion on 3 April, explosive activity waned and KVERT lowered the Aviation Color Code from Orange to Yellow (second level on a four-color scale) on 16 May. On 9 June 2015, activity increased again, with webcam and satellite images showing an ash plume rising to an altitude of 6 km. The Aviation Color Code was raised on 8 June to Orange. During an overflight on 16 July, volcanologists observed fresh deposits at the foot of the volcano from collapses of the S section of the active Priemysh Crater that likely occurred on 12 July (figures 7 and 8). Moderate activity at the crater continued through 17 July; the Aviation Color Code was lowered to Yellow on 18 June and to Green on 23 July. On 7 August KVERT reported that explosive activity had ended, but collapses of the S part of the active crater continued. On 6 August ash plumes rose to an altitude of 5 km and drifted 25-60 km SW, triggering KVERT to raise the Aviation Color Code to Yellow. The code was lowered back to Green on 13 August.
Table 3. Summary of reported activity at Zhupanosky, January 2015-March 2016. Data is from webcam images, satellite images, and visual observations. On many days, clouds obscured visibility. Courtesy of KVERT and Tokyo VAAC.
| Date (UTC) |
Ash Plume altitude (km) |
Plume drift |
Thermal anomaly |
Other |
| 2015 Jan 6 |
-- |
50 km E |
-- |
-- |
| 2015 Jan 11-12 |
5 |
40 km SW |
12 Jan |
-- |
| 2015 Jan 17-21 |
-- |
300 km SW, E |
17-20 Jan |
-- |
| 2015 Jan 22, 25-26 |
5-6 |
160 km SW, SE |
23, 25-27 Jan |
-- |
| 2015 Jan 30-6 Feb |
-- |
-- |
Daily |
-- |
| 2015 Feb 6, 9 |
3 |
65 km W |
Daily |
-- |
| 2015 Feb 15-19 |
3-3.5 |
200 km W, SE |
14-15,18 Feb |
-- |
| 2015 Feb 20-27 |
3-3.5 |
250 km E, SE |
20-22, 25-26 Feb |
-- |
| 2015 Feb 27-6 Mar |
3-8 |
400 km E |
27 Feb, 1 Mar |
-- |
| 2015 Mar 7-8 |
6-7 |
333 km E (7, 10 Mar), 232 km NE (8 Mar) |
7-10 Mar |
-- |
| 2015 Mar 12, 15 |
7 |
350 km NE, S |
14-17 Mar |
Incandescence on 15 Mar |
| 2015 Mar 25 |
8 |
100 km ENE |
Daily |
-- |
| 2015 Mar 27-2 Apr |
-- |
-- |
26, 30 Mar, 2 Apr |
-- |
| 2015 Apr 3 |
-- |
25 km SE |
-- |
-- |
| 2015 Apr 9 |
-- |
-- |
9 Apr |
-- |
| 2015 Apr 10-17 |
-- |
-- |
16-17 Apr |
-- |
| 2015 Apr 23-1 May |
-- |
-- |
23, 25, 28 Apr |
-- |
| 2015 May 1-8 |
-- |
-- |
3, 5 May |
-- |
| 2015 May 8-15 |
-- |
-- |
14 May |
-- |
| 2015 May 20-23 |
-- |
470 km E |
23 May |
-- |
| 2015 Jun 7-9 |
6 |
95 km S, 250 km SE |
8-9 June |
-- |
| 2015 Jun 12-19 |
-- |
150 km W |
16 June |
-- |
| 2015 Jul 3-10 |
-- |
SW on 6 July |
-- |
-- |
| 2015 Jul 12 |
10 |
1,100 km SE |
-- |
Ashfall at Petropavlovsk-Kamchatsky (12 Jul) |
| 2015 Jul 14 |
2 |
60 km S |
-- |
-- |
| 2015 Aug 6 |
5 |
25-60 km SW |
-- |
-- |
| 2015 Nov 27 |
6-7 |
300 km E, SE |
Over volcano |
-- |
| 2015 Nov 30 |
9 |
300 km E, SE |
Over both volcano and pyroclastic flow |
Pyroclastic flow deposits 15.5 km long observed on S flank |
| 2015 Dec 3-4 |
-- |
-- |
Over pyroclastic flow |
-- |
| 2015 Dec 5-7 |
-- |
-- |
7 Dec |
-- |
| 2016 Jan 19-21 |
7-8 |
80 km NE, 36 km W |
19, 21 Jan |
Plume 150 km long observed 50 km NE |
| 2016 Jan 24 |
8 |
235 km NNE |
23 Jan |
-- |
| 2016 Jan 29-5 Feb |
-- |
-- |
30 Jan |
-- |
| 2016 Feb 5, 7, 9, 11 |
7 |
546 km E, N |
5,9-11 Feb |
-- |
| 2016 Feb 12-13 |
7; 10; 1 |
2 km E; 50-200 km SE, E; 600 km E, NE; 288 km ESE |
12-13 Feb |
Aviation Color Code raised to Red. |
| 2016 Mar 24 |
8 |
8 x 10 km ash cloud 134 km NW at 3.5-4 km altitude |
-- |
-- |
KVERT indicated that activity remained low until 27 November 2015 when, based on satellite images, ash plumes rose to altitudes of 5-6 km and drifted 285 km E. The Aviation Color Code was raised to Orange. IVS FED RAS (Institute Volcanology and Seismology Far East Division of the Russian Academy of Sciences) observers noted an ash explosion at 0356 on 30 November (UTC); the Tokyo Volcanic Ash Advisory Center (VAAC) reported that the resulting ash plume rose to an altitude of 9 km. Pyroclastic flow deposits 15.5 km long were observed on the S flank after the 30 November event.
According to KVERT, activity decreased after a partial collapse of the S central sector on 27 and 30 November 2015. Satellite images detected a very weak thermal anomaly over the volcano on 4 and 7 December. Moderate levels of fumarolic activity continued. On 10 December the Aviation Color Code was lowered to Yellow. By early-to-mid December 2015, only moderate levels of fumarolic activity were observed. On 17 December the Aviation Color Code was lowered to Green.
KVERT reported that thermal anomalies occurred frequently during the reporting period; often they were obscured by clouds. The only MODVOLC thermal alerts, based on MODIS anomalies, during the reporting period were during March-June 2015: on 7 March, 8 March (2 pixels), 15 March (2 pixels), 21 March (2 pixels), 20 May, and 16 June.
Activity during 2016. The eruption pattern of fluctuating activity levels continued into 2016. Based on visual observations, KVERT reported that at 1636 on 19 January 2016 (UTC), an explosion generated an ash plume that rose to an altitude of 7-8 km and drifted 20 km E (figure 9). The Aviation Color Code was raised to Orange.
Moderate steam-and-gas activity continued during 5 February-18 March. An explosion at 2029 on 12 February (UTC) was recorded by a video camera and generated an ash plume that rose to an altitude of 7 km and drifted E. A larger explosion visually observed a minute later generated an ash plume that rose to an altitude of 10 km and drifted 50 km SE. The Aviation Color Code was raised to Red for several hours. In a report issued at 2334 (UTC), KVERT noted that only moderate amounts of gas and steam rose from the volcano; the Aviation Color Code was lowered to Orange. Ash from the earlier explosions drifted E over Kronotsky Bay and NW. A few hours later, an ash plume was detected in satellite images rising 1 km above the volcano and drifting 288 km E.
The Tokyo VAAC recorded an explosion at 1320 on 24 March (UTC) that generated an ash plume which rose to an altitude of 8 km. After the explosion, no further activity was observed. A very weak thermal anomaly was detected over the volcano in satellite images on 1 and 10 April. The Aviation Color Code was thus lowered to Yellow on 13 April. The last thermal anomaly detection in a satellite image was on 10 April. However, moderate fumarolic activity continued. The Aviation Color Code was lowered to Green on 16 June.
At 1429 on 20 November 2016 a webcam recorded ash plumes rising to altitudes of 6-8 km and drifting 73 km E (figure 10); the Aviation Color Code was raised from Green to Orange. No further activity was observed, and on 22 November the Aviation Color Code was lowered to Yellow.
Geologic Background. The Zhupanovsky volcanic massif consists of four overlapping stratovolcanoes along a WNW-trending ridge. The elongated complex was constructed within a Pliocene-early Pleistocene caldera whose rim is exposed only on the eastern side. Three of the stratovolcanoes were built during the Pleistocene. An early Holocene stage of frequent moderate and weak eruptions from 7,000 to 5,000 years before present (BP) was followed by a period of infrequent larger eruptions that produced pyroclastic flows. The last major eruption took place about 800-900 BP. Recorded eruptions have consisted of relatively minor explosions from Priemysh, the third cone from the E about 2.5 km from the summit peak.
Information Contacts: Kamchatka Volcanic Eruptions Response Team (KVERT), Far East Division, Russian Academy of Sciences, 9 Piip Blvd., Petropavlovsk-Kamchatsky, 683006, Russia (URL: http://www.kscnet.ru/ivs/kvert/); Institute of Volcanology and Seismology, Far Eastern Branch, Russian Academy of Sciences, (IVS FEB RAS), 9 Piip Blvd., Petropavlovsk-Kamchatsky 683006, Russia (URL: http://www.kscnet.ru/ivs/eng/); Tokyo Volcanic Ash Advisory Center (VAAC), 1-3-4 Otemachi, Chiyoda-ku, Tokyo, Japan (URL: http://ds.data.jma.go.jp/svd/vaac/data/); Hawai'i Institute of Geophysics and Planetology (HIGP), MODVOLC Thermal Alerts System, School of Ocean and Earth Science and Technology (SOEST), Univ. of Hawai'i, 2525 Correa Road, Honolulu, HI 96822, USA (URL: http://modis.higp.hawaii.edu/).