Recently Published Bulletin Reports
Erebus (Antarctica) Lava lake remains active; most thermal alerts recorded since 2019
Rincon de la Vieja (Costa Rica) Frequent phreatic explosions during July-December 2023
Bezymianny (Russia) Explosion on 18 October 2023 sends ash plume 8 km high; lava flows and incandescent avalanches
Kilauea (United States) Low-level lava effusions in the lava lake at Halema’uma’u during July-December 2022
Nyamulagira (DR Congo) Lava flows and thermal activity during May-October 2023
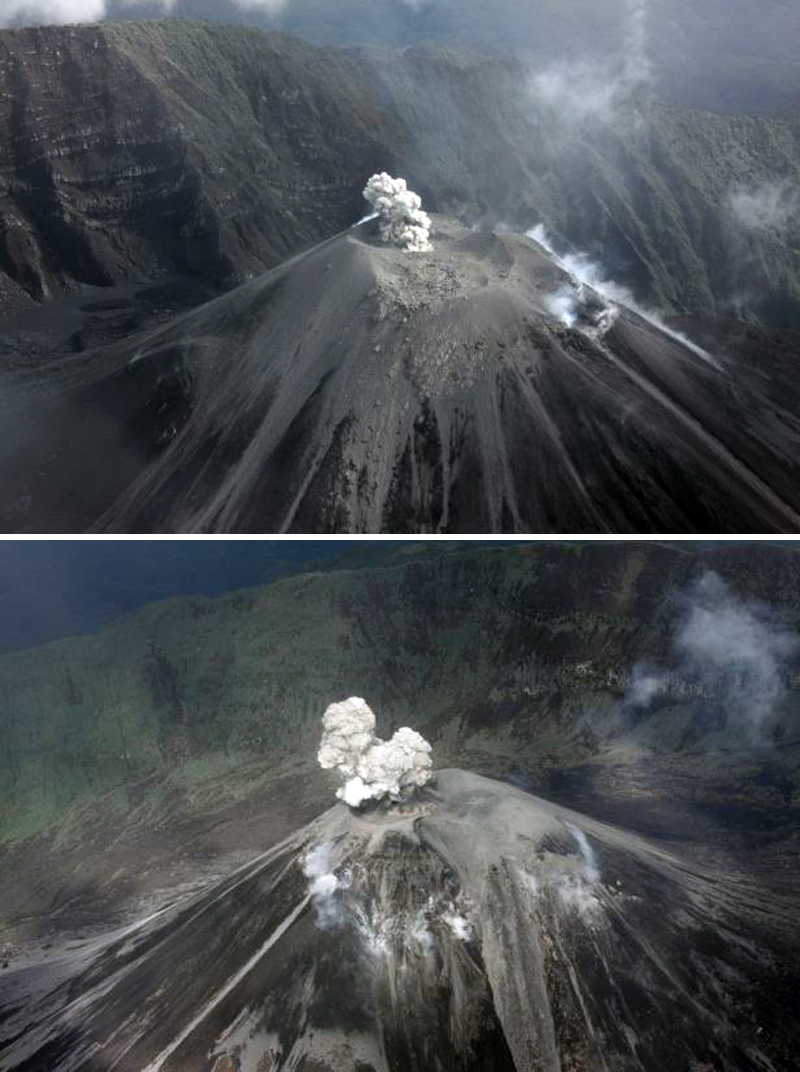
Bagana (Papua New Guinea) Explosions, ash plumes, ashfall, and lava flows during April-September 2023
Mayon (Philippines) Lava flows, pyroclastic flows, ash emissions, and seismicity during April-September 2023
Nishinoshima (Japan) Eruption plumes and gas-and-steam plumes during May-August 2023
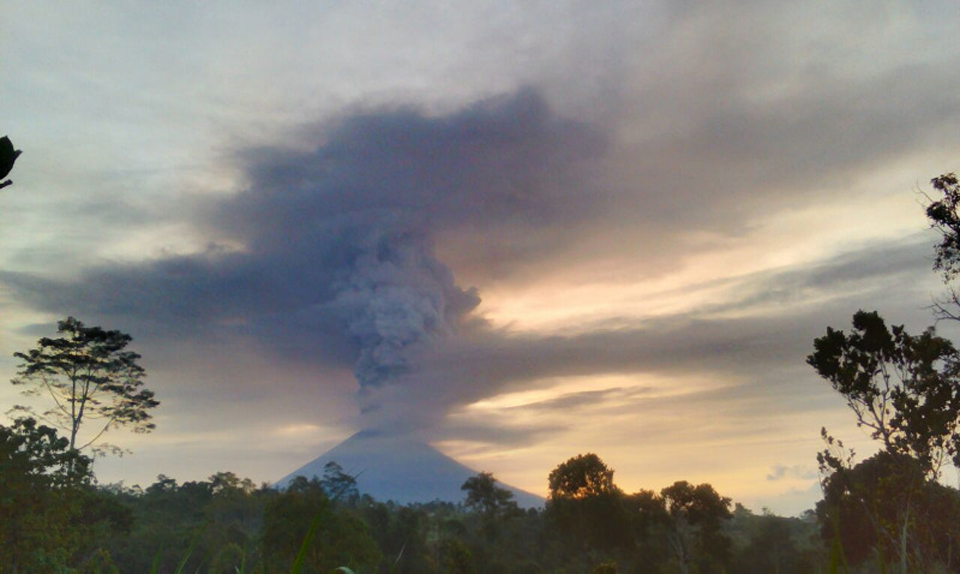
Krakatau (Indonesia) White gas-and-steam plumes and occasional ash plumes during May-August 2023
Merapi (Indonesia) Frequent incandescent avalanches during April-September 2023
Villarrica (Chile) Strombolian activity, gas-and-ash emissions, and crater incandescence during April-September 2023
Ebeko (Russia) Moderate explosive activity with ash plumes continued during June-November 2023
Erebus (Antarctica) — January 2024  Cite this Report
Erebus
Antarctica
77.53°S, 167.17°E; summit elev. 3794 m
All times are local (unless otherwise noted)
Lava lake remains active; most thermal alerts recorded since 2019
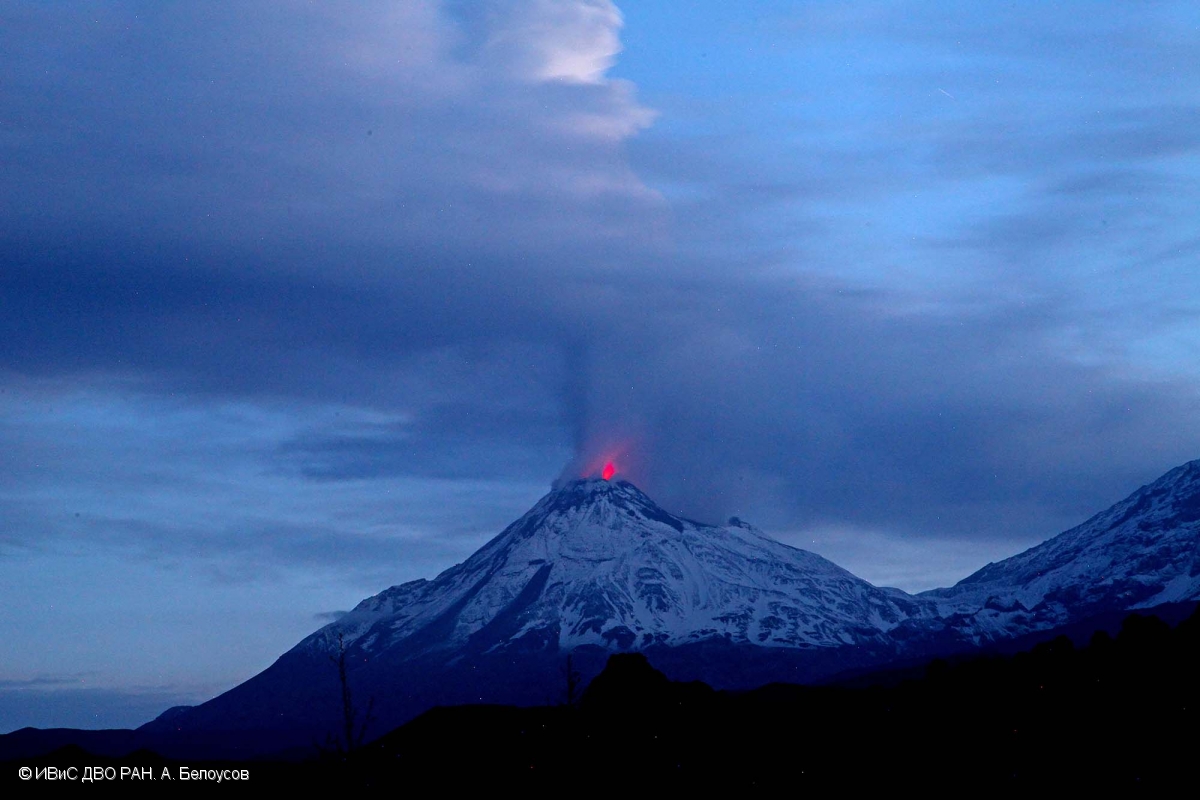
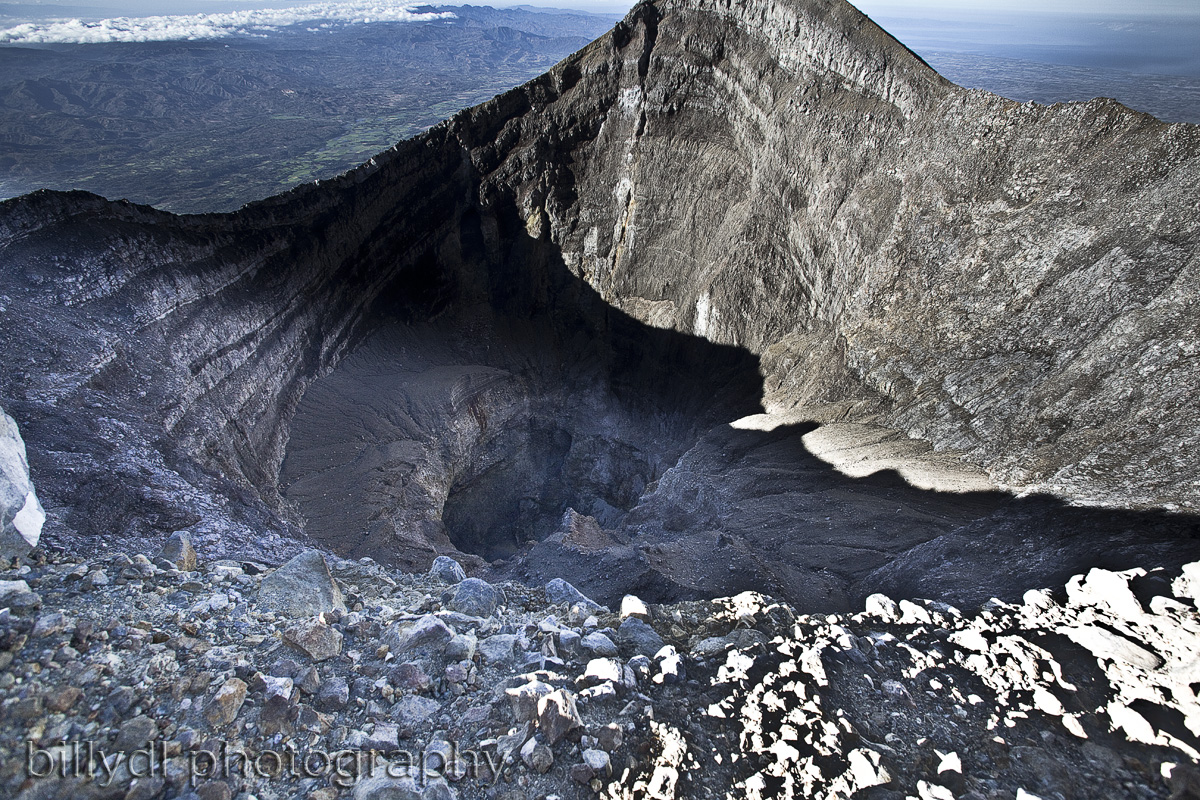
The lava lake in the summit crater of Erebus has been active since at least 1972. Located in Antarctica overlooking the McMurdo Station on Ross Island, it is the southernmost active volcano on the planet. Because of the remote location, activity is primarily monitored by satellites. This report covers activity during 2023.
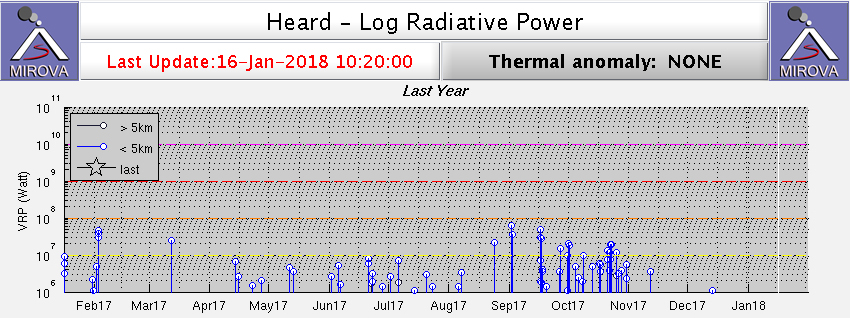
The number of thermal alerts recorded by the Hawai'i Institute of Geophysics and Planetology’s MODVOLC Thermal Alerts System increased considerably in 2023 compared to the years 2020-2022 (table 9). In contrast to previous years, the MODIS instruments aboard the Aqua and Terra satellites captured data from Erebus every month during 2023. Consistent with previous years, the lowest number of anomalous pixels were recorded in January, November, and December.
Table 9. Number of monthly MODIS-MODVOLC thermal alert pixels recorded at Erebus during 2017-2023. See BGVN 42:06 for data from 2000 through 2016. The table was compiled using data provided by the HIGP – MODVOLC Thermal Alerts System.
| Year |
Jan |
Feb |
Mar |
Apr |
May |
Jun |
Jul |
Aug |
Sep |
Oct |
Nov |
Dec |
SUM |
| 2017 |
0 |
21 |
9 |
0 |
0 |
1 |
11 |
61 |
76 |
52 |
0 |
3 |
234 |
| 2018 |
0 |
21 |
58 |
182 |
55 |
17 |
137 |
172 |
103 |
29 |
0 |
0 |
774 |
| 2019 |
2 |
21 |
162 |
151 |
55 |
56 |
75 |
53 |
29 |
19 |
1 |
0 |
624 |
| 2020 |
0 |
2 |
16 |
18 |
4 |
4 |
1 |
3 |
18 |
3 |
1 |
6 |
76 |
| 2021 |
0 |
9 |
1 |
0 |
2 |
56 |
46 |
47 |
35 |
52 |
5 |
3 |
256 |
| 2022 |
1 |
13 |
55 |
22 |
15 |
32 |
39 |
19 |
31 |
11 |
0 |
0 |
238 |
| 2023 |
2 |
33 |
49 |
82 |
41 |
32 |
70 |
64 |
42 |
17 |
5 |
11 |
448 |
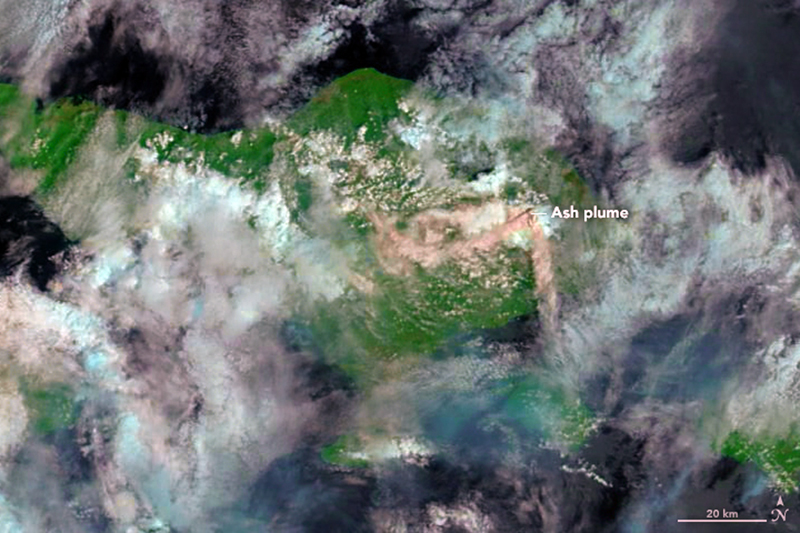
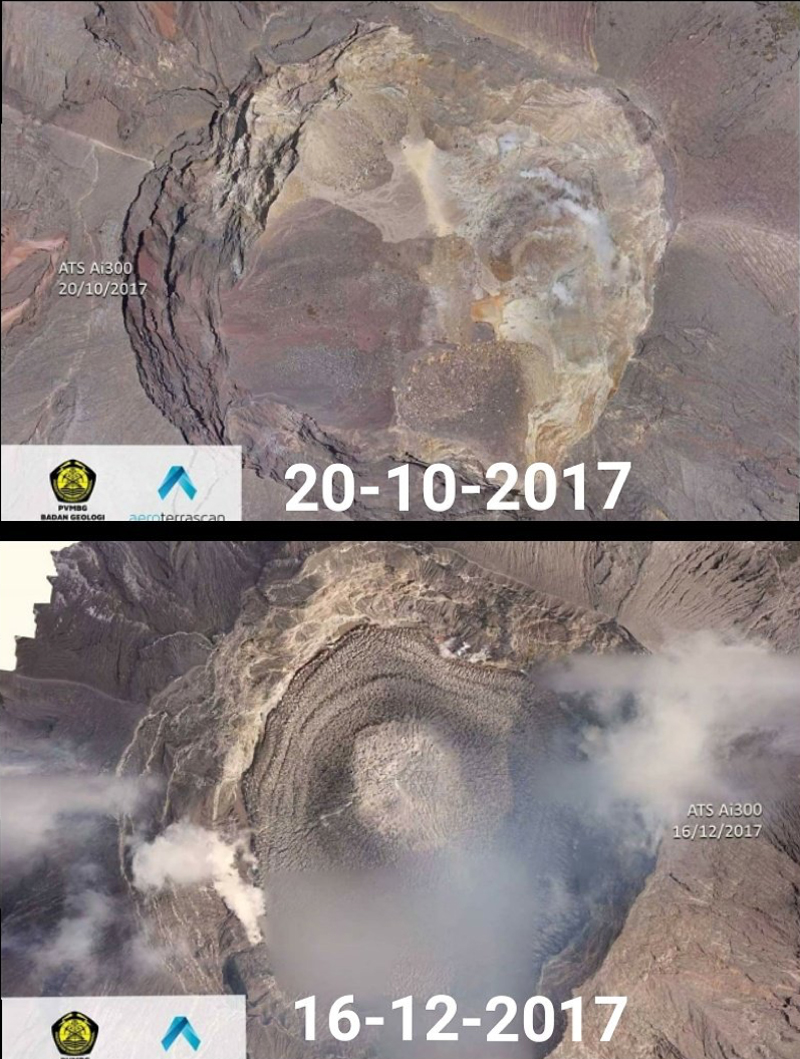
Sentinel-2 infrared images showed one or two prominent heat sources within the summit crater, accompanied by adjacent smaller sources, similar to recent years (see BGVN 46:01, 47:02, and 48:01). A unique image was obtained on 25 November 2023 by the OLI-2 (Operational Land Imager-2) on Landsat 9, showing the upper part of the volcano surrounded by clouds (figure 32).
Geologic Background. Mount Erebus, the world's southernmost historically active volcano, overlooks the McMurdo research station on Ross Island. It is the largest of three major volcanoes forming the crudely triangular Ross Island. The summit of the dominantly phonolitic volcano has been modified by one or two generations of caldera formation. A summit plateau at about 3,200 m elevation marks the rim of the youngest caldera, which formed during the late-Pleistocene and within which the modern cone was constructed. An elliptical 500 x 600 m wide, 110-m-deep crater truncates the summit and contains an active lava lake within a 250-m-wide, 100-m-deep inner crater; other lava lakes are sometimes present. The glacier-covered volcano was erupting when first sighted by Captain James Ross in 1841. Continuous lava-lake activity with minor explosions, punctuated by occasional larger Strombolian explosions that eject bombs onto the crater rim, has been documented since 1972, but has probably been occurring for much of the volcano's recent history.
Information Contacts: Hawai'i Institute of Geophysics and Planetology (HIGP) - MODVOLC Thermal Alerts System, School of Ocean and Earth Science and Technology (SOEST), Univ. of Hawai'i, 2525 Correa Road, Honolulu, HI 96822, USA (URL: http://modis.higp.hawaii.edu/); Copernicus Browser, Copernicus Data Space Ecosystem, European Space Agency (URL: https://dataspace.copernicus.eu/browser/); NASA Earth Observatory, EOS Project Science Office, NASA Goddard Space Flight Center, Goddard, Maryland, USA (URL: https://earthobservatory.nasa.gov/images/152134/erebus-breaks-through).
Rincon de la Vieja (Costa Rica) — January 2024 Cite this Report
Rincon de la Vieja
Costa Rica
10.83°N, 85.324°W; summit elev. 1916 m
All times are local (unless otherwise noted)
Frequent phreatic explosions during July-December 2023
Rincón de la Vieja is a volcanic complex in Costa Rica with a hot convecting acid lake that exhibits frequent weak phreatic explosions, gas-and-steam emissions, and occasional elevated sulfur dioxide levels (BGVN 45:10, 46:03, 46:11). The current eruption period began June 2021. This report covers activity during July-December 2023 and is based on weekly bulletins and occasional daily reports from the Observatorio Vulcanologico Sismologica de Costa Rica-Universidad Nacional (OVSICORI-UNA).
Numerous weak phreatic explosions continued during July-December 2023, along with gas-and-steam emissions and plumes that rose as high as 3 km above the crater rim. Many weekly OVSICORI-UNA bulletins included the previous week's number of explosions and emissions (table 9). For many explosions, the time of explosion was given (table 10). Frequent seismic activity (long-period earthquakes, volcano-tectonic earthquakes, and tremor) accompanied the phreatic activity.
Table 9. Number of reported weekly phreatic explosions and gas-and-steam emissions at Rincón de la Vieja, July-December 2023. Counts are reported for the week before the Weekly Bulletin date; not all reports included these data. Courtesy of OVSICORI-UNA.
| OVSICORI Weekly Bulletin |
Number of explosions |
Number of emissions |
| 28 Jul 2023 |
6 |
14 |
| 4 Aug 2023 |
10 |
12 |
| 1 Sep 2023 |
13 |
11 |
| 22 Sep 2023 |
12 |
13 |
| 29 Sep 2023 |
6 |
11 |
| 6 Oct 2023 |
12 |
5 |
| 13 Oct 2023 |
7 |
9 |
| 20 Oct 2023 |
1 |
15 |
| 27 Oct 2023 |
3 |
23 |
| 3 Nov 2023 |
3 |
10 |
| 17 Nov 2023 |
0 |
Some |
| 24 Nov 2023 |
0 |
14 |
| 8 Dec 2023 |
4 |
16 |
| 22 Dec 2023 |
8 |
18 |
Table 10. Summary of activity at Rincón de la Vieja during July-December 2023. Weak phreatic explosions and gas emissions are noted where the time of explosion was indicated in the weekly or daily bulletins. Height of plumes or emissions are distance above the crater rim. Courtesy of OVSICORI-UNA.
| Date |
Time |
Description of Activity |
| 1 Jul 2023 |
0156 |
Explosion. |
| 2 Jul 2023 |
0305 |
Explosion. |
| 4 Jul 2023 |
0229, 0635 |
Event at 0635 produced a gas-and-steam plume that rose 700 m and drifted W; seen by residents in Liberia (21 km SW). |
| 9 Jul 2023 |
1843 |
Explosion. |
| 21 Jul 2023 |
0705 |
Explosion. |
| 26 Jul 2023 |
1807 |
Explosion. |
| 28 Jul 2023 |
0802 |
Explosion generated a gas-and-steam plume that rose 500 m. |
| 30 Jul 2023 |
1250 |
Explosion. |
| 31 Jul 2023 |
2136 |
Explosion. |
| 11 Aug 2023 |
0828 |
Explosion. |
| 18 Aug 2023 |
1304 |
Explosion. |
| 21 Aug 2023 |
1224 |
Explosion generated gas-and-steam plumes rose 500-600 m. |
| 22 Aug 2023 |
0749 |
Explosion generated gas-and-steam plumes rose 500-600 m. |
| 24 Aug 2023 |
1900 |
Explosion. |
| 25 Aug 2023 |
0828 |
Event produced a steam-and-gas plume that rose 3 km and drifted NW. |
| 27-28 Aug 2023 |
0813 |
Four small events; the event at 0813 on 28 August lasted two minutes and generated a steam-and-gas plume that rose 2.5 km. |
| 1 Sep 2023 |
1526 |
Explosion generated plume that rose 2 km and ejected material onto the flanks. |
| 2-3 Sep 2023 |
- |
Small explosions detected in infrasound data. |
| 4 Sep 2023 |
1251 |
Gas-and-steam plume rose 1 km and drifted W. |
| 7 Nov 2023 |
1113 |
Explosion. |
| 8 Nov 2023 |
0722 |
Explosion. |
| 12 Nov 2023 |
0136 |
Small gas emissions. |
| 14 Nov 2023 |
0415 |
Small gas emissions. |
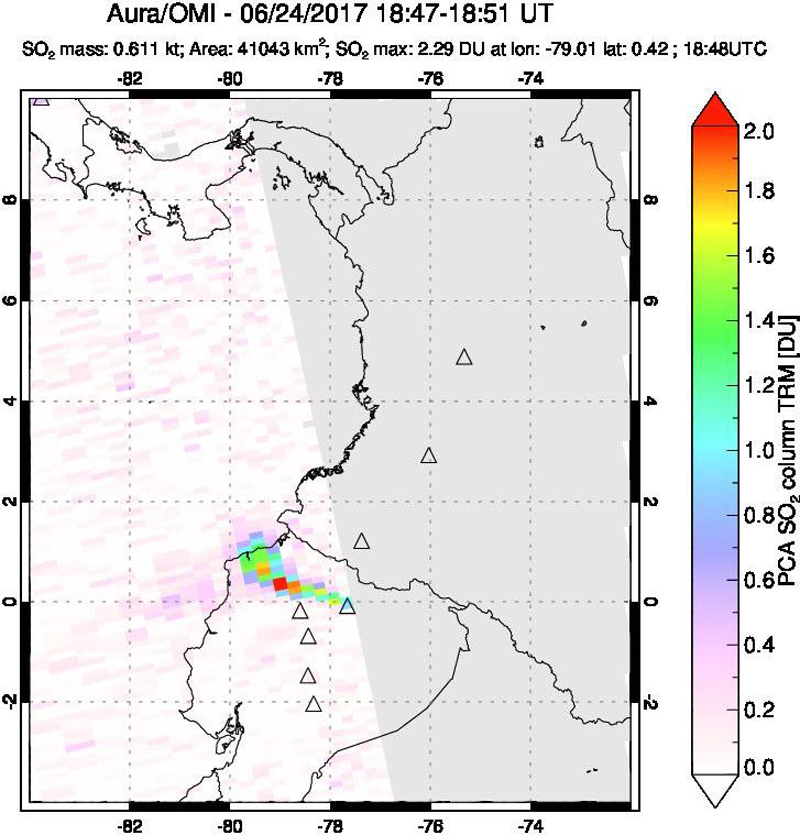
According to OVSICORI-UNA, during July-October the average weekly sulfur dioxide (SO2) flux ranged from 68 to 240 tonnes/day. However, in mid-November the flux increased to as high as 334 tonnes/day, the highest value measured in recent years. The high SO2 flux in mid-November was also detected by the TROPOMI instrument on the Sentinel-5P satellite (figure 43).
Geologic Background. Rincón de la Vieja, the largest volcano in NW Costa Rica, is a remote volcanic complex in the Guanacaste Range. The volcano consists of an elongated, arcuate NW-SE-trending ridge constructed within the 15-km-wide early Pleistocene Guachipelín caldera, whose rim is exposed on the south side. Sometimes known as the "Colossus of Guanacaste," it has an estimated volume of 130 km3 and contains at least nine major eruptive centers. Activity has migrated to the SE, where the youngest-looking craters are located. The twin cone of Santa María volcano, the highest peak of the complex, is located at the eastern end of a smaller, 5-km-wide caldera and has a 500-m-wide crater. A Plinian eruption producing the 0.25 km3 Río Blanca tephra about 3,500 years ago was the last major magmatic eruption. All subsequent eruptions, including numerous historical eruptions possibly dating back to the 16th century, have been from the prominent active crater containing a 500-m-wide acid lake located ENE of Von Seebach crater.
Information Contacts: Observatorio Vulcanológico Sismológica de Costa Rica-Universidad Nacional (OVSICORI-UNA), Apartado 86-3000, Heredia, Costa Rica (URL: http://www.ovsicori.una.ac.cr/); NASA Global Sulfur Dioxide Monitoring Page, Atmospheric Chemistry and Dynamics Laboratory, NASA Goddard Space Flight Center (NASA/GSFC), 8800 Greenbelt Road, Goddard MD 20771, USA (URL: https://so2.gsfc.nasa.gov/).
Bezymianny (Russia) — November 2023 Cite this Report
Bezymianny
Russia
55.972°N, 160.595°E; summit elev. 2882 m
All times are local (unless otherwise noted)
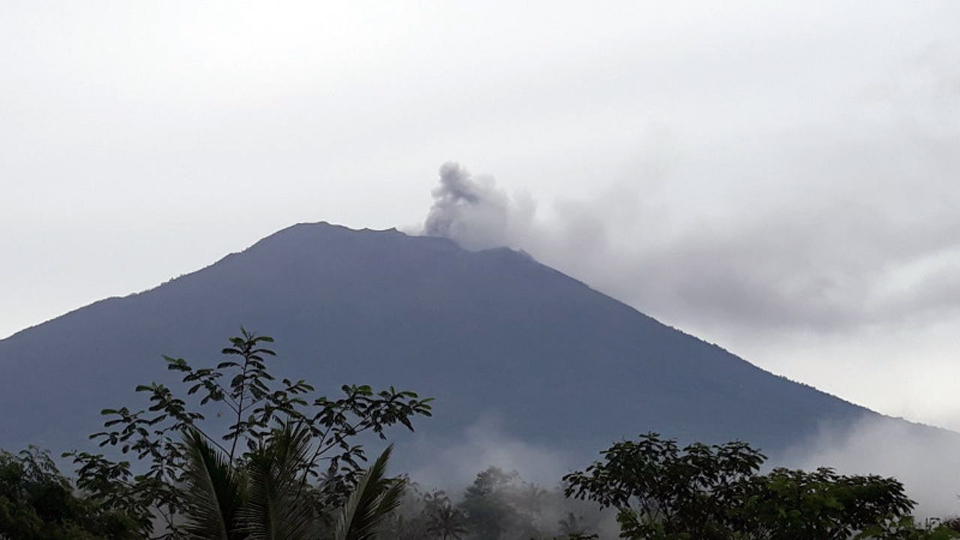
Explosion on 18 October 2023 sends ash plume 8 km high; lava flows and incandescent avalanches
Bezymianny, located on Russia’s Kamchatka Peninsula, has had eruptions since 1955 characterized by dome growth, explosions, pyroclastic flows, ash plumes, and ashfall. Activity during November 2022-April 2023 included gas-and-steam emissions, lava dome collapses generating avalanches, and persistent thermal activity. Similar eruptive activity continued from May through October 2023, described here based on information from weekly and daily reports of the Kamchatka Volcano Eruptions Response Team (KVERT), notices from Tokyo VAAC (Volcanic Ash Advisory Center), and from satellite data.
Overall activity decreased after the strong period of activity in late March through April 2023, which included ash explosions during 29 March and 7-8 April 2023 that sent plumes as high as 10-12 km altitude, along with dome growth and lava flows (BGVN 48:05). This reduced activity can be seen in the MIROVA thermal detection system graph (figure 56), which was consistent with data from the MODVOLC thermal detection system and with Sentinel-2 satellite images that showed persistent hotspots in the summit crater when conditions allowed observations. A renewed period of strong activity began in mid-October 2023.
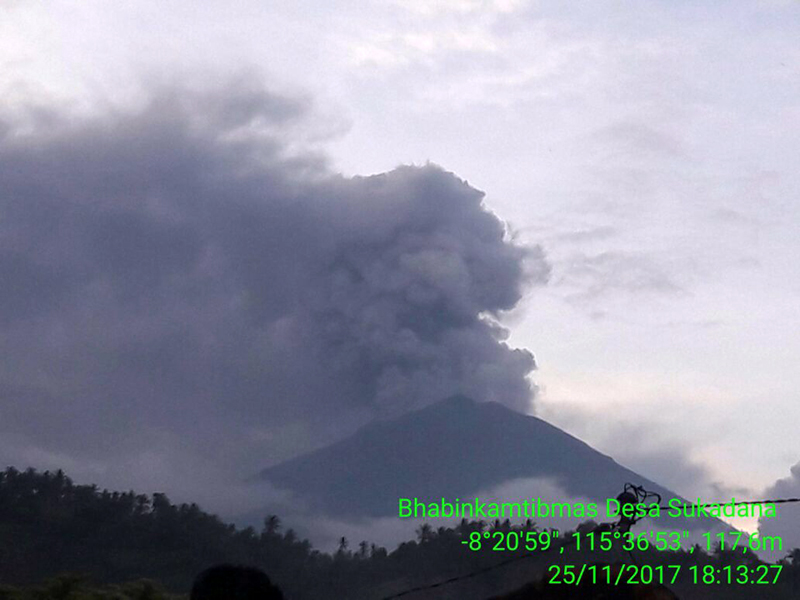
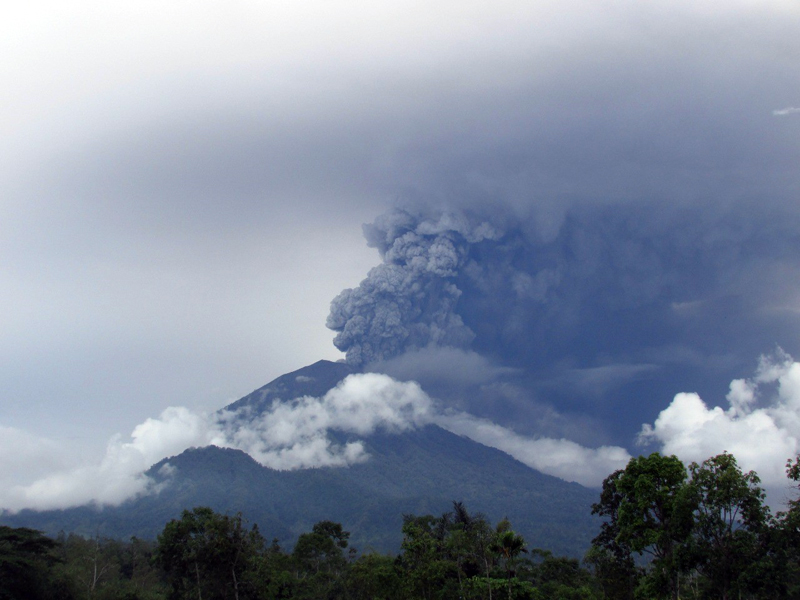
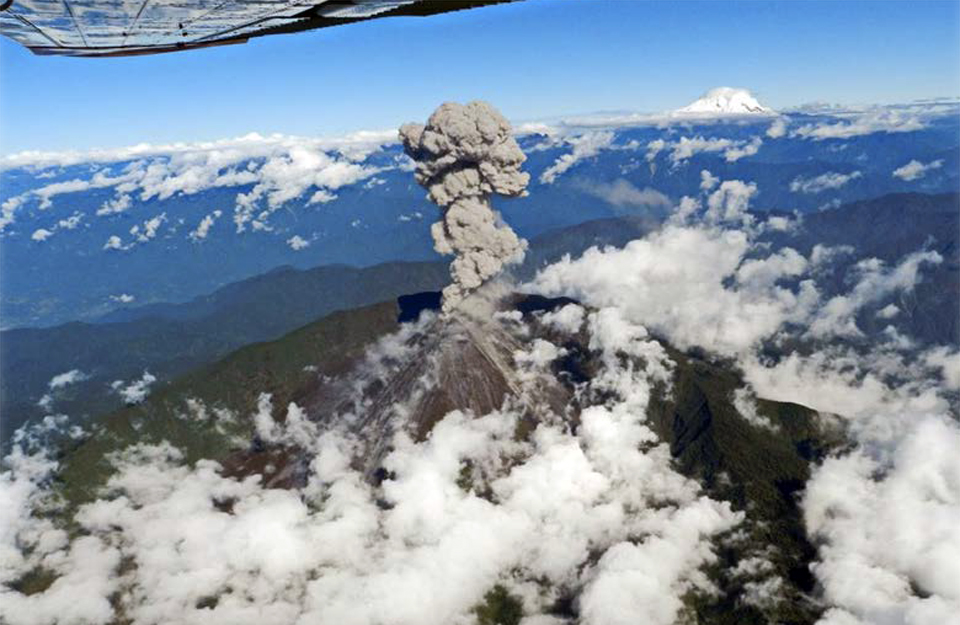
Activity increased significantly on 17 October 2023 when large collapses began during 0700-0830 on the E flanks of the lava dome and continued to after 0930 the next day (figure 57). Ash plumes rose to an altitude of 4.5-5 km, extending 220 km NNE by 18 October. A large explosion at 1630 on 18 October produced an ash plume that rose to an altitude of 11 km (8 km above the summit) and drifted NNE and then NW, extending 900 km NW within two days at an altitude of 8 km. Minor ashfall was noted in Kozyrevsk (45 km WNW). At 0820 on 20 October an ash plume was identified in satellite images drifting 100 km ENE at altitudes of 4-4.5 km.
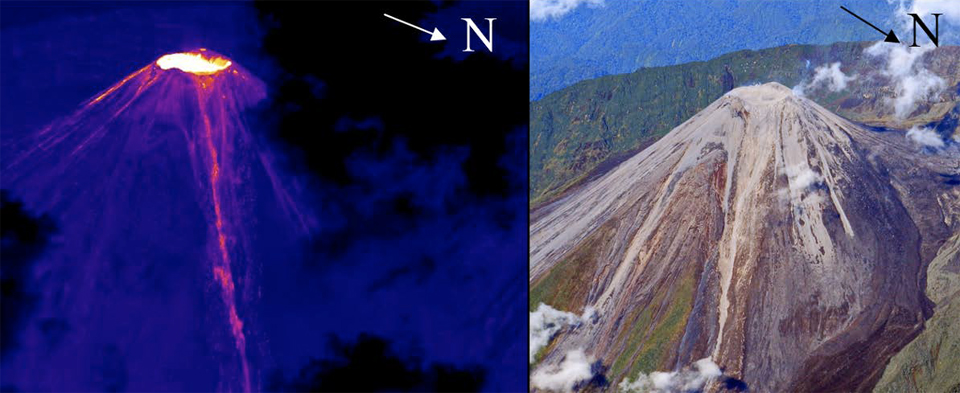
Lava flows and hot avalanches from the dome down the SE flank continued over the next few days, including 23 October when clear conditions allowed good observations (figures 58 and 59). A large thermal anomaly was observed over the volcano through 24 October, and in the summit crater on 30 October (figure 60). Strong fumarolic activity continued, with numerous avalanches and occasional incandescence. By the last week of October, volcanic activity had decreased to a level consistent with that earlier in the reporting period.
Aviation warnings were frequently updated during 17-20 October. KVERT issued a Volcano Observatory Notice for Aviation (VONA) on 17 October at 1419 and 1727 (0219 and 0527 UTC) raising the Aviation Color Code (ACC) from Yellow to Orange (second highest level). The next day, KVERT issued a VONA at 1705 (0505 UTC) raising the ACC to Red (highest level) but lowered it back to Orange at 2117 (0917 UTC). After another decrease to Yellow and back to Orange, the ACC was reduced to Yellow on 20 October at 1204 (0004 UTC). In addition, the Tokyo VAAC issued a series of Volcanic Ash Advisories beginning on 16 October and continuing through 30 October.
Geologic Background. The modern Bezymianny, much smaller than its massive neighbors Kamen and Kliuchevskoi on the Kamchatka Peninsula, was formed about 4,700 years ago over a late-Pleistocene lava-dome complex and an edifice built about 11,000-7,000 years ago. Three periods of intensified activity have occurred during the past 3,000 years. The latest period, which was preceded by a 1,000-year quiescence, began with the dramatic 1955-56 eruption. This eruption, similar to that of St. Helens in 1980, produced a large open crater that was formed by collapse of the summit and an associated lateral blast. Subsequent episodic but ongoing lava-dome growth, accompanied by intermittent explosive activity and pyroclastic flows, has largely filled the 1956 crater.
Information Contacts: Kamchatka Volcanic Eruptions Response Team (KVERT), Far Eastern Branch, Russian Academy of Sciences, 9 Piip Blvd., Petropavlovsk-Kamchatsky, 683006, Russia (URL: http://www.kscnet.ru/ivs/kvert/); Kamchatka Volcanological Station, Kamchatka Branch of Geophysical Survey, (KB GS RAS), Klyuchi, Kamchatka Krai, Russia (URL: http://volkstat.ru/); Tokyo Volcanic Ash Advisory Center (VAAC), 1-3-4 Otemachi, Chiyoda-ku, Tokyo 100-8122, Japan (URL: http://ds.data.jma.go.jp/svd/vaac/data/); Hawai'i Institute of Geophysics and Planetology (HIGP) - MODVOLC Thermal Alerts System, School of Ocean and Earth Science and Technology (SOEST), Univ. of Hawai'i, 2525 Correa Road, Honolulu, HI 96822, USA (URL: http://modis.higp.hawaii.edu/); MIROVA (Middle InfraRed Observation of Volcanic Activity), a collaborative project between the Universities of Turin and Florence (Italy) supported by the Centre for Volcanic Risk of the Italian Civil Protection Department (URL: http://www.mirovaweb.it/); Copernicus Browser, Copernicus Data Space Ecosystem, European Space Agency (URL: https://dataspace.copernicus.eu/browser/).chr
Kilauea (United States) — January 2023 Cite this Report
Kilauea
United States
19.421°N, 155.287°W; summit elev. 1222 m
All times are local (unless otherwise noted)
Low-level lava effusions in the lava lake at Halema’uma’u during July-December 2022
Kīlauea is the southeastern-most volcano in Hawaii and overlaps the E flank of the Mauna Loa volcano. Its East Rift Zone (ERZ) has been intermittently active for at least 2,000 years. An extended eruption period began in January 1983 and was characterized by open lava lakes and lava flows from the summit caldera and the East Rift Zone. During May 2018 magma migrated into the Lower East Rift Zone (LERZ) and opened 24 fissures along a 6-km-long NE-trending fracture zone that produced lava flows traveling in multiple directions. As lava emerged from the fissures, the lava lake at Halema'uma'u drained and explosions sent ash plumes to several kilometers altitude (BGVN 43:10).
The current eruption period started during September 2021 and has recently been characterized by lava effusions, spatter, and sulfur dioxide emissions in the active Halema’uma’u lava lake (BGVN 47:08). Lava effusions, some spatter, and sulfur dioxide emissions have continued during this reporting period of July through December 2022 using daily reports, volcanic activity notices, and abundant photo, map, and video data from the US Geological Survey's (USGS) Hawaiian Volcano Observatory (HVO).
Summary of activity during July-December 2022. Low-level effusions have continued at the western vent of the Halema’uma’u crater during July through early December 2022. Occasional weak ooze-outs (also called lava break outs) would occur along the margins of the crater floor. The overall level of the active lava lake throughout the reporting period gradually increased due to infilling, however it stagnated in mid-September (table 13). During September through November, activity began to decline, though lava effusions persisted at the western vent. By 9 December, the active part of the lava lake had completely crusted over, and incandescence was no longer visible.
Table 13. Summary of measurements taken during overflights at Kīlauea that show a gradual increase in the active lava lake level and the volume of lava effused since 29 September 2021. Lower activity was reported during September-October. Data collected during July-December 2022. Courtesy of HVO.
| Date: |
Level of the active lava lake (m): |
Cumulative volume of lava effused (million cubic meters): |
| 7 Jul 2022 |
130 |
95 |
| 19 Jul 2022 |
133 |
98 |
| 4 Aug 2022 |
136 |
102 |
| 16 Aug 2022 |
137 |
104 |
| 12 Sep 2022 |
143 |
111 |
| 5 Oct 2022 |
143 |
111 |
| 28 Oct 2022 |
143 |
111 |
Activity during July 2022. Lava effusions were reported from the western vent in the Halema’uma’u crater, along with occasional weak ooze-outs along the margins of the crater floor. The height of the lava lake was variable due to deflation-inflation tilt events; for example, the lake level dropped approximately 3-4 m during a summit deflation-inflation event reported on 1 July. Webcam images taken during the night of 6-12 July showed intermittent low-level spattering at the western vent that rose less than 10 m above the vent (figure 519). Measurements made during an overflight on 7 July indicated that the crater floor was infilled about 130 m and that 95 million cubic meters of lava had been effused since 29 September 2021. A single, relatively small lava ooze-out was active to the S of the lava lake. Around midnight on 8 July there were two brief periods of lava overflow onto the lake margins. On 9 July lava ooze-outs were reported near the SE and NE edges of the crater floor and during 10-11 July they occurred near the E, NE, and NW edges. On 16 July crater incandescence was reported, though the ooze-outs and spattering were not visible. On 18 July overnight webcam images showed incandescence in the western vent complex and two ooze-outs were reported around 0000 and 0200 on 19 July. By 0900 there were active ooze-outs along the SW edge of the crater floor. Measurements made from an overflight on 19 July indicated that the crater floor was infilled about 133 m and 98 million cubic meters of lava had erupted since 29 September 2021 (figure 520). On 20 July around 1600 active ooze-outs were visible along the N edge of the crater, which continued through the next day. Extensive ooze-outs occurred along the W margin during 24 July until 1900; on 26 July minor ooze-outs were noted along the N margin. Minor spattering was visible on 29 July along the E margin of the lake. The sulfur dioxide emission rates ranged 650-2,800 tons per day (t/d), the higher of which was measured on 8 July (figure 519).
Activity during August 2022. The eruption continued in the Halema’uma’u crater at the western vent. According to HVO the lava in the active lake remained at the level of the bounding levees. Occasional minor ooze-outs were observed along the margins of the crater floor. Strong nighttime crater incandescence was visible after midnight on 6 August over the western vent cone. During 6-7 August scattered small lava lobes were active along the crater floor and incandescence persisted above the western vent through 9 August. During 7-9 August HVO reported a single lava effusion source was active along the NW margin of the crater floor. Measurements from an overflight on 4 August indicated that the crater floor was infilled about 136 m total and that 102 million cubic meters of lava had been erupted since the start of the eruption. Lava breakouts were reported along the N, NE, E, S, and W margins of the crater during 10-16 August. Another overflight survey conducted on 16 August indicated that the crater floor infilled about 137 m and 104 million cubic meters of lava had been erupted since September 2021. Measured sulfur dioxide emissions rates ranged 1,150-2,450 t/d, the higher of which occurred on 8 August.
Activity during September 2022. During September, lava effusion continued from the western vent into the active lava lake and onto the crater floor. Intermittent minor ooze-outs were reported through the month. A small ooze-out was visible on the W crater floor margin at 0220 on 2 September, which showed decreasing surface activity throughout the day, but remained active through 3 September. On 3 September around 1900 a lava outbreak occurred along the NW margin of the crater floor but had stopped by the evening of 4 September. Field crews monitoring the summit lava lake on 9 September observed spattering on the NE margin of the lake that rose no higher than 10 m, before falling back onto the lava lake crust (figure 521). Overflight measurements on 12 September indicated that the crater floor was infilled a total of 143 m and 111 million cubic meters of lava had been erupted since September 2021. Extensive breakouts in the W and N part of the crater floor were reported at 1600 on 20 September and continued into 26 September. The active part of the lava lake dropped by 10 m while other parts of the crater floor dropped by several meters. Summit tiltmeters recorded a summit seismic swarm of more than 80 earthquakes during 1500-1800 on 21 September, which occurred about 1.5 km below Halema’uma’u; a majority of these were less than Mw 2. By 22 September the active part of the lava lake was infilled about 2 m. On 23 September the western vent areas exhibited several small spatter cones with incandescent openings, along with weak, sporadic spattering (figure 522). The sulfur dioxide emission rate ranged from 930 t/d to 2,000 t/d, the higher of which was measured on 6 September.
Activity during October 2022. Activity during October declined slightly compared to previous months, though lava effusions persisted from the western vent into the active lava lake and onto the crater floor during October (figure 523). Slight variations in the lava lake were noted throughout the month. HVO reported that around 0600 on 3 October the level of the lava lake has lowered slightly. Overflight measurements taken on 5 October indicated that the crater floor was infilled a total of about 143 m and that 111 million cubic meters of lava had been effused since September 2021. During 6-7 October the lake gradually rose 0.5 m. Sulfur dioxide measurements made on 22 October had an emission rate of 700 t/d. Another overflight taken on 28 October showed that there was little to no change in the elevation of the crater floor: the crater floor was infilled a total of 143 m and 111 million cubic meters of lava had erupted since the start of the eruption.
Activity during November 2022. Activity remained low during November, though HVO reported that lava from the western vent continued to effuse into the active lava lake and onto the crater floor throughout the month. The rate of sulfur dioxide emissions during November ranged from 300-600 t/d, the higher amount of which occurred on 9 November.
Activity during December 2022. Similar low activity was reported during December, with lava effusing from the western vent into the active lava lake and onto the crater floor. During 4-5 December the active part of the lava lake was slightly variable in elevation and fluctuated within 1 m. On 9 December HVO reported that lava was no longer erupting from the western vent in the Halema’uma’u crater and that sulfur dioxide emissions had returned to near pre-eruption background levels; during 10-11 December, the lava lake had completely crusted over, and no incandescence was visible (figure 524). Time lapse camera images covering the 4-10 December showed that the crater floor showed weak deflation and no inflation. Some passive events of crustal overturning were reported during 14-15 December, which brought fresh incandescent lava to the lake surface. The sulfur dioxide emission rate was approximately 200 t/d on 14 December. A smaller overturn event on 17 December and another that occurred around 0000 and into the morning of 20 December were also detected. A small seismic swarm was later detected on 30 December.
Geologic Background. Kilauea overlaps the E flank of the massive Mauna Loa shield volcano in the island of Hawaii. Eruptions are prominent in Polynesian legends; written documentation since 1820 records frequent summit and flank lava flow eruptions interspersed with periods of long-term lava lake activity at Halemaumau crater in the summit caldera until 1924. The 3 x 5 km caldera was formed in several stages about 1,500 years ago and during the 18th century; eruptions have also originated from the lengthy East and Southwest rift zones, which extend to the ocean in both directions. About 90% of the surface of the basaltic shield volcano is formed of lava flows less than about 1,100 years old; 70% of the surface is younger than 600 years. The long-term eruption from the East rift zone between 1983 and 2018 produced lava flows covering more than 100 km2, destroyed hundreds of houses, and added new coastline.
Information Contacts: Hawaiian Volcano Observatory (HVO), U.S. Geological Survey, PO Box 51, Hawai'i National Park, HI 96718, USA (URL: http://hvo.wr.usgs.gov/).
Nyamulagira (DR Congo) — November 2023 Cite this Report
Nyamulagira
DR Congo
1.408°S, 29.2°E; summit elev. 3058 m
All times are local (unless otherwise noted)
Lava flows and thermal activity during May-October 2023
Nyamulagira (also known as Nyamuragira) is a shield volcano in the Democratic Republic of Congo with the summit truncated by a small 2 x 2.3 km caldera with walls up to about 100 m high. Documented eruptions have occurred within the summit caldera, as well as from numerous flank fissures and cinder cones. The current eruption period began in April 2018 and has more recently been characterized by summit crater lava flows and thermal activity (BGVN 48:05). This report describes lava flows and variable thermal activity during May through October 2023, based on information from the Observatoire Volcanologique de Goma (OVG) and various satellite data.
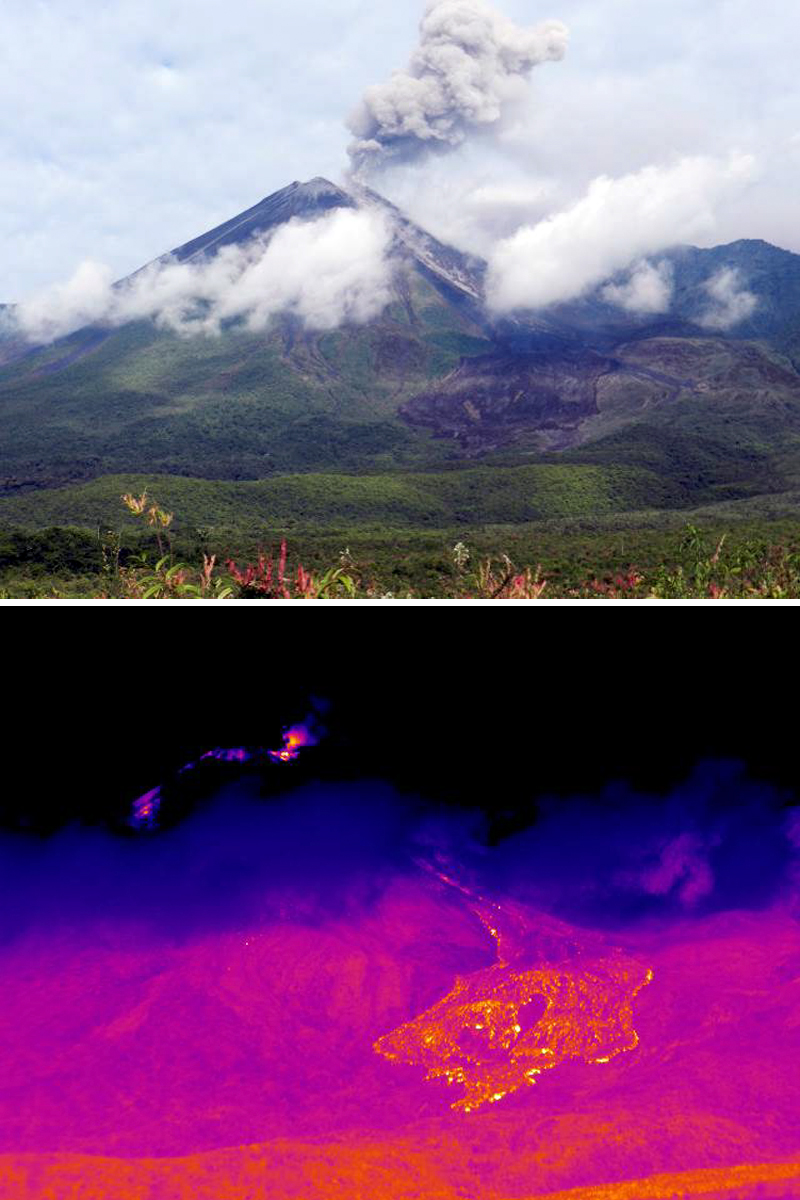
Lava lake activity continued during May. The MIROVA (Middle InfraRed Observation of Volcanic Activity) system recorded moderate-to-strong thermal activity throughout the reporting period; activity was more intense during May and October and relatively weaker from June through September (figure 95). The MODVOLC thermal algorithm, detected a total of 209 thermal alerts. There were 143 hotspots detected during May, eight during June, nine during September, and 49 during October. This activity was also reflected in infrared satellite images, where a lava flow was visible in the NW part of the crater on 7 May and strong activity was seen in the center of the crater on 4 October (figure 96). Another infrared satellite image taken on 12 May showed still active lava flows along the NW margin of the crater. According to OVG lava effusions were active during 7-29 May and moved to the N and NW parts of the crater beginning on 9 May. Strong summit crater incandescence was visible from Goma (27 km S) during the nights of 17, 19, and 20 May (figure 97). On 17 May there was an increase in eruptive activity, which peaked at 0100 on 20 May. Notable sulfur dioxide plumes drifted NW and W during 19-20 May (figure 98). Drone footage acquired in partnership with the USGS (United States Geological Survey) on 20 May captured images of narrow lava flows that traveled about 100 m down the W flank (figure 99). Data from the Rumangabo seismic station indicated a decreasing trend in activity during 17-21 May. Although weather clouds prevented clear views of the summit, a strong thermal signature on the NW flank was visible in an infrared satellite image on 22 May, based on an infrared satellite image. On 28 May the lava flows on the upper W flank began to cool and solidify. By 29 May seismicity returned to levels similar to those recorded before the 17 May increase. Lava effusion continued but was confined to the summit crater; periodic crater incandescence was observed.
Low-level activity was noted during June through October. On 1 June OVG reported that seismicity remained at lower levels and that crater incandescence had been absent for three days, though infrared satellite imagery showed continued lava effusion in the summit crater. The lava flows on the flanks covered an estimated 0.6 km2. Satellite imagery continued to show thermal activity confined to the lava lake through October (figure 96), although no lava flows or significant sulfur dioxide emissions were reported.
Geologic Background. Africa's most active volcano, Nyamulagira (also known as Nyamuragira), is a massive high-potassium basaltic shield about 25 km N of Lake Kivu and 13 km NNW of the steep-sided Nyiragongo volcano. The summit is truncated by a small 2 x 2.3 km caldera that has walls up to about 100 m high. Documented eruptions have occurred within the summit caldera, as well as from the numerous flank fissures and cinder cones. A lava lake in the summit crater, active since at least 1921, drained in 1938, at the time of a major flank eruption. Recent lava flows extend down the flanks more than 30 km from the summit as far as Lake Kivu; extensive lava flows from this volcano have covered 1,500 km2 of the western branch of the East African Rift.
Information Contacts: Observatoire Volcanologique de Goma (OVG), Departement de Geophysique, Centre de Recherche en Sciences Naturelles, Lwiro, D.S. Bukavu, DR Congo; Hawai'i Institute of Geophysics and Planetology (HIGP) - MODVOLC Thermal Alerts System, School of Ocean and Earth Science and Technology (SOEST), Univ. of Hawai'i, 2525 Correa Road, Honolulu, HI 96822, USA (URL: http://modis.higp.hawaii.edu/); MIROVA (Middle InfraRed Observation of Volcanic Activity), a collaborative project between the Universities of Turin and Florence (Italy) supported by the Centre for Volcanic Risk of the Italian Civil Protection Department (URL: http://www.mirovaweb.it/); NASA Global Sulfur Dioxide Monitoring Page, Atmospheric Chemistry and Dynamics Laboratory, NASA Goddard Space Flight Center (NASA/GSFC), 8800 Greenbelt Road, Goddard, Maryland, USA (URL: https://so2.gsfc.nasa.gov/); Copernicus Browser, Copernicus Data Space Ecosystem, European Space Agency (URL: https://dataspace.copernicus.eu/browser/); Charles Balagizi, Goma Volcano Observatory, Departement de Geophysique, Centre de Recherche en Sciences Naturelles, Lwiro, D.S. Bukavu, DR Congo.
Bagana (Papua New Guinea) — October 2023 Cite this Report
Bagana
Papua New Guinea
6.137°S, 155.196°E; summit elev. 1855 m
All times are local (unless otherwise noted)
Explosions, ash plumes, ashfall, and lava flows during April-September 2023
The remote volcano of Bagana is located in central Bougainville Island, Papua New Guinea. Recorded eruptions date back to 1842 and activity has consisted of effusive activity that has built a small lava dome in the summit crater and occasional explosions that produced pyroclastic flows. The most recent eruption has been ongoing since February 2000 and has produced occasional explosions, ash plumes, and lava flows. More recently, activity has been characterized by ongoing effusive activity and ash emissions (BGVN 48:04). This report updates activity from April through September 2023 that has consisted of explosions, ash plumes, ashfall, and lava flows, using information from the Darwin Volcanic Ash Advisory Center (VAAC) and satellite data.
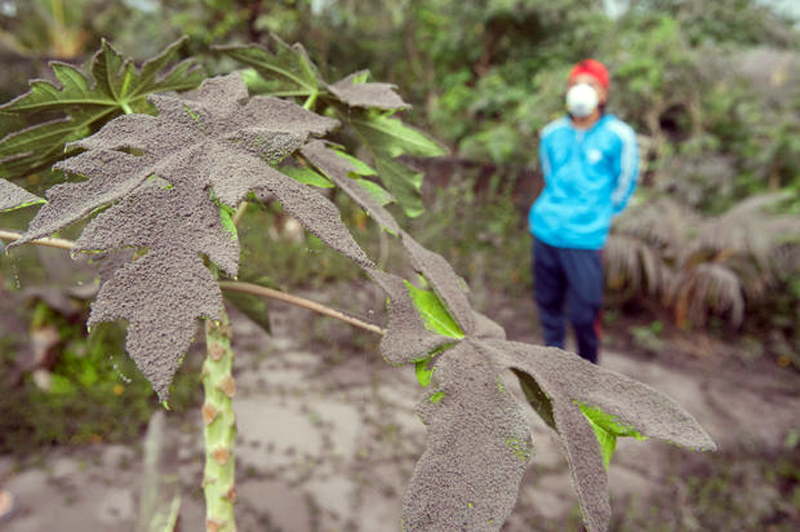
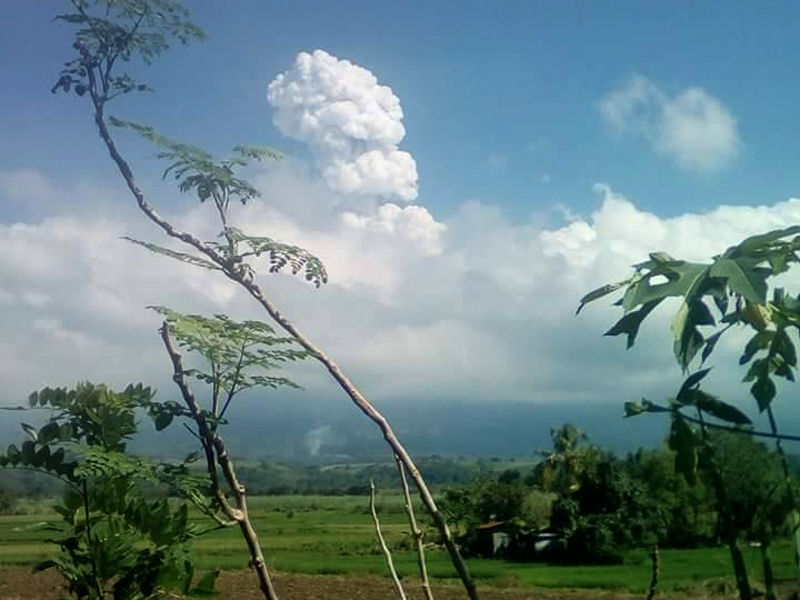
An explosive eruption was reported on 7 July that generated a large gas-and-ash plume to high altitudes and caused significant ashfall in local communities; the eruption plume had reached upper tropospheric (16-18 km altitude) altitudes by 2200, according to satellite images. Sulfur dioxide plumes were detected in satellite images on 8 July and indicated that the plume was likely a mixture of gas, ice, and ash. A report issued by the Autonomous Bougainville Government (ABG) (Torokina District, Education Section) on 10 July noted that significant ash began falling during 2000-2100 on 7 July and covered most areas in the Vuakovi, Gotana (9 km SW), Koromaketo, Laruma (25 km W) and Atsilima (27 km NW) villages. Pyroclastic flows also occurred, according to ground-based reports; small deposits confined to one drainage were inspected by RVO during an overflight on 17 July and were confirmed to be from the 7 July event. Ashfall continued until 10 July and covered vegetation, which destroyed bushes and gardens and contaminated rivers and streams.
RVO reported another eruption on 14 July. The Darwin VAAC stated that an explosive event started around 0830 on 15 July and produced an ash plume that rose to 16.5 km altitude by 1000 and drifted N, according to satellite images. The plume continued to drift N and remained visible through 1900, and by 2150 it had dissipated.
Ashfall likely from both the 7 and 15 July events impacted about 8,111 people in Torokina (20 km SW), including Tsito/Vuakovi, Gotana, Koromaketo, Kenaia, Longkogari, Kenbaki, Piva (13 km SW), and Atsinima, and in the Tsitovi district, according to ABG. Significant ashfall was also reported in Ruruvu (22 km N) in the Wakunai District of Central Bougainville, though the thickness of these deposits could not be confirmed. An evacuation was called for the villages in Wakunai, where heavy ashfall had contaminated water sources; the communities of Ruruvu, Togarau, Kakarapaia, Karauturi, Atao, and Kuritaturi were asked to evacuate to a disaster center at the Wakunai District Station, and communities in Torokina were asked to evacuate to the Piva District station. According to a news article, more than 7,000 people needed temporary accommodations, with about 1,000 people in evacuation shelters. Ashfall had deposited over a broad area, contaminating water supplies, affecting crops, and collapsing some roofs and houses in rural areas. Schools were temporarily shut down. Intermittent ash emissions continued through the end of July and drifted NNW, NW, and SW. Fine ashfall was reported on the coast of Torokina, and ash plumes also drifted toward Laruma and Atsilima.
A small explosive eruption occurred at 2130 on 28 July that ejected material from the crater vents, according to reports from Torokina, in addition to a lava flow that contained two lobes. A second explosion was detected at 2157. Incandescence from the lava flow was visible from Piva as it descended the W flank around 2000 on 29 July (figure 47). The Darwin VAAC reported that a strong thermal anomaly was visible in satellite images during 30-31 July and that ash emissions rose to 2.4 km altitude and drifted WSW on 30 July. A ground report from RVO described localized emissions at 0900 on 31 July.
The Darwin VAAC reported that ash plumes were identified in satellite imagery at 0800 and 1220 on 12 August and rose to 2.1 km and 3 km altitude and drifted NW and W, respectively. A news report stated that aid was sent to more than 6,300 people that were adversely affected by the eruption. Photos taken during 17-19 August showed ash emissions rising no higher than 1 km above the summit and drifting SE. A small explosion generated an ash plume during the morning of 19 August. Deposits from small pyroclastic flows were also captured in the photos. Satellite images captured lava flows and pyroclastic flow deposits. Two temporary seismic stations were installed near Bagana on 17 August at distances of 7 km WSW (Vakovi station) and 11 km SW (Kepox station). The Kepox station immediately started to record continuous, low-frequency background seismicity.
Satellite data. Little to no thermal activity was detected during April through mid-July 2023; only one anomaly was recorded during early April and one during early June, according to MIROVA (Middle InfraRed Observation of Volcanic Activity) data (figure 48). Thermal activity increased in both power and frequency during mid-July through September, although there were still some short gaps in detected activity. MODVOLC also detected increased thermal activity during August; thermal hotspots were detected a total of five times on 19, 20, and 27 August. Weak thermal anomalies were also captured in infrared satellite images on clear weather days throughout the reporting period on 7, 12, and 17 April, 27 May, 1, 6, 16, and 31 July, and 19 September (figure 48); a strong thermal anomaly was visible on 31 July. Distinct sulfur dioxide plumes that drifted generally NW were intermittently captured by the TROPOMI instrument on the Sentinel-5P satellite and sometimes exceeded two Dobson Units (DUs) (figure 49).
Geologic Background. Bagana volcano, in a remote portion of central Bougainville Island, is frequently active. This massive symmetrical cone was largely constructed by an accumulation of viscous andesitic lava flows. The entire edifice could have been constructed in about 300 years at its present rate of lava production. Eruptive activity is characterized by non-explosive effusion of viscous lava that maintains a small lava dome in the summit crater, although occasional explosive activity produces pyroclastic flows. Lava flows with tongue-shaped lobes up to 50 m thick and prominent levees descend the flanks on all sides.
Information Contacts: Rabaul Volcano Observatory (RVO), Geohazards Management Division, Department of Mineral Policy and Geohazards Management (DMPGM), PO Box 3386, Kokopo, East New Britain Province, Papua New Guinea; Darwin Volcanic Ash Advisory Centre (VAAC), Bureau of Meteorology, Northern Territory Regional Office, PO Box 40050, Casuarina, NT 0811, Australia (URL: http://www.bom.gov.au/info/vaac/); MIROVA (Middle InfraRed Observation of Volcanic Activity), a collaborative project between the Universities of Turin and Florence (Italy) supported by the Centre for Volcanic Risk of the Italian Civil Protection Department (URL: http://www.mirovaweb.it/); Hawai'i Institute of Geophysics and Planetology (HIGP) - MODVOLC Thermal Alerts System, School of Ocean and Earth Science and Technology (SOEST), Univ. of Hawai'i, 2525 Correa Road, Honolulu, HI 96822, USA (URL: http://modis.higp.hawaii.edu/); NASA Global Sulfur Dioxide Monitoring Page, Atmospheric Chemistry and Dynamics Laboratory, NASA Goddard Space Flight Center (NASA/GSFC), 8800 Greenbelt Road, Goddard, Maryland, USA (URL: https://so2.gsfc.nasa.gov/); Copernicus Browser, Copernicus Data Space Ecosystem, European Space Agency (URL: https://dataspace.copernicus.eu/browser/); Autonomous Bougainville Government, P.O Box 322, Buka, AROB, PNG (URL: https://abg.gov.pg/); Andrew Tupper (Twitter: @andrewcraigtupp); Simon Carn, Geological and Mining Engineering and Sciences, Michigan Technological University, 1400 Townsend Drive, Houghton, MI 49931, USA (URL: http://www.volcarno.com/, Twitter: @simoncarn); Radio NZ (URL: https://www.rnz.co.nz/news/pacific/494464/more-than-7-000-people-in-bougainville-need-temporary-accommodation-after-eruption); USAID, 1300 Pennsylvania Ave, NW, Washington DC 20004, USA (URL: https://www.usaid.gov/pacific-islands/press-releases/aug-08-2023-united-states-provides-immediate-emergency-assistance-support-communities-affected-mount-bagana-volcanic-eruptions).
Mayon (Philippines) — October 2023 Cite this Report
Mayon
Philippines
13.257°N, 123.685°E; summit elev. 2462 m
All times are local (unless otherwise noted)
Lava flows, pyroclastic flows, ash emissions, and seismicity during April-September 2023
Mayon is located in the Philippines and has steep upper slopes capped by a small summit crater. Historical eruptions date back to 1616 CE that have been characterized by Strombolian eruptions, lava flows, pyroclastic flows, and mudflows. Eruptions mostly originated from a central conduit. Pyroclastic flows and mudflows have commonly descended many of the approximately 40 drainages that surround the volcano. The most recent eruption occurred during June through October 2022 and consisted of lava dome growth and gas-and-steam emissions (BGVN 47:12). A new eruption was reported during late April 2023 and has included lava flows, pyroclastic density currents, ash emissions, and seismicity. This report covers activity during April through September 2023 based on daily bulletins from the Philippine Institute of Volcanology and Seismology (PHIVOLCS).
During April through September 2023, PHIVOLCS reported near-daily rockfall events, frequent volcanic earthquakes, and sulfur dioxide measurements. Gas-and-steam emissions rose 100-900 m above the crater and drifted in different directions. Nighttime crater incandescence was often visible during clear weather and was accompanied by incandescent avalanches of material. Activity notably increased during June when lava flows were reported on the S, SE, and E flanks (figure 52). The MIROVA graph (Middle InfraRed Observation of Volcanic Activity) showed strong thermal activity coincident with these lava flows, which remained active through September (figure 53). According to the MODVOLC thermal algorithm, a total of 110 thermal alerts were detected during the reporting period: 17 during June, 40 during July, 27 during August, and 26 during September. During early June, pyroclastic density currents (PDCs) started to occur more frequently.
Low activity was reported during much of April and May; gas-and-steam emissions rose 100-900 m above the crater and generally drifted in different directions. A total of 52 rockfall events and 18 volcanic earthquakes were detected during April and 147 rockfall events and 13 volcanic events during May. Sulfur dioxide flux measurements ranged between 400-576 tons per day (t/d) during April, the latter of which was measured on 29 April and between 162-343 t/d during May, the latter of which was measured on 13 May.
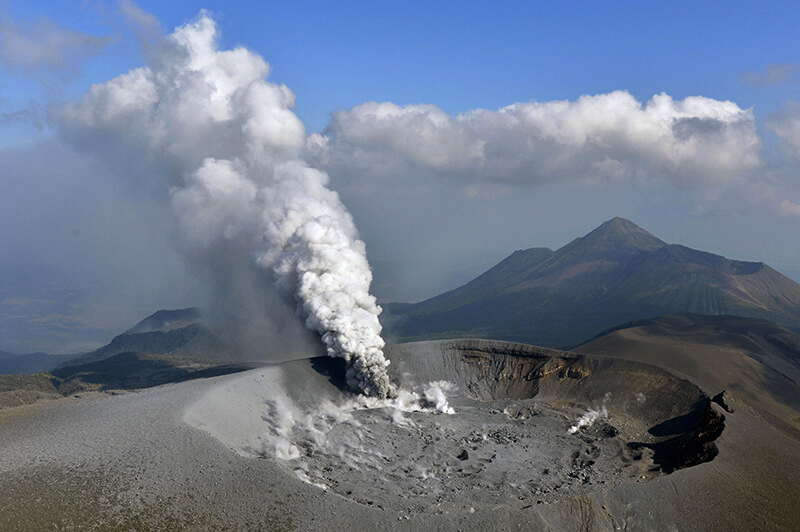
Activity during June increased, characterized by lava flows, pyroclastic density currents (PDCs), crater incandescence and incandescent rockfall events, gas-and-steam emissions, and continued seismicity. Weather clouds often prevented clear views of the summit, but during clear days, moderate gas-and-steam emissions rose 100-2,500 m above the crater and drifted in multiple directions. A total of 6,237 rockfall events and 288 volcanic earthquakes were detected. The rockfall events often deposited material on the S and SE flanks within 700-1,500 m of the summit crater and ash from the events drifted SW, S, SE, NE, and E. Sulfur dioxide emissions ranged between 149-1,205 t/d, the latter of which was measured on 10 June. Short-term observations from EDM and electronic tiltmeter monitoring indicated that the upper slopes were inflating since February 2023. Longer-term ground deformation parameters based on EDM, precise leveling, continuous GPS, and electronic tilt monitoring indicated that the volcano remained inflated, especially on the NW and SE flanks. At 1000 on 5 June the Volcano Alert Level (VAL) was raised to 2 (on a 0-5 scale). PHIVOLCS noted that although low-level volcanic earthquakes, ground deformation, and volcanic gas emissions indicated unrest, the steep increase in rockfall frequency may indicate increased dome activity.
A total of 151 dome-collapse PDCs occurred during 8-9 and 11-30 June, traveled 500-2,000 m, and deposited material on the S flank within 2 km of the summit crater. During 8-9 June the VAL was raised to 3. At approximately 1947 on 11 June lava flow activity was reported; two lobes traveled within 500 m from the crater and deposited material on the S (Mi-isi), SE (Bonga), and E (Basud) flanks. Weak seismicity accompanied the lava flow and slight inflation on the upper flanks. This lava flow remained active through 30 June, moving down the S and SE flank as far as 2.5 km and 1.8 km, respectively and depositing material up to 3.3 km from the crater. During 15-16 June traces of ashfall from the PDCs were reported in Sitio Buga, Nabonton, City of Ligao and Purok, and San Francisco, Municipality of Guinobatan. During 28-29 June there were two PDCs generated by the collapse of the lava flow front, which generated a light-brown ash plume 1 km high. Satellite monitors detected significant concentrations of sulfur dioxide beginning on 29 June. On 30 June PDCs primarily affected the Basud Gully on the E flank, the largest of which occurred at 1301 and lasted eight minutes, based on the seismic record. Four PDCs generated between 1800 and 2000 that lasted approximately four minutes each traveled 3-4 km on the E flank and generated an ash plume that rose 1 km above the crater and drifted N and NW. Ashfall was recorded in Tabaco City.
Similar strong activity continued during July; slow lava effusion remained active on the S and SE flanks and traveled as far as 2.8 km and 2.8 km, respectively and material was deposited as far as 4 km from the crater. There was a total of 6,983 rockfall events and 189 PDCs that affected the S, SE, and E flanks. The volcano network detected a total of 2,124 volcanic earthquakes. Continuous gas-and-steam emissions rose 200-2,000 m above the crater and drifted in multiple directions. Sulfur dioxide emissions averaged 792-4,113 t/d, the latter of which was measured on 28 July. During 2-4 July three PDCs were generated from the collapse of the lava flow and resulting light brown plumes rose 200-300 m above the crater. Continuous tremor pulses were reported beginning at 1547 on 3 July through 7 July at 1200, at 2300 on 8 July and going through 0300 on 10 July, and at 2300 on 16 July, as recorded by the seismic network. During 6-9 July there were 10 lava flow-collapse-related PDCs that generated light brown plumes 300-500 m above the crater. During 10-11 July light ashfall was reported in some areas of Mabinit, Legazpi City, Budiao and Salvacion, Daraga, and Camalig, Albay. By 18 July the lava flow advanced 600 m on the E flank as well.
During 1733 on 18 July and 0434 on 19 July PHIVOLCS reported 30 “ashing” events, which are degassing events accompanied by audible thunder-like sounds and entrained ash at the crater, which produced short, dark plumes that drifted SW. These events each lasted 20-40 seconds, and plume heights ranged from 150-300 m above the crater, as recorded by seismic, infrasound, visual, and thermal monitors. Three more ashing events occurred during 19-20 July. Short-term observations from electronic tilt and GPS monitoring indicate deflation on the E lower flanks in early July and inflation on the NW middle flanks during the third week of July. Longer-term ground deformation parameters from EDM, precise leveling, continuous GPS, and electronic tilt monitoring indicated that the volcano was still generally inflated relative to baseline levels. A short-lived lava pulse lasted 28 seconds at 1956 on 21 July, which was accompanied by seismic and infrasound signals. By 22 July, the only lava flow that remained active was on the SE flank, and continued to extend 3.4 km, while those on the S and E flanks weakened markedly. One ashing event was detected during 30-31 July, whereas there were 57 detected during 31 July-1 August; according to PHIVOLCS beginning at approximately 1800 on 31 July eruptive activity was dominated by phases of intermittent ashing, as well as increased in the apparent rates of lava effusion from the summit crater. The ashing phases consisted of discrete events recorded as low-frequency volcanic earthquakes (LFVQ) typically 30 seconds in duration, based on seismic and infrasound signals. Gray ash plume rose 100 m above the crater and generally drifted NE. Shortly after these ashing events began, new lava began to effuse rapidly from the crater, feeding the established flowed on the SE, E, and E flanks and generating frequent rockfall events.
Intensified unrest persisted during August. There was a total of 4,141 rockfall events, 2,881 volcanic earthquakes, which included volcanic tremor events, 32 ashing events, and 101 PDCs detected throughout the month. On clear weather days, gas-and-steam emissions rose 300-1,500 m above the crater and drifted in different directions (figure 54). Sulfur dioxide emissions averaged 735-4,756 t/d, the higher value of which was measured on 16 August. During 1-2 August the rate of lava effusion decreased, but continued to feed the flows on the SE, S, and E flanks, maintaining their advances to 3.4 km, 2.8 km, and 1.1 km from the crater, respectively (figure 55). Rockfall and PDCs generated by collapses at the lava flow margins and from the summit dome deposited material within 4 km of the crater. During 3-4 August there were 10 tremor events detected that lasted 1-4 minutes. Short-lived lava pulse lasted 35 seconds and was accompanied by seismic and infrasound signals at 0442 on 6 August. Seven collapses were recorded at the front of the lava flow during 12-14 August.
During September, similar activity of slow lava effusion, PDCs, gas-and-steam emissions, and seismicity continued. There was a total of 4,452 rockfall events, 329 volcanic earthquakes, which included volcanic tremor events, two ashing events, and 85 PDCs recorded throughout the month. On clear weather days, gas-and-steam emissions rose 100-1,500 m above the crater and drifted in multiple directions. Sulfur dioxide emissions averaged 609-2,252 t/d, the higher average of which was measured on 6 September. Slow lava effusion continued advancing on the SE, S, and E flanks, maintaining lengths of 3.4 km, 2.8 km, and 1.1 km, respectively. Rockfall and PDC events generated by collapses along the lava flow margins and at the summit dome deposited material within 4 km of the crater.
Geologic Background. Symmetrical Mayon, which rises above the Albay Gulf NW of Legazpi City, is the most active volcano of the Philippines. The steep upper slopes are capped by a small summit crater. Recorded eruptions since 1616 CE range from Strombolian to basaltic Plinian, with cyclical activity beginning with basaltic eruptions, followed by longer periods of andesitic lava flows. Eruptions occur predominately from the central conduit and have also produced lava flows that travel far down the flanks. Pyroclastic density currents and mudflows have commonly swept down many of the approximately 40 ravines that radiate from the summit and have often damaged populated lowland areas. A violent eruption in 1814 killed more than 1,200 people and devastated several towns.
Information Contacts: Philippine Institute of Volcanology and Seismology (PHIVOLCS), Department of Science and Technology, University of the Philippines Campus, Diliman, Quezon City, Philippines (URL: http://www.phivolcs.dost.gov.ph/); MIROVA (Middle InfraRed Observation of Volcanic Activity), a collaborative project between the Universities of Turin and Florence (Italy) supported by the Centre for Volcanic Risk of the Italian Civil Protection Department (URL: http://www.mirovaweb.it/); Hawai'i Institute of Geophysics and Planetology (HIGP) - MODVOLC Thermal Alerts System, School of Ocean and Earth Science and Technology (SOEST), Univ. of Hawai'i, 2525 Correa Road, Honolulu, HI 96822, USA (URL: http://modis.higp.hawaii.edu/); Copernicus Browser, Copernicus Data Space Ecosystem, European Space Agency (URL: https://dataspace.copernicus.eu/browser/); William Rogers, Legazpi City, Albay Province, Philippines.
Nishinoshima (Japan) — October 2023 Cite this Report
Nishinoshima
Japan
27.247°N, 140.874°E; summit elev. 100 m
All times are local (unless otherwise noted)
Eruption plumes and gas-and-steam plumes during May-August 2023
Nishinoshima, located about 1,000 km S of Tokyo, is a small island in the Ogasawara Arc in Japan. The island is the summit of a massive submarine volcano that has prominent submarine peaks to the S, W, and NE. Eruptions date back to 1973 and the current eruption period began in October 2022. Recent activity has consisted of small ash plumes and fumarolic activity (BGVN 48:07). This report covers activity during May through August 2023, using information from monthly reports of the Japan Meteorological Agency (JMA) monthly reports and satellite data.
Activity during May through June was relatively low. The Japan Coast Guard (JCG) did overflights on 14 and 22 June and reported white gas-and-steam emissions rising 600 m and 1,200 m from the central crater of the pyroclastic cone, respectively (figure 125). In addition, multiple white gas-and-steam emissions rose from the inner rim of the W side of the crater and from the SE flank of the pyroclastic cone. Discolored brown-to-green water was observed around almost the entire perimeter of the island; on 22 June light green discolored water was observed off the S coast of the island.
Observations from the Himawari meteorological satellite confirmed an eruption on 9 and 10 July. An eruption plume rose 1.6 km above the crater and drifted N around 1300 on 9 July. Satellite images acquired at 1420 and 2020 on 9 July and at 0220 on 10 July showed continuing emissions that rose 1.3-1.6 km above the crater and drifted NE and N. The Tokyo VAAC reported that an ash plume seen by a pilot and identified in a satellite image at 0630 on 21 July rose to 3 km altitude and drifted S.
Aerial observations conducted by JCG on 8 August showed a white-and-gray plume rising from the central crater of the pyroclastic cone, and multiple white gas-and-steam emissions were rising from the inner edge of the western crater and along the NW-SE flanks of the island (figure 126). Brown-to-green discolored water was also noted around the perimeter of the island.
Intermittent low-to-moderate power thermal anomalies were recorded in the MIROVA graph (Middle InfraRed Observation of Volcanic Activity), showing an increase in both frequency and power beginning in July (figure 127). This increase in activity coincides with eruptive activity on 9 and 10 July, characterized by eruption plumes. According to the MODVOLC thermal alert algorithm, one thermal hotspot was recorded on 20 July. Weak thermal anomalies were also detected in infrared satellite imagery, accompanied by strong gas-and-steam plumes (figure 128).
Geologic Background. The small island of Nishinoshima was enlarged when several new islands coalesced during an eruption in 1973-74. Multiple eruptions that began in 2013 completely covered the previous exposed surface and continued to enlarge the island. The island is the summit of a massive submarine volcano that has prominent peaks to the S, W, and NE. The summit of the southern cone rises to within 214 m of the ocean surface 9 km SSE.
Information Contacts: Japan Meteorological Agency (JMA), 1-3-4 Otemachi, Chiyoda-ku, Tokyo 100-8122, Japan (URL: http://www.jma.go.jp/jma/indexe.html); Tokyo Volcanic Ash Advisory Center (VAAC), 1-3-4 Otemachi, Chiyoda-ku, Tokyo 100-8122, Japan (URL: http://ds.data.jma.go.jp/svd/vaac/data/); MIROVA (Middle InfraRed Observation of Volcanic Activity), a collaborative project between the Universities of Turin and Florence (Italy) supported by the Centre for Volcanic Risk of the Italian Civil Protection Department (URL: http://www.mirovaweb.it/); Copernicus Browser, Copernicus Data Space Ecosystem, European Space Agency (URL: https://dataspace.copernicus.eu/browser/).
Krakatau (Indonesia) — October 2023 Cite this Report
Krakatau
Indonesia
6.1009°S, 105.4233°E; summit elev. 285 m
All times are local (unless otherwise noted)
White gas-and-steam plumes and occasional ash plumes during May-August 2023
Krakatau is located in the Sunda Strait between Java and Sumatra, Indonesia. Caldera collapse during the catastrophic 1883 eruption destroyed Danan and Perbuwatan cones and left only a remnant of Rakata. The post-collapse cone of Anak Krakatau (Child of Krakatau) was constructed within the 1883 caldera at a point between the former Danan and Perbuwatan cones; it has been the site of frequent eruptions since 1927. The current eruption period began in May 2021 and has recently consisted of Strombolian eruptions and ash plumes (BGVN 48:07). This report describes lower levels of activity consisting of ash and white gas-and-steam plumes during May through August 2023, based on information provided by the Indonesian Center for Volcanology and Geological Hazard Mitigation, referred to as Pusat Vulkanologi dan Mitigasi Bencana Geologi (PVMBG), MAGMA Indonesia, and satellite data.
Activity was relatively low during May and June. Daily white gas-and-steam emissions rose 25-200 m above the crater and drifted in different directions. Five ash plumes were detected at 0519 on 10 May, 1241 on 11 May, 0920 on 12 May, 2320 on 12 May, and at 0710 on 13 May, and rose 1-2.5 km above the crater and drifted SW. A webcam image taken on 12 May showed ejection of incandescent material above the vent. A total of nine ash plumes were detected during 6-11 June: at 1434 and 00220 on 6 and 7 June the ash plumes rose 500 m above the crater and drifted NW, at 1537 on 8 June the ash plume rose 1 km above the crater and drifted SW, at 0746 and at 0846 on 9 June the ash plumes rose 800 m and 3 km above the crater and drifted SW, respectively, at 0423, 1431, and 1750 on 10 June the ash plumes rose 2 km, 1.5 km, and 3.5 km above the crater and drifted NW, respectively, and at 0030 on 11 June an ash plume rose 2 km above the crater and drifted NW. Webcam images taken on 10 and 11 June at 0455 and 0102, respectively, showed incandescent material ejected above the vent. On 19 June an ash plume at 0822 rose 1.5 km above the crater and drifted SE.
Similar low activity of white gas-and-steam emissions and few ash plumes were reported during July and August. Daily white gas-and-steam emissions rose 25-300 m above the crater and drifted in multiple directions. Three ash plumes were reported at 0843, 0851, and 0852 on 20 July that rose 500-2,000 m above the crater and drifted NW.
The MIROVA (Middle InfraRed Observation of Volcanic Activity) graph of MODIS thermal anomaly data showed intermittent low-to-moderate power thermal anomalies during May through August 2023 (figure 140). Although activity was often obscured by weather clouds, a thermal anomaly was visible in an infrared satellite image of the crater on 12 May, accompanied by an eruption plume that drifted SW (figure 141).
Geologic Background. The renowned Krakatau (frequently mis-named as Krakatoa) volcano lies in the Sunda Strait between Java and Sumatra. Collapse of an older edifice, perhaps in 416 or 535 CE, formed a 7-km-wide caldera. Remnants of that volcano are preserved in Verlaten and Lang Islands; subsequently the Rakata, Danan, and Perbuwatan cones were formed, coalescing to create the pre-1883 Krakatau Island. Caldera collapse during the catastrophic 1883 eruption destroyed Danan and Perbuwatan, and left only a remnant of Rakata. This eruption caused more than 36,000 fatalities, most as a result of tsunamis that swept the adjacent coastlines of Sumatra and Java. Pyroclastic surges traveled 40 km across the Sunda Strait and reached the Sumatra coast. After a quiescence of less than a half century, the post-collapse cone of Anak Krakatau (Child of Krakatau) was constructed within the 1883 caldera at a point between the former Danan and Perbuwatan cones. Anak Krakatau has been the site of frequent eruptions since 1927.
Information Contacts: Pusat Vulkanologi dan Mitigasi Bencana Geologi (PVMBG, also known as Indonesian Center for Volcanology and Geological Hazard Mitigation, CVGHM), Jalan Diponegoro 57, Bandung 40122, Indonesia (URL: http://www.vsi.esdm.go.id/); MAGMA Indonesia, Kementerian Energi dan Sumber Daya Mineral (URL: https://magma.esdm.go.id/v1); MIROVA (Middle InfraRed Observation of Volcanic Activity), a collaborative project between the Universities of Turin and Florence (Italy) supported by the Centre for Volcanic Risk of the Italian Civil Protection Department (URL: http://www.mirovaweb.it/); Copernicus Browser, Copernicus Data Space Ecosystem, European Space Agency (URL: https://dataspace.copernicus.eu/browser/).
Merapi (Indonesia) — October 2023 Cite this Report
Merapi
Indonesia
7.54°S, 110.446°E; summit elev. 2910 m
All times are local (unless otherwise noted)
Frequent incandescent avalanches during April-September 2023
Merapi, located just north of the major city of Yogyakarta in central Java, Indonesia, has had activity within the last 20 years characterized by pyroclastic flows and lahars accompanying growth and collapse of the steep-sided active summit lava dome. The current eruption period began in late December 2020 and has more recently consisted of ash plumes, intermittent incandescent avalanches of material, and pyroclastic flows (BGVN 48:04). This report covers activity during April through September 2023, based on information from Balai Penyelidikan dan Pengembangan Teknologi Kebencanaan Geologi (BPPTKG), the Center for Research and Development of Geological Disaster Technology, a branch of PVMBG which specifically monitors Merapi. Additional information comes from the Pusat Vulkanologi dan Mitigasi Bencana Geologi (PVMBG, also known as Indonesian Center for Volcanology and Geological Hazard Mitigation, CVGHM), MAGMA Indonesia, the Darwin Volcanic Ash Advisory Centre (VAAC), and various satellite data.
Activity during April through September 2023 primarily consisted of incandescent avalanches of material that mainly affected the SW and W flanks and traveled as far as 2.3 km from the summit (table 25) and white gas-and-steam emissions that rose 10-1,000 m above the crater.
Table 25. Monthly summary of avalanches and avalanche distances recorded at Merapi during April through September 2023. The number of reported avalanches does not include instances where possible avalanches were heard but could not be visually confirmed as a result of inclement weather. Data courtesy of BPPTKG (April-September 2023 daily reports).
| Month |
Average number of avalanches per day |
Distance avalanches traveled (m) |
| Apr 2023 |
19 |
1,200-2,000 |
| May 2023 |
22 |
500-2,000 |
| Jun 2023 |
18 |
1,200-2,000 |
| Jul 2023 |
30 |
300-2,000 |
| Aug 2023 |
25 |
400-2,300 |
| Sep 2023 |
23 |
600-2,000 |
BPPTKG reported that during April and May white gas-and-steam emissions rose 10-750 m above the crater, incandescent avalanches descended 500-2,000 m on the SW and W flanks (figure 135). Cloudy weather often prevented clear views of the summit, and sometimes avalanches could not be confirmed. According to a webcam image, a pyroclastic flow was visible on 17 April at 0531. During the week of 28 April and 4 May a pyroclastic flow was reported on the SW flank, traveling up to 2.5 km. According to a drone overflight taken on 17 May the SW lava dome volume was an estimated 2,372,800 cubic meters and the dome in the main crater was an estimated 2,337,300 cubic meters.
During June and July similar activity persisted with white gas-and-steam emissions rising 10-350 m above the crater and frequent incandescent avalanches that traveled 300-2,000 m down the SW, W, and S flanks (figure 136). Based on an analysis of aerial photos taken on 24 June the volume of the SW lava dome was approximately 2.5 million cubic meters. A pyroclastic flow was observed on 5 July that traveled 2.7 km on the SW flank. According to the Darwin VAAC multiple minor ash plumes were identified in satellite images on 19 July that rose to 3.7 km altitude and drifted S and SW. During 22, 25, and 26 July a total of 17 avalanches descended as far as 1.8 km on the S flank.
Frequent white gas-and-steam emissions continued during August and September, rising 10-450 m above the crater. Incandescent avalanches mainly affected the SW and W flanks and traveled 400-2,300 m from the vent (figure 137). An aerial survey conducted on 10 August was analyzed and reported that estimates of the SW dome volume was 2,764,300 cubic meters and the dome in the main crater was 2,369,800 cubic meters.
Frequent and moderate-power thermal activity continued throughout the reporting period, according to a MIROVA (Middle InfraRed Observation of Volcanic Activity) analysis of MODIS satellite data (figure 138). There was an increase in the number of detected anomalies during mid-May. The MODVOLC thermal algorithm recorded a total of 47 thermal hotspots: six during April, nine during May, eight during June, 15 during July, four during August, and five during September. Some of this activity was captured in infrared satellite imagery on clear weather days, sometimes accompanied by incandescent material on the SW flank (figure 139).
Geologic Background. Merapi, one of Indonesia's most active volcanoes, lies in one of the world's most densely populated areas and dominates the landscape immediately north of the major city of Yogyakarta. It is the youngest and southernmost of a volcanic chain extending NNW to Ungaran volcano. Growth of Old Merapi during the Pleistocene ended with major edifice collapse perhaps about 2,000 years ago, leaving a large arcuate scarp cutting the eroded older Batulawang volcano. Subsequent growth of the steep-sided Young Merapi edifice, its upper part unvegetated due to frequent activity, began SW of the earlier collapse scarp. Pyroclastic flows and lahars accompanying growth and collapse of the steep-sided active summit lava dome have devastated cultivated lands on the western-to-southern flanks and caused many fatalities.
Information Contacts: Balai Penyelidikan dan Pengembangan Teknologi Kebencanaan Geologi (BPPTKG), Center for Research and Development of Geological Disaster Technology (URL: http://merapi.bgl.esdm.go.id/, Twitter: @BPPTKG); MAGMA Indonesia, Kementerian Energi dan Sumber Daya Mineral (URL: https://magma.esdm.go.id/v1); Pusat Vulkanologi dan Mitigasi Bencana Geologi (PVMBG, also known as Indonesian Center for Volcanology and Geological Hazard Mitigation, CVGHM), Jalan Diponegoro 57, Bandung 40122, Indonesia (URL: http://www.vsi.esdm.go.id/); Darwin Volcanic Ash Advisory Centre (VAAC), Bureau of Meteorology, Northern Territory Regional Office, PO Box 40050, Casuarina, NT 0811, Australia (URL: http://www.bom.gov.au/info/vaac/); MIROVA (Middle InfraRed Observation of Volcanic Activity), a collaborative project between the Universities of Turin and Florence (Italy) supported by the Centre for Volcanic Risk of the Italian Civil Protection Department (URL: http://www.mirovaweb.it/); Hawai'i Institute of Geophysics and Planetology (HIGP) - MODVOLC Thermal Alerts System, School of Ocean and Earth Science and Technology (SOEST), Univ. of Hawai'i, 2525 Correa Road, Honolulu, HI 96822, USA (URL: http://modis.higp.hawaii.edu/); Copernicus Browser, Copernicus Data Space Ecosystem, European Space Agency (URL: https://dataspace.copernicus.eu/browser/); Øystein Lund Andersen (URL: https://www.oysteinlundandersen.com/, https://twitter.com/oysteinvolcano).
Villarrica (Chile) — October 2023 Cite this Report
Villarrica
Chile
39.42°S, 71.93°W; summit elev. 2847 m
All times are local (unless otherwise noted)
Strombolian activity, gas-and-ash emissions, and crater incandescence during April-September 2023
Villarrica, in central Chile, consists of a 2-km-wide caldera that formed about 3,500 years ago and is located at the base of the presently active cone at the NW margin of a 6-km-wide caldera. Historical eruptions eruptions date back to 1558 and have been characterized by mild-to-moderate explosive activity with occasional lava effusions. The current eruption period began in December 2014 and has recently consisted of nighttime crater incandescence, ash emissions, and seismicity (BGVN 48:04). This report covers activity during April through September 2023 and describes occasional Strombolian activity, gas-and-ash emissions, and nighttime crater incandescence. Information for this report primarily comes from the Southern Andes Volcano Observatory (Observatorio Volcanológico de Los Andes del Sur, OVDAS), part of Chile's National Service of Geology and Mining (Servicio Nacional de Geología y Minería, SERNAGEOMIN) and satellite data.
Seismicity during April consisted of long period (LP) events and tremor (TRE); a total of 9,413 LP-type events and 759 TR-type events were detected throughout the month. Nighttime crater incandescence persisted and was visible in the degassing column. Sulfur dioxide data was obtained using Differential Absorption Optical Spectroscopy Equipment (DOAS) that showed an average value of 1,450 ± 198 tons per day (t/d) during 1-15 April and 1,129 ± 201 t/d during 16-30 April, with a maximum daily value of 2,784 t/d on 9 April. Gas-and-steam emissions of variable intensities rose above the active crater as high as 1.3 km above the crater on 13 April. Strombolian explosions were not observed and there was a slight decrease in the lava lake level.
There were 14,123 LP-type events and 727 TR-type events detected during May. According to sulfur dioxide measurements taken with DOAS equipment, the active crater emitted an average value of 1,826 ± 482 t/d during 1-15 May and 912 ± 41 t/d during 16-30 May, with a daily maximum value of 5,155 t/d on 13 May. Surveillance cameras showed continuous white gas-and-steam emissions that rose as high as 430 m above the crater on 27 May. Nighttime incandescence illuminated the gas column less than 300 m above the crater rim was and no pyroclastic emissions were reported. A landslide was identified on 13 May on the E flank of the volcano 50 m from the crater rim and extending 300 m away; SERNAGEOMIN noted that this event may have occurred on 12 May. During the morning of 27 and 28 May minor Strombolian explosions characterized by incandescent ejecta were recorded at the crater rim; the last reported Strombolian explosions had occurred at the end of March.
Seismic activity during June consisted of five volcano-tectonic (VT)-type events, 21,606 LP-type events, and 2,085 TR-type events. The average value of sulfur dioxide flux obtained by DOAS equipment was 1,420 ± 217 t/d during 1-15 June and 2,562 ± 804 t/d, with a maximum daily value of 4,810 t/d on 17 June. White gas-and-steam emissions rose less than 480 m above the crater; frequent nighttime crater incandescence was reflected in the degassing plume. On 12 June an emission rose 100 m above the crater and drifted NNW. On 15 June one or several emissions resulted in ashfall to the NE as far as 5.5 km from the crater, based on a Skysat satellite image. Several Strombolian explosions occurred within the crater; activity on 15 June was higher energy and ejected blocks 200-300 m on the NE slope. Surveillance cameras showed white gas-and-steam emissions rising 480 m above the crater on 16 June. On 19 and 24 June low-intensity Strombolian activity was observed, ejecting material as far as 200 m from the center of the crater to the E.
During July, seismicity included 29,319 LP-type events, 3,736 TR-type events, and two VT-type events. DOAS equipment recorded two days of sulfur dioxide emissions of 4,220 t/d and 1,009 t/d on 1 and 13 July, respectively. Constant nighttime incandescence was also recorded and was particularly noticeable when accompanied by eruptive columns on 12 and 16 July. Minor explosive events were detected in the crater. According to Skysat satellite images taken on 12, 13, and 16 July, ashfall deposits were identified 155 m S of the crater. According to POVI, incandescence was visible from two vents on the crater floor around 0336 on 12 July. Gas-and-ash emissions rose as high as 1.2 km above the crater on 13 July and drifted E and NW. A series of gas-and-steam pulses containing some ash deposited material on the upper E flank around 1551 on 13 July. During 16-31 July, average sulfur dioxide emissions of 1,679 ± 406 t/d were recorded, with a maximum daily value of 2,343 t/d on 28 July. Fine ash emissions were also reported on 16, 17, and 23 July.
Seismicity persisted during August, characterized by 27,011 LP-type events, 3,323 TR-type events, and three VT-type events. The average value of sulfur dioxide measurements taken during 1-15 August was 1,642 ± 270 t/d and 2,207 ± 4,549 t/d during 16-31 August, with a maximum daily value of 3,294 t/d on 27 August. Nighttime crater incandescence remained visible in degassing columns. White gas-and-steam emissions rose 480 m above the crater on 6 August. According to a Skysat satellite image from 6 August, ash accumulation was observed proximal to the crater and was mainly distributed toward the E slope. White gas-and-steam emissions rose 320 m above the crater on 26 August. Nighttime incandescence and Strombolian activity that generated ash emissions were reported on 27 August.
Seismicity during September was characterized by five VT-type events, 12,057 LP-type events, and 2,058 TR-type events. Nighttime incandescence persisted. On 2 September an ash emission rose 180 m above the crater and drifted SE at 1643 (figure 125) and a white gas-and-steam plume rose 320 m above the crater. According to the Buenos Aires VAAC, periods of continuous gas-and-ash emissions were visible in webcam images from 1830 on 2 September to 0110 on 3 September. Strombolian activity was observed on 2 September and during the early morning of 3 September, the latter event of which generated an ash emission that rose 60 m above the crater and drifted 100 m from the center of the crater to the NE and SW. Ashfall was reported to the SE and S as far as 750 m from the crater. The lava lake was active during 3-4 September and lava fountaining was visible for the first time since 26 March 2023, according to POVI. Fountains captured in webcam images at 2133 on 3 September and at 0054 on 4 September rose as high as 60 m above the crater rim and ejected material onto the upper W flank. Sulfur dioxide flux of 1,730 t/d and 1,281 t/d was measured on 3 and 4 September, respectively, according to data obtained by DOAS equipment.
Strong Strombolian activity and larger gas-and-ash plumes were reported during 18-20 September. On 18 September activity was also associated with energetic LP-type events and notable sulfur dioxide fluxes (as high as 4,277 t/d). On 19 September Strombolian activity and incandescence were observed. On 20 September at 0914 ash emissions rose 50 m above the crater and drifted SSE, accompanied by Strombolian activity that ejected material less than 100 m SSE, causing fall deposits on that respective flank. SERNAGEOMIN reported that a Planet Scope satellite image taken on 20 September showed the lava lake in the crater, measuring 32 m x 35 m and an area of 0.001 km2. Several ash emissions were recorded at 0841, 0910, 1251, 1306, 1312, 1315, and 1324 on 23 September and rose less than 150 m above the crater. The sulfur dioxide flux value was 698 t/d on 23 September and 1,097 t/d on 24 September. On 24 September the Volcanic Alert Level (VAL) was raised to Orange (the third level on a four-color scale). SENAPRED maintained the Alert Level at Yellow (the middle level on a three-color scale) for the communities of Villarrica, Pucón (16 km N), Curarrehue, and Panguipulli.
During 24-25 September there was an increase in seismic energy (observed at TR-events) and acoustic signals, characterized by 1 VT-type event, 213 LP-type events, and 124 TR-type events. Mainly white gas-and-steam emissions, in addition to occasional fine ash emissions were recorded. During the early morning of 25 September Strombolian explosions were reported and ejected material 250 m in all directions, though dominantly toward the NW. On 25 September the average value of sulfur dioxide flux was 760 t/d. Seismicity during 25-30 September consisted of five VT-type events, 1,937 LP-type events, and 456 TR-type events.
During 25-29 September moderate Strombolian activity was observed and ejected material as far as the crater rim. In addition, ash pulses lasting roughly 50 minutes were observed around 0700 and dispersed ENE. During 26-27 September a TR episode lasted 6.5 hours and was accompanied by discrete acoustic signals. Satellite images from 26 September showed a spatter cone on the crater floor with one vent that measured 10 x 14 m and a smaller vent about 35 m NE of the cone. SERNAGEOMIN reported an abundant number of bomb-sized blocks up to 150 m from the crater, as well as impact marks on the snow, which indicated explosive activity. A low-altitude ash emission was observed drifting NW around 1140 on 28 September, based on webcam images. Between 0620 and 0850 on 29 September an ash emission rose 60 m above the crater and drifted NW. During an overflight taken around 1000 on 29 September scientists observed molten material in the vent, a large accumulation of pyroclasts inside the crater, and energetic degassing, some of which contained a small amount of ash. Block-sized pyroclasts were deposited on the internal walls and near the crater, and a distal ash deposit was also visible. The average sulfur dioxide flux measured on 28 September was 344 t/d. Satellite images taken on 29 September ashfall was deposited roughly 3 km WNW from the crater and nighttime crater incandescence remained visible. The average sulfur dioxide flux value from 29 September was 199 t/d. On 30 September at 0740 a pulsating ash emission rose 1.1 km above the crater and drifted NNW (figure 126). Deposits on the S flank extended as far as 4.5 km from the crater rim, based on satellite images from 30 September.
Infrared MODIS satellite data processed by MIROVA (Middle InfraRed Observation of Volcanic Activity) showed intermittent thermal activity during April through September, with slightly stronger activity detected during late September (figure 127). Small clusters of thermal activity were detected during mid-June, early July, early August, and late September. According to the MODVOLC thermal alert system, a total of four thermal hotspots were detected on 7 July and 3 and 23 September. This activity was also intermittently captured in infrared satellite imagery on clear weather days (figure 128).
Geologic Background. The glacier-covered Villarrica stratovolcano, in the northern Lakes District of central Chile, is ~15 km south of the city of Pucon. A 2-km-wide caldera that formed about 3,500 years ago is located at the base of the presently active, dominantly basaltic to basaltic andesite cone at the NW margin of a 6-km-wide Pleistocene caldera. More than 30 scoria cones and fissure vents are present on the flanks. Plinian eruptions and pyroclastic flows that have extended up to 20 km from the volcano were produced during the Holocene. Lava flows up to 18 km long have issued from summit and flank vents. Eruptions documented since 1558 CE have consisted largely of mild-to-moderate explosive activity with occasional lava effusion. Glaciers cover 40 km2 of the volcano, and lahars have damaged towns on its flanks.
Information Contacts: Servicio Nacional de Geología y Minería (SERNAGEOMIN), Observatorio Volcanológico de Los Andes del Sur (OVDAS), Avda Sta María No. 0104, Santiago, Chile (URL: http://www.sernageomin.cl/); Proyecto Observación Villarrica Internet (POVI) (URL: http://www.povi.cl/); Sistema y Servicio Nacional de Prevención y Repuesta Ante Desastres (SENAPRED), Av. Beauchef 1671, Santiago, Chile (URL: https://web.senapred.cl/); Buenos Aires Volcanic Ash Advisory Center (VAAC), Servicio Meteorológico Nacional-Fuerza Aérea Argentina, 25 de mayo 658, Buenos Aires, Argentina (URL: http://www.smn.gov.ar/vaac/buenosaires/inicio.php); MIROVA (Middle InfraRed Observation of Volcanic Activity), a collaborative project between the Universities of Turin and Florence (Italy) supported by the Centre for Volcanic Risk of the Italian Civil Protection Department (URL: http://www.mirovaweb.it/); Hawai'i Institute of Geophysics and Planetology (HIGP) - MODVOLC Thermal Alerts System, School of Ocean and Earth Science and Technology (SOEST), Univ. of Hawai'i, 2525 Correa Road, Honolulu, HI 96822, USA (URL: http://modis.higp.hawaii.edu/); Copernicus Browser, Copernicus Data Space Ecosystem, European Space Agency (URL: https://dataspace.copernicus.eu/browser/).
Ebeko
Russia
50.686°N, 156.014°E; summit elev. 1103 m
All times are local (unless otherwise noted)
Moderate explosive activity with ash plumes continued during June-November 2023
Ebeko, located on the N end of Paramushir Island in Russia’s Kuril Islands just S of the Kamchatka Peninsula, consists of three summit craters along a SSW-NNE line at the northern end of a complex of five volcanic cones. Observed eruptions date back to the late 18th century and have been characterized as small-to-moderate explosions from the summit crater, accompanied by intense fumarolic activity. The current eruptive period began in June 2022, consisting of frequent explosions, ash plumes, and thermal activity (BGVN 47:10, 48:06). This report covers similar activity during June-November 2023, based on information from the Kamchatka Volcanic Eruptions Response Team (KVERT) and satellite data.
Moderate explosive activity continued during June-November 2023 (figures 50 and 51). According to visual data from Severo-Kurilsk, explosions sent ash 2-3.5 km above the summit (3-4.5 km altitude) during most days during June through mid-September. Activity after mid-September was slightly weaker, with ash usually reaching less than 2 km above the summit. According to KVERT the volcano in October and November was, with a few exceptions, either quiet or obscured by clouds that prevented satellite observations. KVERT issued Volcano Observatory Notices for Aviation (VONA) on 8 and 12 June, 13 and 22 July, 3 and 21 August, and 31 October warning of potential aviation hazards from ash plumes drifting 3-15 km from the volcano. Based on satellite data, KVERT reported a persistent thermal anomaly whenever weather clouds permitted viewing.
Geologic Background. The flat-topped summit of the central cone of Ebeko volcano, one of the most active in the Kuril Islands, occupies the northern end of Paramushir Island. Three summit craters located along a SSW-NNE line form Ebeko volcano proper, at the northern end of a complex of five volcanic cones. Blocky lava flows extend west from Ebeko and SE from the neighboring Nezametnyi cone. The eastern part of the southern crater contains strong solfataras and a large boiling spring. The central crater is filled by a lake about 20 m deep whose shores are lined with steaming solfataras; the northern crater lies across a narrow, low barrier from the central crater and contains a small, cold crescentic lake. Historical activity, recorded since the late-18th century, has been restricted to small-to-moderate explosive eruptions from the summit craters. Intense fumarolic activity occurs in the summit craters, on the outer flanks of the cone, and in lateral explosion craters.
Information Contacts: Kamchatka Volcanic Eruptions Response Team (KVERT), Far Eastern Branch, Russian Academy of Sciences, 9 Piip Blvd., Petropavlovsk-Kamchatsky, 683006, Russia (URL: http://www.kscnet.ru/ivs/kvert/).
Search Bulletin Archive by Publication Date
Select a month and year from the drop-downs and click "Show Issue" to have that issue displayed in this tab.
The default month and year is the latest issue available.
Bulletin of the Global Volcanism Network - Volume 43, Number 01 (January 2018)
Managing Editor: Edward Venzke
Agung (Indonesia)
New eruption after 54 years; extensive pre-eruption seismicity precedes ash emission on 21 November 2017
Bezymianny (Russia)
Eruption continues with ash plumes and lava flows through December 2017
Copahue (Chile-Argentina)
Ash emissions and incandescence during June-July 2017; ongoing degassing with sporadic ash
Galeras (Colombia)
Eruption with ash plumes May 2012-January 2014; steam emissions through 2017
Heard (Australia)
Intermittent low-to-moderate thermal anomalies end in mid-November 2017
Kanlaon (Philippines)
Phreatic explosions on 9 December 2017 with ashfall and high seismicity
Kirishimayama (Japan)
Explosive eruption with ash plumes in October 2017
Lopevi (Vanuatu)
Episodes of unrest in January and September 2017; gas-and-steam plumes
Reventador (Ecuador)
Large pyroclastic and lava flows during late June and late August 2017; continuing ash emissions and block avalanches throughout January-September 2017
Semeru (Indonesia)
Renewed thermal anomalies from mid-May through December 2017
Agung (Indonesia) — January 2018 Cite this Report
Agung
Indonesia
8.343°S, 115.508°E; summit elev. 2997 m
All times are local (unless otherwise noted)
New eruption after 54 years; extensive pre-eruption seismicity precedes ash emission on 21 November 2017
A large explosive and effusive eruption lasting about 11 months during 1963-64 at Indonesia's Mount Agung on Bali produced voluminous ashfall, devastating pyroclastic flows that caused extensive damage, and over 1,000 fatalities. The volcano remained largely quiet until renewed seismicity began in August 2017, the prelude to a new eruptive episode, which started in late November 2017 and is ongoing. Self and Rampino (2012) and Fontijn et al. (2015) published detailed summaries of historical activity at Agung prior to this new episode; a brief summary of their work is provided.
Information about the new eruptive episode comes from Pusat Vulkanologi dan Mitigasi Bencana Geologi (PVMBG), also known as the Indonesian Center for Volcanology and Geological Hazard Mitigation (CVGHM), Badan Nasional Penanggulangan Bencana (BNPB) which is the National Board for Disaster Management, the Darwin Volcanic Ash Advisory Center (VAAC), and various sources of satellite data. The first two months of this new episode, through December 2017, are discussed in this report.
Summary of 1963-64 eruption. The February 1963 to January 1964 eruption, Indonesia's largest and most devastating eruption of the twentieth century, was a multi-phase explosive and effusive event that produced both basaltic andesite tephra and andesite lava (Self and Rampino, 2012). After a few days of felt earthquakes on 16 and 17 February 1963, explosive activity began at the summit on 18 February. This was followed the next day by the effusion of about 0.1 km3 of andesite lava which was extruded until 17 March 1963, when a large explosive eruption generated pyroclastic density currents (PDCs) and lahars that devastated wide areas N, SW, and SE of the volcano (figure 1) (Fontijn et al, 2015).
Explosive activity continued intermittently until a second explosive phase of similar intensity occurred two months later, beginning on 16 May 1963 with reported ash plumes reaching 10 km above the 3-km-high summit (figure 2). This phase produced the greatest proportion of the pyroclastic flow material from the eruption and led to additional death and destruction in villages at the foot of the volcano (Self and Rampino, 2012). Explosive outbursts continued intermittently until 17 January 1964. The total death toll of the eruption was estimated between 1,100 and 1,900 (see references in Fontijn et al., 2015). A total estimated volume of erupted magma was ca 0.4 km3 (Self and Rampino, 2012).
Activity between 1964 and 2017. Almost no activity was reported from Agung during 1964-2017. Weak solfataric activity from within the summit crater was reported in 1989 (SEAN 14:07). MODVOLC thermal alerts were reported intermittently on one or two days during a few years (2001, 2002, 2004, 2006, 2008, 2012, 2013), but all of the alerts were located on the middle or lower flanks, suggesting their source was agriculture or forest fires, unrelated to volcanic activity. Chaussard et al. (2013) reported inflation centered on the summit at a rate of 7.8 cm/year between mid-2007 and early 2009, followed by slow deflation at a rate of 1.9 cm/year until mid-2011 (the last acquired data).
Summary of September-December 2017 Activity. Increases in seismic activity were first noted at Agung during mid-August 2017. Exponential increases in the rate of events during the middle of September led PVMBG to incrementally raise the Alert Level from I to IV (lowest to highest) between 14 and 22 September. Steam-and-gas emissions were intermittently observed 50-500 m above the summit crater from the end of September through October, with occasional bursts as high as 1,500 m. Seismicity dropped off almost as quickly as it rose, beginning on 20 October, and then continued a more gradual decrease through the end of the month and into November. The number and intensity of hot spots observed within the summit crater increased during September, then leveled off during October.
Ash emissions first appeared on 21 November, rising to 700 m above the summit. Ash density and heights of plumes increased several times during the rest of November to about 3,000 m. Ashfall as deep as 5 mm affected neighboring communities, and was reported several hundred kilometers from the summit; the international airport about 60 km SW was forced to close for a few days at the end of the month. Thermal data indicated effusion of lava into the summit crater at the end of November. After 30 November, emissions continued, primarily comprised of steam and gas, with intermittent plumes of dense ash, rising up to 2.5 km above the summit throughout December.
Activity during August-September 2017. In their monthly report of volcanic activity for August 2017, PVMBG noted that 49 volcanoes, including Agung, were listed at Alert Level 1, meaning "Normal", with no apparent increases in visual or seismic activity. The first signs of renewed unrest at Agung appeared as an increase in the rate of deep volcanic earthquakes (VA or Vulkanik Dalam) beginning on 10 August 2017. Shallow volcanic earthquakes (VB or Vulkanik Dangkal) began to increase two weeks later on 24 August, followed by an increase in the number of local tectonic earthquakes on 26 August (figure 3). Based on this increased seismicity, and an observation on 13 September of new solfataric activity at the bottom of the summit crater, PVMBG raised the Alert Level the following day from Level I (Normal) to Level II (Beware); the Aviation Color Code was raised to Yellow on a four-color scale (Green, Yellow, Orange, Red). The deeper earthquakes (VA) had a seismic amplitude range from 3-10 mm. The shallow earthquakes (VB) had an amplitude range of 2-7 mm. Otherwise, there was no surface expression of activity during September.
The Agung Volcano Observatory (AVO) is located in Rendang village about 8 km SW. Webcams are located in Rendang and in Bukit Asah, about 8 km W. On 15 September 2017 a steam emission was observed rising 50 m above the crater rim. The AVO issued a VONA on 18 September noting a rapid increase in volcanic earthquake activity with a small hot spot detected in satellite data. This contributed to them raising the Alert Level again to Level III (Standby), resulting in a 6-km-radius exclusion zone activated around the summit, extending to 7.5 km on the N, SE, and SSW flanks where the pyroclastic flows of 1963 had caused the most damage. Many of the 50,000 village residents within the 6 km exclusion zone began voluntary evacuations. The communities affected included Jungutan (7 km S) and Buana Giri (12 km SE) villages in the Bebandem District, Sebudi Village (6 km SW) in the Selat Subdistrict, Besakih Village (12 km SW) in the Rendang Subdistrict, and Dukuh (4 km NE) and Ban (7.5 km NW) villages in the Kubu Subdistrict. About 9,500 people had voluntarily evacuated from the villages by 22 September 2017.
The observatory issued another VONA on 19 September 2017, reporting an 'ash cloud' at 0255 UTC (1055 Central Indonesia Time, or WITA). It was described as a dense, white plume moving to the W. Around the same time (0240 UTC) MODVOLC recorded ten thermal alerts on the N and E flanks. Bali's Regional Disaster Management Agency (BPBD) reported in Antara News on 19 September that the source of the smoke and ash were forest fires caused by excessively dry conditions.
A VONA issued by AVO in the morning of 22 September stated that a steam emission about 50 m above the summit drifted NW. During the evening of 22 September, PVMBG raised the Alert Level to Level IV (Caution), the highest of the four-level scale, based primarily on continuing increases in seismicity. They expanded the exclusion zone to 9 km around the summit, and to 12 km in the areas S, SE, and NNE. The number of evacuees had risen to nearly 35,000 people by 24 September. Steam-and-gas plumes were intermittently observed rising to 200 m above the crater rim during the rest of September. By 26 September, PVMBG reported increasing seismic activity with 579 deep volcanic (VA) quakes, 373 shallow quakes (VB), and 50 local tectonic events that day. Seismicity continued to escalate through the end of the month. By the end of September, the government was assisting with the logistics of evacuating tens of thousands of livestock, primarily cattle, as well as over 90,000 people from within and around the 9 km exclusion zone. MAGMA Indonesia reported that new steaming and thermal areas within the summit crater expanded during the last week of the month.
Activity during October 2017. Narrow steam plumes rose 50-200 m above the summit crater during the first half of October. The rate of earthquakes during the last week of September and the first week of October continued to fluctuate at high levels, averaging 1-3 per minute, and more than 600 per day. By the first week of October, shallow earthquakes alone had increased to more than 200 per day, suggesting the possibility of magmatic activity at shallow depth. Satellite data showed increasing steam emissions along the NE edge of the crater rim. Tiltmeter data showed sudden deflation on 1 October, followed by continued inflation through 5 October. AVO released a VONA on 7 October noting a steam plume rising 1,500 m above the summit crater at 1245 UTC and drifting E (figure 4).
During the second half of the month, steam plumes were denser and rose more frequently to 200-500 m above the summit crater. BNPB flew drones over the summit on 20 and 29 October 2017 and captured 400 aerial photographs (figures 5 and 6). The images revealed a widening of the fracture zone on the E side of the summit crater, and a new fracture on the SE side.
PVMBG noted a decline in seismicity beginning on 20 October 2017 which continued through the end of the month (figure 7), leading them to lower the Alert Level from IV to III on 29 October, and reduce the exclusion zone to a 6 km radius, plus a 7.5 km area in the NNE, SE and SSW sectors. In their late October report, they observed that remote sensing thermal infrared data had detected an increase in the thermal energy beginning on 10 July 2017, in the form of an increased number of hot spots within the summit crater. During August and September, the number of hot spots had increased significantly and correlated with the increases in seismicity (figure 8). The intensity of the thermal anomalies then decreased during October. Inflation resumed in mid-August and peaked in mid-September. After that, the GPS data indicated deflation at lower levels, but uplift of 6 cm occurred near the summit. The deformation rate slowed after 20 October.
Activity during November 2017. For the first three weeks of November, dense white steam plumes rose 50-500 m above the summit crater. A VONA issued late on 11 November reported a 500-m-high steam plume. Seismicity continued at a much lower rate than during late September-October, with tens of daily events as opposed to hundreds.
The first ash emission of the current eruption occurred on 21 November at 1705 local time; the plume rose to 700 m and drifted ESE (figure 9). Trace amounts of ashfall were reported in the Pidpid-Nawehkerti area about 9 km SE. At the time of the first ash emission, BNPB reported the number of evacuees living in temporary housing at about 25,000. The emission was preceded by a low-frequency tremor. Multiple volcanic ash advisories were issued by the Darwin VAAC on 21 November, although the ash was not visible in satellite imagery due to weather clouds. Continuous tremor with 2-5 mm amplitude was recorded the following three days, and ash-and-steam emissions rose 300-800 m above the summit crater.
A larger emission on 25 November sent black-gray ash plumes 2,000 m above the crater rim (figure 10) which then drifted W. The Darwin VAAC reported an ash plume visible in satellite imagery at 7.6 km altitude drifting WSW. Emissions continued later in the day, rising 4.6-6.7 km altitude and extending SE. Bright incandescence at the summit crater was observed that night. Ashfall was reported to the WSW in the villages of Menanga and Rendang (12 km SW) at the AVO Post, and also in Besakih Village, located in the upper part of Pempatan (8 km W). A number of international flights were cancelled from the I Gusti Ngurah Rai International Airport in Denpasar (60 km SW), affecting about 2,000 passengers, although the airport remained open.
Around 0545 local time the following day (26 November), the intensity of the ash emissions increased; the top of the plume reached 3,300 m above the summit at 1100 local time, and was drifting SE and E (figure 11). Ashfall was reported in many areas downwind including North Duda (9 km S), Duda Timur (12 km S), Pempetan, Besakih, Sideman (15 km SSW), Tirta Abang, Sebudi (6 km SW), Amerta Bhuana (10 km SSW), and some villages in Gianyar (20 km WSW) (figure 12). The largest amount, deposits 5 mm thick, was reported in Sibetan (11 km SSE). Trace amounts of ash were also reported much farther away, in Nusa Penida (an island 40 km S), Lombok (100 km ESE), and Sumbawa, 250 km E on the island of West Nusa Tenggara. Explosions from the crater were audible 12.5 km away that evening. Incandescence at the summit was observed from Bukit Asah and Batulompeh. The Darwin VAAC reported continuous ash emissions to 7.9 km altitude drifting SE throughout most the day, increasing to 9.1 km later in the day; ashfall was also reported at the international airport.
The airport in Denpasar was forced to close during 27-29 November 2017. On those days ash drifted in multiple directions at different altitudes; it was observed drifting E at 9.1 km altitude, SW at 7.6 km altitude, and was moving S below 6.1 km. This increase in emissions led PVMBG to raise the Alert Level from III to IV on 27 November. Pictures and video showed a white steam plume adjacent to a gray ash plume rising from the crater, suggesting two distinct sources (figure 13).
A single MODVOLC thermal alert appeared at the summit that day, along with a strong thermal anomaly in the MIROVA system data (figure 14) consistent with the appearance of new lava in the summit crater. The tiltmeter installed at the Yehkori station 4 km S of the summit showed continued inflation of up to 6 microradians between 22 and 27 November (figure 15). PVMBG also increased the exclusion zone to a radius of 8 km from the summit crater plus areas 10 km from the summit to the NNE, SE, S, and SW.
MAGMA Indonesia reported that beginning with the ash eruption on 21 November, lahars appeared in the Tukad Yehsa, Tukad Sabuh, and Tukad Beliaung drainages on the S flank, as well as Tukad Bara on the N flank. As of the end of November 2017, these lahars had impacted houses, roads, and agricultural areas. Although ash emissions increased, and lava was confirmed within the summit crater during the last week of November, the number of seismic events remained well below the values recorded during September and October (figure 16).
Ash emissions were reported by PVMBG rising to 3,000 m above the summit and drifting S on 27 November (figure 17). Continuing ash emission during 28-29 November rose to 2,000-4,000 m above the summit and drifted WSW (figure 18). Continuous seismic tremors were recorded during 28 November-1 December.
With the increase in ash emissions during the last days of November 2017, satellite instruments also recorded significant releases of SO2 (figure 19). MAGMA Indonesia reported on 1 December that satellite data also recorded high temperatures consistent with new lava within the crater on 27, 28, and 29 November 2017. They estimated the volume of lava in the crater to be about 20 million cubic meters, equivalent to about a third of the total crater volume. The base of the ash-and-steam plumes was often reddish during 29 November-5 December reflecting incandescence from the lava in the crater (figure 20).
By 29 November, continuous ash emissions were rising to 6.4 km altitude and drifting from the SW towards the S, becoming diffuse over the Denpasar region (figure 21). The plume was observed moving E at the same elevation on 30 November, lowering to 5.5 km later in the day. Although emissions were primarily steam and gas beginning on 30 November, pilot reports on 1 December indicated ash was still visible SE of Agung, and steam-and-ash emissions were continuing. Steam-only emissions were reported on 2 December rising less than 1,000 m above the summit.
Activity during December 2017. Steam, gas, and ash emissions continued throughout December 2017. During the first two weeks, emissions were primarily steam and gas, rising up to 2,000 m (figure 22), and incandescence was often observed at the summit. Dense gray ash emissions were observed, however, during 1-2 December. BNPB noted on 5 December that 63,885 evacuees were distributed in 225 evacuation shelters. On 8 December at 0759 a brief event generated a dense ash plume that rose 2.1 km above the crater rim and drifted W (figure 23). Minor amounts of ash were deposited on the flanks, and lapilli were reported in Temakung. A second ash plume rose 3 km at 1457 later that day.
The Darwin VAAC reported multiple daily explosions during 8-15 December, creating ash plumes that drifted NW, W, and WSW at altitudes between 4.3 and 5.5 km. The explosions were visible in the webcams and from ground-based observers, and occasionally in satellite imagery when not blocked by weather clouds. VONA's were issued for events on 8 and 12 December. Multiple events during 11-12 December sent plumes rising up to 2.5 km above the crater rim and drifting NW and W (figure 24).
The Darwin VAAC reported larger ash emissions to 7.6 km altitude on 15 and 16 December interspersed with lower altitude (5.5-6.1 km) plumes. Continuing, regular discrete emissions during 16-17 December rose to 6.1 km and drifted WNW. An overhead image of the summit crater of 16 December revealed that, since a similar photo was taken on 20 October, new lava had filled about 1/3 of the crater with an estimated 30 million cubic meters of material (figure 25).
Discrete emissions to 5.5 km moving N and NNE were common during 18-21 December. Ash and steam drifted both E and W from the summit on 22 December. An ash emission on 23 December rose to 5.8 km and drifted NE, after which repeated emissions continued, rising to 4.6 km (figure 26). Ash fell on the flanks and in Tulamben, Kubu (9 km NE). In the morning of 24 December, a much larger plume drifting W at 10.7 km altitude was visible in satellite imagery. It dissipated after a few hours, and a separate plume was observed drifting NE at 5.5-5.8 km (figure 27); emissions continued throughout the day and into the next. PVMBG reported that the ash deposits from the NE-drifting plume were up to 3 mm thick (figure 28).
As of 25 December, BNPB reported just over 70,000 evacuees spread out in 239 shelters. Discrete ash emissions continued through the end of the month rising as high as 2 km above the crater rim and drifting in several different directions. The last VAAC report of 2017 indicated an ash plume drifting W at 4.3 km altitude on 31 December.
References: Chaussard E, Amelung F, Aoki Y, 2013, Characterization of open and closed volcanic systems in Indonesia and Mexico using InSAR time series. J Geophys Res Solid Earth, 118:3957–3969. DOI: 10.1002/jgrb.50288.
Fontijn K, Costa F, Sutawidjaja I, Newhall C G, Herrin J S, 2015, A 5000-year record of multiple highly explosive mafic eruptions from Gunung Agung (Bali, Indonesia): implications for eruption frequency and volcanic hazards. Bull Volcanol, 77: 59. DOI: 10.1007/s00445-015-0943-x.
Self S, Rampino M, 2012, The 1963–1964 eruption of Agung volcano (Bali, Indonesia). Bull Volcanol 74:1521–1536. DOI: 10.1007/s00445-012-0615-z.
Geologic Background. Symmetrical Agung stratovolcano, Bali's highest and most sacred mountain, towers over the eastern end of the island. The volcano, whose name means "Paramount," rises above the SE rim of the Batur caldera, and the northern and southern flanks extend to the coast. The summit area extends 1.5 km E-W, with the high point on the W and a steep-walled 800-m-wide crater on the E. The Pawon cone is located low on the SE flank. Only a few eruptions dating back to the early 19th century have been recorded in historical time. The 1963-64 eruption, one of the largest in the 20th century, produced voluminous ashfall along with devastating pyroclastic flows and lahars that caused extensive damage and many fatalities.
Information Contacts: Pusat Vulkanologi dan Mitigasi Bencana Geologi (PVMBG, also known as Indonesian Center for Volcanology and Geological Hazard Mitigation, CVGHM), Jalan Diponegoro 57, Bandung 40122, Indonesia (URL: http://www.vsi.esdm.go.id/); Badan Nasional Penanggulangan Bencana (BNPB), National Disaster Management Agency, Graha BNPB - Jl. Scout Kav.38, East Jakarta 13120, Indonesia (URL: http://www.bnpb.go.id/); MAGMA Indonesia, Kementerian Energi dan Sumber Daya Mineral (URL: https://magma.vsi.esdm.go.id/); NASA Earth Observatory, EOS Project Science Office, NASA Goddard Space Flight Center, Goddard, Maryland, USA (URL: http://earthobservatory.nasa.gov/); NASA Goddard Space Flight Center (NASA/GSFC), Global Sulfur Dioxide Monitoring Page, Atmospheric Chemistry and Dynamics Laboratory, 8800 Greenbelt Road, Goddard, Maryland, USA (URL: https://so2.gsfc.nasa.gov/); MIROVA (Middle InfraRed Observation of Volcanic Activity), a collaborative project between the Universities of Turin and Florence (Italy) supported by the Centre for Volcanic Risk of the Italian Civil Protection Department (URL: http://www.mirovaweb.it/); Hawai'i Institute of Geophysics and Planetology (HIGP) - MODVOLC Thermal Alerts System, School of Ocean and Earth Science and Technology (SOEST), Univ. of Hawai'i, 2525 Correa Road, Honolulu, HI 96822, USA (URL: http://modis.higp.hawaii.edu/); Antara News (URL: https://bali.antaranews.com); Sutopo Purwo Nugroho, Head of Information Data and Public Relations Center of BNPB via Twitter (URL: https://twitter.com/Sutopo_PN); Cable News Network (CNN), Turner Broadcasting System, Inc. (URL: http://www.cnn.com/); Reuters (URL: http://www.reuters.com/).
Bezymianny (Russia) — January 2018 Cite this Report
Bezymianny
Russia
55.972°N, 160.595°E; summit elev. 2882 m
All times are local (unless otherwise noted)
Eruption continues with ash plumes and lava flows through December 2017
An eruption at Bezymianny continued into April 2017 with ash plumes and lava flows (BGVN 42:06). Similar activity was reported from May through December 2017. Observations came from reports from the Kamchatka Volcanic Eruptions Response Team (KVERT) and Tokyo Volcanic Ash Advisory Center (VAAC) advisories.
KVERT reported on 26 May that activity had decreased after an explosion on 9 March and the effusion of several lava flows onto the dome flanks. Though gas-and-steam emissions continued, along with thermal anomalies identified in satellite images. The Aviation Color Code (ACC) was lowered to Yellow (the second lowest level on a four-color scale). Moderate gas-and-steam emissions continued throughout the reporting period.
On 15 June KVERT reported that the temperature of a thermal anomaly identified in satellite images had increased, and that the webcam recorded a gas-and-steam plume rising to an altitude of 4 km and drifting SSE. Hot avalanches of material originated from the lava dome. The next day, 16 June, a powerful explosion began at 1653 (local) that produced an ash cloud that rose to an altitude as high as 12 km and drifted 700 km E and SE. Nighttime incandescence from the lava dome was observed afterwards, and a lava flow emerged from the W flank of the dome. The ACC was raised to Red (the highest level on a four-color scale), but lowered back to Orange (the second highest level) about 5 hours later. At 2110 (local) the ash cloud was 212 x 115 km in size and drifting E; the leading edge of the cloud was about 245 km E. Strong gas-and-steam emissions and incandescence above the lava dome could be seen on 18 June (figure 23).
During 20 June-29 September a daily thermal anomaly over Bezymianny was identified by KVERT in satellite images, when not obscured by clouds. A lava flow continued down the W flank of the dome, and incandescence from the dome was usually visible at night. Moderate gas-and-steam activity continued.
According to KVERT, by the first week of October the volcano had quieted somewhat, although moderate gas-steam activity continued. KVERT reported that a lava flow continued down the W flank of the lava dome through 4 October, but no mention was made of a lava flow in their reports after 4 October. Weak daily thermal anomalies were recorded when the volcano was not obscured by clouds. On 5 October, the ACC was lowered to Yellow.
On 18 December hot avalanches on the SE flank of the lava dome were recorded by a webcam, prompting KVERT to raise the ACC to Orange. A strong explosion that started at 1555 (local) on 20 December generated ash plumes that rose to an altitude of 10-15 km, prompting KVERT to raise the ACC to Red. Ash plumes identified in satellite data drifted at least 320 km NE. Later that day satellite images indicated decreased activity; the ACC was lowered back to Orange. Moderate gas-and-steam emissions continued on 29 December, and a lava flow likely effused onto the N flank of the lava dome. Thermal anomalies continued to be identified in satellite images. The ACC was lowered to Yellow.
Thermal anomalies. During May-December 2017 thermal anomalies, based on MODIS satellite instruments analyzed using the MODVOLC algorithm, were only observed during a small portion of June and July 2017 (most days between 19-26 June, most days during the first week of July, 17-18 July, and 28 July). In contrast, the MIROVA (Middle InfraRed Observation of Volcanic Activity) system detected numerous hotspots every month, with the most intense cluster during the middle of June through the middle of September. Virtually all MIROVA hotspots were within 5 km of the summit.
Geologic Background. The modern Bezymianny, much smaller than its massive neighbors Kamen and Kliuchevskoi on the Kamchatka Peninsula, was formed about 4,700 years ago over a late-Pleistocene lava-dome complex and an edifice built about 11,000-7,000 years ago. Three periods of intensified activity have occurred during the past 3,000 years. The latest period, which was preceded by a 1,000-year quiescence, began with the dramatic 1955-56 eruption. This eruption, similar to that of St. Helens in 1980, produced a large open crater that was formed by collapse of the summit and an associated lateral blast. Subsequent episodic but ongoing lava-dome growth, accompanied by intermittent explosive activity and pyroclastic flows, has largely filled the 1956 crater.
Information Contacts: Kamchatka Volcanic Eruptions Response Team (KVERT), Far Eastern Branch, Russian Academy of Sciences, 9 Piip Blvd., Petropavlovsk-Kamchatsky, 683006, Russia (URL: http://www.kscnet.ru/ivs/kvert/); Institute of Volcanology and Seismology, Far Eastern Branch, Russian Academy of Sciences (IVS FEB RAS), 9 Piip Blvd., Petropavlovsk-Kamchatsky 683006, Russia (URL: http://www.kscnet.ru/ivs/eng/); Kamchatka Branch of the Geophysical Service, Russian Academy of Sciences (KB GS RAS) (URL: http://www.emsd.ru/); Tokyo Volcanic Ash Advisory Center (VAAC), 1-3-4 Otemachi, Chiyoda-ku, Tokyo, Japan (URL: http://ds.data.jma.go.jp/svd/vaac/data/); Hawai'i Institute of Geophysics and Planetology (HIGP) - MODVOLC Thermal Alerts System, School of Ocean and Earth Science and Technology (SOEST), Univ. of Hawai'i, 2525 Correa Road, Honolulu, HI 96822, USA (URL: http://modis.higp.hawaii.edu/); MIROVA (Middle InfraRed Observation of Volcanic Activity), a collaborative project between the Universities of Turin and Florence (Italy) supported by the Centre for Volcanic Risk of the Italian Civil Protection Department (URL: http://www.mirovaweb.it/).
Copahue (Chile-Argentina) — January 2018 Cite this Report
Copahue
Chile-Argentina
37.856°S, 71.183°W; summit elev. 2953 m
All times are local (unless otherwise noted)
Ash emissions and incandescence during June-July 2017; ongoing degassing with sporadic ash
Recent activity at Copahue through December 2016 consisted of gas and steam plumes with minor amounts of ash. Eruptive activity ended in late December 2016, but ash emissions began again in early June 2017. Distinct ash emissions decreased after July, and crater incandescence was no longer reported. However, persistent tremor and degassing with sporadic ash continued through 2017.
This report through December 2017 is based on information obtained from the Buenos Aires Volcanic Ash Advisory Center (VAAC), the Southern Andes Volcanological Observatory (OVDAS), and the Servicio Nacional de Geología y Minería (National Geology and Mining Service) (SERNAGEOMIN). Volcano Alert Levels are set by SERNAGEOMIN (on a four-color scale) and by the Chilean Oficina Nacional de Emergencia del Ministerio del Interior (National Office of Emergency of the Interior Ministry) (ONEMI), on a three-color scale), for alerts to individual communities in the region.
OVDAS-SERNAGEOMIN reported that webcams recorded an increase in ash emissions on 4 June 2017. There were no significant changes in the magnitude or number of earthquakes recorded by the seismic network. The report noted that due to inclement weather making visual observations difficult, the observatory did not know if the ash emission began in the early hours of 4 June, or the day before. On the same day, OVDAS-SERNAGEOMIN raised the Alert Level to Yellow; ONEMI set a Yellow Alert for the communities of Villarrica, Pucón, and Curarrehue in La Araucanía, and for Panguipulli in Los Ríos.
During 5-15 June 2017 the seismic network detected long-period earthquakes. Gas plumes constantly rose from El Agrio crater and on several days contained ash. The highest plume, detected on 5 June, rose 300 m and drifted E.
The Buenos Aires VAAC reported that on 1 July the webcam recorded a steam-and-gas plume with minor ash near the summit. Webcam and satellite images analyzed by the Buenos Aires VAAC showed that during 7-8 July steam plumes with minor amounts of ash rose to altitudes of 4-4.3 km altitude and drifted ESE. During 16-17 July similar plumes rose to altitudes of 3-3.4 km and drifted N and NW. According to ONEMI, OVDAS-SERNAGEOMIN reported that during 16-31 July surficial activity had decreased. The webcam recorded constant gas emissions with sporadic ash rising no more than 280 m from El Agrio crater. Crater incandescence was visible during clear weather. The Alert Level remained at Yellow, and SERNAGEOMIN recommended no entry closer than 1 km of the crater. ONEMI continued an Alert Level of Yellow for the municipality of Alto Biobío.
In August, activity continued to decrease. Degassing was constant and sometimes contained ash. Plumes did not exceed 500 m in height and incandescence was absent. During the first half of the month, 23 seismic events occurred, 20 of which were volcanic-tectonic; tremor associated with the degassing was constant. During the latter half of August, SERNAGEOMIN lowered the Alert Level to Green. Because gas emissions continued, SERNAGEOMIN suggested that the public stay beyond a radius of 500 m of the active crater.
SERNAGEOMIN reports for November and December indicated that some seismic activity continued. In November, 337 earthquakes occurred, 261 of which were volcanic-tectonic. Tremor associated with degassing continued, and incandescence was reported on some days. Based on satellite and webcam views, the Buenos Aires VAAC reported that during 21 and 24-27 November diffuse steam plumes containing minor amounts of ash rose and drifted E and NE. Plumes rose to altitudes of 3.3-3.6 km during 25-26 November.
On 2 December, one volcanic-tectonic earthquake occurred at 1758 local time. More than 20 volcanic-tectonic earthquakes occurred about 2245 on 5 December. The SERNAGEOMIN report for December noted persistent tremor associated with gas and ash emissions, and that constant gas plumes with sporadic ash rising to a maximum height of 1,300 m above the summit was recorded by the web camera. The Alert Level remained Green through December 2017.
Geologic Background. Volcán Copahue is an elongated composite cone constructed along the Chile-Argentina border within the 6.5 x 8.5 km wide Trapa-Trapa caldera that formed between 0.6 and 0.4 million years ago near the NW margin of the 20 x 15 km Pliocene Caviahue (Del Agrio) caldera. The eastern summit crater, part of a 2-km-long, ENE-WSW line of nine craters, contains a briny, acidic 300-m-wide crater lake (also referred to as El Agrio or Del Agrio) and displays intense fumarolic activity. Acidic hot springs occur below the eastern outlet of the crater lake, contributing to the acidity of the Río Agrio, and another geothermal zone is located within Caviahue caldera about 7 km NE of the summit. Infrequent mild-to-moderate explosive eruptions have been recorded since the 18th century. Twentieth-century eruptions from the crater lake have ejected pyroclastic rocks and chilled liquid sulfur fragments.
Information Contacts: Servicio Nacional de Geología y Minería, (SERNAGEOMIN), Observatorio Volcanológico de Los Andes del Sur (OVDAS), Avda Sta María No. 0104, Santiago, Chile (URL: http://www.sernageomin.cl/); Oficina Nacional de Emergencia - Ministerio del Interior (ONEMI), Beaucheff 1637/1671, Santiago, Chile (URL: http://www.onemi.cl/); Buenos Aires Volcanic Ash Advisory Center (VAAC), Servicio Meteorológico Nacional-Fuerza Aérea Argentina, 25 de mayo 658, Buenos Aires, Argentina (URL: http://www.smn.gov.ar/vaac/buenosaires/).
Galeras (Colombia) — January 2018 Cite this Report
Galeras
Colombia
1.22°N, 77.37°W; summit elev. 4276 m
All times are local (unless otherwise noted)
Eruption with ash plumes May 2012-January 2014; steam emissions through 2017
A central cone slightly lower than the summit caldera rim has been the site of numerous small-to-moderate historical eruptions recorded since the time of the Spanish conquistadors at Colombia's Galeras volcano. Persistent steam and gas, and occasional ash emissions from multiple vents around the summit have characterized activity for many years. Steam plumes are generally visible from two sites at the summit of the pyroclastic cone. Two small craters, known as Chavas and El Paisita, are located on the N and W rim of the larger central summit crater. Information for this report was gathered primarily from monthly technical reports provided by the Observatorio Vulcanológico y Sismológico de Pasto (OVSP) of the Sevicio Geologico Colombiano (SGC). Four webcams document the activity from the Observatorio Vulcanológico y Sismológico de Pasto (OVSP) located in Pasto (8 km ESE), from Consacá (11 km W), from the top of Galeras in the area called Barranco Alto (2.6 km NW), and from the SW flank at an area called Bruma.
The last time an Alert Level 1 (Red: imminent eruption or in progress) was issued was on 25 August 2010 when a plume of gas and ash rose 300 m above the summit and dispersed ash over numerous communities up to 30 km away. Seismicity decreased the following day, and steam and gas-only emissions returned. Fumarolic activity persisted throughout 2011, with only a single mention of possible low ash content in the plumes observed on 31 March and 1 April. Steam plumes rose a few hundred meters from the summit crater during January-May 2012. Seismic swarms were recorded in April and May.
An eruption with ash emissions began on 13 May 2012 and persisted until 30 January 2014 (BGVN 37:04, 38:03, 39:01). A summary of activity during that eruptive episode is provided below, along with additional information not previously reported. Activity after the end of that eruption, from February 2014 through December 2017, included only steam and gas emissions from the summit crater, and low levels of seismicity.
Activity during 2012. During January and February 2012, steam plumes rose 900-1,000 m above the summit, emerging from the El Paisita and Chavas vents at the N and W rims of the summit crater (figure 130). Plumes rose higher during March, reaching 1,900 m. VT seismic swarms were reported between 11 and 16 April 2012, and deformation sensors recorded inflation towards the W flank beginning in April. Most of the seismicity was located within the vicinity of the summit crater at depths less than 5 km. Steam plumes rose to 2,300 m above summit in April (figure 131).
Steam plumes rose less than 200 m above the summit at the beginning of May; a second swarm of VT seismic events on 9 and 10 May 2012 preceded a new sequence of ash emissions that began on 13 May. Pulsating plumes of ash rose less than 800 m and deposited material primarily on the upper NW flank. Inflation continued to be measured in the inclinometers on the W flank, coinciding with the area of the epicenters of the 9-10 May seismic swarm. Ash-bearing emissions were reported on 13, 14, 17, 26 (figure 132), 27, and 30 May.
Ash emissions continued during June-August 2012. Plume heights during the period ranged from 1,300-2,500 m above the summit. Plumes recorded on 12 and 17 June (figure 133) resulted in ashfall in Sandoná (14 km NW) and Samaniego (32 km NW), Mapachico (9 km NE), and Genoy (7 km NNE). Additional days with reports of ash emissions included 5, 6, 8, 19, 22, 27 and 29 June. Ash-bearing emissions were reported on at least 16 days during July with reports of ashfall in Maragato, Chorillo (18 km W) and Genoy. Ash plumes rose to 2,500 m above the summit during at least nine different days of August, and ashfall was reported again in the Genoy area.
Tremor associated with gas and ash emissions persisted throughout September 2012; another VT seismic swarm was reported on 28 September. Ash-bearing emissions were reported during at least seven days of the month, and reached 2,000 m above the crater (figure 134). During at least 16 days of October, tremors were associated with ash emissions that rose as high as 1,800 m. On 19 October, fine-grained ashfall was reported by personnel of the Observatory who were working on the upper NE flank.
Gas and ash plumes rose 1,000-1,300 m during November and December 2012 and were also associated with tremor signals. The most significant emissions were observed on 1, 7, 14, 22, 23, 29 and 30 November, and 17 (figure 135), 19, 21, 26, 27 and 29 December.
Activity during 2013. Continuous inflation towards the western flank was measured beginning in April 2012. Similar deformation processes continued at Galeras during much of 2013. The 'Crater' inclinometer located about 0.8 km E of the summit crater showed the most significant amount of westward inflation (figure 136).
Eruptive activity continued in a similar manner to 2012 throughout 2013. During January, ash-bearing emissions rose up to 1,000 m at least nine times and drifted in various directions. The emission event of 22 January caused ashfall in Sandoná (13 km NW). During February, the most notable seismic activity was several tremor events associated with ash emissions. Plume heights remained below 1,500 m and were observed on at least 11 days of the month. There were reports of ashfall in San Isidro, the upper part of the municipality of Sandoná, NW of the volcano, during the morning of 24 February. Most of the ash emissions during March 2013 were deposited on the upper NW flank. The Crater, Cobanegra, and Calabozo inclinometers continued to show movement associated with inflation towards the W flank during March and April. Gas and ash plumes reached 1,000 m above the summit on 6, 7, 11, 22 and 25 March. Activity was similar during April, with plumes rising to 1,200 m and seismic tremors associated with ash and gas emissions reported on at least 13 days (figures 137 and 138).
Seismic activity decreased somewhat during May 2013, although tremor signals associated with ash and gas emissions were noted on at least eight occasions. The pulsating ash plumes were small, and deposited material mostly on the NW flank. The deformation network recorded stability at the Crater inclinometer for the first time in many months. SGC noted a seismic swarm during the evening of 22 May that included a tremor event that lasted for 11 minutes and possibly included ash emissions.
Emissions during June 2013 were mostly steam that rose to 1,300 m, but ash plumes were reported on seven days. The frequency of seismic activity remained steady during July, but the amount of energy released increased significantly. The Crater inclinometer showed deflation. Ash and gas plumes were noted on 6, 12, 13, 17 and 22 July rising as high as 1,500 m. Seismic frequency and energy both decreased during August and September 2013, and inclinometers showed little change in deformation. Plume heights, mostly gas and steam, remained below 500 m. Tremors associated with ash emissions were reported on five days of August and on 3, 11 and 14 September.
Seismicity increased in both amplitude and frequency during October and November 2013. The majority of the VT seismicity was located on the NE flank at 5-10 km depth. Steam plume heights remained below 600 m; emissions reported on 8 and 11 October included ash (figure 139). In addition to steam plumes observed throughout November, ash plumes were reported rising to 1,000 m on 17, 23, and 30 November. Seismicity decreased during December 2013 while deformation remained stable. Ash plumes were reported on 4, 13, 26, 27, and 31 December associated with tremor events (figure 140).
Activity during 2014. Tremor events during 11-14, 21, 23, and 27-30 January 2014 were associated with ash and gas emissions (figure 141) that reached 850 m above the summit. During the early hours of 11, 13, and 23 January, incandescence was observed at the crater. The last confirmed ash emission of the year occurred on 30 January 2014.
A decrease in both frequency and energy levels of seismicity were reported during March 2014. SGC noted several tremor-type seismic events associated with gas emissions; steam plumes rose up to 1,000 m above the summit. Although they reference "gas and ash" emissions in a few photographs, only steam is visible in the photographs from March. Reports of activity by SGC for April and May 2014 refer to only steam plumes rising 1,000 m from the summit from the vents on the N and W sides of the crater rim. No further reports are available for Galeras for 2014.
Activity during 2015-2017. Throughout 2015, SGC reported only steam plumes rising from the two vents at the summit of the Galeras pyroclastic cone, known as the Chaldean fumarole fields (Las Chavas) on the W rim, and the El Paisita on the N rim (figure 142). Plume heights were as high as 700 m in January, but dropped below 200 m by May, where they remained for the rest of the year. Inflation to the W began again in September 2014 and continued through May 2015.
Minor variations in seismic frequency and energy levels fluctuated throughout 2016 and 2017, but there were no reported particulate emissions. Steam emissions from the two primary vents at the summit crater (Las Chavas and El Paisita) rarely rose more than 200 m above the summit, often drifting NW.
An inspection of the summit crater by SGC on 25 August 2016 revealed a deep vent with several points of gas emissions (figure 143), including areas on the N wall (El Paisita) and the E wall (Las Alterada). The W wall (Las Chavas) had a cave-like entrance of 50 m diameter with fumarolic activity on the back wall and the ceiling that condensed into a sulfur-rich water on the floor of the opening. The El Pinta vent had no observed emissions. A rare 200-m-high steam plume rose from the crater in October 2016, but otherwise activity remained very low at Galeras throughout 2017 (figure 144).
Geologic Background. Galeras, a stratovolcano with a large breached caldera located immediately west of the city of Pasto, is one of Colombia's most frequently active volcanoes. The dominantly andesitic complex has been active for more than 1 million years, and two major caldera collapse eruptions took place during the late Pleistocene. Long-term extensive hydrothermal alteration has contributed to large-scale edifice collapse on at least three occasions, producing debris avalanches that swept to the west and left a large open caldera inside which the modern cone has been constructed. Major explosive eruptions since the mid-Holocene have produced widespread tephra deposits and pyroclastic flows that swept all but the southern flanks. A central cone slightly lower than the caldera rim has been the site of numerous small-to-moderate eruptions since the time of the Spanish conquistadors.
Information Contacts: Servicio Geologico Colombiano (SGC), Diagonal 53 No. 34-53 - Bogotá D.C., Colombia (URL: https://www2.sgc.gov.co/volcanes/index.html).
Heard (Australia) — January 2018 Cite this Report
Heard
Australia
53.106°S, 73.513°E; summit elev. 2745 m
All times are local (unless otherwise noted)
Intermittent low-to-moderate thermal anomalies end in mid-November 2017
The most recent eruptive period at Heard began in September 2012 (BGVN 38:01). Direct observations are rare at this remote volcano, but the presence of lava flows can frequently be discerned using infrared satellite data. Thermal anomalies were intermittent, with some episodes of clearly stronger activity, during 2016 and through September 2017 (BGVN 42:10).
During all of 2017, MODIS infrared satellite data analyzed using the MODVOLC algorithm showed anomalies near the summit only on 2, 16, and 26 September, and on 1 and 22 October. The MIROVA system also detected numerous hotspots within 5 km of the volcano through late October. One additional significant anomaly was identified on approximately 12 November 2017 (figure 31). No further significant anomalies were noted through February 2018.
Geologic Background. Heard Island on the Kerguelen Plateau in the southern Indian Ocean consists primarily of the emergent portion of two volcanic structures. The large glacier-covered composite basaltic-to-trachytic cone of Big Ben comprises most of the island, and the smaller Mt. Dixon lies at the NW tip of the island across a narrow isthmus. Little is known about the structure of Big Ben because of its extensive ice cover. The active Mawson Peak forms the island's high point and lies within a 5-6 km wide caldera breached to the SW side of Big Ben. Small satellitic scoria cones are mostly located on the northern coast. Several subglacial eruptions have been reported at this isolated volcano, but observations are infrequent and additional activity may have occurred.
Information Contacts: MIROVA (Middle InfraRed Observation of Volcanic Activity), a collaborative project between the Universities of Turin and Florence (Italy) supported by the Centre for Volcanic Risk of the Italian Civil Protection Department (URL: http://www.mirovaweb.it/); Hawai'i Institute of Geophysics and Planetology (HIGP) - MODVOLC Thermal Alerts System, School of Ocean and Earth Science and Technology (SOEST), Univ. of Hawai'i, 2525 Correa Road, Honolulu, HI 96822, USA (URL: http://modis.higp.hawaii.edu/).
Kanlaon (Philippines) — January 2018 Cite this Report
Kanlaon
Philippines
10.4096°N, 123.13°E; summit elev. 2422 m
All times are local (unless otherwise noted)
Phreatic explosions on 9 December 2017 with ashfall and high seismicity
A series of three explosions at Kanlaon on 18 June 2016 sent ash plumes as high as 3 km above the crater and caused minor ashfall in neighborhoods W, SW, and NW of the volcano (BGVN 42:01). This was followed by steam plumes through 25 July 2016. The active Lugud crater (figure 4) has been the source of 21 reported eruptions since 1969; the latest eruption took place in December 2017. Information summarized here for activity from September 2016 through December 2017 was provided by the Philippine Institute of Volcanology and Seismology (PHIVOLCS).
PHIVOLCS reported on 5 May 2017 that since the last phreatic eruption in June 2016 there had been a general decline in activity: seismicity was at baseline levels, no significant deformation had been detected since August 2016, sulfur dioxide emissions were low, and no steaming had been observed since 29 September 2016. The Alert Level was lowered to 0 (on a scale of 0-5), though the public was warned to not enter the 4-km-radius Permanent Danger Zone (PDZ).
Between 24 June and 18 August 2017 the seismic network detected 244 volcanic earthquakes. The PHIVOLCS report noted that the increased seismic activity could be followed by phreatic explosions at the summit crater, despite the absence of visible degassing or steaming from the active vent. The Alert Level was raised to 1. The number of daily volcanic earthquakes increased after 18 August. In their 15 November report, PHIVOLCS indicated that during the previous 24 hours there had been 279 deep volcanic earthquakes recorded (compared to five the day before). This prompted them to raise the Alert Level to 2 (moderate level of unrest), where it remained for the rest of the year. The next day, the number recorded was 217. After that the daily number of volcanic events dropped considerably, especially after 21 November. Based on PHIVOLCS reports, the number of daily volcanic earthquakes during the first eight days of December 2017 varied from one to seven.
On 9 December an approximately 10-minute-long, low-energy phreatic explosion began at 0947 that was heard as far away as La Castellana, Negros Occidental (15 km SW). A plume of voluminous steam and dark ash rose 3-4 km above the summit vent (figure 5), and minor amounts of ash fell in Sitio Guintubdan (23 km W), and barangays W of the volcano (Ara-al, Sag-ang, and Ilihan). The eruption was preceded by the resumption of degassing at the summit crater at 0634, detectable as continuous low-energy tremor during periods when the summit was not visible; degassing was last observed September 2016.
Only three volcanic earthquakes were detected on 10 December, but then the number increased to 155 the next day. The number of daily events earthquakes increased again to 578 on 13 December, rose to 1,007 the next day, and peaked at 1,217 on the 15 December. The earthquake count dropped to 149 on 16 December before returning to six or fewer through 19 December. White steam plumes rose 800 and 300 m above the crater on 13 and 14 December, respectively. White plumes were diffuse on 15 December; weather clouds prevented views of the summit area during 16-18 December. Sulfur dioxide emissions were 603-687 tons per day during 13-14 December.
PHIVOLCS reported that during 19-20 December there were 412 volcanic earthquakes. A low-energy, explosion-type earthquake was detected at 0233 on 21 December associated with gas emissions from the summit area. Later in the day steam plumes rose 400 m and drifted NE. The number of daily volcanic earthquakes increased to 957 the next day and then decreased to less than 20 per day during 22-23 December. The daily earthquake count increased to 382 and 776 events on 24 and 25 December, respectively, decreased to 82 on 26 December, and the dropped to three or fewer over the last days of the year. Weather clouds often prevented observations , but white plumes rose 300 m and drifted NE, NW, and SW on 21 December, and 700 m on 26 December. A steam plume on 30 December was seen rising 500 m above the crater rim and drifting SW. On 30 December 2017, sulfur dioxide levels were measured at an average of 1,946 tonnes/day.
Geologic Background. Kanlaon volcano (also spelled Canlaon) forms the highest point on the Philippine island of Negros. The massive andesitic stratovolcano is covered with fissure-controlled pyroclastic cones and craters, many of which are filled by lakes. The largest debris avalanche known in the Philippines traveled 33 km SW from Kanlaon. The summit contains a 2-km-wide, elongated northern caldera with a crater lake and a smaller but higher active vent, Lugud crater, to the south. Eruptions recorded since 1866 have typically consisted of phreatic explosions of small-to-moderate size that produce minor local ashfall.
Information Contacts: Philippine Institute of Volcanology and Seismology (PHIVOLCS), Department of Science and Technology, University of the Philippines Campus, Diliman, Quezon City, Philippines (URL: http://www.phivolcs.dost.gov.ph/); Billy Lopue, flickr (URL: https://www.flickr.com/photos/21905294@N03/).
Kirishimayama (Japan) — January 2018 Cite this Report
Kirishimayama
Japan
31.934°N, 130.862°E; summit elev. 1700 m
All times are local (unless otherwise noted)
Explosive eruption with ash plumes in October 2017
After an explosive eruption during January-September 2011, Shinmoe-dake (Shinmoedake), a stratovolcano of the Kirishimayama volcano group, was quiet except for gas-and-steam plumes and slowly decreasing seismicity that returned to baseline levels by May 2012 (BGVN 37:07). The following report summarizes events through December 2017, and relies primarily on reports from the Japan Meteorological Agency (JMA).
On 22 October 2013, JMA reported that no eruptions had been detected at the volcano since the eruption on 7 September 2011. Earthquake activity and sulfur dioxide emissions were both below the detection limit. The Alert Level was lowered from 3 to 2 (on a scale of 1-5).
According to JMA, an eruption began at 0534 on 11 October 2017, prompting the agency to raise the Alert Level to 3 (figure 21). Ash plumes rose 300 m above the crater rim (2 km altitude) and drifted NE. Volcanic tremor amplitude increased and inflation was detected. Ashfall was noted in at least four towns in the Miyazaki (to the E) and Kagoshima (to the SW) prefectures. Based on JMA notices, pilot observations, and satellite data, the Tokyo Volcanic Ash Advisory Center (VAAC) reported that ash plumes rose to an altitude of 1.8-2.1 km on 11 October and 3.4 km on 12 October.
Gas measurements taken during field surveys on 12 and 13 October showed that the sulfur dioxide flux was 1,400 tonnes/day, an increase from 800 tonnes/day measured on 11 October. Volcanic tremor fluctuated but the amplitude was slightly lower. During 0823-1420 on 14 October, an event produced a tall plume which rose 2.3 km above the crater rim. Another event, at 1505, generated a grayish-white plume that rose 1 km and then blended into the weather clouds. Ashfall was reported in Kirishima (22 km SW) in the Kagoshima prefecture, in Kobayashi (14 km NE) in the Miyazaki prefecture, and reaching as far as Hyuga city (92 km NE). An increase in low-frequency earthquakes was recorded on 16 October.
The eruption lasted almost continuously until the morning of 17 October. The eruption plume usually rose several hundred meters about the crater rim, though on 14 October the plume rose as high as 2.3 km. Sulfur dioxide flux exceeded 10,000 tonnes/day. Cloudy weather conditions prevented webcam views during 19-20 October. Plumes rose 200-600 m on 21, 23, and 24 October. During an overflight on 24 October, scientists observed a white plume rising from the active vent on the E side of the crater, and puddles in multiple low areas of the crater.
Activity during 25 October-20 November 2017 activity continued to be slightly elevated. White plumes rose 100-500 m above the crater rim, though weather clouds sometimes prevented visual observations. Almost daily field surveys by JMA revealed no particular changes in the fumarolic and fissure areas near the cracks on the W flank, or to the thermally anomalous zone below the crack. Sulfur dioxide fluxes were as high as 200 tonnes/day. The Alert Level remained at 3.
Geologic Background. Kirishimayama is a large group of more than 20 Quaternary volcanoes located north of Kagoshima Bay. The late-Pleistocene to Holocene dominantly andesitic group consists of stratovolcanoes, pyroclastic cones, maars, and underlying shield volcanoes located over an area of 20 x 30 km. The larger stratovolcanoes are scattered throughout the field, with the centrally located Karakunidake being the highest. Onamiike and Miike, the two largest maars, are located SW of Karakunidake and at its far eastern end, respectively. Holocene eruptions have been concentrated along an E-W line of vents from Miike to Ohachi, and at Shinmoedake to the NE. Frequent small-to-moderate explosive eruptions have been recorded since the 8th century.
Information Contacts: Japan Meteorological Agency (JMA), Otemachi, 1-3-4, Chiyoda-ku Tokyo 100-8122, Japan (URL: http://www.jma.go.jp/); Tokyo Volcanic Ash Advisory Center (VAAC), 1-3-4 Otemachi, Chiyoda-ku, Tokyo, Japan (URL: http://ds.data.jma.go.jp/svd/vaac/data/); Associated Press (URL: https://www.ap.org/en-us); Kyodo News (URL: https://english.kyodonews.net).
Lopevi
Vanuatu
16.507°S, 168.346°E; summit elev. 1413 m
All times are local (unless otherwise noted)
Episodes of unrest in January and September 2017; gas-and-steam plumes
Since an eruptive episode in May 2007, Loopevi has been quiet except for a thick gray plume on 24 February 2008 and a short-lived increase in activity in December 2014 (BGVN 32:05, 34:08, 40:05). This report covers activity during January 2015-December 2017. Data were primarily drawn from reports issued by the Vanuatu Geohazards Observatory (VGO) and the Wellington Volcanic Ash Advisory Center (VAAC).
Based on a pilot observation and webcam views, the Wellington VAAC reported that a short-lived steam-and-gas plume beginning at 0500 on 13 January 2017 produced a that rose no higher than 3 km in altitude and drifted SE. That same day VGO reported that the Volcanic Alert Level (VAL) was raised to 3 (on a scale of 0-5); it was lowered to Level 2 on 17 January and then to Level 1 on 20 February.
Steam plumes were again observed on 23 September by the web camera, prompting VGO to raise the VAL to 2, indicating major unrest (danger around the crater rim and specific area, considerable possibility of eruption, chance of flank eruption). Observation flights on 30 September and the first week of October showed that the activity was occurring only in the active craters below the summit crater (figure 24). Photographs and thermal infrared images taken during the flights confirmed that activity consisted of hot volcanic gas and steam. VGO reported that photos and satellite images acquired at the end of November confirmed that gas-and-steam emissions were continuing.
The unrest continued through at least December 2017, and the VAL remained at 2. The Wellington VAAC noted that on 20 December a low-level plume was visible in satellite and webcam images drifting NW at an altitude of 1.5 km.
Geologic Background. The small 7-km-wide conical island of Lopevi, known locally as Vanei Vollohulu, is one of Vanuatu's most active volcanoes. A small summit crater containing a cinder cone is breached to the NW and tops an older cone that is rimmed by the remnant of a larger crater. The basaltic-to-andesitic volcano has been active during historical time at both summit and flank vents, primarily along a NW-SE-trending fissure that cuts across the island, producing moderate explosive eruptions and lava flows that reached the coast. Historical eruptions at the 1413-m-high volcano date back to the mid-19th century. The island was evacuated following major eruptions in 1939 and 1960. The latter eruption, from a NW-flank fissure vent, produced a pyroclastic flow that swept to the sea and a lava flow that formed a new peninsula on the western coast.
Information Contacts: Vanuatu Geohazards Observatory (VGO), Department of Geology, Mines and Water Resources of Vanuatu (URL: http://www.geohazards.gov.vu/, http://www.vmgd.gov.vu/vmgd/index.php/geohazards/volcano); Wellington Volcanic Ash Advisory Centre (VAAC), Meteorological Service of New Zealand Ltd (MetService), PO Box 722, Wellington, New Zealand (URL: http://www.metservice.com/vaac/, http://www.ssd.noaa.gov/VAAC/OTH/NZ/messages.html).
Reventador (Ecuador) — January 2018 Cite this Report
Reventador
Ecuador
0.077°S, 77.656°W; summit elev. 3562 m
All times are local (unless otherwise noted)
Large pyroclastic and lava flows during late June and late August 2017; continuing ash emissions and block avalanches throughout January-September 2017
Reventador has exhibited historical eruptions with numerous lava flows and explosive events since the 16th century. Eruptive activity has been continuous since 2008. Persistent ash emissions and incandescent block avalanches characterized activity during 2016; occasional pyroclastic and lava flows were also reported (BGVN 42:11). Similar activity continued during January-September 2017; information for this period is provided primarily by the Instituto Geofisico-Escuela Politecnicia Nacional (IG-EPN) of Ecuador and also from satellite-based MODIS infrared data.
Summary of activity, January-September 2017. Activity remained high at Reventador during January-September 2017. The strongest (4 km long) pyroclastic flow since 2002 occurred in late June along with a large lava flow that traveled over 2.5 km, the longest since 2008. Visual observations of ash emissions and block avalanches were often difficult due to weather conditions that obscured views of the summit certain times of the year (figure 60, table 9). Thermal alerts and anomalies recorded by satellite instruments complemented the visual information reported by IG-EPN (figure 61) and showed near-continuous activity as well. Variation in the frequency of the different types of seismic events fluctuated throughout the period (figure 62) and generally corresponded to variations in the surface activity.
Table 9. High levels of activity at Reventador during January-September 2017 were evident from the numbers of MODVOLC thermal alerts, and days with reported ash emissions and block avalanches. Cloudy weather impacted observations of activity during most months. Compiled from IG-EPN daily reports, VAAC reports, and MODVOLC data.
| Date |
MODVOLC alerts |
Cloudy days |
Days with ash emissions |
Plume heights above summit (m) |
Days with block avalanches |
Block avalanche runout distances (m) |
| Jan 2017 |
9 |
20 |
10 |
700-3,000 |
0 |
-- |
| Feb 2017 |
13 |
6 |
18 |
900-2000 |
2 |
1,000-1,500 |
| Mar 2017 |
6 |
10 |
18 |
500-2,000 |
2 |
1,000 |
| Apr 2017 |
6 |
9 |
21 |
200-2,000 |
12 |
600-1,800 |
| May 2017 |
4 |
6 |
19 |
300-over 800 |
10 |
500-800 |
| Jun 2017 |
20 |
3 |
22 |
Less than 200–2,000 |
10 |
200-800 |
| Jul 2017 |
12 |
9 |
17 |
200-800 |
9 |
200-800 |
| Aug 2017 |
14 |
0 |
29 |
300-over 1,000 |
25 |
200-1,000 |
| Sep 2017 |
23 |
1 |
27 |
400-over 1,200 |
18 |
500-1,500 |
Ash emissions occurred many times each month, with the highest plumes exceeding 3,000 m above the summit of the pyroclastic cone inside the caldera. The number of block avalanches reported each month increased steadily throughout the period, with blocks falling hundreds of meters from the summit on all flanks numerous times. Pyroclastic flows were reported a few times most months; the largest event in June sent flows nearly 4 km. Four lava flow events were recorded during the period; on 3 April, a flow traveled 1,600 m down the SW flank, a small flow in early June travelled 200 m down the NE flank, the large flow of 23 June-1 July traveled over 2.5 km down the NE flank, and multiple flows overflowed the summit crater and traveled in five different directions on 24 August 2017.
Activity during January-May 2017. Steam, gas, and ash emissions were reported during 10 of the 12 clear days of January 2017 when observations could be made. The plume heights varied up to 3,000 m above the 3,600-m-altitude summit. Ashfall was reported in El Chaco (30 km SW) on 18 January; nine MODVOLC thermal alerts were reported during the month.
Clearer skies during February 2017 resulted in observations of gas, steam, and ash emissions during 18 days of the month. The plume heights ranged from 900-2,000 m above the summit crater. On 7-8 February, in addition to steam and ash emissions rising 1,500 m and drifting W, block avalanches were observed traveling 1,000-1,500 m down all the flanks. A pyroclastic flow also traveled 800 m down the S flank. On 13 February at 0806 local time, the pilot of a plane from Aerogal observed a vertical plume that reached 2,000 m above the summit; nearby lookouts reported explosion sounds, and slight ashfall was observed in Gonzalo Pizarro in the Sucumbíos province (about 40 km NE). Incandescence appeared at the summit six times in February, triggering 13 MODVOLC thermal alerts.
Ash plume heights in March 2017 ranged from 500-2,000 m during the 18 days they were observed. Although incandescence was seen at the summit seven times, block avalanches were observed on the flanks only twice, on 11 and 23 March, traveling 1,000 m down the flanks each time. A pyroclastic flow traveled 500 m from the summit on 16 March.
Activity increased significantly during April 2017; ash emissions, ranging from 200-2,000 m high were recorded on 21 days, and block avalanches were observed 12 days, traveling 600-1,500 m down the SE flank most of the time. The largest event, on 20 April, sent large blocks 1,800 m down all the flanks. A lava flow moved 1,600 m down the SW flank on 3 April. On 10 April, multiple emissions of steam and gas with moderate ash content reached 2,000 m above the summit crater. On 24 April, a 1,300-m-high ash plume was witnessed during a flyover.
Block avalanches continued at a high rate during May 2017, traveling 500-800 m down all the flanks on at least 10 days of the month. Ash emissions persisted and were observed on 18 of the 25 clear days, rising from 300 to over 800 m. In the early hours of 26 May, a cloud of material was observed on the S flank, likely from a pyroclastic flow.
Activity during June 2017. The technical staff of IG-EPN visited the NE flank of Reventador to monitor activity during 29 May-1 June 2017. They observed a small lava flow on the NE flank, several explosions and emissions associated with both the N and S vents at the summit, pyroclastic flows, 'chugging' (audible, closely spaced intermittent gas emissions), and the projection of ballistic material.
The new lava flow was located on the upper NE flank; the only movement they detected was collapsing of the front of the flow, which sent blocks down to the base of the cone. Explosions with ash emissions from the two vents generally occurred every 15-30 minutes. Gas and ash emissions generally rose 1-2 km high, and the larger explosions produced pyroclastic flows. The sounds of the explosions were audible 5-8 km from the volcano. The researchers used a thermal camera to record a small pyroclastic flow that lasted for about 1 minute and 16 seconds and reached 800 m in length. They also observed avalanche blocks from the S vent that rolled 1,200 m down the flank. The thermal camera measured temperatures as high as 521°C.
During a flyover on 7 June 2017, scientists observed recent pyroclastic flows around all the flanks, the largest ones, on the N and S flanks, reached 1.2 km. Volcanic bombs were visible around the periphery of the crater rim. The lava flow observed a few days earlier by the ground crew extended 200 m down the NNE flank, and did not appear to be associated with either of the summit vents. Several explosions were witnessed from the two vents at the summit crater (figure 63).
Thermal imagery taken during the 7 June overflight revealed three emission centers at the summit; the two vents inside the crater that produced explosions with ash, larger bombs, and pyroclastic flows, and a fissure on the NE flank about 70 m below the summit that produced the lava flow (figure 64). The highest temperatures were measured in the N vent (Vento Norte).
In a special report on 23 June 2017, IG-EPN noted that Reventador had averaged about 50 daily explosions in recent months, as well as a similar number of LP earthquakes. During 22-24 June, a continuous seismic tremor was recorded (figure 62), along with more episodic tremors that included small explosions. Surface activity included pyroclastic flows down all the flanks, and ash plumes that rose about 2.5 km and drifted W. The pyroclastic flows sent material as far as 4 km to the E of the cone, into the headwaters of the El Reventador River (figure 65). IG-EPN reported that the pyroclastic flows generated during this event were the strongest since 2002.
The tremors were associated with a new emission of lava that advanced rapidly down the NE flank of the cone and was active until 1 July. It traveled about 2.65 km before stopping, and was nearly 250 m wide near the base (figure 66). IG-EPN reported that the lava flow was the longest since 2008 and covered and area of just under 0.5 km2. In addition to pyroclastic flows and a lava flow, a significant SO2 plume was released on 24 June 2017 (figure 67). Ash emissions were reported on 22 days during June. Plume heights ranged substantially from less than 200 m to over 2,000 m. Block avalanches traveling up to 800 m down the flanks were reported on ten days, and 20 MODVOLC thermal alerts were issued.
Activity during July-September 2017. There were fewer observations of ash emissions during July, on only 17 days, with plume heights ranging from 200-1,500 m (figure 68). Twelve MODVOLC thermal alerts were issued and block avalanches were reported on nine different days moving 200-800 m down all the flanks. A pyroclastic flow reported on 6 July traveled 800 m down the E flank. By the time of the 21 July overflight by IG-EPN, the two summit vents had merged, block avalanches surrounded the rim, and the still-warm flow was visible on the NE flank (figure 69). A visit by IG-EPN scientists on 1 August confirmed the continuing audible explosions, as well as the cooling of the late June lava flow (figure 70).
The frequency of eruptive activity increased substantially during August 2017. Ash emissions were reported on 29 days of the month most rising over 500 m; block avalanches occurred on at least 25 days sending debris as far as 1,000 m down all the flanks. Pyroclastic flows were reported twice, during 11-12 and 23-24 August (figure 71). Lava flows descended multiple flanks simultaneously on 23 August (figure 72).
The Washington VAAC issued 114 aviation alerts during August 2017 and 123 during September, indicating a continued level of high eruptive activity; plume heights were reported as high as 3,500 m above the summit, and block avalanches covered most of the upper cone down to 900 m a number of times during both months (figure 73).
Geologic Background. Volcán El Reventador is the most frequently active of a chain of Ecuadorian volcanoes in the Cordillera Real, well east of the principal volcanic axis. The forested, dominantly andesitic stratovolcano has 4-km-wide avalanche scarp open to the E formed by edifice collapse. A young, unvegetated, cone rises from the amphitheater floor to a height comparable to the rim. It has been the source of numerous lava flows as well as explosive eruptions visible from Quito, about 90 km ESE. Frequent lahars in this region of heavy rainfall have left extensive deposits on the scarp slope. The largest recorded eruption took place in 2002, producing a 17-km-high eruption column, pyroclastic flows that traveled up to 8 km, and lava flows from summit and flank vents.
Information Contacts: Instituto Geofísico (IG), Escuela Politécnica Nacional, Casilla 17-01-2759, Quito, Ecuador (URL: http://www.igepn.edu.ec/); Washington Volcanic Ash Advisory Center (VAAC), Satellite Analysis Branch (SAB), NOAA/NESDIS OSPO, NOAA Science Center Room 401, 5200 Auth Rd, Camp Springs, MD 20746, USA (URL: www.ospo.noaa.gov/Products/atmosphere/vaac, archive at: http://www.ssd.noaa.gov/VAAC/archive.html); MIROVA (Middle InfraRed Observation of Volcanic Activity), a collaborative project between the Universities of Turin and Florence (Italy) supported by the Centre for Volcanic Risk of the Italian Civil Protection Department (URL: http://www.mirovaweb.it/); Hawai'i Institute of Geophysics and Planetology (HIGP), MODVOLC Thermal Alerts System, School of Ocean and Earth Science and Technology (SOEST), Univ. of Hawai'i, 2525 Correa Road, Honolulu, HI 96822, USA (URL: http://modis.higp.hawaii.edu/); NASA Goddard Space Flight Center (NASA/GSFC), Global Sulfur Dioxide Monitoring Page, Atmospheric Chemistry and Dynamics Laboratory, 8800 Greenbelt Road, Goddard, Maryland, USA (URL: https://so2.gsfc.nasa.gov/).
Semeru (Indonesia) — January 2018 Cite this Report
Semeru
Indonesia
8.108°S, 112.922°E; summit elev. 3657 m
All times are local (unless otherwise noted)
Renewed thermal anomalies from mid-May through December 2017
In 2016 and the first quarter of 2017, activity at Semeru was characterized by numerous ash explosions and thermal anomalies (BGVN 42:05). Thermal anomalies became consistent after mid-May 2017, increasing over the next few months and continuing through December 2017. The information below comes from the Pusat Vulkanologi dan Mitigasi Bencana Geologi (PVMBG, also known as the Center for Volcanology and Geological Hazard Mitigation, or CVGHM), the Darwin Volcanic Ash Advisor Center (VAAC), and MODIS thermal sensors aboard satellites. The Alert Level since February 2012 has remained at Yellow (Waspada, or Alert).
According to PVMBG monthly reports, Semeru did not show any change of activity during the reporting period. Presumably, this included numerous ash explosions and thermal anomalies indicating the presence of lava flows or dome growth. A Darwin VAAC ash advisory stated that an ash explosion on 7 June at 0020 UTC generated a plume that rose 4 km in altitude and drifted 13 km SW a day later.
Thermal anomalies, based on MODIS satellite instruments analyzed using the MODVOLC algorithm, were not observed between 19 November 2016 and 6 June 2017. On 6 June, a single hotspot was recorded, coincident with the ash explosion. The next hotspot occurred on 2 August, followed by anomalous pixels on three additional days through 13 August, but none during the rest of August. The number rose to 7-12 days per month during September-December, many of which were multi-pixel events.
The MIROVA (Middle InfraRed Observation of Volcanic Activity) system detected only two distinct MODIS hotspots during April through the middle of May 2017. After mid-May, the number rose dramatically and every month through December numerous hotspots were detected, almost all within 5 km of the volcano.
Geologic Background. Semeru, the highest volcano on Java, and one of its most active, lies at the southern end of a volcanic massif extending north to the Tengger caldera. The steep-sided volcano, also referred to as Mahameru (Great Mountain), rises above coastal plains to the south. Gunung Semeru was constructed south of the overlapping Ajek-ajek and Jambangan calderas. A line of lake-filled maars was constructed along a N-S trend cutting through the summit, and cinder cones and lava domes occupy the eastern and NE flanks. Summit topography is complicated by the shifting of craters from NW to SE. Frequent 19th and 20th century eruptions were dominated by small-to-moderate explosions from the summit crater, with occasional lava flows and larger explosive eruptions accompanied by pyroclastic flows that have reached the lower flanks of the volcano.
Information Contacts: Pusat Vulkanologi dan Mitigasi Bencana Geologi (PVMBG, also known as Indonesian Center for Volcanology and Geological Hazard Mitigation, CVGHM), Jalan Diponegoro 57, Bandung 40122, Indonesia (URL: http://www.vsi.esdm.go.id/); Darwin Volcanic Ash Advisory Centre (VAAC), Bureau of Meteorology, Northern Territory Regional Office, PO Box 40050, Casuarina, NT 0811, Australia (URL: http://www.bom.gov.au/info/vaac/); MIROVA (Middle InfraRed Observation of Volcanic Activity), a collaborative project between the Universities of Turin and Florence (Italy) supported by the Centre for Volcanic Risk of the Italian Civil Protection Department (URL: http://www.mirovaweb.it/); Hawai'i Institute of Geophysics and Planetology (HIGP) - MODVOLC Thermal Alerts System, School of Ocean and Earth Science and Technology (SOEST), Univ. of Hawai'i, 2525 Correa Road, Honolulu, HI 96822, USA (URL: http://modis.higp.hawaii.edu/).