Recently Published Bulletin Reports
Manam (Papua New Guinea) Few ash plumes during November-December 2022
Krakatau (Indonesia) Strombolian activity and ash plumes during November 2022-April 2023
Stromboli (Italy) Strombolian explosions and lava flows continue during January-April 2023
Nishinoshima (Japan) Small ash plumes and fumarolic activity during November 2022 through April 2023
Karangetang (Indonesia) Lava flows, incandescent avalanches, and ash plumes during January-June 2023
Ahyi (United States) Intermittent hydroacoustic signals and discolored plumes during November 2022-June 2023
Kadovar (Papua New Guinea) An ash plume and weak thermal anomaly during May 2023
San Miguel (El Salvador) Small gas-and-ash explosions during March and May 2023
Semisopochnoi (United States) Occasional explosions, ash deposits, and gas-and-steam plumes during December 2022-May 2023
Ebeko (Russia) Continued explosions, ash plumes, and ashfall during October 2022-May 2023
Home Reef (Tonga) Discolored plumes continued during November 2022-April 2023
Ambae (Vanuatu) New lava flow, ash plumes, and sulfur dioxide plumes during February-May 2023
Manam (Papua New Guinea) — July 2023  Cite this Report
Manam
Papua New Guinea
4.08°S, 145.037°E; summit elev. 1807 m
All times are local (unless otherwise noted)
Few ash plumes during November-December 2022
Manam is a 10-km-wide island that consists of two active summit craters: the Main summit crater and the South summit crater and is located 13 km off the northern coast of mainland Papua New Guinea. Frequent mild-to-moderate eruptions have been recorded since 1616. The current eruption period began during June 2014 and has more recently been characterized by intermittent ash plumes and thermal activity (BGVN 47:11). This report updates activity that occurred from November 2022 through May 2023 based on information from the Darwin Volcanic Ash Advisory Center (VAAC) and various satellite data.
Ash plumes were reported during November and December 2022 by the Darwin VAAC. On 7 November an ash plume rose to 2.1 km altitude and drifted NE based on satellite images and weather models. On 14 November an ash plume rose to 2.1 km altitude and drifted W based on RVO webcam images. On 20 November ash plumes rose to 1.8 km altitude and drifted NW. On 26 December an ash plume rose to 3 km altitude and drifted S and SSE.
Intermittent sulfur dioxide plumes were detected using the TROPOMI instrument on the Sentinel-5P satellite, some of which exceeded at least two Dobson Units (DU) and drifted in different directions (figure 93). Occasional low-to-moderate power thermal anomalies were recorded by the MIROVA (Middle InfraRed Observation of Volcanic Activity) system; less than five anomalies were recorded each month during November 2022 through May 2023 (figure 94). Two thermal hotspots were detected by the MODVOLC thermal alerts system on 10 December 2022. On clear weather days, thermal activity was also captured in infrared satellite imagery in both the Main and South summit craters, accompanied by gas-and-steam emissions (figure 95).
Geologic Background. The 10-km-wide island of Manam, lying 13 km off the northern coast of mainland Papua New Guinea, is one of the country's most active volcanoes. Four large radial valleys extend from the unvegetated summit of the conical basaltic-andesitic stratovolcano to its lower flanks. These valleys channel lava flows and pyroclastic avalanches that have sometimes reached the coast. Five small satellitic centers are located near the island's shoreline on the northern, southern, and western sides. Two summit craters are present; both are active, although most observed eruptions have originated from the southern crater, concentrating eruptive products during much of the past century into the SE valley. Frequent eruptions, typically of mild-to-moderate scale, have been recorded since 1616. Occasional larger eruptions have produced pyroclastic flows and lava flows that reached flat-lying coastal areas and entered the sea, sometimes impacting populated areas.
Information Contacts: Rabaul Volcano Observatory (RVO), Geohazards Management Division, Department of Mineral Policy and Geohazards Management (DMPGM), PO Box 3386, Kokopo, East New Britain Province, Papua New Guinea; Darwin Volcanic Ash Advisory Centre (VAAC), Bureau of Meteorology, Northern Territory Regional Office, PO Box 40050, Casuarina, NT 0811, Australia (URL: http://www.bom.gov.au/info/vaac/); MIROVA (Middle InfraRed Observation of Volcanic Activity), a collaborative project between the Universities of Turin and Florence (Italy) supported by the Centre for Volcanic Risk of the Italian Civil Protection Department (URL: http://www.mirovaweb.it/); Hawai'i Institute of Geophysics and Planetology (HIGP) - MODVOLC Thermal Alerts System, School of Ocean and Earth Science and Technology (SOEST), Univ. of Hawai'i, 2525 Correa Road, Honolulu, HI 96822, USA (URL: http://modis.higp.hawaii.edu/); NASA Global Sulfur Dioxide Monitoring Page, Atmospheric Chemistry and Dynamics Laboratory, NASA Goddard Space Flight Center (NASA/GSFC), 8800 Greenbelt Road, Goddard, Maryland, USA (URL: https://so2.gsfc.nasa.gov/); Copernicus Browser, Copernicus Data Space Ecosystem, European Space Agency (URL: https://dataspace.copernicus.eu/browser/).
Krakatau (Indonesia) — July 2023 Cite this Report
Krakatau
Indonesia
6.1009°S, 105.4233°E; summit elev. 285 m
All times are local (unless otherwise noted)
Strombolian activity and ash plumes during November 2022-April 2023
Krakatau is located in the Sunda Strait between Java and Sumatra, Indonesia. Caldera collapse during the catastrophic 1883 eruption destroyed Danan and Perbuwatan cones and left only a remnant of Rakata. The post-collapse cone of Anak Krakatau (Child of Krakatau) was constructed within the 1883 caldera at a point between the former Danan and Perbuwatan cones; it has been the site of frequent eruptions since 1927. The current eruption period began in May 2021 and has recently consisted of explosions, ash plumes, and thermal activity (BGVN 47:11). This report covers activity during November 2022 through April 2023 based on information provided by the Indonesian Center for Volcanology and Geological Hazard Mitigation, referred to as Pusat Vulkanologi dan Mitigasi Bencana Geologi (PVMBG), MAGMA Indonesia, the Darwin Volcanic Ash Advisory Center (VAAC), and several sources of satellite data.
Activity was relatively low during November and December 2022. Daily white gas-and-steam plumes rose 25-100 m above the summit and drifted in different directions. Gray ash plumes rose 200 m above the summit and drifted NE at 1047 and at 2343 on 11 November. On 14 November at 0933 ash plumes rose 300 m above the summit and drifted E. An ash plume was reported at 0935 on 15 December that rose 100 m above the summit and drifted NE. An eruptive event at 1031 later that day generated an ash plume that rose 700 m above the summit and drifted NE. A gray ash plume at 1910 rose 100 m above the summit and drifted E. Incandescent material was ejected above the vent based on an image taken at 1936.
During January 2023 daily white gas-and-steam plumes rose 25-300 m above the summit and drifted in multiple directions. Gray-to-brown ash plumes were reported at 1638 on 3 January, at 1410 and 1509 on 4 January, and at 0013 on 5 January that rose 100-750 m above the summit and drifted NE and E; the gray-to-black ash plume at 1509 on 4 January rose as high as 3 km above the summit and drifted E. Gray ash plumes were recorded at 1754, 2241, and 2325 on 11 January and at 0046 on 12 January and rose 200-300 m above the summit and drifted NE. Toward the end of January, PVMBG reported that activity had intensified; Strombolian activity was visible in webcam images taken at 0041, 0043, and 0450 on 23 January. Multiple gray ash plumes throughout the day rose 200-500 m above the summit and drifted E and SE (figure 135). Webcam images showed progressively intensifying Strombolian activity at 1919, 1958, and 2113 on 24 January; a gray ash plume at 1957 rose 300 m above the summit and drifted E (figure 135). Eruptive events at 0231 and 2256 on 25 January and at 0003 on 26 January ejected incandescent material from the vent, based on webcam images. Gray ash plumes observed during 26-27 January rose 300-500 m above the summit and drifted NE, E, and SE.
Low levels of activity were reported during February and March. Daily white gas-and-steam plumes rose 25-300 m above the summit and drifted in different directions. The Darwin VAAC reported that continuous ash emissions rose to 1.5-1.8 km altitude and drifted W and NW during 1240-1300 on 10 March, based on satellite images, weather models, and PVMBG webcams. White-and-gray ash plumes rose 500 m and 300 m above the summit and drifted SW at 1446 and 1846 on 18 March, respectively. An eruptive event was recorded at 2143, though it was not visible due to darkness. Multiple ash plumes were reported during 27-29 March that rose as high as 2.5 km above the summit and drifted NE, W, and SW (figure 136). Webcam images captured incandescent ejecta above the vent at 0415 and around the summit area at 2003 on 28 March and at 0047 above the vent on 29 March.
Daily white gas-and-steam plumes rose 25-300 m above the summit and drifted in multiple directions during April and May. White-and-gray and black plumes rose 50-300 m above the summit on 2 and 9 April. On 11 May at 1241 a gray ash plume rose 1-3 km above the summit and drifted SW. On 12 May at 0920 a gray ash plume rose 2.5 km above the summit and drifted SW and at 2320 an ash plume rose 1.5 km above the summit and drifted SW. An accompanying webcam image showed incandescent ejecta. On 13 May at 0710 a gray ash plume rose 2 km above the summit and drifted SW (figure 137).
The MIROVA (Middle InfraRed Observation of Volcanic Activity) graph of MODIS thermal anomaly data showed intermittent low-to-moderate power thermal anomalies during November 2022 through April 2023 (figure 138). Some of this thermal activity was also visible in infrared satellite imagery at the crater, accompanied by gas-and-steam and ash plumes that drifted in different directions (figure 139).
Geologic Background. The renowned Krakatau (frequently mis-named as Krakatoa) volcano lies in the Sunda Strait between Java and Sumatra. Collapse of an older edifice, perhaps in 416 or 535 CE, formed a 7-km-wide caldera. Remnants of that volcano are preserved in Verlaten and Lang Islands; subsequently the Rakata, Danan, and Perbuwatan cones were formed, coalescing to create the pre-1883 Krakatau Island. Caldera collapse during the catastrophic 1883 eruption destroyed Danan and Perbuwatan, and left only a remnant of Rakata. This eruption caused more than 36,000 fatalities, most as a result of tsunamis that swept the adjacent coastlines of Sumatra and Java. Pyroclastic surges traveled 40 km across the Sunda Strait and reached the Sumatra coast. After a quiescence of less than a half century, the post-collapse cone of Anak Krakatau (Child of Krakatau) was constructed within the 1883 caldera at a point between the former Danan and Perbuwatan cones. Anak Krakatau has been the site of frequent eruptions since 1927.
Information Contacts: Pusat Vulkanologi dan Mitigasi Bencana Geologi (PVMBG, also known as Indonesian Center for Volcanology and Geological Hazard Mitigation, CVGHM), Jalan Diponegoro 57, Bandung 40122, Indonesia (URL: http://www.vsi.esdm.go.id/); MAGMA Indonesia, Kementerian Energi dan Sumber Daya Mineral (URL: https://magma.esdm.go.id/v1); Darwin Volcanic Ash Advisory Centre (VAAC), Bureau of Meteorology, Northern Territory Regional Office, PO Box 40050, Casuarina, NT 0811, Australia (URL: http://www.bom.gov.au/info/vaac/); MIROVA (Middle InfraRed Observation of Volcanic Activity), a collaborative project between the Universities of Turin and Florence (Italy) supported by the Centre for Volcanic Risk of the Italian Civil Protection Department (URL: http://www.mirovaweb.it/); Copernicus Browser, Copernicus Data Space Ecosystem, European Space Agency (URL: https://dataspace.copernicus.eu/browser/).
Stromboli
Italy
38.789°N, 15.213°E; summit elev. 924 m
All times are local (unless otherwise noted)
Strombolian explosions and lava flows continue during January-April 2023
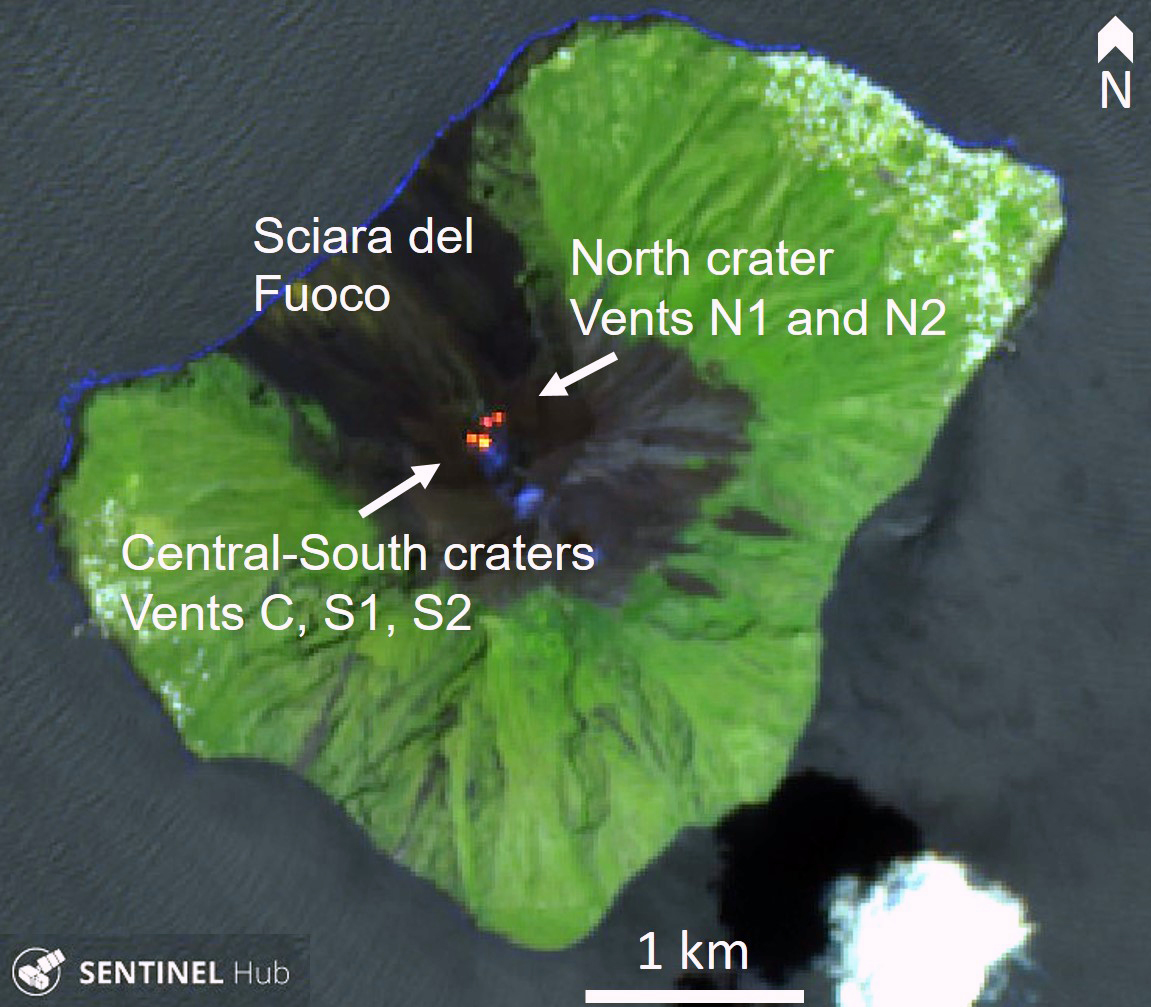
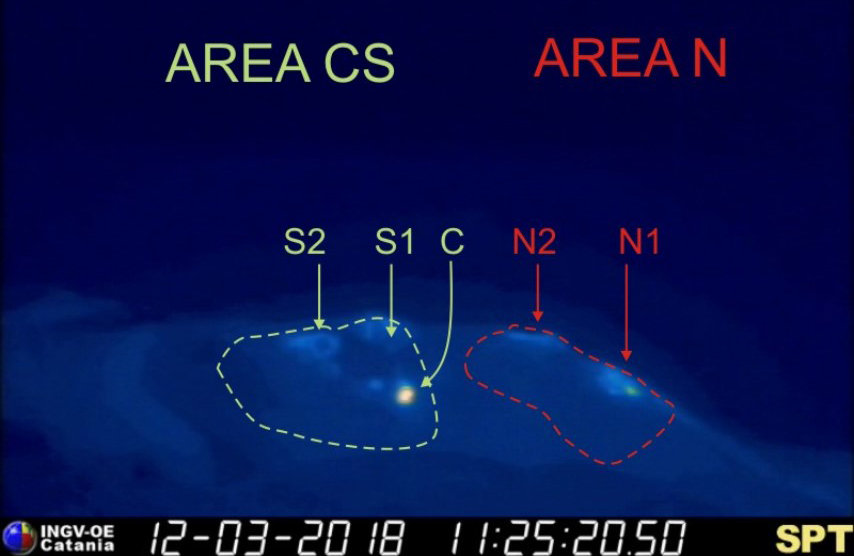
Stromboli, located in Italy, has exhibited nearly constant lava fountains for the past 2,000 years; recorded eruptions date back to 350 BCE. Eruptive activity occurs at the summit from multiple vents, which include a north crater area (N area) and a central-southern crater (CS area) on a terrace known as the ‘terrazza craterica’ at the head of the Sciara del Fuoco, a large scarp that runs from the summit down the NW side of the volcano-island. Activity typically consists of Strombolian explosions, incandescent ejecta, lava flows, and pyroclastic flows. Thermal and visual monitoring cameras are located on the nearby Pizzo Sopra La Fossa, above the terrazza craterica, and at multiple flank locations. The current eruption period has been ongoing since 1934 and recent activity has consisted of frequent Strombolian explosions and lava flows (BGVN 48:02). This report updates activity during January through April 2023 primarily characterized by Strombolian explosions and lava flows based on reports from Italy's Istituto Nazionale di Geofisica e Vulcanologia (INGV) and various satellite data.
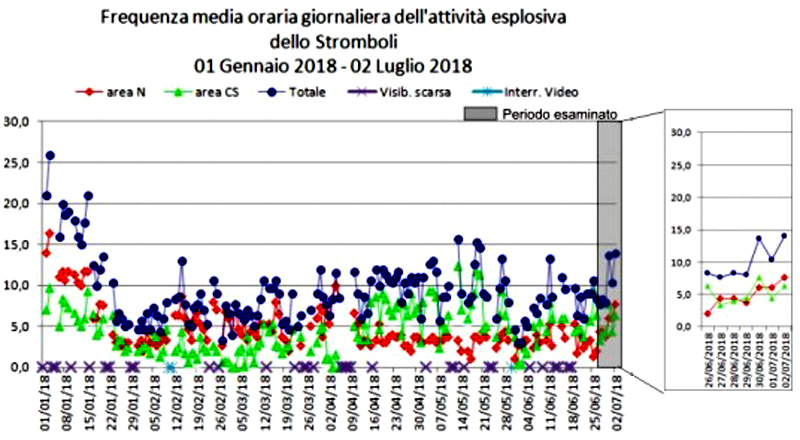
Frequent explosive activity continued throughout the reporting period, generally in the low-to-medium range, based on the number of hourly explosions in the summit crater (figure 253, table 16). Intermittent thermal activity was recorded by the MIROVA (Middle InfraRed Observation of Volcanic Activity) analysis of MODIS satellite data (figure 254). According to data collected by the MODVOLC thermal algorithm, a total of 9 thermal alerts were detected: one on 2 January 2023, one on 1 February, five on 24 March, and two on 26 March. The stronger pulses of thermal activity likely reflected lava flow events. Infrared satellite imagery captured relatively strong thermal hotspots at the two active summit craters on clear weather days, showing an especially strong event on 8 March (figure 255).
Table 16. Summary of type, frequency, and intensity of explosive activity at Stromboli by month during January-April 2023; information from webcam observations. Courtesy of INGV weekly reports.
| Month |
Explosive Activity |
| Jan 2023 |
Typical Strombolian activity with spattering and lava overflows in the N crater area. Explosions were reported from 4 vents in the N area and 1-2 vents in the CS area. The average hourly frequency of explosions was low-to-medium (1-12 events/hour). The intensity of the explosions varied from low (less than 80 m high) to medium (less than 150 m high) in the N crater area and up to high (greater than 150 m high) in the CS crater area. |
| Feb 2023 |
Typical Strombolian activity with spattering in the N crater area. Explosions were reported from 2-3 vents in the N area and 1-4 vents in the CS area. The average hourly frequency of explosions was low-to-medium (1-14 events/hour). The intensity of the explosions varied from low (less than 80 m high) to medium (less than 150 m high) in the N crater area and up to high (greater than 150 m high) in the CS crater area. |
| Mar 2023 |
Typical Strombolian activity with spattering and lava overflows in the N crater area. Explosions were reported from 2-3 vents in the N area and 2-4 vents in the CS area. The average hourly frequency of explosions was low-to-medium (1-18 events/hour). The intensity of the explosions varied from low (less than 80 m high) to medium (less than 150 m high) in the N crater area and up to high (greater than 150 m high) in the CS crater area. |
| Apr 2023 |
Typical Strombolian activity. Explosions were reported from 2 vents in the N area and 2-3 vents in the CS area. The average hourly frequency of explosions was low-to-high (1-16 events/hour). The intensity of the explosions varied from low (less than 80 m high) to medium (less than 150 m high) in both the N and CS crater areas. |
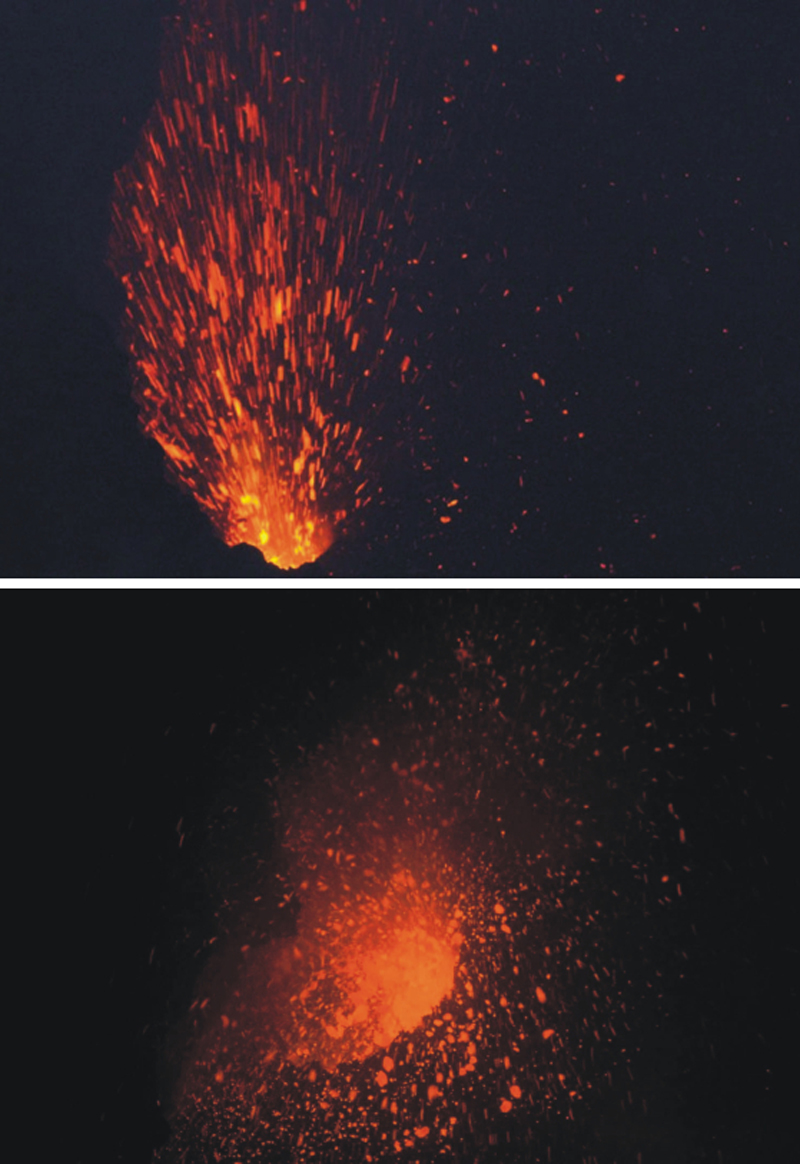
Activity during January-February 2023. Strombolian explosions were reported in the N crater area, as well as lava effusion. Explosive activity in the N crater area ejected coarse material (bombs and lapilli). Intense spattering was observed in both the N1 and N2 craters. In the CS crater area, explosions generally ejected fine material (ash), sometimes to heights greater than 250 m. The intensity of the explosions was characterized as low-to-medium in the N crater and medium-to-high in the CS crater. After intense spattering activity from the N crater area, a lava overflow began at 2136 on 2 January that flowed part way down the Sciara del Fuoco, possibly moving down the drainage that formed in October, out of view from webcams. The flow remained active for a couple of hours before stopping and beginning to cool. A second lava flow was reported at 0224 on 4 January that similarly remained active for a few hours before stopping and cooling. Intense spattering was observed on 11 and 13 January from the N1 crater. After intense spattering activity at the N2 crater at 1052 on 17 January another lava flow started to flow into the upper part of the Sciara del Fuoco (figure 256), dividing into two: one that traveled in the direction of the drainage formed in October, and the other one moving parallel to the point of emission. By the afternoon, the rate of the flow began to decrease, and at 1900 it started to cool. A lava flow was reported at 1519 on 24 January following intense spattering in the N2 area, which began to flow into the upper part of the Sciara del Fuoco. By the morning of 25 January, the lava flow had begun to cool. During 27 January the frequency of eruption in the CS crater area increased to 6-7 events/hour compared to the typical 1-7 events/hour; the following two days showed a decrease in frequency to less than 1 event/hour. Starting at 1007 on 30 January a high-energy explosive sequence was produced by vents in the CS crater area. The sequence began with an initial energetic pulse that lasted 45 seconds, ejecting predominantly coarse products 300 m above the crater that fell in an ESE direction. Subsequent and less intense explosions ejected material 100 m above the crater. The total duration of this event lasted approximately two minutes. During 31 January through 6, 13, and 24 February spattering activity was particularly intense for short periods in the N2 crater.
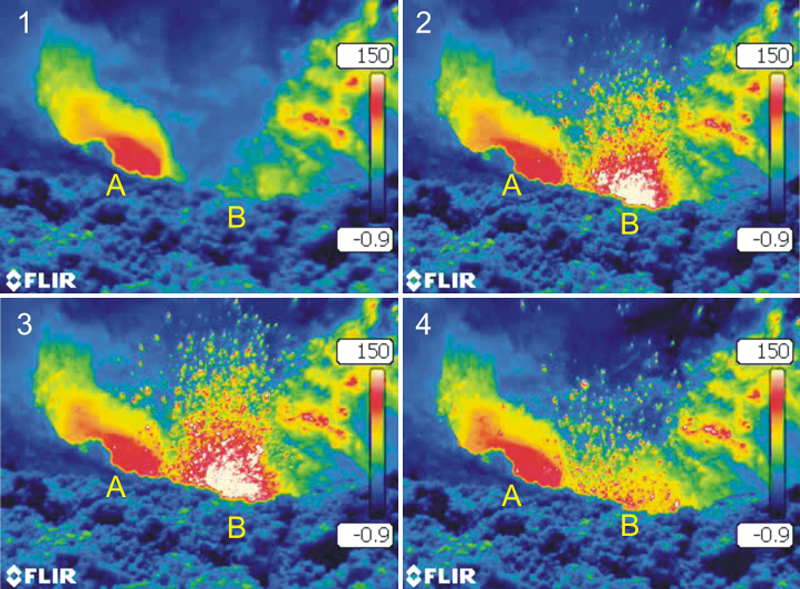
An explosive sequence was reported on 16 February that was characterized by a major explosion in the CS crater area (figure 257). The sequence began at 1817 near the S2 crater that ejected material radially. A few seconds later, lava fountains were observed in the central part of the crater. Three explosions of medium intensity (material was ejected less than 150 m high) were recorded at the S2 crater. The first part of this sequence lasted approximately one minute, according to INGV, and material rose 300 m above the crater and then was deposited along the Sciara del Fuoco. The second phase began at 1818 at the S1 crater; it lasted seven seconds and material was ejected 150 m above the crater. Another event 20 seconds later lasted 12 seconds, also ejecting material 150 m above the crater. The sequence ended with at least three explosions of mostly fine material from the S1 crater. The total duration of this sequence was about two minutes.
Short, intense spattering activity was noted above the N1 crater on 27 and 28 February. A lava overflow was first reported at 0657 from the N2 crater on 27 February that flowed into the October 2022 drainage. By 1900 the flow had stopped. A second lava overflow also in the N crater area occurred at 2149, which overlapped the first flow and then stopped by 0150 on 28 February. Material detached from both the lava overflows rolled down the Sciara del Fuoco, some of which was visible in webcam images.
Activity during March-April 2023. Strombolian activity continued with spattering activity and lava overflows in the N crater area during March. Explosive activity at the N crater area varied from low (less than 80 m high) to medium (less than 150 m high) and ejected coarse material, such as bombs and lapilli. Spattering was observed above the N1 crater, while explosive activity at the CS crater area varied from medium to high (greater than 150 m high) and ejected coarse material. Intense spattering activity was observed for short periods on 6 March above the N1 crater. At approximately 0610 a lava overflow was reported around the N2 crater on 8 March, which then flowed into the October 2022 drainage. By 1700 the flow started to cool. A second overflow began at 1712 on 9 March and overlapped the previous flow. It had stopped by 2100. Material from both flows was deposited along the Sciara del Fuoco, though much of the activity was not visible in webcam images. On 11 March a lava overflow was observed at 0215 that overlapped the two previous flows in the October 2022 drainage. By late afternoon on 12 March, it had stopped.
During a field excursion on 16 March, scientists noted that a vent in the central crater area was degassing. Another vent showed occasional Strombolian activity that emitted ash and lapilli. During 1200-1430 low-to-medium intense activity was reported; the N1 crater emitted ash emissions and the N2 crater emitted both ash and coarse material. Some explosions also occurred in the CS crater area that ejected coarse material. The C crater in the CS crater area occasionally showed gas jetting and low intensity explosions on 17 and 22 March; no activity was observed at the S1 crater. Intense, longer periods of spattering were reported in the N1 crater on 19, 24, and 25 March. Around 2242 on 23 March a lava overflow began from the N1 crater that, after about an hour, began moving down the October 2022 drainage and flow along the Sciara del Fuoco (figure 258). Between 0200 and 0400 on 26 March the flow rate increased, which generated avalanches of material from collapses at the advancing flow front. By early afternoon, the flow began to cool. On 25 March at 1548 an explosive sequence began from one of the vents at S2 in the CS crater area (figure 258). Fine ash mixed with coarse material was ejected 300 m above the crater rim and drifted SSE. Some modest explosions around Vent C were detected at 1549 on 25 March, which included an explosion at 1551 that ejected coarse material. The entire explosive sequence lasted approximately three minutes.
During April explosions persisted in both the N and CS crater areas. Fine material was ejected less than 80 m above the N crater rim until 6 April, followed by ejection of coarser material. Fine material was also ejected less than 80 m above the CS crater rim. The C and S2 crater did not show significant eruptive activity. On 7 April an explosive sequence was detected in the CS crater area at 1203 (figure 259). The first explosion lasted approximately 18 seconds and ejected material 400 m above the crater rim, depositing pyroclastic material in the upper part of the Sciara del Fuoco. At 1204 a second, less intense explosion lasted approximately four seconds and deposited pyroclastic products outside the crater area and near Pizzo Sopra La Fossa. A third explosion at 1205 was mainly composed of ash that rose about 150 m above the crater and lasted roughly 20 seconds. A fourth explosion occurred at 1205 about 28 seconds after the third explosion and ejected a mixture of coarse and fine material about 200 m above the crater; the explosion lasted roughly seven seconds. Overall, the entire explosive sequence lasted about two minutes and 20 seconds. After the explosive sequence on 7 April, explosions in both the N and CS crater areas ejected material as high as 150 m above the crater.
On 21 April research scientists from INGV made field observations in the summit area of Stromboli, and some lapilli samples were collected. In the N crater area near the N1 crater, a small cone was observed with at least two active vents, one of which was characterized by Strombolian explosions. The other vent produced explosions that ejected ash and chunks of cooled lava. At the N2 crater at least one vent was active and frequently emitted ash. In the CS crater area, a small cone contained 2-3 degassing vents and a smaller, possible fissure area also showed signs of degassing close to the Pizzo Sopra La Fossa. In the S part of the crater, three vents were active: a small hornito was characterized by modest and rare explosions, a vent that intermittently produced weak Strombolian explosions, and a vent at the end of the terrace that produced frequent ash emissions. Near the S1 crater there was a hornito that generally emitted weak gas-and-steam emissions, sometimes associated with “gas rings”. On 22 April another field inspection was carried out that reported two large sliding surfaces on the Sciara del Fuoco that showed where blocks frequently descended toward the sea. A thermal anomaly was detected at 0150 on 29 April.
Geologic Background. Spectacular incandescent nighttime explosions at Stromboli have long attracted visitors to the "Lighthouse of the Mediterranean" in the NE Aeolian Islands. This volcano has lent its name to the frequent mild explosive activity that has characterized its eruptions throughout much of historical time. The small island is the emergent summit of a volcano that grew in two main eruptive cycles, the last of which formed the western portion of the island. The Neostromboli eruptive period took place between about 13,000 and 5,000 years ago. The active summit vents are located at the head of the Sciara del Fuoco, a prominent scarp that formed about 5,000 years ago due to a series of slope failures which extends to below sea level. The modern volcano has been constructed within this scarp, which funnels pyroclastic ejecta and lava flows to the NW. Essentially continuous mild Strombolian explosions, sometimes accompanied by lava flows, have been recorded for more than a millennium.
Information Contacts: Istituto Nazionale di Geofisica e Vulcanologia (INGV), Sezione di Catania, Piazza Roma 2, 95123 Catania, Italy, (URL: http://www.ct.ingv.it/en/); MIROVA (Middle InfraRed Observation of Volcanic Activity), a collaborative project between the Universities of Turin and Florence (Italy) supported by the Centre for Volcanic Risk of the Italian Civil Protection Department (URL: http://www.mirovaweb.it/); Hawai'i Institute of Geophysics and Planetology (HIGP) - MODVOLC Thermal Alerts System, School of Ocean and Earth Science and Technology (SOEST), Univ. of Hawai'i, 2525 Correa Road, Honolulu, HI 96822, USA (URL: http://modis.higp.hawaii.edu/); Copernicus Browser, Copernicus Data Space Ecosystem, European Space Agency (URL: https://dataspace.copernicus.eu/browser/).
Nishinoshima (Japan) — July 2023 Cite this Report
Nishinoshima
Japan
27.247°N, 140.874°E; summit elev. 100 m
All times are local (unless otherwise noted)
Small ash plumes and fumarolic activity during November 2022 through April 2023
Nishinoshima is a small island located about 1,000 km S of Tokyo in the Ogasawara Arc in Japan. The island is the summit of a massive submarine volcano that has prominent peaks to the S, W, and NE. Eruptions date back to 1973; the most recent eruption period began in October 2022 and was characterized by ash plumes and fumarolic activity (BGVN 47:12). This report describes ash plumes and fumarolic activity during November 2022 through April 2023 based on monthly reports from the Japan Meteorological Agency (JMA) monthly reports and satellite data.
The most recent eruptive activity prior to the reporting internal occurred on 12 October 2022, when an ash plume rose 3.5 km above the crater rim. An aerial observation conducted by the Japan Coast Guard (JCG) on 25 November reported that white fumaroles rose approximately 200 m above the central crater of a pyroclastic cone (figure 119), and multiple plumes were observed on the ESE flank of the cone. Discolored water ranging from reddish-brown to brown and yellowish-green were visible around the perimeter of the island (figure 119). No significant activity was reported in December.
During an overflight conducted by JCG on 25 January 2023 intermittent activity and small, blackish-gray plumes rose 900 m above the central part of the crater were observed (figure 120). The fumarolic zone of the E flank and base of the cone had expanded and emissions had intensified. Dark brown discolored water was visible around the perimeter of the island.
No significant activity was reported during February through March. Ash plumes at 1050 and 1420 on 11 April rose 1.9 km above the crater rim and drifted NW and N. These were the first ash plumes observed since 12 October 2022. On 14 April JCG carried out an overflight and reported that no further eruptive activity was visible, although white gas-and-steam plumes were visible from the central crater and rose 900 m high (figure 121). Brownish and yellow-green discolored water surrounded the island.
Intermittent low-to-moderate power thermal anomalies were recorded in the MIROVA graph (Middle InfraRed Observation of Volcanic Activity) during November 2022 through April 2023 (figure 123). A cluster of six to eight anomalies were detected during November while a smaller number were detected during the following months: two to three during December, one during mid-January 2023, one during February, five during March, and two during April. Thermal activity was also reflected in infrared satellite data at the summit crater, accompanied by occasional gas-and-steam plumes (figure 124).
Geologic Background. The small island of Nishinoshima was enlarged when several new islands coalesced during an eruption in 1973-74. Multiple eruptions that began in 2013 completely covered the previous exposed surface and continued to enlarge the island. The island is the summit of a massive submarine volcano that has prominent peaks to the S, W, and NE. The summit of the southern cone rises to within 214 m of the ocean surface 9 km SSE.
Information Contacts: Japan Meteorological Agency (JMA), 1-3-4 Otemachi, Chiyoda-ku, Tokyo 100-8122, Japan (URL: http://www.jma.go.jp/jma/indexe.html); MIROVA (Middle InfraRed Observation of Volcanic Activity), a collaborative project between the Universities of Turin and Florence (Italy) supported by the Centre for Volcanic Risk of the Italian Civil Protection Department (URL: http://www.mirovaweb.it/); Copernicus Browser, Copernicus Data Space Ecosystem, European Space Agency (URL: https://dataspace.copernicus.eu/browser/).
Karangetang (Indonesia) — July 2023 Cite this Report
Karangetang
Indonesia
2.781°N, 125.407°E; summit elev. 1797 m
All times are local (unless otherwise noted)
Lava flows, incandescent avalanches, and ash plumes during January-June 2023
Karangetang (also known as Api Siau), at the northern end of the island of Siau, Indonesia, contains five summit craters along a N-S line. More than 40 eruptions have been recorded since 1675; recent eruptions have included frequent explosive activity, sometimes accompanied by pyroclastic flows and lahars. Lava dome growth has occurred in the summit craters and collapses of lava flow fronts have produced pyroclastic flows. The two active summit craters are Kawah Dua (the N crater) and Kawah Utama (the S crater, also referred to as the “Main Crater”). The most recent eruption began in late November 2018 and has more recently consisted of weak thermal activity and gas-and-steam emissions (BGVN 48:01). This report updates activity characterized by lava flows, incandescent avalanches, and ash plumes during January through June 2023 using reports from Pusat Vulkanologi dan Mitigasi Bencana Geologi (PVMBG, also known as CVGHM, or the Center of Volcanology and Geological Hazard Mitigation), MAGMA Indonesia, the Darwin VAAC (Volcano Ash Advisory Center), and satellite data.
Activity during January was relatively low and mainly consisted of white gas-and-steam emissions that rose 25-150 m above Main Crater (S crater) and drifted in different directions. Incandescence was visible from the lava dome in Kawah Dua (the N crater). Weather conditions often prevented clear views of the summit. On 18 January the number of seismic signals that indicated avalanches of material began to increase. In addition, there were a total of 71 earthquakes detected during the month.
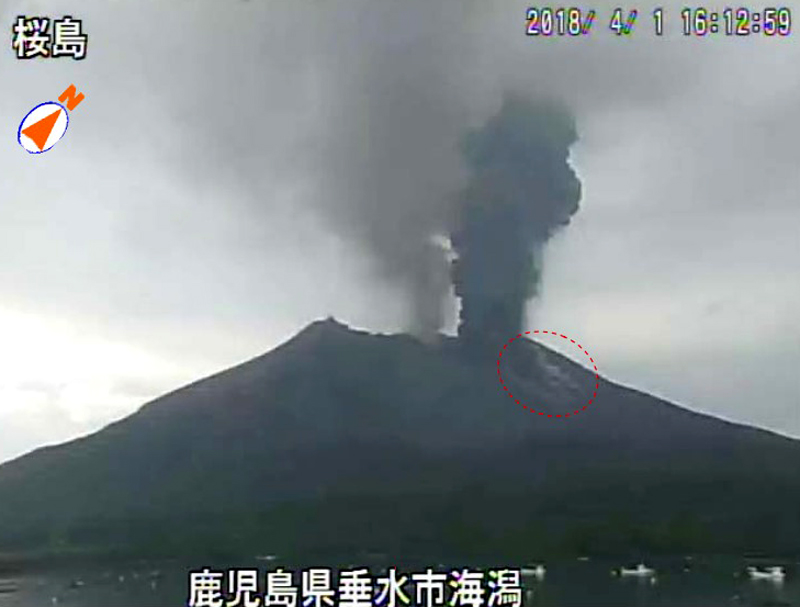
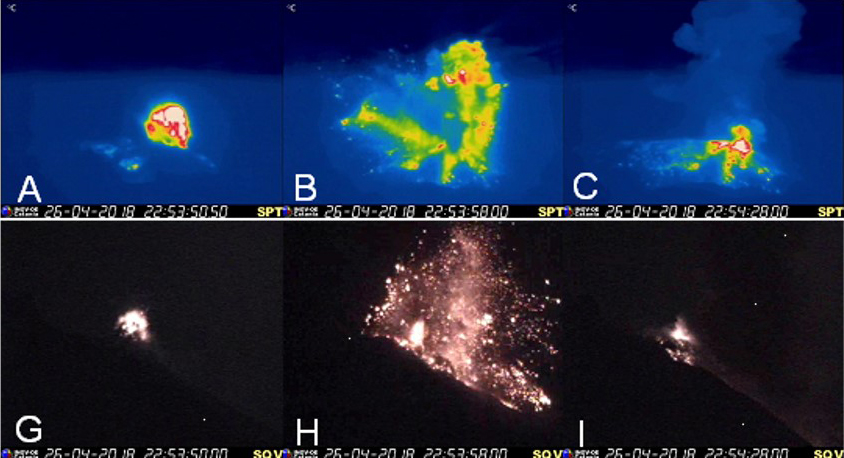
Activity continued to increase during the first week of February. Material from Main Crater traveled as far as 800 m down the Batuawang (S) and Batang (W) drainages and as far as 1 km W down the Beha (W) drainage on 4 February. On 6 February 43 earthquake events were recorded, and on 7 February, 62 events were recorded. White gas-and-steam emissions rose 25-250 m above both summit craters throughout the month. PVMBG reported an eruption began during the evening of 8 February around 1700. Photos showed incandescent material at Main Crater. Incandescent material had also descended the flank in at least two unconfirmed directions as far as 2 km from Main Crater, accompanied by ash plumes (figure 60). As a result, PVMBG increased the Volcano Alert Level (VAL) to 3 (the second highest level on a 1-4 scale).
Occasional nighttime webcam images showed three main incandescent lava flows of differing lengths traveling down the S, SW, and W flanks (figure 61). Incandescent rocks were visible on the upper flanks, possibly from ejected or collapsed material from the crater, and incandescence was the most intense at the summit. Based on analyses of satellite imagery and weather models, the Darwin VAAC reported that daily ash plumes during 16-20 February rose to 2.1-3 km altitude and drifted NNE, E, and SE. BNPB reported on 16 February that as many as 77 people were evacuated and relocated to the East Siau Museum. A webcam image taken at 2156 on 17 February possibly showed incandescent material descending the SE flank. Ash plumes rose to 2.1 km altitude and drifted SE during 22-23 February, according to the Darwin VAAC.
Incandescent avalanches of material and summit incandescence at Main Crater continued during March. White gas-and-steam emissions during March generally rose 25-150 m above the summit crater; on 31 March gas-and-steam emissions rose 200-400 m high. An ash plume rose to 2.4 km altitude and drifted S at 1710 on 9 March and a large thermal anomaly was visible in images taken at 0550 and 0930 on 10 March. Incandescent material was visible at the summit and on the flanks based on webcam images taken at 0007 and 2345 on 16 March, at 1828 on 17 March, at 1940 on 18 March, at 2311 on 19 March, and at 2351 on 20 March. Incandescence was most intense on 18 and 20 March and webcam images showed possible Strombolian explosions (figure 62). An ash plume rose to 2.4 km altitude and drifted SW on 18 March, accompanied by a thermal anomaly.
Summit crater incandescence at Main Crater and on the flanks persisted during April. Incandescent material at the S crater and on the flanks was reported at 0016 on 1 April. The lava flows had stopped by 1 April according to PVMBG, although incandescence was still visible up to 10 m high. Seismic signals indicating effusion decreased and by 6 April they were no longer detected. Incandescence was visible from both summit craters. On 26 April the VAL was lowered to 2 (the second lowest level on a 1-4 scale). White gas-and-steam emissions rose 25-200 m above the summit crater.
During May white gas-and-steam emissions generally rose 50-250 m above the summit, though it was often cloudy, which prevented clear views; on 21 May gas-and-steam emissions rose 50-400 m high. Nighttime N summit crater incandescence rose 10-25 m above the lava dome, and less intense incandescence was noted above Main Crater, which reached about 10 m above the dome. Sounds of falling rocks at Main Crater were heard on 15 May and the seismic network recorded 32 rockfall events in the crater on 17 May. Avalanches traveled as far as 1.5 km down the SW and S flanks, accompanied by rumbling sounds on 18 May. Incandescent material descending the flanks was captured in a webcam image at 2025 on 19 May (figure 63) and on 29 May; summit crater incandescence was observed in webcam images at 2332 on 26 May and at 2304 on 29 May. On 19 May the VAL was again raised to 3.
Occasional Main Crater incandescence was reported during June, as well as incandescent material on the flanks. White gas-and-steam emissions rose 10-200 m above the summit crater. Ash plumes rose to 2.1 km altitude and drifted SE and E during 2-4 June, according to the Darwin VAAC. Material on the flanks of Main Crater were observed at 2225 on 7 June, at 2051 on 9 June, at 0007 on 17 June, and at 0440 on 18 June. Webcam images taken on 21, 25, and 27 June showed incandescence at Main Crater and from material on the flanks.
MIROVA (Middle InfraRed Observation of Volcanic Activity) analysis of MODIS satellite data showed strong thermal activity during mid-February through March and mid-May through June, which represented incandescent avalanches and lava flows (figure 64). During April through mid-May the power of the anomalies decreased but frequent anomalies were still detected. Brief gaps in activity occurred during late March through early April and during mid-June. Infrared satellite images showed strong lava flows mainly affecting the SW and S flanks, accompanied by gas-and-steam emissions (figure 65). According to data recorded by the MODVOLC thermal algorithm, there were a total of 79 thermal hotspots detected: 28 during February, 24 during March, one during April, five during May, and 21 during June.
Geologic Background. Karangetang (Api Siau) volcano lies at the northern end of the island of Siau, about 125 km NNE of the NE-most point of Sulawesi. The stratovolcano contains five summit craters along a N-S line. It is one of Indonesia's most active volcanoes, with more than 40 eruptions recorded since 1675 and many additional small eruptions that were not documented (Neumann van Padang, 1951). Twentieth-century eruptions have included frequent explosive activity sometimes accompanied by pyroclastic flows and lahars. Lava dome growth has occurred in the summit craters; collapse of lava flow fronts have produced pyroclastic flows.
Information Contacts: Pusat Vulkanologi dan Mitigasi Bencana Geologi (PVMBG, also known as Indonesian Center for Volcanology and Geological Hazard Mitigation, CVGHM), Jalan Diponegoro 57, Bandung 40122, Indonesia (URL: http://www.vsi.esdm.go.id/); MAGMA Indonesia, Kementerian Energi dan Sumber Daya Mineral (URL: https://magma.esdm.go.id/v1); Badan Nasional Penanggulangan Bencana (BNPB), National Disaster Management Agency, Graha BNPB - Jl. Scout Kav.38, East Jakarta 13120, Indonesia (URL: http://www.bnpb.go.id/); Darwin Volcanic Ash Advisory Centre (VAAC), Bureau of Meteorology, Northern Territory Regional Office, PO Box 40050, Casuarina, NT 0811, Australia (URL: http://www.bom.gov.au/info/vaac/); MIROVA (Middle InfraRed Observation of Volcanic Activity), a collaborative project between the Universities of Turin and Florence (Italy) supported by the Centre for Volcanic Risk of the Italian Civil Protection Department (URL: http://www.mirovaweb.it/); Hawai'i Institute of Geophysics and Planetology (HIGP) - MODVOLC Thermal Alerts System, School of Ocean and Earth Science and Technology (SOEST), Univ. of Hawai'i, 2525 Correa Road, Honolulu, HI 96822, USA (URL: http://modis.higp.hawaii.edu/); Copernicus Browser, Copernicus Data Space Ecosystem, European Space Agency (URL: https://dataspace.copernicus.eu/browser/); IDN Times, Jl. Jend. Gatot Subroto Kav. 27 3rd Floor Kuningan, Jakarta, Indonesia 12950, Status of Karangetang Volcano in Sitaro Islands Increases (URL: https://sulsel.idntimes.com/news/indonesia/savi/status-gunung-api-karangetang-di-kepulauan-sitaro-meningkat?page=all).
Ahyi (United States) — July 2023 Cite this Report
Ahyi
United States
20.42°N, 145.03°E; summit elev. -75 m
All times are local (unless otherwise noted)
Intermittent hydroacoustic signals and discolored plumes during November 2022-June 2023
Ahyi seamount is a large, conical submarine volcano that rises to within 75 m of the ocean surface about 18 km SE of the island of Farallon de Pajaros in the Northern Marianas. The remote location of the seamount has made eruptions difficult to document, but seismic stations installed in the region confirmed an eruption in the vicinity in 2001. No new activity was detected until April-May 2014 when an eruption was detected by NOAA (National Oceanic and Atmospheric Administration) divers, hydroacoustic sensors, and seismic stations (BGVN 42:04). New activity was first detected on 15 November by hydroacoustic sensors that were consistent with submarine volcanic activity. This report covers activity during November 2022 through June 2023 based on daily and weekly reports from the US Geological Survey.
Starting in mid-October, hydroacoustic sensors at Wake Island (2.2 km E) recorded signals consistent with submarine volcanic activity, according to a report from the USGS issued on 15 November 2022. A combined analysis of the hydroacoustic signals and seismic stations located at Guam and Chichijima Island, Japan, suggested that the source of this activity was at or near the Ahyi seamount. After a re-analysis of a satellite image of the area that was captured on 6 November, USGS confirmed that there was no evidence of discoloration at the ocean surface. Few hydroacoustic and seismic signals continued through November, including on 18 November, which USGS suggested signified a decline or pause in unrest. A VONA (Volcano Observatory Notice for Aviation) reported that a discolored water plume was persistently visible in satellite data starting on 18 November (figure 6). Though clouds often obscured clear views of the volcano, another discolored water plume was captured in a satellite image on 26 November. The Aviation Color Code (ACC) was raised to Yellow (the second lowest level on a four-color scale) and the Volcano Alert Level (VAL) was raised to Advisory (the second lowest level on a four-level scale) on 29 November.
During December, occasional detections were recorded on the Wake Island hydrophone sensors and discolored water over the seamount remained visible. During 2-7, 10-12, and 16-31 December possible explosion signals were detected. A small area of discolored water was observed in high-resolution Sentinel-2 satellite images during 1-6 December (figure 7). High-resolution satellite images recorded discolored water plumes on 13 December that originated from the summit region; no observations indicated that activity breached the ocean surface. A possible underwater plume was visible in satellite images on 18 December, and during 19-20 December a definite but diffuse underwater plume located SSE from the main vent was reported. An underwater plume was visible in a satellite image taken on 26 December (figure 7).
Hydrophone sensors continued to detect signals consistent with possible explosions during 1-8 January 2023. USGS reported that the number of detections decreased during 4-5 January. The hydrophone sensors experienced a data outage that started at 0118 on 8 January and continued through 10 January, though according to USGS, possible explosions were recorded prior to the data outage and likely continued during the outage. A discolored water plume originating from the summit region was detected in a partly cloudy satellite image on 8 January. On 11-12 and 15-17 January possible explosion signals were recorded again. One small signal was detected during 22-23 January and several signals were recorded on 25 and 31 January. During 27-31 January a plume of discolored water was observed above the seamount in satellite imagery (figure 8).
Low levels of activity continued during February and March, based on data from pressure sensors on Wake Island. During 1 and 4-6 February activity was reported, and a submarine plume was observed on 4 February (figure 8). Possible explosion signals were detected during 7-8, 10, 13-14, and 24 February. During 1-2 and 3-5 March a plume of discolored water was observed in satellite imagery (figure 8). Almost continuous hydroacoustic signals were detected in remote pressure sensor data on Wake Island 2,270 km E from the volcano during 7-13 March. During 12-13 March water discoloration around the seamount was observed in satellite imagery, despite cloudy weather. By 14 March discolored water extended about 35 km, but no direction was noted. USGS reported that the continuous hydroacoustic signals detected during 13-14 March stopped abruptly on 14 March and no new detections were observed. Three 30 second hydroacoustic detections were reported during 17-19 March, but no activity was visible due to cloudy weather. A data outage was reported during 21-22 March, making pressure sensor data unavailable; a discolored water plume was, however, visible in satellite data. A possible underwater explosion signal was detected by pressure sensors at Wake Island on 26, 29, and 31 March, though the cause and origin of these events were unclear.
Similar low activity continued during April, May, and June. Several signals were detected during 1-3 April in pressure sensors at Wake Island. USGS suggested that these may be related to underwater explosions or earthquakes at the volcano, but no underwater plumes were visible in clear satellite images. The pressure sensors had data outages during 12-13 April and no data were recorded; no underwater plumes were visible in satellite images, although cloudy weather obscured most clear views. Eruptive activity was reported starting at 2210 on 21 May. On 22 May a discolored water plume that extended 4 km was visible in satellite images, though no direction was recorded. During 23-24 May some signals were detected by the underwater pressure sensors. Possible hydroacoustic signals were detected during 2-3 and 6-8 June. Multiple hydroacoustic signals were detected during 9-11 and 16-17 June, although no activity was visible in satellite images. One hydroacoustic signal was detected during 23-24 June, but there was some uncertainty about its association with volcanic activity. A single possible hydroacoustic signal was detected during 30 June to 1 July.
Geologic Background. Ahyi seamount is a large conical submarine volcano that rises to within 75 m of the ocean surface ~18 km SE of the island of Farallon de Pajaros in the northern Marianas. Water discoloration has been observed there, and in 1979 the crew of a fishing boat felt shocks over the summit area, followed by upwelling of sulfur-bearing water. On 24-25 April 2001 an explosive eruption was detected seismically by a station on Rangiroa Atoll, Tuamotu Archipelago. The event was well constrained (+/- 15 km) at a location near the southern base of Ahyi. An eruption in April-May 2014 was detected by NOAA divers, hydroacoustic sensors, and seismic stations.
Information Contacts: US Geological Survey, Volcano Hazards Program (USGS-VHP), 12201 Sunrise Valley Drive, Reston, VA, USA, https://volcanoes.usgs.gov/index.html; Copernicus Browser, Copernicus Data Space Ecosystem, European Space Agency (URL: https://dataspace.copernicus.eu/browser/).
Kadovar (Papua New Guinea) — June 2023 Cite this Report
Kadovar
Papua New Guinea
3.608°S, 144.588°E; summit elev. 365 m
All times are local (unless otherwise noted)
An ash plume and weak thermal anomaly during May 2023
Kadovar is a 2-km-wide island that is the emergent summit of a Bismarck Sea stratovolcano. It lies off the coast of New Guinea, about 25 km N of the mouth of the Sepik River. Prior to an eruption that began in 2018, a lava dome formed the high point of the volcano, filling an arcuate landslide scarp open to the S. Submarine debris-avalanche deposits occur to the S of the island. The current eruption began in January 2018 and has comprised lava effusion from vents at the summit and at the E coast; more recent activity has consisted of ash plumes, weak thermal activity, and gas-and-steam plumes (BGVN 48:02). This report covers activity during February through May 2023 using information from the Darwin Volcanic Ash Advisory Center (VAAC) and satellite data.
Activity during the reporting period was relatively low and mainly consisted of white gas-and-steam plumes that were visible in natural color satellite images on clear weather days (figure 67). According to a Darwin VAAC report, at 2040 on 6 May an ash plume rose to 4.6 km altitude and drifted W; by 2300 the plume had dissipated. MODIS satellite instruments using the MODVOLC thermal algorithm detected a single thermal hotspot on the SE side of the island on 7 May. Weak thermal activity was also detected in a satellite image on the E side of the island on 14 May, accompanied by a white gas-and-steam plume that drifted SE (figure 68).
Geologic Background. The 2-km-wide island of Kadovar is the emergent summit of a Bismarck Sea stratovolcano of Holocene age. It is part of the Schouten Islands, and lies off the coast of New Guinea, about 25 km N of the mouth of the Sepik River. Prior to an eruption that began in 2018, a lava dome formed the high point of the andesitic volcano, filling an arcuate landslide scarp open to the south; submarine debris-avalanche deposits occur in that direction. Thick lava flows with columnar jointing forms low cliffs along the coast. The youthful island lacks fringing or offshore reefs. A period of heightened thermal phenomena took place in 1976. An eruption began in January 2018 that included lava effusion from vents at the summit and at the E coast.
Information Contacts: Darwin Volcanic Ash Advisory Centre (VAAC), Bureau of Meteorology, Northern Territory Regional Office, PO Box 40050, Casuarina, NT 0811, Australia (URL: http://www.bom.gov.au/info/vaac/); Hawai'i Institute of Geophysics and Planetology (HIGP) - MODVOLC Thermal Alerts System, School of Ocean and Earth Science and Technology (SOEST), Univ. of Hawai'i, 2525 Correa Road, Honolulu, HI 96822, USA (URL: http://modis.higp.hawaii.edu/); Copernicus Browser, Copernicus Data Space Ecosystem, European Space Agency (URL: https://dataspace.copernicus.eu/browser/).
San Miguel (El Salvador) — June 2023 Cite this Report
San Miguel
El Salvador
13.434°N, 88.269°W; summit elev. 2130 m
All times are local (unless otherwise noted)
Small gas-and-ash explosions during March and May 2023
San Miguel in El Salvador is a broad, deep crater complex that has been frequently modified by eruptions recorded since the early 16th century and consists of the summit known locally as Chaparrastique. Flank eruptions have produced lava flows that extended to the N, NE, and SE during the 17-19th centuries. The most recent activity has consisted of minor ash eruptions from the summit crater. The current eruption period began in November 2022 and has been characterized by frequent phreatic explosions, gas-and-ash emissions, and sulfur dioxide plumes (BGVN 47:12). This report describes small gas-and-ash explosions during December 2022 through May 2023 based on special reports from the Ministero de Medio Ambiente y Recursos Naturales (MARN).
Activity has been relatively low since the last recorded explosions on 29 November 2022. Seismicity recorded by the San Miguel Volcano Station (VSM) located on the N flank at 1.7 km elevation had decreased by 7 December. Sulfur dioxide gas measurements taken with DOAS (Differential Optical Absorption Spectroscopy) mobile equipment were below typical previously recorded values: 300 tons per day (t/d). During December, small explosions were recorded by the seismic network and manifested as gas-and-steam emissions.
Gas-and-ash explosions in the crater occurred during January 2023, which were recorded by the seismic network. Sulfur dioxide values remained low, between 300-400 t/d through 10 March. At 0817 on 14 January a gas-and-ash emission was visible in webcam images, rising just above the crater rim. Some mornings during February, small gas-and-steam plumes were visible in the crater. On 7 March at 2252 MARN noted an increase in degassing from the central crater; gas emissions were constantly observed through the early morning hours on 8 March. During the early morning of 8 March through the afternoon on 9 March, 12 emissions were registered, some accompanied by ash. The last gas-and-ash emission was recorded at 1210 on 9 March; very fine ashfall was reported in El Tránsito (10 km S), La Morita (6 km W), and La Piedrita (3 km W). The smell of sulfur was reported in Piedra Azul (5 km SW). On 16 March MARN reported that gas-and-steam emissions decreased.
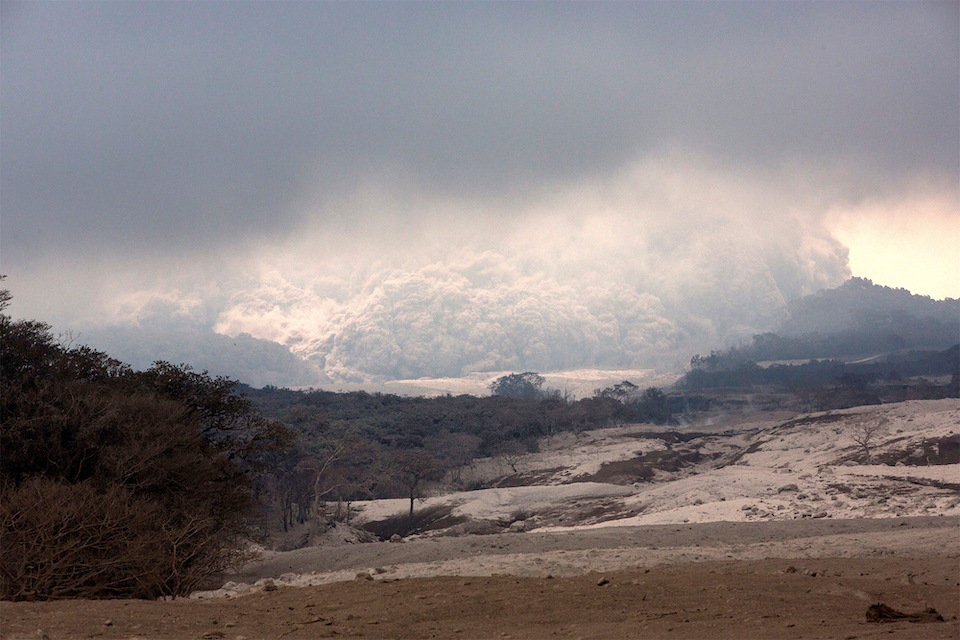
Low degassing and very low seismicity were reported during April; no explosions have been detected between 9 March and 27 May. The sulfur dioxide emissions remained between 350-400 t/d; during 13-20 April sulfur dioxide values fluctuated between 30-300 t/d. Activity remained low through most of May; on 23 May seismicity increased. An explosion was detected at 1647 on 27 May generated a gas-and-ash plume that rose 700 m high (figure 32); a decrease in seismicity and gas emissions followed. The DOAS station installed on the W flank recorded sulfur dioxide values that reached 400 t/d on 27 May; subsequent measurements showed a decrease to 268 t/d on 28 May and 100 t/d on 29 May.
Geologic Background. The symmetrical cone of San Miguel, one of the most active volcanoes in El Salvador, rises from near sea level to form one of the country's most prominent landmarks. A broad, deep, crater complex that has been frequently modified by eruptions recorded since the early 16th century caps the truncated unvegetated summit, also known locally as Chaparrastique. Flanks eruptions of the basaltic-andesitic volcano have produced many lava flows, including several during the 17th-19th centuries that extended to the N, NE, and SE. The SE-flank flows are the largest and form broad, sparsely vegetated lava fields crossed by highways and a railroad skirting the base of the volcano. Flank vent locations have migrated higher on the edifice during historical time, and the most recent activity has consisted of minor ash eruptions from the summit crater.
Information Contacts: Ministero de Medio Ambiente y Recursos Naturales (MARN), Km. 5½ Carretera a Nueva San Salvador, Avenida las Mercedes, San Salvador, El Salvador (URL: http://www.snet.gob.sv/ver/vulcanologia).
Semisopochnoi (United States) — June 2023 Cite this Report
Semisopochnoi
United States
51.93°N, 179.58°E; summit elev. 1221 m
All times are local (unless otherwise noted)
Occasional explosions, ash deposits, and gas-and-steam plumes during December 2022-May 2023
Semisopochnoi is located in the western Aleutians, is 20-km-wide at sea level, and contains an 8-km-wide caldera. The three-peaked Mount Young (formerly Cerberus) was constructed within the caldera during the Holocene. Each of these peaks contains a summit crater; the lava flows on the N flank appear younger than those on the S side. The current eruption period began in early February 2021 and has more recently consisted of intermittent explosions and ash emissions (BGVN 47:12). This report updates activity during December 2022 through May 2023 using daily, weekly, and special reports from the Alaska Volcano Observatory (AVO). AVO monitors the volcano using local seismic and infrasound sensors, satellite data, web cameras, and remote infrasound and lightning networks.
Activity during most of December 2022 was relatively quiet; according to AVO no eruptive or explosive activity was observed since 7 November 2022. Intermittent tremor and occasional small earthquakes were observed in geophysical data. Continuous gas-and-steam emissions were observed from the N crater of Mount Young in webcam images on clear weather days (figure 25). On 24 December, there was a slight increase in earthquake activity and several small possible explosion signals were detected in infrasound data. Eruptive activity resumed on 27 December at the N crater of Mount Young; AVO issued a Volcano Activity Notice (VAN) that reported minor ash deposits on the flanks of Mount Young that extended as far as 1 km from the vent, according to webcam images taken during 27-28 December (figure 26). No ash plumes were observed in webcam or satellite imagery, but a persistent gas-and-steam plume that might have contained some ash rose to 1.5 km altitude. As a result, AVO raised the Aviation Color Code (ACC) to Orange (the second highest level on a four-color scale) and the Volcano Alert Level (VAL) to Watch (the second highest level on a four-level scale). Possible explosions were detected during 21 December 2022 through 1 January 2023 and seismic tremor was recorded during 30-31 December.
During January 2023 eruptive activity continued at the active N crater of Mount Young. Minor ash deposits were observed on the flanks, extending about 2 km SSW, based on webcam images from 1 and 3 January. A possible explosion occurred during 1-2 January based on elevated seismicity recorded on local seismometers and an infrasound signal recorded minutes later by an array at Adak. Though no ash plumes were observed in webcam or satellite imagery, a persistent gas-and-steam plume rose to 1.5 km altitude that might have carried minor traces of ash. Ash deposits were accompanied by periods of elevated seismicity and infrasound signals from the local geophysical network, which AVO reported were likely due to weak explosive activity. Low-level explosive activity was also detected during 2-3 January, with minor gas-and-steam emissions and a new ash deposit that was visible in webcam images. Low-level explosive activity was detected in geophysical data during 4-5 January, with elevated seismicity and infrasound signals observed on local stations. Volcanic tremor was detected during 7-9 January and very weak explosive activity was detected in seismic and infrasound data on 9 January. Weak seismic and infrasound signals were recorded on 17 January, which indicated minor explosive activity, but no ash emissions were observed in clear webcam images; a gas-and-steam plume continued to rise to 1.5 km altitude. During 29-30 January, ash deposits near the summit were observed on fresh snow, according to webcam images.
The active N cone at Mount Young continued to produce a gas-and-steam plume during February, but no ash emissions or explosive events were detected. Seismicity remained elevated with faint tremor during early February. Gas-and-steam emissions from the N crater were observed in clear webcam images on 11-13 and 16 February; no explosive activity was detected in seismic, infrasound, or satellite data. Seismicity has also decreased, with no significant seismic tremor observed since 25 January. Therefore, the ACC was lowered to Yellow (the second lowest level on a four-color scale) and the VAL was lowered to Advisory (the second lowest level on a four-color scale) on 22 February.
Gas-and-steam emissions persisted during March from the N cone of Mount Young, based on clear webcam images. A few brief episodes of weak tremor were detected in seismic data, although seismicity decreased over the month. A gas-and-steam plume detected in satellite data extended 150 km on 18 March. Low-level ash emissions from the N cone at Mount Young were observed in several webcam images during 18-19 March, in addition to small explosions and volcanic tremor. The ACC was raised to Orange and the VAL increased to Watch on 19 March. A small explosion was detected in seismic and infrasound data on 21 March.
Low-level unrest continued during April, although cloudy weather often obscured views of the summit; periods of seismic tremor and local earthquakes were recorded. During 3-4 April a gas-and-steam plume was visible traveling more than 200 km overnight; no ash was evident in the plume, according to AVO. A gas-and-steam plume was observed during 4-6 April that extended 400 km but did not seem to contain ash. Small explosions were detected in seismic and infrasound data on 5 April. Occasional clear webcam images showed continuing gas-and-steam emissions rose from Mount Young, but no ash deposits were observed on the snow. On 19 April small explosions and tremor were detected in seismic and infrasound data. A period of seismic tremor was detected during 22-25 April, with possible weak explosions on 25 April. Ash deposits were visible near the crater rim, but it was unclear if these deposits were recent or due to older deposits.
Occasional small earthquakes were recorded during May, but there were no signs of explosive activity seen in geophysical data. Gas-and-steam emissions continued from the N crater of Mount Young, based on webcam images, and seismicity remained slightly elevated. A new, light ash deposit was visible during the morning of 5 May on fresh snow on the NW flank of Mount Young. During 10 May periods of volcanic tremor were observed. The ACC was lowered to Yellow and the VAL to Advisory on 17 May due to no additional evidence of activity.
Geologic Background. Semisopochnoi, the largest subaerial volcano of the western Aleutians, is 20 km wide at sea level and contains an 8-km-wide caldera. It formed as a result of collapse of a low-angle, dominantly basaltic volcano following the eruption of a large volume of dacitic pumice. The high point of the island is Anvil Peak, a double-peaked late-Pleistocene cone that forms much of the island's northern part. The three-peaked Mount Cerberus (renamed Mount Young in 2023) was constructed within the caldera during the Holocene. Each of the peaks contains a summit crater; lava flows on the N flank appear younger than those on the south side. Other post-caldera volcanoes include the symmetrical Sugarloaf Peak SSE of the caldera and Lakeshore Cone, a small cinder cone at the edge of Fenner Lake in the NE part of the caldera. Most documented eruptions have originated from Young, although Coats (1950) considered that both Sugarloaf and Lakeshore Cone could have been recently active.
Information Contacts: Alaska Volcano Observatory (AVO), a cooperative program of a) U.S. Geological Survey, 4200 University Drive, Anchorage, AK 99508-4667 USA (URL: https://avo.alaska.edu/), b) Geophysical Institute, University of Alaska, PO Box 757320, Fairbanks, AK 99775-7320, USA, and c) Alaska Division of Geological & Geophysical Surveys, 794 University Ave., Suite 200, Fairbanks, AK 99709, USA (URL: http://dggs.alaska.gov/).
Ebeko
Russia
50.686°N, 156.014°E; summit elev. 1103 m
All times are local (unless otherwise noted)
Continued explosions, ash plumes, and ashfall during October 2022-May 2023
Ebeko, located on the N end of Paramushir Island in the Kuril Islands, consists of three summit craters along a SSW-NNE line at the northern end of a complex of five volcanic cones. Eruptions date back to the late 18th century and have been characterized as small-to-moderate explosions from the summit crater, accompanied by intense fumarolic activity. The current eruption period began in June 2022 and has recently consisted of frequent explosions, ash plumes, and thermal activity (BGVN 47:10). This report covers similar activity during October 2022 through May 2023, based on information from the Kamchatka Volcanic Eruptions Response Team (KVERT) and satellite data.
Activity during October consisted of explosive activity, ash plumes, and occasional thermal anomalies. Visual data by volcanologists from Severo-Kurilsk showed explosions producing ash clouds up to 2.1-3 km altitude which drifted E, N, NE, and SE during 1-8, 10, 16, and 18 October. KVERT issued several Volcano Observatory Notices for Aviation (VONA) on 7, 13-15, and 27 October 2022, stating that explosions generated ash plumes that rose to 2.3-4 km altitude and drifted 5 km E, NE, and SE. Ashfall was reported in Severo-Kurilsk (Paramushir Island, about 7 km E) on 7 and 13 October. Satellite data showed a thermal anomaly over the volcano on 15-16 October. Visual data showed ash plumes rising to 2.5-3.6 km altitude on 22, 25-29, and 31 October and moving NE due to constant explosions.
Similar activity continued during November, with explosions, ash plumes, and ashfall occurring. KVERT issued VONAs on 1-2, 4, 6-7, 9, 13, and 16 November that reported explosions and resulting ash plumes that rose to 1.7-3.6 km altitude and drifted 3-5 km SE, ESE, E, and NE. On 1 November ash plumes extended as far as 110 km SE. On 5, 8, 12, and 24-25 November explosions and ash plumes rose to 2-3.1 km altitude and drifted N and E. Ashfall was observed in Severo-Kurilsk on 7 and 16 November. A thermal anomaly was visible during 1-4, 16, and 20 November. Explosions during 26 November rose as high as 2.7 km altitude and drifted NE (figure 45).
Explosions and ash plumes continued to occur in December. During 1-2 and 4 December volcanologists from Severo-Kurilsk observed explosions that sent ash to 1.9-2.5 km altitude and drifted NE and SE (figure 46). VONAs were issued on 5, 9, and 16 December reporting that explosions generated ash plumes rising to 1.9 km, 2.6 km, and 2.4 km altitude and drifted 5 km SE, E, and NE, respectively. A thermal anomaly was visible in satellite imagery on 16 December. On 18 and 27-28 December explosions produced ash plumes that rose to 2.5 km altitude and drifted NE and SE. On 31 December an ash plume rose to 2 km altitude and drifted NE.
Explosions continued during January 2023, based on visual observations by volcanologists from Severo-Kurilsk. During 1-7 January explosions generated ash plumes that rose to 4 km altitude and drifted NE, E, W, and SE. According to VONAs issued by KVERT on 2, 4, 10, and 23 January, explosions produced ash plumes that rose to 2-4 km altitude and drifted 5 km N, NE, E, and ENE; the ash plume that rose to 4 km altitude occurred on 10 January (figure 47). Satellite data showed a thermal anomaly during 3-4, 10, 13, 16, 21, 22, and 31 January. KVERT reported that an ash cloud on 4 January moved 12 km NE. On 6 and 9-11 January explosions sent ash plumes to 4.5 km altitude and drifted W and ESE. On 13 January an ash plume rose to 3 km altitude and drifted SE. During 20-24 January ash plumes from explosions rose to 3.7 km altitude and drifted SE, N, and NE. On 21 January the ash plume drifted as far as 40 km NE. During 28-29 and 31 January and 1 February ash plumes rose to 4 km altitude and drifted NE.
During February, explosions, ash plumes, and ashfall were reported. During 1, 4-5 and 7-8 February explosions generated ash plumes that rose to 4.5 km altitude and drifted E and NE; ashfall was observed on 5 and 8 February. On 6 February an explosion produced an ash plume that rose to 3 km altitude and drifted 7 km E, causing ashfall in Severo-Kurilsk. A thermal anomaly was visible in satellite data on 8, 9, 13, and 21 February. Explosions on 9 and 12-13 February produced ash plumes that rose to 4 km altitude and drifted E and NE; the ash cloud on 12 February extended as far as 45 km E. On 22 February explosions sent ash to 3 km altitude that drifted E. During 24 and 26-27 February ash plumes rose to 4 km altitude and drifted E. On 28 February an explosion sent ash to 2.5-3 km altitude and drifted 5 km E; ashfall was observed in Severo-Kurilsk.
Activity continued during March; visual observations showed that explosions generated ash plumes that rose to 3.6 km altitude on 3, 5-7, and 9-12 March and drifted E, NE, and NW. Thermal anomalies were visible on 10, 13, and 29-30 March in satellite imagery. On 18, 21-23, 26, and 29-30 March explosions produced ash plumes that rose to 2.8 km altitude and drifted NE and E; the ash plumes during 22-23 March extended up to 76 km E. A VONA issued on 21 March reported an explosion that produced an ash plume that rose to 2.8 km altitude and drifted 5 km E. Another VONA issued on 23 March reported that satellite data showed an ash plume rising to 3 km altitude and drifted 14 km E.
Explosions during April continued to generate ash plumes. On 1 and 4 April an ash plume rose to 2.8-3.5 km altitude and drifted SE and NE. A thermal anomaly was visible in satellite imagery during 1-6 April. Satellite data showed ash plumes and clouds rising to 2-3 km altitude and drifting up to 12 km SW and E on 3 and 6 April (figure 48). KVERT issued VONAs on 3, 5, 14, 16 April describing explosions that produced ash plumes rising to 3 km, 3.5 km, 3.5 km, and 3 km altitude and drifting 5 km S, 5 km NE and SE, 72 km NNE, and 5 km NE, respectively. According to satellite data, the resulting ash cloud from the explosion on 14 April was 25 x 7 km in size and drifted 72-104 km NNE during 14-15 April. According to visual data by volcanologists from Severo-Kurilsk explosions sent ash up to 3.5 km altitude that drifted NE and E during 15-16, 22, 25-26, and 29 April.
The explosive eruption continued during May. Explosions during 3-4, 6-7, and 9-10 May generated ash plumes that rose to 4 km altitude and drifted SW and E. Satellite data showed a thermal anomaly on 3, 9, 13-14, and 24 May. During 12-16, 23-25, and 27-28 May ash plumes rose to 3.5 km altitude and drifted in different directions due to explosions. Two VONA notices were issued on 16 and 25 May, describing explosions that generated ash plumes rising to 3 km and 3.5 km altitude, respectively and extending 5 km E. The ash cloud on 25 May drifted 75 km SE.
Thermal activity in the summit crater, occasionally accompanied by ash plumes and ash deposits on the SE and E flanks due to frequent explosions, were visible in infrared and true color satellite images (figure 49).
Geologic Background. The flat-topped summit of the central cone of Ebeko volcano, one of the most active in the Kuril Islands, occupies the northern end of Paramushir Island. Three summit craters located along a SSW-NNE line form Ebeko volcano proper, at the northern end of a complex of five volcanic cones. Blocky lava flows extend west from Ebeko and SE from the neighboring Nezametnyi cone. The eastern part of the southern crater contains strong solfataras and a large boiling spring. The central crater is filled by a lake about 20 m deep whose shores are lined with steaming solfataras; the northern crater lies across a narrow, low barrier from the central crater and contains a small, cold crescentic lake. Historical activity, recorded since the late-18th century, has been restricted to small-to-moderate explosive eruptions from the summit craters. Intense fumarolic activity occurs in the summit craters, on the outer flanks of the cone, and in lateral explosion craters.
Information Contacts: Kamchatka Volcanic Eruptions Response Team (KVERT), Far Eastern Branch, Russian Academy of Sciences, 9 Piip Blvd., Petropavlovsk-Kamchatsky, 683006, Russia (URL: http://www.kscnet.ru/ivs/kvert/); MIROVA (Middle InfraRed Observation of Volcanic Activity), a collaborative project between the Universities of Turin and Florence (Italy) supported by the Centre for Volcanic Risk of the Italian Civil Protection Department (URL: http://www.mirovaweb.it/); Copernicus Browser, Copernicus Data Space Ecosystem, European Space Agency (URL: https://dataspace.copernicus.eu/browser/).
Home Reef
Tonga
18.992°S, 174.775°W; summit elev. -10 m
All times are local (unless otherwise noted)
Discolored plumes continued during November 2022-April 2023
Home Reef is a submarine volcano located in the central Tonga islands between Lateiki (Metis Shoal) and Late Island. The first recorded eruption occurred in the mid-19th century, when an ephemeral island formed. An eruption in 1984 produced a 12-km-high eruption plume, a large volume of floating pumice, and an ephemeral island 500 x 1,500 m wide, with cliffs 30-50 m high that enclosed a water-filled crater. Another island-forming eruption in 2006 produced widespread pumice rafts that drifted as far as Australia; by 2008 the island had eroded below sea level. The previous eruption occurred during October 2022 and was characterized by a new island-forming eruption, lava effusion, ash plumes, discolored water, and gas-and-steam plumes (BGVN 47:11). This report covers discolored water plumes during November 2022 through April 2023 using satellite data.
Discolored plumes continued during the reporting period and were observed in true color satellite images on clear weather days. Satellite images show light green-yellow discolored water extending W on 8 and 28 November 2022 (figure 31), and SW on 18 November. Light green-yellow plumes extended W on 3 December, S on 13 December, SW on 18 December, and W and S on 23 December (figure 31). On 12 January 2023 discolored green-yellow plumes extended to the NE, E, SE, and N. The plume moved SE on 17 January and NW on 22 January. Faint discolored water in February was visible moving NE on 1 February. A discolored plume extended NW on 8 and 28 March and NW on 13 March (figure 31). During April, clear weather showed green-blue discolored plumes moving S on 2 April, W on 7 April, and NE and S on 12 April. A strong green-yellow discolored plume extended E and NE on 22 April for several kilometers (figure 31).
Geologic Background. Home Reef, a submarine volcano midway between Metis Shoal and Late Island in the central Tonga islands, was first reported active in the mid-19th century, when an ephemeral island formed. An eruption in 1984 produced a 12-km-high eruption plume, large amounts of floating pumice, and an ephemeral 500 x 1,500 m island, with cliffs 30-50 m high that enclosed a water-filled crater. In 2006 an island-forming eruption produced widespread dacitic pumice rafts that drifted as far as Australia. Another island was built during a September-October 2022 eruption.
Information Contacts: Copernicus Browser, Copernicus Data Space Ecosystem, European Space Agency (URL: https://dataspace.copernicus.eu/browser/).
Ambae
Vanuatu
15.389°S, 167.835°E; summit elev. 1496 m
All times are local (unless otherwise noted)
New lava flow, ash plumes, and sulfur dioxide plumes during February-May 2023
Ambae, also known as Aoba, is a large basaltic shield volcano in Vanuatu. A broad pyroclastic cone containing three crater lakes (Manaro Ngoru, Voui, and Manaro Lakua) is located at the summit within the youngest of at least two nested calderas. Periodic phreatic and pyroclastic explosions have been reported since the 16th century. A large eruption more than 400 years ago resulted in a volcanic cone within the summit crater that is now filled by Lake Voui; the similarly sized Lake Manaro fills the western third of the caldera. The previous eruption ended in August 2022 that was characterized by gas-and-steam and ash emissions and explosions of wet tephra (BGVN 47:10). This report covers a new eruption during February through May 2023 that consisted of a new lava flow, ash plumes, and sulfur dioxide emissions, using information from the Vanuatu Meteorology and Geo-Hazards Department (VMGD) and satellite data.
During the reporting period, the Alert Level remained at a 2 (on a scale of 0-5), which has been in place since December 2021. Activity during October 2022 through March 2023 remained relatively low and mostly consisted of gas-and-steam emissions in Lake Voui. VMGD reported that at 1300 on 15 November a satellite image captured a strong amount of sulfur dioxide rising above the volcano (figure 99), and that seismicity slightly increased. The southern and northern part of the island reported a strong sulfur dioxide smell and heard explosions. On 20 February 2023 a gas-and-ash plume rose 1.3 km above the summit and drifted SSW, according to a webcam image (figure 100). Gas-and-steam and possibly ash emissions continued on 23 February and volcanic earthquakes were recorded by the seismic network.
During April, volcanic earthquakes and gas-and-steam and ash emissions were reported from the cone in Lake Voui. VMGD reported that activity increased during 5-7 April; high gas-and-steam and ash plumes were visible, accompanied by nighttime incandescence. According to a Wellington VAAC report, a low-level ash plume rose as high as 2.5 km above the summit and drifted W and SW on 5 April, based on satellite imagery. Reports in Saratamata stated that a dark ash plume drifted to the WSW, but no loud explosion was heard. Webcam images from 2100 showed incandescence above the crater and reflected in the clouds. According to an aerial survey, field observations, and satellite data, water was no longer present in the lake. A lava flow was reported effusing from the vent and traveling N into the dry Lake Voui, which lasted three days. The next morning at 0745 on 6 April a gas-and-steam and ash plume rose 5.4 km above the summit and drifted ESE, based on information from VMGD (figure 101). The Wellington VAAC also reported that light ashfall was observed on the island. Intermittent gas-and-steam and ash emissions were visible on 7 April, some of which rose to an estimated 3 km above the summit and drifted E. Webcam images during 0107-0730 on 7 April showed continuing ash emissions. A gas-and-steam and ash plume rose 695 m above the summit crater at 0730 on 19 April and drifted ESE, based on a webcam image (figure 102).
According to visual and infrared satellite data, water was visible in Lake Voui as late as 24 March 2023 (figure 103). The vent in the caldera showed a gas-and-steam plume drifted SE. On 3 April thermal activity was first detected, accompanied by a gas-and-ash plume that drifted W (figure 103). The lava flow moved N within the dry lake and was shown cooling by 8 April. By 23 April much of the water in the lake had returned. Occasional sulfur dioxide plumes were detected by the TROPOMI instrument on the Sentinel-5P satellite that exceeded 2 Dobson Units (DU) and drifted in different directions (figure 104).
Geologic Background. The island of Ambae, also known as Aoba, is a massive 2,500 km3 basaltic shield that is the most voluminous volcano of the New Hebrides archipelago. A pronounced NE-SW-trending rift zone with numerous scoria cones gives the 16 x 38 km island an elongated form. A broad pyroclastic cone containing three crater lakes (Manaro Ngoru, Voui, and Manaro Lakua) is located at the summit within the youngest of at least two nested calderas, the largest of which is 6 km in diameter. That large central edifice is also called Manaro Voui or Lombenben volcano. Post-caldera explosive eruptions formed the summit craters about 360 years ago. A tuff cone was constructed within Lake Voui (or Vui) about 60 years later. The latest known flank eruption, about 300 years ago, destroyed the population of the Nduindui area near the western coast.
Information Contacts: Geo-Hazards Division, Vanuatu Meteorology and Geo-Hazards Department (VMGD), Ministry of Climate Change Adaptation, Meteorology, Geo-Hazards, Energy, Environment and Disaster Management, Private Mail Bag 9054, Lini Highway, Port Vila, Vanuatu (URL: http://www.vmgd.gov.vu/, https://www.facebook.com/VanuatuGeohazardsObservatory/); Wellington Volcanic Ash Advisory Centre (VAAC), Meteorological Service of New Zealand Ltd (MetService), PO Box 722, Wellington, New Zealand (URL: http://www.metservice.com/vaac/, http://www.ssd.noaa.gov/VAAC/OTH/NZ/messages.html); MIROVA (Middle InfraRed Observation of Volcanic Activity), a collaborative project between the Universities of Turin and Florence (Italy) supported by the Centre for Volcanic Risk of the Italian Civil Protection Department (URL: http://www.mirovaweb.it/); Global Sulfur Dioxide Monitoring Page, Atmospheric Chemistry and Dynamics Laboratory, NASA Goddard Space Flight Center (NASA/GSFC), 8800 Greenbelt Road, Goddard, Maryland, USA (URL: https://so2.gsfc.nasa.gov/); Copernicus Browser, Copernicus Data Space Ecosystem, European Space Agency (URL: https://dataspace.copernicus.eu/browser/).
Search Bulletin Archive by Publication Date
Select a month and year from the drop-downs and click "Show Issue" to have that issue displayed in this tab.
The default month and year is the latest issue available.
Bulletin of the Global Volcanism Network - Volume 43, Number 08 (August 2018)
Managing Editor: Edward Venzke
Agung (Indonesia)
Ash explosions and lava dome effusion continue during January-July 2018
Aira (Japan)
Activity increased at Minamidake and decreased at Showa crater in early 2018
Etna (Italy)
Degassing continues, accompanied by intermittent ash emissions and small Strombolian explosions in June and July 2018
Fernandina (Ecuador)
Brief eruptive episode 16-22 June 2018, lava flows down N flank into the ocean
Fuego (Guatemala)
Pyroclastic flows on 3 June 2018 cause at least 110 fatalities, 197 missing, and extensive damage; ongoing ash explosions, pyroclastic flows, and lahars
Karymsky (Russia)
Renewed eruptive activity with ash plumes during April through July 2018
Klyuchevskoy (Russia)
Intermittent moderate gas, steam, and ash emissions; no ash seen after 15 June 2018
Stromboli (Italy)
Continued Strombolian activity from five active summit vents through March-June 2018
Suwanosejima (Japan)
Intermittent ash emission continues from January through June 2018
Yasur (Vanuatu)
Centuries-long eruption continues during February-July 2018
Agung
Indonesia
8.343°S, 115.508°E; summit elev. 2997 m
All times are local (unless otherwise noted)
Ash explosions and lava dome effusion continue during January-July 2018
After a large, deadly explosive and effusive eruption during 1963-64, Indonesia's Mount Agung was quiet until a new eruption began in November 2017 (BGVN 43:01). A lava dome emerged into the summit crater at the end of November and intermittent plumes of ash rose as high as 3 km above the summit through the end of the year. Activity continued into 2018 with explosions that produced ash plumes rising multiple kilometers above the summit, and the growth of the lava dome within the summit crater. Information about the ongoing eruptive episode comes from Pusat Vulkanologi dan Mitigasi Bencana Geologi (PVMBG), also known as the Indonesian Center for Volcanology and Geological Hazard Mitigation (CVGHM), the Darwin Volcanic Ash Advisory Center (VAAC), and multiple sources of satellite data. This report covers the ongoing eruption from January through July 2018.
Intermittent explosions with ash plumes were reported at Agung several times during January 2018, including Strombolian activity on 19 January. Activity decreased significantly by the end of the month; only one explosion with ash was reported during February. Two ash plumes were reported in March and three were reported each month during April and May. A more substantial explosion in mid-June produced an ash plume that rose to 7 km altitude. A series of deep-seated earthquakes during the third week of June was followed by large explosions and new effusions of lava inside the summit crater beginning on 28 June. A strong thermal signal also appeared on 28 June that gradually diminished during July. Intermittent plumes of steam and ash recurred daily until 19 July; plume heights rose up to 3 km above the summit on several occasions. Strombolian explosions on 2 and 8 July sent ejecta as far as 2 km from the summit. Explosive activity became more intermittent during the last two weeks of the month; the last reported explosion was on 27 July.
Activity during January-May 2018. During most days of January 2018 when fog was not obscuring the summit, PVMGB reported plumes of steam and minor ash rising about 500 m above the summit. In addition, intermittent explosions produced higher, denser ash plumes that rose 1,000-2,500 m above the summit several times. Ash plumes on 1 and 2 January rose to 1,000 and 1,500 m above the summit; incandescence was observed at the summit on both nights, and trace ashfall was reported at the Rendang Post on 2 January. The Darwin VAAC reported the ash plume on 1 January at 6.1 km altitude moving SW. A single MODVOLC thermal alert was recorded on 4 January. On 5 January PVMGB lowered the evacuation radius from 10 to 6 km, permitting the return of thousands of displaced people to their homes. Approximately 17,000 people in seven villages within 6 km of Agung were still under evacuation orders from the events of late 2017.
The Agung Volcano Observatory issued VONA's (Volcano Observatory Notice for Aviation) on 4, 8, 9, 11, 15, 17, 19, 23, 24, and 30 January relating to the larger explosions and ash plumes. On 11 January, an ash plume rose to 2,500 m above the summit and drifted N and NE (figure 29). Another 2,500-m-high ash plume on 19 January was accompanied by Strombolian activity at the summit for several hours, and incandescent ejecta that traveled 1,000 m from the crater. Ashfall was later reported in Tulamben village in the Kubu district (9 km NE) and in Purwekerti village in the Abang district (14 km ENE). Visual monitoring using drones carried out on 22 January showed that the volume of the lava dome was relatively unchanged at around 20 million m3. The summit was obscured by fog for the last week of the month.
Activity decreased noticeably in late January and February. Steam and minor ash plumes rose only 50-800 m above the summit for most of the month. As a result of the decrease in activity, PVMBG lowered the Alert Level from Level IV to Level III (on a four-level scale) on 10 February 2018. The radius of evacuation was also lowered from 6 to 4 km. A single explosion on 14 February sent an ash plume to 1,500 m above the summit.
For most of March 2018, steam plumes rose less than 400 m above the summit. VONA's were issued by the Agung Volcano Observatory for ash plumes twice, on 12 March (local time) when a plume rose 800 m above the summit and drifted E, and on 26 March when the ash plume rose to 500 m and drifted NW. During much of April 2018, steam plumes rose less than 300 m above the summit; weather obscured views of the summit for most of the last week of the month. AVO issued VONA's for ash plumes on 6, 11 and 30 April; the plumes on 6 and 11 April rose 500 m and drifted W and SW respectively. The Darwin VAAC reported a series of four short-lived explosions with ash plumes on 11 April; they each dissipated within a few hours. PVMBG reported another explosion on 15 April that produced an ash plume that also rose 500 m. The plume on 30 April rose 1,500 m and drifted SW.
Similar activity persisted throughout May 2018. Steam plumes generally rose 50-100 m above the summit crater each day. In addition, explosions were reported on 9, 19, and 29 May. PVMBG reported that no ash plume was observed on 9 May, due to fog obscuring the summit, but the ash plume on 19 May rose to 1,000 m above the summit and drifted SE, and the ash plume on 29 May rose 500 m and drifted SW.
Activity during June and July 2018. The volcano was covered in fog for much of the first two weeks of June. A short-lived explosion on 10 June 2018 was reported by PVMBG, but meteoric clouds obscured the summit. The Darwin VAAC noted the plume in a satellite image drifting W at about 4.6 km altitude. An explosion on 13 June produced an ash plume that rose 2,000 m above the summit and drifted WSW (figure 30). Another explosion was recorded on 15 June, but the summit was obscured, and no ash cloud was visible to ground observers. However, the Darwin VAAC reported the plume visible in satellite imagery at 7 km altitude (about 4 km above the summit) drifting SW and S for most of the day before dissipating. Ashfall was reported about 7 km W in the village of Puregai. PVMBG reported white and gray emissions on 17 June that rose 500 m.
An explosion during the evening (local time) of 27 June 2018 produced an ash plume that rose 2,000 m from the summit and drifted W. Another explosion the following morning produced a sustained ash cloud that lasted for several hours and again caused ashfall around the village of Puregai. It rose to about 2,000 m above the summit and drifted W and SW (figure 31).
PVMBG noted in late June that inflation of 5 mm had occurred since 13 May 2018. They reported that the ash plumes on 28 June caused some airlines to cancel flights to Bali, and ashfall was reported in several villages in Bangli and areas to the W and SW the following day (figure 32). The International Gusti Ngurah Rai (IGNR) airport (60 km SW) in Denpasar, the Blimbing Sari Airport (128 km W) in Banyuwangi, and the Noto Hadinegoro Airport (200 km W) in Jember closed for portions of the day on 29 June (ANTARA News).
Incandescence overnight on 28-29 June indicated fresh effusions of lava at the summit; they were accompanied by ash emissions that rose 1,500-2,500 m. Thermal satellite images recorded on 29 June indicated significant hotspots within the crater with thermal energy reaching 819 Megawatts; this was the largest amount of thermal energy recorded during the 2017-2018 activity, significantly higher than the maximum recorded of 97 Megawatts reached at the end of November 2017. The MIROVA data clearly reflected the sudden surge of thermal energy into the summit crater at the end of June (figure 33).
The Darwin VAAC reported continuous emissions of ash beginning on 28 June that drifted to the W for over 24 hours. The height was initially reported by ground observers at 3.7 km altitude but was raised to 7 km altitude a few hours later, based on satellite imagery and pilot reports. By late that day, an upper plume (at 7 km) drifted SW and a second plume drifted W at 5.5 km altitude. By late on 29 June the continuous ash plume was drifting NW at 4.9 km altitude; it finally dissipated early on 30 June. In addition to large ash plumes and a major thermal anomaly, a substantial SO2 plume also emerged from Agung on 28-29 June 2018. The plume drifted W over Java and then dispersed to the NW over the next 24 hours (figure 34). A lingering, smaller plume was still visible two days later.
A series of discrete eruptions lasting from late on 30 June through 2 July 2018 produced ash plumes that rose from 3.7 to 5.5 km altitude and drifted NW and W, according to the Darwin VAAC. Effusive activity continued to increase during the first week of July 2018 with the continued growth of the lava dome in the summit crater. PVMBG reported an additional volume of lava of 4 million m3 erupted from 28 June through the middle of July bringing the size of the dome to about 27 million m3. The frequency of explosions peaked on 2 July when Strombolian activity sent incandescent ejecta 2 km from the summit in all directions (figure 35).
Several VONA's issued during 2-3 July reported multiple explosions that sent ash plumes 700-2,000 m above the summit. Eighteen explosions were reported by PVMBG between 1 and 8 July. The Darwin VAAC noted a substantial explosion early on 2 July that produced a plume that rose to 7.6 km altitude and drifted W. The remains of the ash plume were discernable in satellite imagery about 250 km W of Agung by the end of the day. The ash plume on 4 July rose 2,500 m above the summit (figure 36).
Strombolian activity was reported again on 8 July 2018 (figure 37). The Darwin VAAC reported intermittent explosions every day from 3-19 July, with ash plumes rising to altitudes from 3.7 to 6.7 km. Additional explosions were reported on 21, 24, 25, and 27 July (figure 38); ash plumes rose 700-2,000 m and drifted W or SE. MODVOLC thermal alerts resumed on 27 June, and multiple daily alerts persisted on most days through the end of July.
Geologic Background. Symmetrical Agung stratovolcano, Bali's highest and most sacred mountain, towers over the eastern end of the island. The volcano, whose name means "Paramount," rises above the SE rim of the Batur caldera, and the northern and southern flanks extend to the coast. The summit area extends 1.5 km E-W, with the high point on the W and a steep-walled 800-m-wide crater on the E. The Pawon cone is located low on the SE flank. Only a few eruptions dating back to the early 19th century have been recorded in historical time. The 1963-64 eruption, one of the largest in the 20th century, produced voluminous ashfall along with devastating pyroclastic flows and lahars that caused extensive damage and many fatalities.
Information Contacts: Pusat Vulkanologi dan Mitigasi Bencana Geologi (PVMBG, also known as Indonesian Center for Volcanology and Geological Hazard Mitigation, CVGHM), Jalan Diponegoro 57, Bandung 40122, Indonesia (URL: http://www.vsi.esdm.go.id/); MAGMA Indonesia, Kementerian Energi dan Sumber Daya Mineral (URL: https://magma.vsi.esdm.go.id/); Darwin Volcanic Ash Advisory Centre (VAAC), Bureau of Meteorology, Northern Territory Regional Office, PO Box 40050, Casuarina, NT 0811, Australia (URL: http://www.bom.gov.au/info/vaac/); MIROVA (Middle InfraRed Observation of Volcanic Activity), a collaborative project between the Universities of Turin and Florence (Italy) supported by the Centre for Volcanic Risk of the Italian Civil Protection Department (URL: http://www.mirovaweb.it/); Hawai'i Institute of Geophysics and Planetology (HIGP) - MODVOLC Thermal Alerts System, School of Ocean and Earth Science and Technology (SOEST), Univ. of Hawai'i, 2525 Correa Road, Honolulu, HI 96822, USA (URL: http://modis.higp.hawaii.edu/); NASA Goddard Space Flight Center (NASA/GSFC), Global Sulfur Dioxide Monitoring Page, Atmospheric Chemistry and Dynamics Laboratory, 8800 Greenbelt Road, Goddard, Maryland, USA (URL: https://so2.gsfc.nasa.gov/); Sutopo Purwo Nugroho?, BNPB, Twitter (URL: https://twitter.com/Sutopo_PN); TEMPO.CO, Tempo Building, Jl. Palmerah Barat No. 8, South Jakarta 12210, Indonesia (URL: https://nasional.tempo.co/read/1102118/pvmbg-energi-thermal-erupsi-gunung-agung-kali-ini-paling-besar); ANTARANEWS.com, ANTARA guesthouse lt 19, Jalan Merdeka Selatan No. 17, Jakarta Pusat, Indonesia, (URL: https://en.antaranews.com).
Aira
Japan
31.5772°N, 130.6589°E; summit elev. 1117 m
All times are local (unless otherwise noted)
Activity increased at Minamidake and decreased at Showa crater in early 2018
Sakurajima is a persistently active volcano within the Aira caldera in Kyushu, Japan. The two currently active summit craters are Showa and Minamidake, both of which produce intermittent ash plumes and occasional pyroclastic flows. This report summarizes the activity from January through June 2018 as described in reports issued by the Japan Meteorological Agency (JMA) and Tokyo Volcanic Ash Advisory Center (VAAC).
The volcano remains on Alert Level 3 (out of five). A change in activity occurred in late 2017 to early 2018, with a reduction in activity at the Showa crater and a significant increase in activity at the Minamidake crater (table 19 and figure 63). During January through June 2018 a total of 260 explosions were recorded at Minamidake (135 of these were explosive), and four at Showa. Pyroclastic flows were produced on 1 April from Showa crater that travelled 800 m, and a flow reached 1,300 m from Minamidake crater on 16 June. Periodic incandescence was visible at the summit throughout the reporting period.
Table 19. Eruptive events and pyroclastic flows recorded at the active craters of Sakurajima volcano in Aira caldera. The number of events that were explosive in nature are in parentheses. Data courtesy of JMA (January to June 2018 monthly reports).
| Month |
No. of ash emissions at Showa crater |
No. of ash emissions at Minamidake crater |
Pyroclastic flows |
| Jan 2018 |
1 |
12 (4) |
-- |
| Feb 2018 |
0 |
7 (3) |
-- |
| Mar 2018 |
0 |
44 (17) |
-- |
| Apr 2018 |
3 |
66 (50) |
800 m E from Showa. |
| May 2018 |
0 |
96 (48) |
-- |
| Jun 2018 |
0 |
35 (13) |
1,300 m SW from Minamidake. |
In January 2018, one ash emission occurred at Showa crater and twelve occurred at Minamidake, with four of these classified as explosive eruptions. The largest ash plume reached 2,500 m above the crater on the 18th and two explosions ejected material out to a maximum of 700-800 m from the craters. Through February, three of seven ash emissions at Minamidake were explosive. The largest ash plume occurred on the 19th and reached 1,500 m above the crater. On the 27th, the crater ejected material out to 700 m from the crater.
Through March, 44 ash emissions occurred with 17 of these classified as explosive events. The largest ash plume was produced on the 26th and reached 3,400 m above the crater. An explosive eruption on 10 March ejected material out to 1,300 m from the crater. During April, Minamidake produced 66 ash emission; 50 of these were explosive (figure 64). Showa produced three events in total and an event on 1 April produced a pyroclastic flow that traveled 800 m to the E (figure 65).The largest ash plume was from Minamidake that reached 3,400 m above the crater.
Elevated activity continued at Minamidake through May, with 96 ash emissions (48 explosive), and the highest reported ash plume reaching 3,200 m above the crater on the 24th. An explosion on 5 May scattered ejecta out to 1,300 m from the crater. Activity was reduced in June with 35 ash emissions (13 explosive) from Minamidake, with an explosive event on the 16th producing an ash plume to 4,700 m above the crater and a pyroclastic flow out to 1,300 m (figure 66). This event deposited ash on nearby communities.
Geologic Background. The Aira caldera in the northern half of Kagoshima Bay contains the post-caldera Sakurajima volcano, one of Japan's most active. Eruption of the voluminous Ito pyroclastic flow accompanied formation of the 17 x 23 km caldera about 22,000 years ago. The smaller Wakamiko caldera was formed during the early Holocene in the NE corner of the caldera, along with several post-caldera cones. The construction of Sakurajima began about 13,000 years ago on the southern rim and built an island that was joined to the Osumi Peninsula during the major explosive and effusive eruption of 1914. Activity at the Kitadake summit cone ended about 4,850 years ago, after which eruptions took place at Minamidake. Frequent eruptions since the 8th century have deposited ash on the city of Kagoshima, located across Kagoshima Bay only 8 km from the summit. The largest recorded eruption took place during 1471-76.
Information Contacts: Japan Meteorological Agency (JMA), Otemachi, 1-3-4, Chiyoda-ku Tokyo 100-8122, Japan (URL: http://www.jma.go.jp/jma/indexe.html); Tokyo Volcanic Ash Advisory Center (VAAC), 1-3-4 Otemachi, Chiyoda-ku, Tokyo, Japan (URL: http://ds.data.jma.go.jp/svd/vaac/data/); Sentinel Hub Playground (URL: https://www.sentinel-hub.com/explore/sentinel-playground).
Etna
Italy
37.748°N, 14.999°E; summit elev. 3357 m
All times are local (unless otherwise noted)
Degassing continues, accompanied by intermittent ash emissions and small Strombolian explosions in June and July 2018
Etna is the tallest active volcano in continental Europe with persistent activity at multiple summit craters and vents. The active craters are Bocca Nuova and Voragine within the Central Crater, the Northeast Crater, Southeast Crater, and the New Southeast Crater (figure 217). This report summarizes activity from April to July 2018 and is based on reports by the Istituto Nazionale di Geofisica e Vulcanologia (INGV).
Activity through April was characterized by degassing at the summit craters (figure 218), with modest ash emissions from the New Southeast Crater and Northeast Crater in the first week, and occasional small ash emissions at the end of the month. Reduced activity dominated by degassing continued into May with modest ash emission from the Southeast and Northeast craters during the second week, and isolated ash emissions from the Northeast Crater in the second half of the month continuing into June.
Throughout June the activity consisted of degassing at the summit craters with isolated diffuse ash emission from Northeast Crater (figure 219). This continued through to July until low-energy Strombolian activity commenced in the Bocca Nuova (from two vents) and Northeast craters (figures 220 and 221). The Strombolian explosions were small, lasting up to several tens of seconds, and were sometimes accompanied by red-brown ash emission. The ejected material was confined to within the craters. More energetic bursts were visible from the INGV surveillance camera located in Milo.
Geologic Background. Mount Etna, towering above Catania on the island of Sicily, has one of the world's longest documented records of volcanism, dating back to 1500 BCE. Historical lava flows of basaltic composition cover much of the surface of this massive volcano, whose edifice is the highest and most voluminous in Italy. The Mongibello stratovolcano, truncated by several small calderas, was constructed during the late Pleistocene and Holocene over an older shield volcano. The most prominent morphological feature of Etna is the Valle del Bove, a 5 x 10 km caldera open to the east. Two styles of eruptive activity typically occur, sometimes simultaneously. Persistent explosive eruptions, sometimes with minor lava emissions, take place from one or more summit craters. Flank vents, typically with higher effusion rates, are less frequently active and originate from fissures that open progressively downward from near the summit (usually accompanied by Strombolian eruptions at the upper end). Cinder cones are commonly constructed over the vents of lower-flank lava flows. Lava flows extend to the foot of the volcano on all sides and have reached the sea over a broad area on the SE flank.
Information Contacts: Sezione di Catania - Osservatorio Etneo, Istituto Nazionale di Geofisica e Vulcanologia (INGV), Sezione di Catania, Piazza Roma 2, 95123 Catania, Italy (URL: http://www.ct.ingv.it/it/); Blog INGVvulcani, Istituto Nazionale di Geofisica e Vulcanologia (INGV) (URL: http://ingvvulcani.wordpress.com).
Fernandina (Ecuador) — August 2018 Cite this Report
Fernandina
Ecuador
0.37°S, 91.55°W; summit elev. 1476 m
All times are local (unless otherwise noted)
Brief eruptive episode 16-22 June 2018, lava flows down N flank into the ocean
Eruptions at Fernandina Island in the Galapagos often occur from vents located around the caldera rim along boundary faults and fissures, and occasionally from side vents on the flank. The last eruption in September 2017 lasted for about one week and originated from a fissure at the SW rim of the caldera. A new eruption in June 2018 lasted for less than a week and originated from a fissure on the N flank of the volcano. Information about the latest eruption was provided by Ecuador's Institudo Geofisica, Escuela Politécnica Nacional (IG-EPN), the Dirección del Parque Nacional Galápagos (PNG), the Washington Volcanic Ash Advisory Center (VAAC), and several sources of satellite data.
A seismic swarm on 16 June 2018 preceded a brief eruptive episode at Fernandina that lasted from 16 to 22 June. Lava erupted from a radial fissure and quickly flowed to the sea down the N flank. Emissions were primarily gas with low ash content and included substantial SO2. After two days of activity, seismicity returned to background levels on 18 June. Park Officials reported only cooling flows and lava no longer entering the sea by 21 June 2018.
Eruption of June 2018. The first evidence of a new eruptive event at Fernandina began as a seismic swarm on 16 June 2018. The largest event (M 4.1) was located 4 km off the NE flank of the island. An active eruption was confirmed a few hours later by guides on a passing boat and by satellite images which indicated a thermal anomaly on the N flank. The eruption consisted of a lava flow on the NNE flank and a gas plume that rose 2-3 km and drifted SW (figure 32). The lava flow quickly reached the ocean, generating steam and gas explosions that were visible from Canal Bolívar, the narrow channel on the NE side of Isla Fernandina that separates it from Isla Isabela (figure 33).
Observations by PNG officials and visitors indicated that lava flows came from a radial fissure on the NNE flank, and produced gas plumes with low ash content that rose 2-3 km and drifted more than 250 km WNW (figures 34 and 35). The Washington VAAC detected an ash and gas plume in visible satellite imagery drifting W from the summit at 2.4 km altitude late in the day on 16 June, along with a significant thermal signature in infrared imagery. A second gas-and-ash plume at the same altitude drifted WNW the following day for a few hours before dissipating. After two days of intense eruptive activity, seismic tremor activity had declined significantly to background levels by noon on 18 June.
A strong pulse of SO2 emissions that drifted W was recorded by satellite instruments on 17 and 18 June 2018 (figure 36). The MODVOLC thermal alert system also recorded a surge of over 100 thermal anomalies from infrared satellite imagery that lasted from 17 to 22 June. More than half of the anomalies appeared on 17 June. The alert pixels were all clustered on the N flank. The MIROVA system also record the spike in thermal activity on 17 June and indicated that the heat source was more than 5 km from the summit (figure 37).
By 21 June 2018 PNG officials reported that lava was no longer reaching the ocean, but steam from cooling flows was visible at the coastline and over the area of the new flows (figure 38).
Geologic Background. Fernandina, the most active of Galápagos volcanoes and the one closest to the Galápagos mantle plume, is a basaltic shield volcano with a deep 5 x 6.5 km summit caldera. The volcano displays the classic "overturned soup bowl" profile of Galápagos shield volcanoes. Its caldera is elongated in a NW-SE direction and formed during several episodes of collapse. Circumferential fissures surround the caldera and were instrumental in growth of the volcano. Reporting has been poor in this uninhabited western end of the archipelago, and even a 1981 eruption was not witnessed at the time. In 1968 the caldera floor dropped 350 m following a major explosive eruption. Subsequent eruptions, mostly from vents located on or near the caldera boundary faults, have produced lava flows inside the caldera as well as those in 1995 that reached the coast from a SW-flank vent. Collapse of a nearly 1 km3 section of the east caldera wall during an eruption in 1988 produced a debris-avalanche deposit that covered much of the caldera floor and absorbed the caldera lake.
Information Contacts: Instituto Geofísico (IG), Escuela Politécnica Nacional, Casilla 17-01-2759, Quito, Ecuador (URL: http://www.igepn.edu.ec/); Dirección del Parque Nacional Galápagos (DPNG), Av. Charles Darwin y S/N, Isla Santa Cruz, Galápagos, Ecuador (URL: http://www.galapagos.gob.ec/, Twitter: @parquegalapagos); Hawai'i Institute of Geophysics and Planetology (HIGP) - MODVOLC Thermal Alerts System, School of Ocean and Earth Science and Technology (SOEST), Univ. of Hawai'i, 2525 Correa Road, Honolulu, HI 96822, USA (URL: http://modis.higp.hawaii.edu/); MIROVA (Middle InfraRed Observation of Volcanic Activity), a collaborative project between the Universities of Turin and Florence (Italy) supported by the Centre for Volcanic Risk of the Italian Civil Protection Department (URL: http://www.mirovaweb.it/); NASA Goddard Space Flight Center (NASA/GSFC), Global Sulfur Dioxide Monitoring Page, Atmospheric Chemistry and Dynamics Laboratory, 8800 Greenbelt Road, Goddard, Maryland, USA (URL: https://so2.gsfc.nasa.gov/); Cultural and Natural Heritage Tours, Galapagos, (CNH Tours), 14 Kilbarry Crescent, Ottawa, Ontario, K1K 0G8, Canada (URL: https://www.cnhtours.com/, Twitter: @CNHtours).
Fuego
Guatemala
14.473°N, 90.88°W; summit elev. 3763 m
All times are local (unless otherwise noted)
Pyroclastic flows on 3 June 2018 cause at least 110 fatalities, 197 missing, and extensive damage; ongoing ash explosions, pyroclastic flows, and lahars
Guatemala's Volcán de Fuego was continuously active throughout the first half of 2018; it has been erupting vigorously since 2002 with historical observations of eruptions dating back to 1531. These eruptions have resulted in major ashfalls, pyroclastic flows, lava flows, and damaging lahars. Large explosions with a significant number of fatalities occurred during 3-5 June 2018 and are covered in this report of activity from January-June 2018. Reports are provided by the Instituto Nacional de Sismologia, Vulcanología, Meteorología e Hidrologia (INSIVUMEH) and the National Office of Disaster Management (CONRED); aviation alerts of ash plumes are issued by the Washington Volcanic Ash Advisory Center (VAAC). Satellite data from NASA, NOAA, and other sources provide valuable information about heat flow and gas emissions. Numerous media outlets provided photographs of the eruptive activity.
Summary of activity, January-June 2018. The first eruptive event of 2018 occurred during 31 January-1 February and lasted for about 20 hours. It included pyroclastic flows, lava flows, incandescent ejecta, ash plumes that rose to 7 km altitude, and ashfall more than 60 km from the volcano. Four lava flows emerged during the event, and the longest traveled 1,500 m down the Seca ravine. Multiple daily explosions that generated ash plumes continued through May 2018. Ash plumes usually rose to 4.2-4.9 km altitude (400-1,200 m above the summit) and drifted up to about 15 km from the volcano in the prevailing wind directions. Ashfall was often reported from communities within 10 km of the summit, most commonly to the W and SW, but also occasionally to the N and NE. Incandescent ejecta rose up to 300 m above the summit during periods of increased activity; block avalanches of the incandescent material descended the major drainages on all flanks, often as far as the vegetated areas several hundred m below the summit.
The first lahar of the year was reported on 9 April; additional lahars occurred several times during May after rainy periods. They were generally 20-30 m wide and 1-2 m deep, carrying debris 1-2 m in diameter. A lava flow was active in the Ceniza ravine for the second half of May, moving up to 1,000 m from the summit during heightened activity on 22 May, and again on 2 June.
The second major eruptive event of 2018, and the largest and deadliest explosive activity in recent history at Fuego, began with a strong explosion on the morning of 3 June 2018. Multiple explosions throughout the day produced an ash plume that was observed in satellite data at 15.2 km altitude, and a strong SO2 plume that drifted N and NE. Numerous large pyroclastic flows generated by the explosions throughout the day descended multiple ravines around the flanks. The most heavily damaged communities were San Miguel Los Lotes and El Rodeo, 10 km SE of the summit at the base of Las Lajas ravine. Most infrastructure in the communities was buried in ash; there were 110 reported fatalities, and at least 197 people reported missing and presumed dead. Additional explosions two days later caused a brief halt in recovery efforts as more pyroclastic flows covered the same area.
Abundant rainfall that began on 6 June 2018 led to over 30 lahars throughout the rest of the month, inundating all of the major ravines and tributaries of the Rio Pantaleón and Rio Gobernador and causing additional infrastructure damage to bridges and roads. The lahars were often 30-40 m wide, 3 m deep, and carried volcanic blocks and debris up to 3 m in diameter. Explosive activity declined to background levels by the middle of June, but daily explosions with ash plumes and incandescent avalanche blocks continued for the remainder of the month, with continued reports of ashfall in communities within 15 km of the summit.
Activity during January-February 2018. During January 2018, plumes of steam rose to 4.3-4.5 km altitude, drifting primarily W, SW, and S. Activity included 3 to 8 explosions per hour that generated ash plumes, which rose to about 4.3-4.8 km altitude (figure 82). Explosions on 19 January increased to 7-13 per hour, and produced ash plumes that drifted more than 15 km W, SW, and S. Incandescent ejecta rose 100-300 m above the crater and traveled up to 400 m from the crater, in some cases reaching vegetated areas. The SW flank was the most affected by ashfall; it was reported in the communities of San Pedro Yepocapa, Escuintla, Sangre de Cristo, Finca Palo Verde, El Porvenir, Santa Sofía, Morelia, Paniché I and II, Rochela, and Ceilán. Block avalanches traveled down the Seca, Taniluyá, Cenizas and Las Lajas ravines. On 28 January, seismic station FG3 registered an increase in pulses of tremor activity. MODVOLC thermal alerts were issued during 17 days in January. The Washington VAAC issued multiple daily aviation alerts on 22 days of the month.
The first major eruptive event of 2018 occurred during 31 January-1 February and lasted for about 20 hours. It included pyroclastic flows, lava flows, incandescent ejecta, ash plumes that rose to 7 km altitude, and ashfall more than 60 km W, SW, and NE from the volcano (figure 83). Explosive activity increased to 5-8 events per hour, incandescent material rose up to 300 m above the crater, and ejecta traveled 300 m.
The substantial ash plume produced from the event drifted tens of kilometers to the W and SW (figures 84 and 85). The SW flank was the area most affected by ashfall, where communities of San Pedro Yepocapa and Escuintla, Sangre de Cristo, Palo Verde, El Porvenir, Santa Sofia, Morelia, Paniché I and II are located. Ashfall also occurred 10-25 km NE in La Rochela, San Andrés Osuna, La Reina, Ciudad Vieja, Antigua Guatemala, and in the WSW part of Guatemala City.
Four lava flows emerged during the eruptive event; a 1,500-m-long flow traveled down the Seca ravine, a 700-m-long flow traveled down the Ceniza ravine, and flows in Las Lajas and La Honda canyons traveled 800 m from the summit. Numerous pyroclastic flows also descended the Honda and Seca ravines, and smaller pyroclastic flows descended the Trinidad and Las Lajas ravines (figure 86).
La Honda ravine had not been affected by pyroclastic flows since 1974; they traveled 5.8 km down that ravine (figure 87), and 4.2 km down the Seca ravine. About 2,880 residents of Escuintla (20 km SE) and Alotenango (8 km E) were evacuated during these events. Significant concentrations of SO2 were detected on 1 February by the Ozone Mapper Profiler Suite (OMPS) on the Suomi National Polar-orbiting Partnership (Suomi-NPP) satellite (figure 88).
Multiple daily explosions with ash plumes continued throughout the rest of February; plumes generally rose to 4.5-4.7 km altitude, and ashfall was reported in communities 10-20 km from the volcano in various directions. Block avalanches descended barrancas Seca, Taniluyá, and Ceniza on most days. Incandescence at night was visible up to 200 m above the crater. MODVOLC thermal alerts were issued on 8 days of the month, and the Washington VAAC issued multiple daily aviation alerts throughout the month.
Activity during March-May 2018. Constant activity continued during March and April 2018, without any major eruptive episodes. Continuous degassing, explosions with ash plumes (figure 89), incandescent ejecta, and daily block avalanches were reported. Steam plumes rose daily to 4.2-4.4 km altitude and usually drifted NW, W, SW, or S. Explosions averaged 4-9 per hour and produced ash plumes that rose to 4.3-4.8 km altitude drifting more than 20 km NW, W, SW, and S. Incandescent ejecta was measured up to 300 m above the crater and traveled a similar distance down the flanks. Block avalanches sent debris up to a kilometer down the major drainages most days. The MODVOLC system recorded thermal alerts during 20 days of March and 22 days of April. The communities most affected by near-daily ashfall, on the SW flank, included San Pedro Yepocapa and Escuintla, Sangre de Cristo, Palo Verde Estate, El Porvenir, Santa Sofia, Morelia, and Paniché I and II. The Washington VAAC issued multiple daily aviation alerts nearly every day during both months.
On 9 April the first lahar of the year descended the Seca canyon and the El Mineral channel, tributaries of the Pantaleón River. It was 10 m wide and 1.5 m deep, carrying abundant debris. In special bulletins released on 14 and 16 April INSIVUMEH noted increased explosive activity occurring at a rate of up to 10 explosions per hour, with ash plumes that rose to 4.8 km altitude. This was followed by a report of a lava flow during the evening of 16 April that traveled 1,300 m down the Seca Ravine.
Activity during the first two weeks of May 2018 was similar in character to the previous two months. Steam plumes rose to 4.1-4.3 km altitude, ash plumes rose to 4.5-4.8 km altitude from explosions that occurred at a rate of 4-8 per hour and drifted SW and W, and ashfall was reported in San Pedro Yepocapa, Morelia, El Por-venir, Sangre de Cristo, Santa Sofía, Finca Palo Verde, Panimaché I y II and other nearby communities. Incandescent ejecta rose 150-300 m high and was thrown 50 m from the crater; shockwaves from the explosions were felt 20-25 km away.
A lahar 12 m wide and 1.5 m deep descended the Seca Ravine on 10 May, dragging tree trunks and volcanic blocks as large as 1.5 m in diameter. A 500-m-long lava flow was reported in the barranca Ceniza on the afternoon of 15 May. Explosions occurred at a rate of 5-7 per hour on 16 May, and ash plumes rose as high as 7.8 km altitude and drifted 20 km W and SW, causing ashfall in Panimaché and Morelia. A moderate-sized lahar traveled down the El Jute ravine on 16 May after rains the previous night. During the afternoons of 16, 17, and 18 May lahars flowed down the Seca ravine from the recent abundant rainfall; they were 20 m wide, 1-2 m deep, and carried tree trunks and blocks 1-2 m in diameter. They grew to 25-30 m wide as they reached the confluence with the Rio Pantaleón, and the odor of sulfur was reported.
A lava flow in the barranca Ceniza was active for a distance of 900 m on 17 May, 600 m on 18 May, and 150 m on 19 May. Occasional sounds were audible more than 30 km from Fuego on 20 May from the 6-8 explosions that occurred every hour. Incandescent pulses rose 250 m above the crater during the night. The lava flow was active again to 700-800 m down the Ceniza ravine on 21 May. Overall activity increased to 10-15 weak to moderate explosions per hour on 22 May. The ash plumes rose to 4.3-4.7 km altitude and drifted 15 km S. Incandescent ejecta rose 300 m above the crater and lava flowed 1,000 m down the Ceniza ravine. On 23 May pulses of incandescent material rose 200-350 m above the crater and generated block avalanches that traveled down the Seca, Ceniza, and Las Lajas ravines as far as the vegetated areas. The lava flow in the Ceniza ravine was active up to 800 m from the summit that day. Explosions had decreased to 5-7 per hour by 24 May; the lava flow was still active 800 m down the Ceniza on 25 May.
The Fuego Observatory reported lahars on 25 May in the Seca and Mineral ravines that were 35 m wide and 1.5 m deep carrying abundant volcanic material. They blocked access between the communities of Yepocapa and Morelia, Santa Sofia, and others on the SW flank. Weak explosions and incandescence continued during the last week of the month, with low-level ash plumes drifting generally S, although poor visibility obscured most observations. Ash advisory reports from the Washington VAAC were more intermittent during May than the previous few months, with reports issued on 13 days of the month. The MODVOLC system reported thermal alerts on 16 days during May. The MIROVA project Log Radiative Power plot for the first six months of 2018 showed constant levels of activity similar to that during 2017 (see figure 73, BGVN 43:02) through the beginning of June, with a spike during the eruptive episode of 31 January-1 February (figure 90). The thermal signal ceased abruptly after the explosive events of early June.
Fuego was characterized by ongoing moderate activity during the first two days of June. Steam plumes rose to 4.5 km altitude and drifted S, and 5-8 moderate explosions per hour produced ash plumes that rose to 4.6-4.8 km altitude and drifted 8-20 km S and SE. Moderate to strong shock waves from the explosions caused roofs to vibrate 15-20 km away on the S flank. Pulses of incandescent ejecta rose 100-200 m above the crater and created block avalanches that descended the Seca, Ceniza and Las Lajas ravines as far as the vegetated areas; fine-grained ash fell in Panamiche I. On 2 June lahars descended the Seca, Rio Mineral, Cenizas, Trinidad and Jute ravines, and a lava flow was reported moving 1,000 m down the Ceniza ravine.
Eruptive events of 3-5 June 2018. The second major eruptive event of 2018, and the deadliest in the recent history of Fuego, began with a strong explosion in the early morning of 3 June 2018. The ash plume rose rapidly to 6 km altitude and initially drifted W and SW. It generated large pyroclastic flows that traveled down the Seca, Santa Teresa, and Ceniza ravines and into the communities of Sangre de Cristo and San Pedro Yepocapa on the W flank. Strong explosions continued throughout the day and generated additional large pyroclastic flows in the Seca, Cenizas, Mineral, Taniluyá, Las Lajas, and Honda ravines with devastating consequences to numerous communities around the volcano (figures 91-94).
The Washington VAAC reported explosions later in the day that generated an ash plume that drifted NE at 9.1 km altitude and E at 15.2 km altitude. The Suomi NPP satellite captured an image of the ash plume rising above the cloud cover at 1300 local time (figure 95). Ashfall of tephra and lapilli was reported more than 25 km away in the village of La Soledad; in addition, the municipalities of Quisache (8 km NW), Acatenango (12 km NW), San Miguel Dueñas (10 km NE), Alotenango (8 km ENE), Antigua Guatemala (18 km NE), Chimaltenango (22 km N), and other areas NW and N of the volcano were impacted with ashfall. La Aurora airport in Guatemala City was closed for two days. In addition to the ash plume, a large plume of SO2 was recorded drifting N and E from the volcano at an altitude of 8 km shortly after the explosions were reported (figure 96).
The pyroclastic flows down the SE flank were especially devastating to the communities in their path, covering roofs and vehicles with ash and debris (figure 97-100) and killing scores of people. The communities of San Miguel Los Lotes about 9 km SE of the summit and El Rodeo (10 km SE), both in Escuintla Province, were severely damaged from the pyroclastic flows, with most of the fatalities and missing people reported from those communities.
Explosions continued until early evening on 3 June, when pyroclastic flow activity finally diminished. The debris from the pyroclastic flows resulted in lahars descending the Pantaleón, Mineral, and other drainages, leading to the evacuations of the communities of Sangre de Cristo, Finca Palo Verde, Panimache and others that evening. Explosive activity returned to lower levels the following day with dense ash plumes rising to 4.5-4.6 km altitude from 5-7 weak explosions that occurred every hour. Abundant fine ash rose from the ravines filled with pyroclastic flow material from the previous day and drifted SW, W, NW, and N, affecting communities up to 25 km away in those directions. The Washington VAAC reported remnants of the ash plume drifting 300 km ENE on 4 June.
By 4 June, CONRED had increased the Alert Level to red for the communities of Escuintla (22 km SE), Alotenango (8 km E), Sacatepéquez, Yepocapa (8 km NW), Santa Lucía Cotzumalguapa (22 km SW), and Chimaltenango, and opened 13 evacuation shelters in the area. CONRED initially reported on 5 June that 3,271 people were evacuated, 46 were injured and there were 70 known fatalities as a result of the pyroclastic flows and lahars on 3 June. A state of emergency was declared in all three of the provinces (Departments) of Escuintla, Sacatepéquez and Chimaltenango surrounding the volcano.
The number of block avalanches increased on 5 June as a result of 8-10 moderate explosions per hour; ash plumes and pyroclastic flow debris created persistent ash in the air around the volcano. The avalanches traveled 800-1,000 m down Las Lajas and Santa Teresa ravines. On 5 June, a pyroclastic flow descended the El Jute and Las Lajas ravines at 1410 local time. INSIVUMEH reported an increase in explosive activity a few hours later; dense ash plumes rose to 6 km altitude and drifted E and NE. Another pyroclastic flow descended the Las Lajas around 1928 local time that evening. These new pyroclastic flows led CONRAD to evacuate the additional communities of La Reyna, El Rodeo, Cañaveral I and IV, Hunnapu, Magnolia, and Sarita located on the Palín-Escuintla highway, and the highway itself was also closed (figure 102).
Activity during 6-30 June 2018. Weak to moderate explosions continued at Fuego on 6 June with ash plumes rising to 4.7 km altitude and drifting W and SW. Significant rainfall in the area that afternoon around 1610 resulted in lahars descending the Seca and Mineral ravines, tributaries of the Rio Pantaleón. One lahar was 30-40 m wide and 4-5 m deep emanating warm sulfurous gases; it carried fine-grained material similar to cement, rocks and debris 2-3 m in diameter, and tree trunks. The communities around the mouths of the ravines and near the Pantaleón Bridge were most affected. New lahars about an hour later descended the Santa Teresa, Mineral and Taniluyá ravines, also tributaries of the Pantaleón River. These lahars were about 30 m wide, 2-3 m deep, and carried similar cement-like fine grained material down the Pantaleón along with blocks 2-3 m in diameter and tree trunks.
Seismic station FG3 recorded a pyroclastic flow descending Las Lajas and El Jute ravines at 2140 local time on 7 June. INSIVUMEH estimated that it produced an ash cloud that rose to 6 km altitude and drifted W and SW. INSIVUMEH issued five special bulletins on 8 June reporting numerous lahars and pyroclastic flows. Lahars descended Santa Teresa, Mineral, and Taniluyá ravines into the Pantaleón around 0240 local time; they were 30 m wide, 2-3 m deep, and carried 2-3-m-diameter blocks and tree trunks. Another surge of lahars registered on the seismogram about two hours later in the same ravines and also in the Ceniza, additionally affecting the Achiguate River. A pyroclastic flow descended Las Lajas ravine at 0820 in the morning, producing another 6-km-high ash cloud. Two more similar pyroclastic flows in the same area were recorded at the seismic station at 1945 and 2040 local time that evening.
During the afternoon of 9 June, lahars descended the Seca, Mineral, Niagara and Taniluyá, generating the largest lahar to date for the year in the Pantaleón River. It was 40 m wide and 5 m deep carrying abundant blocks up to 3 m in diameter and other debris down the W flank. Later that evening explosive activity continued at a rate of 4-7 per hour, dispersing ash plumes up to 15 km W and SW from the summit at an altitude of 4.2-4.4 km. The explosions were audible up to 10 km in all directions. The same ravines and also the Ceniza were affected by new lahars 35 m wide and 3 m deep the following afternoon as a result of the constant rains in the area. Rains continued on 11 June and resulted in strong lahars descending the Seca and Mineral ravines around 1415 local time with diameters of 35-40 m and depths of 3 m. Another strong lahar descended Las Lajas and el Jute ravines in the evening at 1750 local time; these had widths ranging from 35-55 m and depths up to 5 m.
INSIVUMEH reported an increase in explosive activity beginning in the morning of 12 June 2018, producing ash plumes that rose up to 5 km altitude and drifted NE and N 15-25 km. This activity also produced a pyroclastic flow down the Seca ravine around 0730 local time with an ash cloud that rose about 6 km and drifted N and NE. That afternoon a strong lahar descended the Las Lajas ravine, carrying blocks 3 m in diameter in a hot, thick flow that was 35-45 m wide and up to 5 m deep. Since there were no longer distinct channels in the ravine, the material spread out in a wide fan flowing towards the area around El Rodeo. Additional smaller lahars descended the Ceniza and Mineral ravines later that afternoon. By 12 June 2018 CONRED reported that 110 fatalities had been confirmed, 197 additional people were missing, and over 12,500 people had been evacuated since the 3 June explosions began.
On 13 June, a small pyroclastic flow descended the Ceniza ravine around 0630. It was the last pyroclastic flow reported during June. Beginning with the first post-eruption lahars on 6 June, multiple lahars occurred every day during 8-18, 20-23, 26, and 30 June (table 18). The barrancas of Seca, Mineral, Santa Teresa, Taniluyá, Niagra, Ceniza, Las Lajas, El Jute, Rio El Gobernador, and Rio Pantaleón were all impacted by the lahars; they ranged in size from smaller flows that were 20 m wide and 2 m deep carrying blocks 1-3 m in diameter to the largest which were over 40 m wide, up to 5 m deep and carried blocks as large as 3 m in diameter. The flows were warm or hot, carrying tree trunks and other debris, and had strong sulfurous odors. Communities adjacent to the ravines could feel the vibrations of the flows as they passed. As many of the ravines were full of ash and rocks from the pyroclastic flows, new channels were formed and the flows spread out in fans as they descended, further threatening the communities around the flanks of the volcano.
Table 18. Lahars at Fuego were reported 33 separate times between 6 and 30 June 2018; many reports included multiple simultaneous lahars in drainages around all the flanks. Data courtesy of INSIVUMEH.
| Date |
Local time |
Ravine(s) |
Width (m) |
Depth (m) |
Block Size (m) |
| 06 Jun 2018 |
1610 |
Seca, Mineral |
30-40 |
4-5 |
2-3 |
| 06 Jun 2018 |
1720 |
Santa Teresa, Mineral and Taniluyá |
30 |
2-3 |
2-3 |
| 08 Jun 2018 |
0240 |
Santa Teresa, Mineral, and Taniluyá |
30 |
2-3 |
2-3 |
| 08 Jun 2018 |
0450 |
Santa Teresa, Mineral, and Taniluyá, Ceniza |
-- |
-- |
2-3 |
| 09 Jun 2018 |
1400 |
Seca, Mineral, Niagara and Taniluyá |
40 |
5 |
3 |
| 10 Jun 2018 |
1515 |
Seca, Mineral, Niagara and Taniluyá, Ceniza |
35 |
3 |
1 |
| 11 Jun 2018 |
1415 |
Seca and Mineral |
35-40 |
3 |
3 |
| 11 Jun 2018 |
1750 |
Las Lajas and el Jute |
35-55 |
3-5 |
3 |
| 12 Jun 2018 |
1330 |
Las Lajas |
35-45 |
5 |
3 |
| 12 Jun 2018 |
1425 |
Ceniza, Mineral |
20 |
2 |
1-3 |
| 13 Jun 2018 |
0110 |
Ceniza |
25 |
2 |
1-3 |
| 13 Jun 2018 |
1350 |
Las Lajas |
30-40 |
3 |
3 |
| 14 Jun 2018 |
0145 |
Santa Teresa and Mineral |
20-25 |
2 |
3 |
| 14 Jun 2018 |
1445 |
Taniluyá, Ceniza, rio El Gobernador, Las Lajas |
30-45 |
3 |
3 |
| 15 Jun 2018 |
1715 |
Seca, Mineral |
30-35 |
3 |
3 |
| 15 Jun 2018 |
1725 |
Las Lajas |
30-35 |
2 |
3 |
| 15 Jun 2018 |
1740 |
Taniluyá, Ceniza |
20-25 |
2 |
3 |
| 16 Jun 2018 |
1445 |
Las Lajas |
30-35 |
2 |
3 |
| 17 Jun 2018 |
1415 |
Las Lajas |
-- |
-- |
3 |
| 17 Jun 2018 |
1440 |
Seca, Mineral |
40 |
2 |
2 |
| 18 Jun 2018 |
1510 |
Seca, Mineral |
25-30 |
3 |
3 |
| 18 Jun 2018 |
1600 |
Las Lajas |
40-45 |
2 |
3 |
| 20 Jun 2018 |
0735 |
Las Lajas |
35-45 |
2-3 |
3 |
| 20 Jun 2018 |
1230 |
Las Lajas |
30-35 |
3 |
3 |
| 20 Jun 2018 |
1415 |
Seca, Mineral, Taniluyá, Ceniza |
30-35 |
3 |
3 |
| 21 Jun 2018 |
1940 |
Las Lajas |
30-35 |
3 |
3 |
| 22 Jun 2018 |
0030 |
Las Lajas |
-- |
-- |
3 |
| 22 Jun 2018 |
1450 |
Las Lajas |
-- |
-- |
2-3 |
| 22 Jun 2018 |
1535 |
Rio Pantaleón |
40 |
3 |
3 |
| 23 Jun 2018 |
1740 |
El Jute, Las Lajas, San Miguel los Lotes area |
-- |
-- |
3 |
| 26 Jun 2018 |
1412 |
El Jute, Las Lajas, San Miguel los Lotes area |
-- |
-- |
3 |
| 26 Jun 2018 |
1455 |
Seca, Mineral, Niagra, Ceniza |
-- |
-- |
2-3 |
| 30 Jun 2018 |
1435 |
Seca, Mineral |
-- |
-- |
2-3 |
Explosions continued daily through the end of June 2018 at rates ranging from 4 to 9 explosions per hour, creating block avalanches that descended all the major ravines. Ash plumes rose to 4.2-4.9 km altitude (500-1,000 m above the summit) and drifted in multiple directions. On 18 and 22 June, fine-grained ashfall was reported in Panimache, Morelia, Sangre de Cristo, and Palo Verde. By 24 June, satellite imagery revealed that elevated heat was still discernable in several ravines that had been filled with pyroclastic flow debris earlier in the month (figure 103). Explosions on 27 and 28 June sent ash plumes W and ashfall was reported in Sangre de Cristo, Yepocapa, and communities a few km W of Fuego.
Geologic Background. Volcán Fuego, one of Central America's most active volcanoes, is also one of three large stratovolcanoes overlooking Guatemala's former capital, Antigua. The scarp of an older edifice, Meseta, lies between Fuego and Acatenango to the north. Construction of Meseta dates back to about 230,000 years and continued until the late Pleistocene or early Holocene. Collapse of Meseta may have produced the massive Escuintla debris-avalanche deposit, which extends about 50 km onto the Pacific coastal plain. Growth of the modern Fuego volcano followed, continuing the southward migration of volcanism that began at the mostly andesitic Acatenango. Eruptions at Fuego have become more mafic with time, and most historical activity has produced basaltic rocks. Frequent vigorous historical eruptions have been recorded since the onset of the Spanish era in 1524, and have produced major ashfalls, along with occasional pyroclastic flows and lava flows.
Information Contacts: Instituto Nacional de Sismologia, Vulcanologia, Meteorologia e Hydrologia (INSIVUMEH), Unit of Volcanology, Geologic Department of Investigation and Services, 7a Av. 14-57, Zona 13, Guatemala City, Guatemala (URL: http://www.insivumeh.gob.gt/); Coordinadora Nacional para la Reducción de Desastres (CONRED), Av. Hincapié 21-72, Zona 13, Guatemala City, Guatemala (URL: http://conred.gob.gt/www/index.php); Hawai'i Institute of Geophysics and Planetology (HIGP) - MODVOLC Thermal Alerts System, School of Ocean and Earth Science and Technology (SOEST), Univ. of Hawai'i, 2525 Correa Road, Honolulu, HI 96822, USA (URL: http://modis.higp.hawaii.edu/); MIROVA (Middle InfraRed Observation of Volcanic Activity), a collaborative project between the Universities of Turin and Florence (Italy) supported by the Centre for Volcanic Risk of the Italian Civil Protection Department (URL: http://www.mirovaweb.it/); NASA Earth Observatory, EOS Project Science Office, NASA Goddard Space Flight Center, Goddard, Maryland, USA (URL: http://earthobservatory.nasa.gov/); NASA Goddard Space Flight Center (NASA/GSFC), Global Sulfur Dioxide Monitoring Page, Atmospheric Chemistry and Dynamics Laboratory, 8800 Greenbelt Road, Goddard, Maryland, USA (URL: https://so2.gsfc.nasa.gov/); Washington Volcanic Ash Advisory Center (VAAC), Satellite Analysis Branch (SAB), NOAA/NESDIS OSPO, NOAA Science Center Room 401, 5200 Auth Rd, Camp Springs, MD 20746, USA (URL: www.ospo.noaa.gov/Products/atmosphere/vaac, archive at: http://www.ssd.noaa.gov/VAAC/archive.html); Associated Press (URL: https://apnews.com/); AFP/Getty, Agence France-Presse (URL: http://www.afp.com/); BBC News (URL: https://www.bbc.com/); The Telegraph (URL: https://www.telegraph.co.uk/); Reuters (http://www.reuters.com/); The Express (URL: https://www.express.co.uk); Matthew Watson, School of Earth Sciences at the University of Bristol, Twitter: @Matthew__Watson), (URL: https://twitter.com/Matthew__Watson); GeoGis, Twitter: @jlescriba, (URL: https://twitter.com/jlescriba).
Karymsky
Russia
54.049°N, 159.443°E; summit elev. 1513 m
All times are local (unless otherwise noted)
Renewed eruptive activity with ash plumes during April through July 2018
Recent eruptive activity at Karymsky has consisted of moderate intermittent ash explosions during 5-8 October 2016 (BGVN 42:08) and 4 June 2017-27 January 2018 (BGVN 42:11, 43:04). Another eruptive period began on 28 April 2018, with thermal anomalies, gas-and-steam emissions, and ash plumes observed through July 2018. The Aviation Color Code (ACC) was raised from Yellow to Orange at the end of April when moderate explosive activity began. This report was compiled using information from the Kamchatka Volcanic Eruptions Response Team (KVERT).
Moderate explosive activity renewed in April 2018. An ash plume rose to 5.5 km and drifted 150 km on 28 April and 2-3 May to the NE and SE, respectively. On 14 May the ash plume drifted 150 km to the SW. The ACC was lowered to Yellow on 15 June. Weak gas, steam, and some ash plumes were again reported in 10 July. The Tokyo VAAC noted continuous ash seen in Himawari-8 satellite imagery on 12 July, with a plume extending E at 3.6 km altitude. Another ash advisory the VAAC noted an eruption seen at 2120 on 14 July (figure 38) that sent a plume to 7.6 km altitude and drifted S. Continuous ash observations were again cause for a VAAC notice on 16 July. An explosion on 17 July generated an ash plume that rose to 5 km and drifted 11 km WSW, which prompted raising the ACC back to Orange. Satellite images show an ash plume drifting 100 km to the SE on 20 July (figure 39). The ACC remained at alert level Orange.
Thermal anomalies were observed in satellite data and reported by KVERT on 11 April, 3, 13-15, 19-20 May, 8, 10-13-20, 25, 27-29, and 31 July 2018. The MODVOLC system reported six thermal anomalies during this period. The MODIS thermal anomalies detected by MIROVA during this reporting period were all low in intensity, with notable periods of increased activity in the first half of May and July 2018 (figure 40).
Geologic Background. Karymsky, the most active volcano of Kamchatka's eastern volcanic zone, is a symmetrical stratovolcano constructed within a 5-km-wide caldera that formed during the early Holocene. The caldera cuts the south side of the Pleistocene Dvor volcano and is located outside the north margin of the large mid-Pleistocene Polovinka caldera, which contains the smaller Akademia Nauk and Odnoboky calderas. Most seismicity preceding Karymsky eruptions originated beneath Akademia Nauk caldera, located immediately south. The caldera enclosing Karymsky formed about 7600-7700 radiocarbon years ago; construction of the stratovolcano began about 2000 years later. The latest eruptive period began about 500 years ago, following a 2300-year quiescence. Much of the cone is mantled by lava flows less than 200 years old. Historical eruptions have been vulcanian or vulcanian-strombolian with moderate explosive activity and occasional lava flows from the summit crater.
Information Contacts: Kamchatka Volcanic Eruptions Response Team (KVERT), Far Eastern Branch, Russian Academy of Sciences, 9 Piip Blvd., Petropavlovsk-Kamchatsky, 683006, Russia (URL: http://www.kscnet.ru/ivs/kvert/); Institute of Volcanology and Seismology, Far Eastern Branch, Russian Academy of Sciences (IVS FEB RAS), 9 Piip Blvd., Petropavlovsk-Kamchatsky 683006, Russia (URL: http://www.kscnet.ru/ivs/eng/); MIROVA (Middle InfraRed Observation of Volcanic Activity), a collaborative project between the Universities of Turin and Florence (Italy) supported by the Centre for Volcanic Risk of the Italian Civil Protection Department (URL: http://www.mirovaweb.it/); Hawai'i Institute of Geophysics and Planetology (HIGP) - MODVOLC Thermal Alerts System, School of Ocean and Earth Science and Technology (SOEST), Univ. of Hawai'i, 2525 Correa Road, Honolulu, HI 96822, USA (URL: http://modis.higp.hawaii.edu/).
Klyuchevskoy (Russia) — August 2018 Cite this Report
Klyuchevskoy
Russia
56.056°N, 160.642°E; summit elev. 4754 m
All times are local (unless otherwise noted)
Intermittent moderate gas, steam, and ash emissions; no ash seen after 15 June 2018
The current eruptive period at Klyuchevskoy began in late August 2015 (BGVN 39:10). Lava effusion ended in early November 2016 (BGVN 42:04), but explosive activity continued to be observed through February 2018 (BGVN 43:05). From mid-February through mid-August 2018 moderate to weak gas and steam plumes were observed (figure 29), but no ash plumes were reported after 15 June 2018 (figure 29). The Kamchatkan Volcanic Eruption Response Team (KVERT) is responsible for monitoring, and is the primary source of information. The Aviation Color Code was lowered from Orange to Yellow during this reporting period.
The Aviation Color Code (ACC) was lowered to Yellow by KVERT on 9 February. On 18 February an ash plume that rose to 5.2 km in altitude was reported by the Tokyo Volcanic Ash Advisory Center (VAAC). Moderate gas and steam activity was reported on 25 and 29 April, and 2 May 2018. During 7-8 and 10 May KVERT reported that gas, steam, and ash plumes rose to 5.0-5.5 km altitude and extended to 340 km SE; subsequently the ACC was raised back to Orange. Explosions were reported on 14 May with accompanying ash plumes that rose to 10.5 km in altitude. The ash clouds lingered around Klyuchevskoy and surrounding volcanoes for about eight hours before gradually dissipating. Nighttime summit incandescence and a hot avalanche was observed. A diffuse ash plume was reported by KVERT on 6 June that extended 12 km to the W. Another ash plume was visible on 15 June, but decreasing activity resulted in the ACC being lowered to Yellow again on 29 June. Only moderate gas and steam activity was noted through mid-August.
A thermal anomaly was reported over Klyuchevskoy approximately 16 times during this reporting period in February, April, May, June, and August 2018. The number of MIROVA thermal anomalies detected increased in the first half of January 2018, with decreasing and intermittent low-intensity detections in subsequent months (figure 30).
Geologic Background. Klyuchevskoy (also spelled Kliuchevskoi) is Kamchatka's highest and most active volcano. Since its origin about 6000 years ago, the beautifully symmetrical, 4835-m-high basaltic stratovolcano has produced frequent moderate-volume explosive and effusive eruptions without major periods of inactivity. It rises above a saddle NE of sharp-peaked Kamen volcano and lies SE of the broad Ushkovsky massif. More than 100 flank eruptions have occurred during the past roughly 3000 years, with most lateral craters and cones occurring along radial fissures between the unconfined NE-to-SE flanks of the conical volcano between 500 m and 3600 m elevation. The morphology of the 700-m-wide summit crater has been frequently modified by historical eruptions, which have been recorded since the late-17th century. Historical eruptions have originated primarily from the summit crater, but have also included numerous major explosive and effusive eruptions from flank craters.
Information Contacts: Kamchatka Volcanic Eruptions Response Team (KVERT), Far Eastern Branch, Russian Academy of Sciences, 9 Piip Blvd., Petropavlovsk-Kamchatsky, 683006, Russia (URL: http://www.kscnet.ru/ivs/kvert/); MIROVA (Middle InfraRed Observation of Volcanic Activity), a collaborative project between the Universities of Turin and Florence (Italy) supported by the Centre for Volcanic Risk of the Italian Civil Protection Department (URL: http://www.mirovaweb.it/); Tokyo Volcanic Ash Advisory Center (VAAC), 1-3-4 Otemachi, Chiyoda-ku, Tokyo, Japan (URL: http://ds.data.jma.go.jp/svd/vaac/data/).
Stromboli
Italy
38.789°N, 15.213°E; summit elev. 924 m
All times are local (unless otherwise noted)
Continued Strombolian activity from five active summit vents through March-June 2018
Stromboli is a persistently active volcano in the Aeolian Islands, Italy, with confirmed historical eruptions going back over about 2,000 years. The active summit craters on the crater terrace are situated above the Sciara del Fuoco, a steep talus slope on the NW side of the island that leads to the Tyrrhenian Sea below. The NE crater (Area N) includes the active N1 and N2 vents, while the Central and SW craters (Area CS) contains the C, S1, and S2 vents (figures 125 and 126).
Typical activity comprises degassing and multiple explosions per hour that range from tens of seconds to a few minutes, known as Strombolian activity, which is named after this particular volcano (figure 127). The activity usually consists of low-intensity explosions that eject material (ash, lapilli, and blocks) up to 80 m above the crater and medium-low intensity explosions that eject material up to 120 m above the crater. This report describes the activity at Stromboli through March to June 2018 and summarizes reports published by the Istituto Nazionale di Geofisica e Vulcanologia (INGV).
Characteristic Strombolian activity occurred throughout March, typically consisting of 5-11 events per hour that ejected material up to 120 m above the craters. High-energy explosive events occurred on 7 and 18 March, both lasting around 40 seconds and ejecting material to a height of 400 m (figures 128 and 129).
Typical Strombolian activity continued through April with 6-12 explosive events per hour, with two high-energy explosive events on 24 and 26 April that lasted nine and three minutes, respectively. Both events ejected material across the Sciara del Fuoco, producing ash plumes and lava fountaining (figure 130). Low to medium-low intensity activity continued through May and June, with explosions per hour in the range of 3-15 and 6-13, respectively.
Geologic Background. Spectacular incandescent nighttime explosions at Stromboli have long attracted visitors to the "Lighthouse of the Mediterranean" in the NE Aeolian Islands. This volcano has lent its name to the frequent mild explosive activity that has characterized its eruptions throughout much of historical time. The small island is the emergent summit of a volcano that grew in two main eruptive cycles, the last of which formed the western portion of the island. The Neostromboli eruptive period took place between about 13,000 and 5,000 years ago. The active summit vents are located at the head of the Sciara del Fuoco, a prominent scarp that formed about 5,000 years ago due to a series of slope failures which extends to below sea level. The modern volcano has been constructed within this scarp, which funnels pyroclastic ejecta and lava flows to the NW. Essentially continuous mild Strombolian explosions, sometimes accompanied by lava flows, have been recorded for more than a millennium.
Information Contacts: Istituto Nazionale di Geofisica e Vulcanologia (INGV), Sezione di Catania, Piazza Roma 2, 95123 Catania, Italy (URL: http://www.ct.ingv.it/en/); Blog INGVvulcani, Istituto Nazionale di Geofisica e Vulcanologia (INGV) (URL: https://ingvvulcani.wordpress.com/2018/07/16/stromboli-e-le-sue-esplosioni/); Sentinel Hub Playground (URL: https://www.sentinel-hub.com/explore/sentinel-playground).
Suwanosejima (Japan) — August 2018 Cite this Report
Suwanosejima
Japan
29.638°N, 129.714°E; summit elev. 796 m
All times are local (unless otherwise noted)
Intermittent ash emission continues from January through June 2018
Suwanosejima volcano is located in the northern Ryukyu Islands in the south of Japan and has been on Alert Level 2 since December 2007. This report is a summary of activity for the period January to June 2018 and is based on information from the Japan Meteorological Agency (JMA) along with Tokyo VAAC notices.
During the reporting period, the active Otake crater produced intermittent explosions that scattered ejecta around the crater and ash plumes to an altitude of 1.5-3 km. Ashfall was reported in a village 4 km away on 10 days during January-May 2018 (table 14). Incandescence was visible at night using monitoring equipment. Ash plumes were noted by the Tokyo Volcanic Ash Advisory Center (VAAC) throughout the reporting period (figure 32, table 15).
Table 14. Reported explosion information for Suwanosejima recorded in JMA monthly reports.
| Month |
No. of explosions |
Max plume height (m above crater) |
Dates of ashfall in village 4 km SSW |
No. of seismic events |
Other daily activity detail |
| Jan 2018 |
0 |
1,100 |
27, 31 |
97 |
Incandescence at night. |
| Feb 2018 |
1 |
1,100 |
2, 3 |
100 |
Incandescence at night. |
| Mar 2018 |
9 |
2,200 |
25, 29 |
251 |
Incandescence at night. Ejecta scattered around the crater. |
| Apr 2018 |
8 |
2,000 |
18, 28, 29 |
62 |
Incandescence at night. |
| May 2018 |
2 |
1,100 |
14 |
90 |
Incandescence at night. Ejecta scattered around the crater. |
| Jun 2018 |
-- |
900 |
-- |
275 |
Incandescence at night. |
Table 15. Number of Volcanic Ash Advisories, explosion dates, and plume heights for activity at Suwanosejima. The numbers in parentheses indicate the number of events on that date; the VAACs issued column does not include advisories that note a continued episode. Drift directions were highly variable. Data courtesy of Tokyo VAAC.
| Month |
VAAs issued |
VAA dates |
Plume heights |
| Jan 2018 |
1 |
15 |
1.8 km |
| Feb 2018 |
1 |
2 |
1.2 km |
| Mar 2018 |
22 |
17, 22(3), 23, 25(2), 26(5), 27(5), 28(3), 29(2) |
1.2-3.6 km |
| Apr 2018 |
16 |
1, 2, 3, 4(4), 5(2), 8, 11, 24, 27, 28(2) |
1.2-2.4 km |
| May 2018 |
3 |
1, 4, 15 |
1-1.8 km |
| Jun 2018 |
1 |
1 |
-- |
Geologic Background. The 8-km-long island of Suwanosejima in the northern Ryukyu Islands consists of an andesitic stratovolcano with two active summit craters. The summit is truncated by a large breached crater extending to the sea on the E flank that was formed by edifice collapse. One of Japan's most frequently active volcanoes, it was in a state of intermittent Strombolian activity from Otake, the NE summit crater, between 1949 and 1996, after which periods of inactivity lengthened. The largest recorded eruption took place in 1813-14, when thick scoria deposits covered residential areas, and the SW crater produced two lava flows that reached the western coast. At the end of the eruption the summit of Otake collapsed, forming a large debris avalanche and creating an open collapse scarp extending to the eastern coast. The island remained uninhabited for about 70 years after the 1813-1814 eruption. Lava flows reached the eastern coast of the island in 1884. Only about 50 people live on the island.
Information Contacts: Japan Meteorological Agency (JMA), Otemachi, 1-3-4, Chiyoda-ku Tokyo 100-8122, Japan (URL: http://www.jma.go.jp/jma/indexe.html); Tokyo Volcanic Ash Advisory Center (VAAC), 1-3-4 Otemachi, Chiyoda-ku, Tokyo, Japan (URL: http://ds.data.jma.go.jp/svd/vaac/data/).
Yasur
Vanuatu
19.532°S, 169.447°E; summit elev. 361 m
All times are local (unless otherwise noted)
Centuries-long eruption continues during February-July 2018
The persistent centuries-long eruption at Yasur continued between February and July 2018. According to the Vanuatu Meteorology and Geo-Hazards Department (VMGD), activity consists of ongoing explosions, some of which are strong. The activity is confined to the crater.
Based on visual observations and satellite data, VMGD reported on 19 March 2018 that explosions remained strong. Using information from webcam images, satellite data, model data, and local visual observations, the Wellington Volcanic Ash Advisory Centre (VAAC) reported that during 5-6 June, 14-15 June, 17-18 June, and 20-21 June, intermittent, low-level ash plumes rose to altitudes of 0.9-1.5 km and drifted in various directions. During the 5-6 June episode, ash was not identified on satellite imagery.
Satellite imagery during clear weather on 25 June showed two distinct heat sources in the crater and a diffuse gas plume blowing NW (figure 49). VMGD reported some stronger explosions during 27-28 June. Based on webcam images the Wellington VAAC reported that on 29 June intermittent, low-level ash plumes rose to an altitude of 1.8 km and drifted NW.
The Alert Level remained at 2 (on a scale of 0-4) throughout the reporting period. VMGD reminded residents and tourists that hazardous areas were near and around the volcanic crater, within a 395-m-radius permanent exclusion zone (shown in figure 48 of BGVN 43:02), and that volcanic ash and gas could reach areas impacted by trade winds.
During the reporting period, MODIS satellite instruments using the MODVOLC algorithm recorded thermal anomalies between 4 and 16 days per month, many of which had multiple pixels. May 2018 had the greatest number of days with hotspots (16), while the lowest number was recorded during April (4). The MIROVA (Middle InfraRed Observation of Volcanic Activity) volcano hotspot detection system, also based on analysis of MODIS data, recorded numerous hotspots every month during the reporting period. Almost all recorded MIROVA anomalies were within 3 km of the volcano and of low or moderate radiative power.
Geologic Background. Yasur has exhibited essentially continuous Strombolian and Vulcanian activity at least since Captain Cook observed ash eruptions in 1774. This style of activity may have continued for the past 800 years. Located at the SE tip of Tanna Island in Vanuatu, this pyroclastic cone has a nearly circular, 400-m-wide summit crater. The active cone is largely contained within the small Yenkahe caldera, and is the youngest of a group of Holocene volcanic centers constructed over the down-dropped NE flank of the Pleistocene Tukosmeru volcano. The Yenkahe horst is located within the Siwi ring fracture, a 4-km-wide open feature associated with eruption of the andesitic Siwi pyroclastic sequence. Active tectonism along the Yenkahe horst accompanying eruptions has raised Port Resolution harbor more than 20 m during the past century.
Information Contacts: Geo-Hazards Division, Vanuatu Meteorology and Geo-Hazards Department, Ministry of Climate Change Adaptation, Meteorology, Geo-Hazards, Energy, Environment and Disaster Management, Private Mail Bag 9054, Lini Highway, Port Vila, Vanuatu (URL: http://www.vmgd.gov.vu/, https://www.facebook.com/VanuatuGeohazardsObservatory); Wellington Volcanic Ash Advisory Centre (VAAC), Meteorological Service of New Zealand Ltd (MetService), PO Box 722, Wellington, New Zealand (URL: http://www.metservice.com/vaac, http://www.ssd.noaa.gov/VAAC/OTH/NZ/messages.html); Hawai'i Institute of Geophysics and Planetology (HIGP) - MODVOLC Thermal Alerts System, School of Ocean and Earth Science and Technology (SOEST), Univ. of Hawai'i, 2525 Correa Road, Honolulu, HI 96822, USA (URL: http://modis.higp.hawaii.edu/); MIROVA (Middle InfraRed Observation of Volcanic Activity), a collaborative project between the Universities of Turin and Florence (Italy) supported by the Centre for Volcanic Risk of the Italian Civil Protection Department (URL: http://www.mirovaweb.it/); Sentinel Hub Playground (URL: https://www.sentinel-hub.com/explore/sentinel-playground).