Recently Published Bulletin Reports
Erebus (Antarctica) Lava lake remains active; most thermal alerts recorded since 2019
Rincon de la Vieja (Costa Rica) Frequent phreatic explosions during July-December 2023
Bezymianny (Russia) Explosion on 18 October 2023 sends ash plume 8 km high; lava flows and incandescent avalanches
Kilauea (United States) Low-level lava effusions in the lava lake at Halema’uma’u during July-December 2022
Nyamulagira (DR Congo) Lava flows and thermal activity during May-October 2023
Bagana (Papua New Guinea) Explosions, ash plumes, ashfall, and lava flows during April-September 2023
Mayon (Philippines) Lava flows, pyroclastic flows, ash emissions, and seismicity during April-September 2023
Nishinoshima (Japan) Eruption plumes and gas-and-steam plumes during May-August 2023
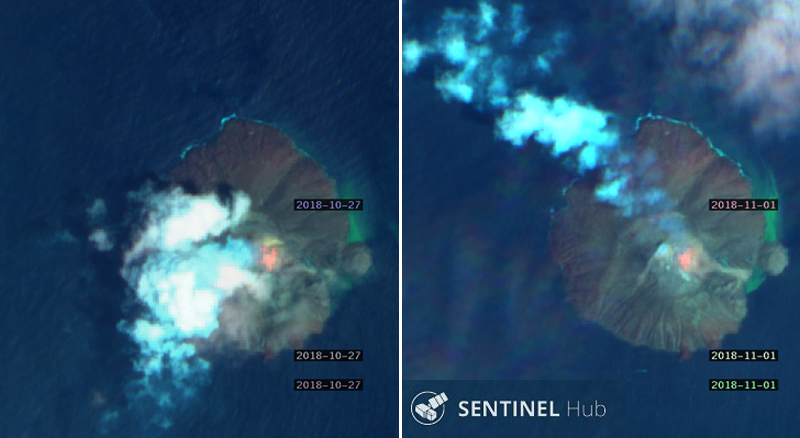
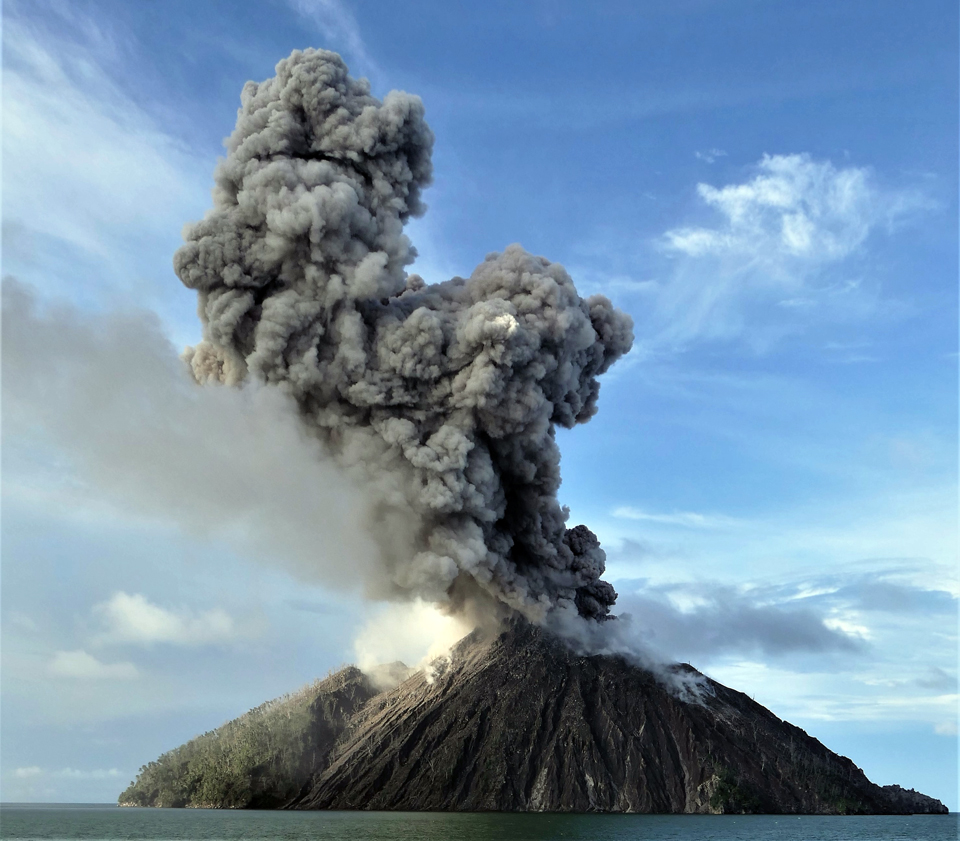
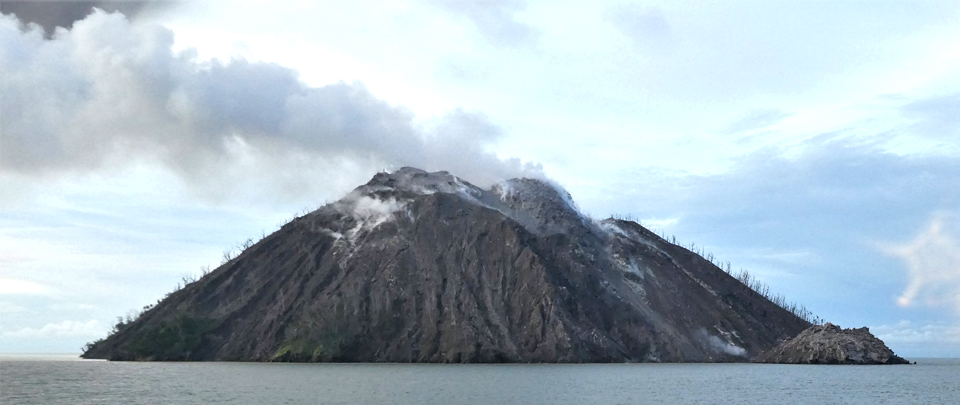
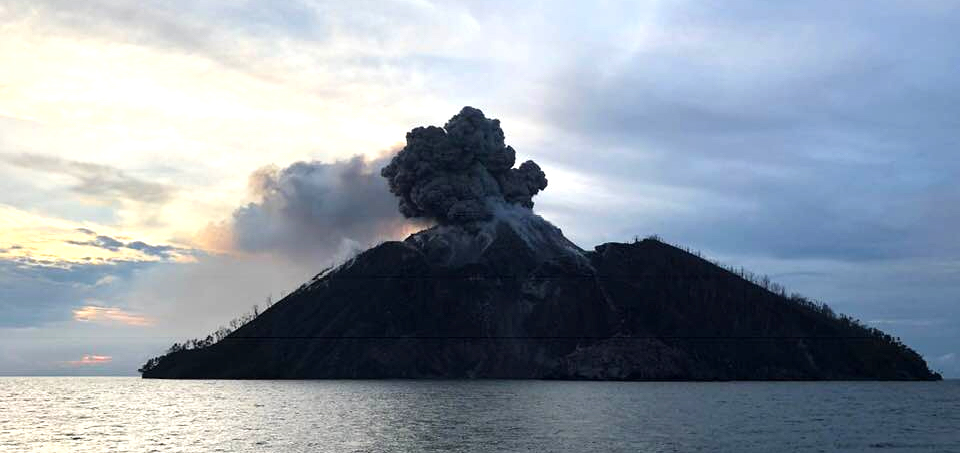
Krakatau (Indonesia) White gas-and-steam plumes and occasional ash plumes during May-August 2023
Villarrica (Chile) Strombolian activity, gas-and-ash emissions, and crater incandescence during April-September 2023
Merapi (Indonesia) Frequent incandescent avalanches during April-September 2023
Ebeko (Russia) Moderate explosive activity with ash plumes continued during June-November 2023
Erebus (Antarctica) — January 2024  Cite this Report
Erebus
Antarctica
77.53°S, 167.17°E; summit elev. 3794 m
All times are local (unless otherwise noted)
Lava lake remains active; most thermal alerts recorded since 2019
The lava lake in the summit crater of Erebus has been active since at least 1972. Located in Antarctica overlooking the McMurdo Station on Ross Island, it is the southernmost active volcano on the planet. Because of the remote location, activity is primarily monitored by satellites. This report covers activity during 2023.
The number of thermal alerts recorded by the Hawai'i Institute of Geophysics and Planetology’s MODVOLC Thermal Alerts System increased considerably in 2023 compared to the years 2020-2022 (table 9). In contrast to previous years, the MODIS instruments aboard the Aqua and Terra satellites captured data from Erebus every month during 2023. Consistent with previous years, the lowest number of anomalous pixels were recorded in January, November, and December.
Table 9. Number of monthly MODIS-MODVOLC thermal alert pixels recorded at Erebus during 2017-2023. See BGVN 42:06 for data from 2000 through 2016. The table was compiled using data provided by the HIGP – MODVOLC Thermal Alerts System.
| Year |
Jan |
Feb |
Mar |
Apr |
May |
Jun |
Jul |
Aug |
Sep |
Oct |
Nov |
Dec |
SUM |
| 2017 |
0 |
21 |
9 |
0 |
0 |
1 |
11 |
61 |
76 |
52 |
0 |
3 |
234 |
| 2018 |
0 |
21 |
58 |
182 |
55 |
17 |
137 |
172 |
103 |
29 |
0 |
0 |
774 |
| 2019 |
2 |
21 |
162 |
151 |
55 |
56 |
75 |
53 |
29 |
19 |
1 |
0 |
624 |
| 2020 |
0 |
2 |
16 |
18 |
4 |
4 |
1 |
3 |
18 |
3 |
1 |
6 |
76 |
| 2021 |
0 |
9 |
1 |
0 |
2 |
56 |
46 |
47 |
35 |
52 |
5 |
3 |
256 |
| 2022 |
1 |
13 |
55 |
22 |
15 |
32 |
39 |
19 |
31 |
11 |
0 |
0 |
238 |
| 2023 |
2 |
33 |
49 |
82 |
41 |
32 |
70 |
64 |
42 |
17 |
5 |
11 |
448 |
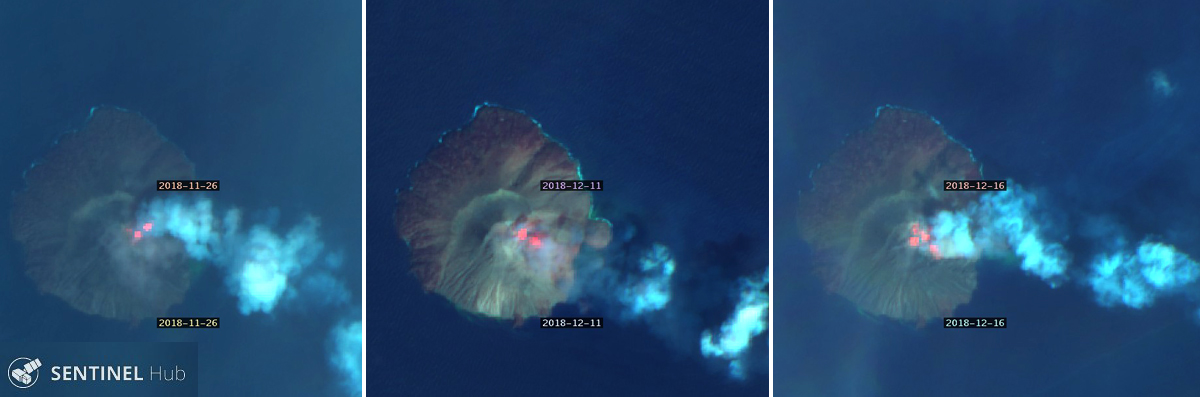
Sentinel-2 infrared images showed one or two prominent heat sources within the summit crater, accompanied by adjacent smaller sources, similar to recent years (see BGVN 46:01, 47:02, and 48:01). A unique image was obtained on 25 November 2023 by the OLI-2 (Operational Land Imager-2) on Landsat 9, showing the upper part of the volcano surrounded by clouds (figure 32).
Geologic Background. Mount Erebus, the world's southernmost historically active volcano, overlooks the McMurdo research station on Ross Island. It is the largest of three major volcanoes forming the crudely triangular Ross Island. The summit of the dominantly phonolitic volcano has been modified by one or two generations of caldera formation. A summit plateau at about 3,200 m elevation marks the rim of the youngest caldera, which formed during the late-Pleistocene and within which the modern cone was constructed. An elliptical 500 x 600 m wide, 110-m-deep crater truncates the summit and contains an active lava lake within a 250-m-wide, 100-m-deep inner crater; other lava lakes are sometimes present. The glacier-covered volcano was erupting when first sighted by Captain James Ross in 1841. Continuous lava-lake activity with minor explosions, punctuated by occasional larger Strombolian explosions that eject bombs onto the crater rim, has been documented since 1972, but has probably been occurring for much of the volcano's recent history.
Information Contacts: Hawai'i Institute of Geophysics and Planetology (HIGP) - MODVOLC Thermal Alerts System, School of Ocean and Earth Science and Technology (SOEST), Univ. of Hawai'i, 2525 Correa Road, Honolulu, HI 96822, USA (URL: http://modis.higp.hawaii.edu/); Copernicus Browser, Copernicus Data Space Ecosystem, European Space Agency (URL: https://dataspace.copernicus.eu/browser/); NASA Earth Observatory, EOS Project Science Office, NASA Goddard Space Flight Center, Goddard, Maryland, USA (URL: https://earthobservatory.nasa.gov/images/152134/erebus-breaks-through).
Rincon de la Vieja (Costa Rica) — January 2024 Cite this Report
Rincon de la Vieja
Costa Rica
10.83°N, 85.324°W; summit elev. 1916 m
All times are local (unless otherwise noted)
Frequent phreatic explosions during July-December 2023
Rincón de la Vieja is a volcanic complex in Costa Rica with a hot convecting acid lake that exhibits frequent weak phreatic explosions, gas-and-steam emissions, and occasional elevated sulfur dioxide levels (BGVN 45:10, 46:03, 46:11). The current eruption period began June 2021. This report covers activity during July-December 2023 and is based on weekly bulletins and occasional daily reports from the Observatorio Vulcanologico Sismologica de Costa Rica-Universidad Nacional (OVSICORI-UNA).
Numerous weak phreatic explosions continued during July-December 2023, along with gas-and-steam emissions and plumes that rose as high as 3 km above the crater rim. Many weekly OVSICORI-UNA bulletins included the previous week's number of explosions and emissions (table 9). For many explosions, the time of explosion was given (table 10). Frequent seismic activity (long-period earthquakes, volcano-tectonic earthquakes, and tremor) accompanied the phreatic activity.
Table 9. Number of reported weekly phreatic explosions and gas-and-steam emissions at Rincón de la Vieja, July-December 2023. Counts are reported for the week before the Weekly Bulletin date; not all reports included these data. Courtesy of OVSICORI-UNA.
| OVSICORI Weekly Bulletin |
Number of explosions |
Number of emissions |
| 28 Jul 2023 |
6 |
14 |
| 4 Aug 2023 |
10 |
12 |
| 1 Sep 2023 |
13 |
11 |
| 22 Sep 2023 |
12 |
13 |
| 29 Sep 2023 |
6 |
11 |
| 6 Oct 2023 |
12 |
5 |
| 13 Oct 2023 |
7 |
9 |
| 20 Oct 2023 |
1 |
15 |
| 27 Oct 2023 |
3 |
23 |
| 3 Nov 2023 |
3 |
10 |
| 17 Nov 2023 |
0 |
Some |
| 24 Nov 2023 |
0 |
14 |
| 8 Dec 2023 |
4 |
16 |
| 22 Dec 2023 |
8 |
18 |
Table 10. Summary of activity at Rincón de la Vieja during July-December 2023. Weak phreatic explosions and gas emissions are noted where the time of explosion was indicated in the weekly or daily bulletins. Height of plumes or emissions are distance above the crater rim. Courtesy of OVSICORI-UNA.
| Date |
Time |
Description of Activity |
| 1 Jul 2023 |
0156 |
Explosion. |
| 2 Jul 2023 |
0305 |
Explosion. |
| 4 Jul 2023 |
0229, 0635 |
Event at 0635 produced a gas-and-steam plume that rose 700 m and drifted W; seen by residents in Liberia (21 km SW). |
| 9 Jul 2023 |
1843 |
Explosion. |
| 21 Jul 2023 |
0705 |
Explosion. |
| 26 Jul 2023 |
1807 |
Explosion. |
| 28 Jul 2023 |
0802 |
Explosion generated a gas-and-steam plume that rose 500 m. |
| 30 Jul 2023 |
1250 |
Explosion. |
| 31 Jul 2023 |
2136 |
Explosion. |
| 11 Aug 2023 |
0828 |
Explosion. |
| 18 Aug 2023 |
1304 |
Explosion. |
| 21 Aug 2023 |
1224 |
Explosion generated gas-and-steam plumes rose 500-600 m. |
| 22 Aug 2023 |
0749 |
Explosion generated gas-and-steam plumes rose 500-600 m. |
| 24 Aug 2023 |
1900 |
Explosion. |
| 25 Aug 2023 |
0828 |
Event produced a steam-and-gas plume that rose 3 km and drifted NW. |
| 27-28 Aug 2023 |
0813 |
Four small events; the event at 0813 on 28 August lasted two minutes and generated a steam-and-gas plume that rose 2.5 km. |
| 1 Sep 2023 |
1526 |
Explosion generated plume that rose 2 km and ejected material onto the flanks. |
| 2-3 Sep 2023 |
- |
Small explosions detected in infrasound data. |
| 4 Sep 2023 |
1251 |
Gas-and-steam plume rose 1 km and drifted W. |
| 7 Nov 2023 |
1113 |
Explosion. |
| 8 Nov 2023 |
0722 |
Explosion. |
| 12 Nov 2023 |
0136 |
Small gas emissions. |
| 14 Nov 2023 |
0415 |
Small gas emissions. |
According to OVSICORI-UNA, during July-October the average weekly sulfur dioxide (SO2) flux ranged from 68 to 240 tonnes/day. However, in mid-November the flux increased to as high as 334 tonnes/day, the highest value measured in recent years. The high SO2 flux in mid-November was also detected by the TROPOMI instrument on the Sentinel-5P satellite (figure 43).
Geologic Background. Rincón de la Vieja, the largest volcano in NW Costa Rica, is a remote volcanic complex in the Guanacaste Range. The volcano consists of an elongated, arcuate NW-SE-trending ridge constructed within the 15-km-wide early Pleistocene Guachipelín caldera, whose rim is exposed on the south side. Sometimes known as the "Colossus of Guanacaste," it has an estimated volume of 130 km3 and contains at least nine major eruptive centers. Activity has migrated to the SE, where the youngest-looking craters are located. The twin cone of Santa María volcano, the highest peak of the complex, is located at the eastern end of a smaller, 5-km-wide caldera and has a 500-m-wide crater. A Plinian eruption producing the 0.25 km3 Río Blanca tephra about 3,500 years ago was the last major magmatic eruption. All subsequent eruptions, including numerous historical eruptions possibly dating back to the 16th century, have been from the prominent active crater containing a 500-m-wide acid lake located ENE of Von Seebach crater.
Information Contacts: Observatorio Vulcanológico Sismológica de Costa Rica-Universidad Nacional (OVSICORI-UNA), Apartado 86-3000, Heredia, Costa Rica (URL: http://www.ovsicori.una.ac.cr/); NASA Global Sulfur Dioxide Monitoring Page, Atmospheric Chemistry and Dynamics Laboratory, NASA Goddard Space Flight Center (NASA/GSFC), 8800 Greenbelt Road, Goddard MD 20771, USA (URL: https://so2.gsfc.nasa.gov/).
Bezymianny (Russia) — November 2023 Cite this Report
Bezymianny
Russia
55.972°N, 160.595°E; summit elev. 2882 m
All times are local (unless otherwise noted)
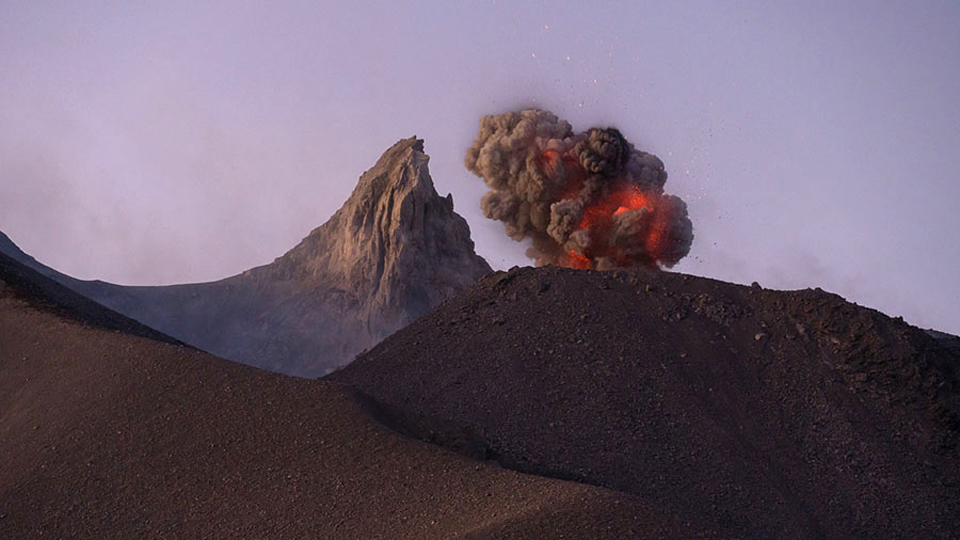
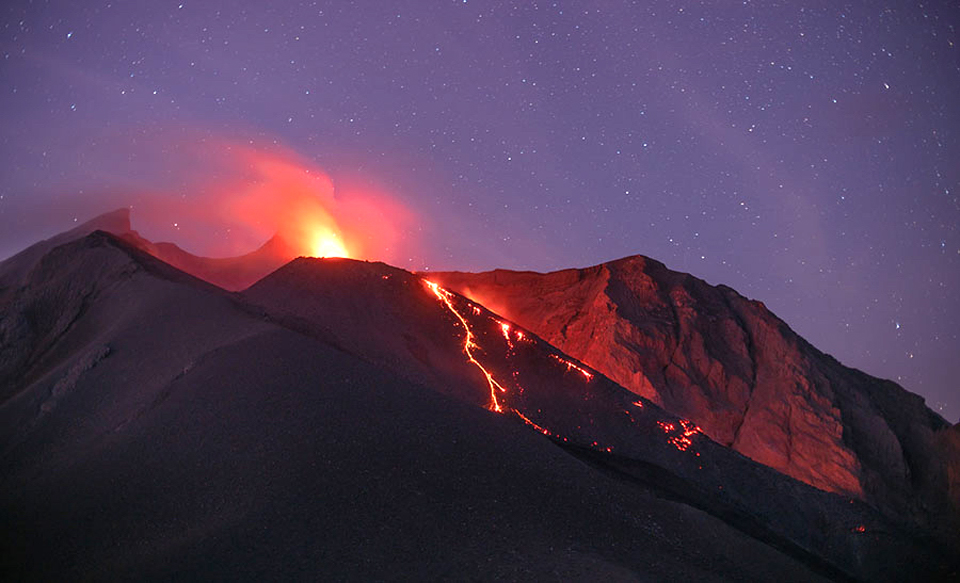
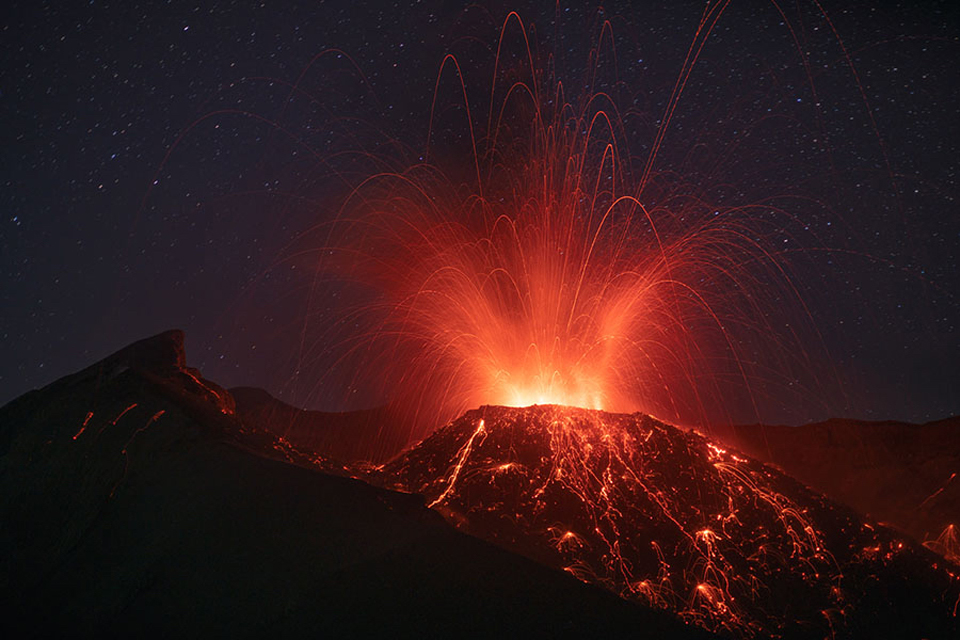
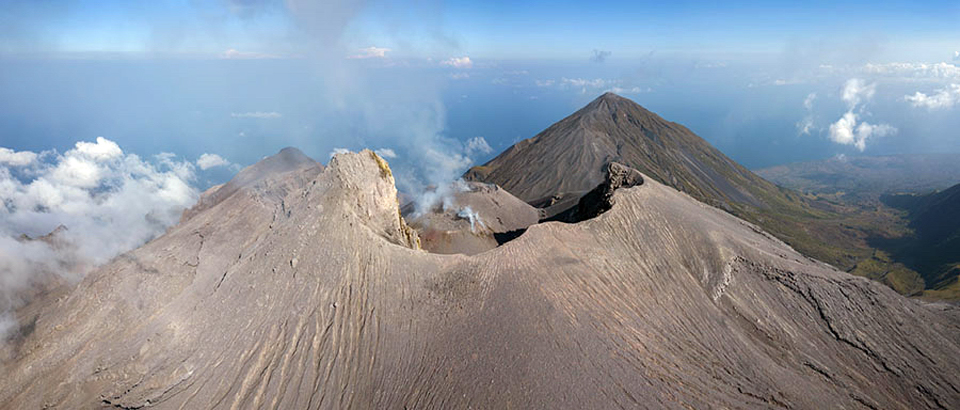
Explosion on 18 October 2023 sends ash plume 8 km high; lava flows and incandescent avalanches
Bezymianny, located on Russia’s Kamchatka Peninsula, has had eruptions since 1955 characterized by dome growth, explosions, pyroclastic flows, ash plumes, and ashfall. Activity during November 2022-April 2023 included gas-and-steam emissions, lava dome collapses generating avalanches, and persistent thermal activity. Similar eruptive activity continued from May through October 2023, described here based on information from weekly and daily reports of the Kamchatka Volcano Eruptions Response Team (KVERT), notices from Tokyo VAAC (Volcanic Ash Advisory Center), and from satellite data.
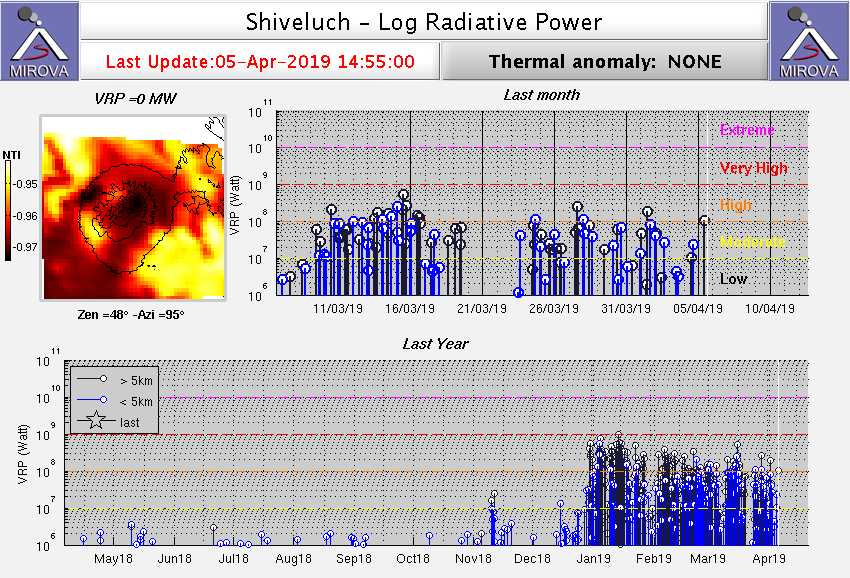
Overall activity decreased after the strong period of activity in late March through April 2023, which included ash explosions during 29 March and 7-8 April 2023 that sent plumes as high as 10-12 km altitude, along with dome growth and lava flows (BGVN 48:05). This reduced activity can be seen in the MIROVA thermal detection system graph (figure 56), which was consistent with data from the MODVOLC thermal detection system and with Sentinel-2 satellite images that showed persistent hotspots in the summit crater when conditions allowed observations. A renewed period of strong activity began in mid-October 2023.
Activity increased significantly on 17 October 2023 when large collapses began during 0700-0830 on the E flanks of the lava dome and continued to after 0930 the next day (figure 57). Ash plumes rose to an altitude of 4.5-5 km, extending 220 km NNE by 18 October. A large explosion at 1630 on 18 October produced an ash plume that rose to an altitude of 11 km (8 km above the summit) and drifted NNE and then NW, extending 900 km NW within two days at an altitude of 8 km. Minor ashfall was noted in Kozyrevsk (45 km WNW). At 0820 on 20 October an ash plume was identified in satellite images drifting 100 km ENE at altitudes of 4-4.5 km.
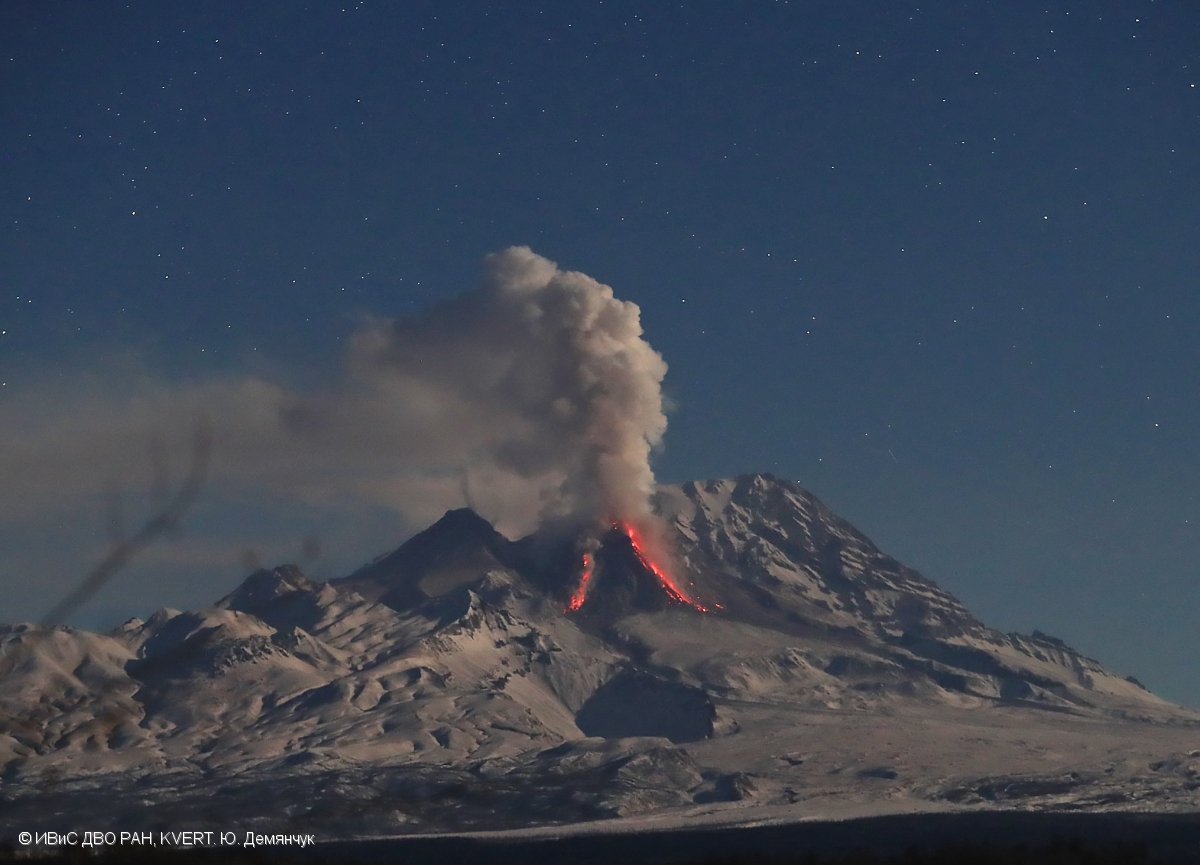
Lava flows and hot avalanches from the dome down the SE flank continued over the next few days, including 23 October when clear conditions allowed good observations (figures 58 and 59). A large thermal anomaly was observed over the volcano through 24 October, and in the summit crater on 30 October (figure 60). Strong fumarolic activity continued, with numerous avalanches and occasional incandescence. By the last week of October, volcanic activity had decreased to a level consistent with that earlier in the reporting period.
Aviation warnings were frequently updated during 17-20 October. KVERT issued a Volcano Observatory Notice for Aviation (VONA) on 17 October at 1419 and 1727 (0219 and 0527 UTC) raising the Aviation Color Code (ACC) from Yellow to Orange (second highest level). The next day, KVERT issued a VONA at 1705 (0505 UTC) raising the ACC to Red (highest level) but lowered it back to Orange at 2117 (0917 UTC). After another decrease to Yellow and back to Orange, the ACC was reduced to Yellow on 20 October at 1204 (0004 UTC). In addition, the Tokyo VAAC issued a series of Volcanic Ash Advisories beginning on 16 October and continuing through 30 October.
Geologic Background. The modern Bezymianny, much smaller than its massive neighbors Kamen and Kliuchevskoi on the Kamchatka Peninsula, was formed about 4,700 years ago over a late-Pleistocene lava-dome complex and an edifice built about 11,000-7,000 years ago. Three periods of intensified activity have occurred during the past 3,000 years. The latest period, which was preceded by a 1,000-year quiescence, began with the dramatic 1955-56 eruption. This eruption, similar to that of St. Helens in 1980, produced a large open crater that was formed by collapse of the summit and an associated lateral blast. Subsequent episodic but ongoing lava-dome growth, accompanied by intermittent explosive activity and pyroclastic flows, has largely filled the 1956 crater.
Information Contacts: Kamchatka Volcanic Eruptions Response Team (KVERT), Far Eastern Branch, Russian Academy of Sciences, 9 Piip Blvd., Petropavlovsk-Kamchatsky, 683006, Russia (URL: http://www.kscnet.ru/ivs/kvert/); Kamchatka Volcanological Station, Kamchatka Branch of Geophysical Survey, (KB GS RAS), Klyuchi, Kamchatka Krai, Russia (URL: http://volkstat.ru/); Tokyo Volcanic Ash Advisory Center (VAAC), 1-3-4 Otemachi, Chiyoda-ku, Tokyo 100-8122, Japan (URL: http://ds.data.jma.go.jp/svd/vaac/data/); Hawai'i Institute of Geophysics and Planetology (HIGP) - MODVOLC Thermal Alerts System, School of Ocean and Earth Science and Technology (SOEST), Univ. of Hawai'i, 2525 Correa Road, Honolulu, HI 96822, USA (URL: http://modis.higp.hawaii.edu/); MIROVA (Middle InfraRed Observation of Volcanic Activity), a collaborative project between the Universities of Turin and Florence (Italy) supported by the Centre for Volcanic Risk of the Italian Civil Protection Department (URL: http://www.mirovaweb.it/); Copernicus Browser, Copernicus Data Space Ecosystem, European Space Agency (URL: https://dataspace.copernicus.eu/browser/).chr
Kilauea (United States) — January 2023 Cite this Report
Kilauea
United States
19.421°N, 155.287°W; summit elev. 1222 m
All times are local (unless otherwise noted)
Low-level lava effusions in the lava lake at Halema’uma’u during July-December 2022
Kīlauea is the southeastern-most volcano in Hawaii and overlaps the E flank of the Mauna Loa volcano. Its East Rift Zone (ERZ) has been intermittently active for at least 2,000 years. An extended eruption period began in January 1983 and was characterized by open lava lakes and lava flows from the summit caldera and the East Rift Zone. During May 2018 magma migrated into the Lower East Rift Zone (LERZ) and opened 24 fissures along a 6-km-long NE-trending fracture zone that produced lava flows traveling in multiple directions. As lava emerged from the fissures, the lava lake at Halema'uma'u drained and explosions sent ash plumes to several kilometers altitude (BGVN 43:10).
The current eruption period started during September 2021 and has recently been characterized by lava effusions, spatter, and sulfur dioxide emissions in the active Halema’uma’u lava lake (BGVN 47:08). Lava effusions, some spatter, and sulfur dioxide emissions have continued during this reporting period of July through December 2022 using daily reports, volcanic activity notices, and abundant photo, map, and video data from the US Geological Survey's (USGS) Hawaiian Volcano Observatory (HVO).
Summary of activity during July-December 2022. Low-level effusions have continued at the western vent of the Halema’uma’u crater during July through early December 2022. Occasional weak ooze-outs (also called lava break outs) would occur along the margins of the crater floor. The overall level of the active lava lake throughout the reporting period gradually increased due to infilling, however it stagnated in mid-September (table 13). During September through November, activity began to decline, though lava effusions persisted at the western vent. By 9 December, the active part of the lava lake had completely crusted over, and incandescence was no longer visible.
Table 13. Summary of measurements taken during overflights at Kīlauea that show a gradual increase in the active lava lake level and the volume of lava effused since 29 September 2021. Lower activity was reported during September-October. Data collected during July-December 2022. Courtesy of HVO.
| Date: |
Level of the active lava lake (m): |
Cumulative volume of lava effused (million cubic meters): |
| 7 Jul 2022 |
130 |
95 |
| 19 Jul 2022 |
133 |
98 |
| 4 Aug 2022 |
136 |
102 |
| 16 Aug 2022 |
137 |
104 |
| 12 Sep 2022 |
143 |
111 |
| 5 Oct 2022 |
143 |
111 |
| 28 Oct 2022 |
143 |
111 |
Activity during July 2022. Lava effusions were reported from the western vent in the Halema’uma’u crater, along with occasional weak ooze-outs along the margins of the crater floor. The height of the lava lake was variable due to deflation-inflation tilt events; for example, the lake level dropped approximately 3-4 m during a summit deflation-inflation event reported on 1 July. Webcam images taken during the night of 6-12 July showed intermittent low-level spattering at the western vent that rose less than 10 m above the vent (figure 519). Measurements made during an overflight on 7 July indicated that the crater floor was infilled about 130 m and that 95 million cubic meters of lava had been effused since 29 September 2021. A single, relatively small lava ooze-out was active to the S of the lava lake. Around midnight on 8 July there were two brief periods of lava overflow onto the lake margins. On 9 July lava ooze-outs were reported near the SE and NE edges of the crater floor and during 10-11 July they occurred near the E, NE, and NW edges. On 16 July crater incandescence was reported, though the ooze-outs and spattering were not visible. On 18 July overnight webcam images showed incandescence in the western vent complex and two ooze-outs were reported around 0000 and 0200 on 19 July. By 0900 there were active ooze-outs along the SW edge of the crater floor. Measurements made from an overflight on 19 July indicated that the crater floor was infilled about 133 m and 98 million cubic meters of lava had erupted since 29 September 2021 (figure 520). On 20 July around 1600 active ooze-outs were visible along the N edge of the crater, which continued through the next day. Extensive ooze-outs occurred along the W margin during 24 July until 1900; on 26 July minor ooze-outs were noted along the N margin. Minor spattering was visible on 29 July along the E margin of the lake. The sulfur dioxide emission rates ranged 650-2,800 tons per day (t/d), the higher of which was measured on 8 July (figure 519).
Activity during August 2022. The eruption continued in the Halema’uma’u crater at the western vent. According to HVO the lava in the active lake remained at the level of the bounding levees. Occasional minor ooze-outs were observed along the margins of the crater floor. Strong nighttime crater incandescence was visible after midnight on 6 August over the western vent cone. During 6-7 August scattered small lava lobes were active along the crater floor and incandescence persisted above the western vent through 9 August. During 7-9 August HVO reported a single lava effusion source was active along the NW margin of the crater floor. Measurements from an overflight on 4 August indicated that the crater floor was infilled about 136 m total and that 102 million cubic meters of lava had been erupted since the start of the eruption. Lava breakouts were reported along the N, NE, E, S, and W margins of the crater during 10-16 August. Another overflight survey conducted on 16 August indicated that the crater floor infilled about 137 m and 104 million cubic meters of lava had been erupted since September 2021. Measured sulfur dioxide emissions rates ranged 1,150-2,450 t/d, the higher of which occurred on 8 August.
Activity during September 2022. During September, lava effusion continued from the western vent into the active lava lake and onto the crater floor. Intermittent minor ooze-outs were reported through the month. A small ooze-out was visible on the W crater floor margin at 0220 on 2 September, which showed decreasing surface activity throughout the day, but remained active through 3 September. On 3 September around 1900 a lava outbreak occurred along the NW margin of the crater floor but had stopped by the evening of 4 September. Field crews monitoring the summit lava lake on 9 September observed spattering on the NE margin of the lake that rose no higher than 10 m, before falling back onto the lava lake crust (figure 521). Overflight measurements on 12 September indicated that the crater floor was infilled a total of 143 m and 111 million cubic meters of lava had been erupted since September 2021. Extensive breakouts in the W and N part of the crater floor were reported at 1600 on 20 September and continued into 26 September. The active part of the lava lake dropped by 10 m while other parts of the crater floor dropped by several meters. Summit tiltmeters recorded a summit seismic swarm of more than 80 earthquakes during 1500-1800 on 21 September, which occurred about 1.5 km below Halema’uma’u; a majority of these were less than Mw 2. By 22 September the active part of the lava lake was infilled about 2 m. On 23 September the western vent areas exhibited several small spatter cones with incandescent openings, along with weak, sporadic spattering (figure 522). The sulfur dioxide emission rate ranged from 930 t/d to 2,000 t/d, the higher of which was measured on 6 September.
Activity during October 2022. Activity during October declined slightly compared to previous months, though lava effusions persisted from the western vent into the active lava lake and onto the crater floor during October (figure 523). Slight variations in the lava lake were noted throughout the month. HVO reported that around 0600 on 3 October the level of the lava lake has lowered slightly. Overflight measurements taken on 5 October indicated that the crater floor was infilled a total of about 143 m and that 111 million cubic meters of lava had been effused since September 2021. During 6-7 October the lake gradually rose 0.5 m. Sulfur dioxide measurements made on 22 October had an emission rate of 700 t/d. Another overflight taken on 28 October showed that there was little to no change in the elevation of the crater floor: the crater floor was infilled a total of 143 m and 111 million cubic meters of lava had erupted since the start of the eruption.
Activity during November 2022. Activity remained low during November, though HVO reported that lava from the western vent continued to effuse into the active lava lake and onto the crater floor throughout the month. The rate of sulfur dioxide emissions during November ranged from 300-600 t/d, the higher amount of which occurred on 9 November.
Activity during December 2022. Similar low activity was reported during December, with lava effusing from the western vent into the active lava lake and onto the crater floor. During 4-5 December the active part of the lava lake was slightly variable in elevation and fluctuated within 1 m. On 9 December HVO reported that lava was no longer erupting from the western vent in the Halema’uma’u crater and that sulfur dioxide emissions had returned to near pre-eruption background levels; during 10-11 December, the lava lake had completely crusted over, and no incandescence was visible (figure 524). Time lapse camera images covering the 4-10 December showed that the crater floor showed weak deflation and no inflation. Some passive events of crustal overturning were reported during 14-15 December, which brought fresh incandescent lava to the lake surface. The sulfur dioxide emission rate was approximately 200 t/d on 14 December. A smaller overturn event on 17 December and another that occurred around 0000 and into the morning of 20 December were also detected. A small seismic swarm was later detected on 30 December.
Geologic Background. Kilauea overlaps the E flank of the massive Mauna Loa shield volcano in the island of Hawaii. Eruptions are prominent in Polynesian legends; written documentation since 1820 records frequent summit and flank lava flow eruptions interspersed with periods of long-term lava lake activity at Halemaumau crater in the summit caldera until 1924. The 3 x 5 km caldera was formed in several stages about 1,500 years ago and during the 18th century; eruptions have also originated from the lengthy East and Southwest rift zones, which extend to the ocean in both directions. About 90% of the surface of the basaltic shield volcano is formed of lava flows less than about 1,100 years old; 70% of the surface is younger than 600 years. The long-term eruption from the East rift zone between 1983 and 2018 produced lava flows covering more than 100 km2, destroyed hundreds of houses, and added new coastline.
Information Contacts: Hawaiian Volcano Observatory (HVO), U.S. Geological Survey, PO Box 51, Hawai'i National Park, HI 96718, USA (URL: http://hvo.wr.usgs.gov/).
Nyamulagira (DR Congo) — November 2023 Cite this Report
Nyamulagira
DR Congo
1.408°S, 29.2°E; summit elev. 3058 m
All times are local (unless otherwise noted)
Lava flows and thermal activity during May-October 2023
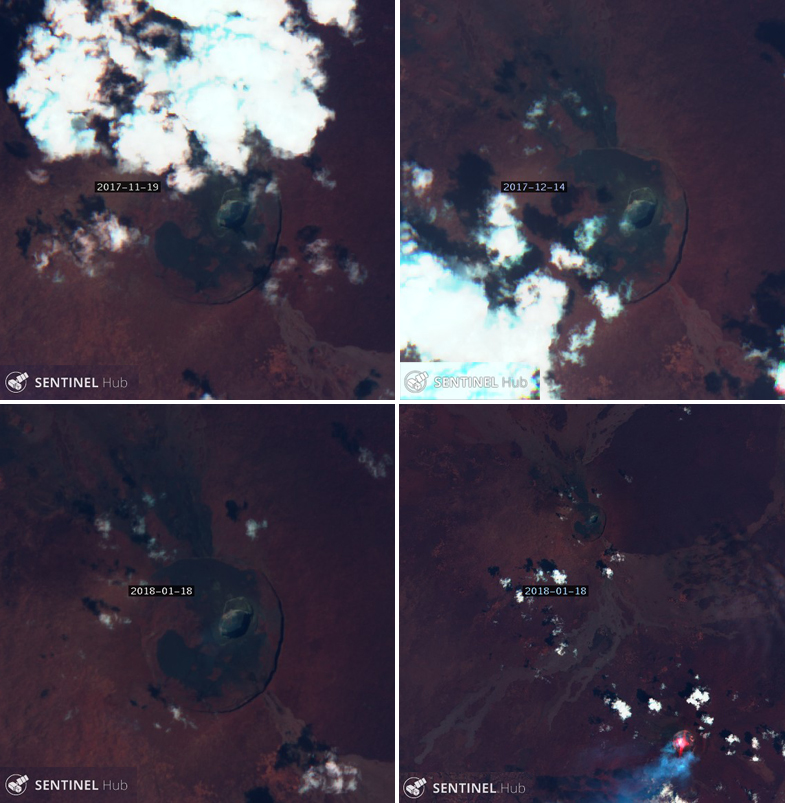
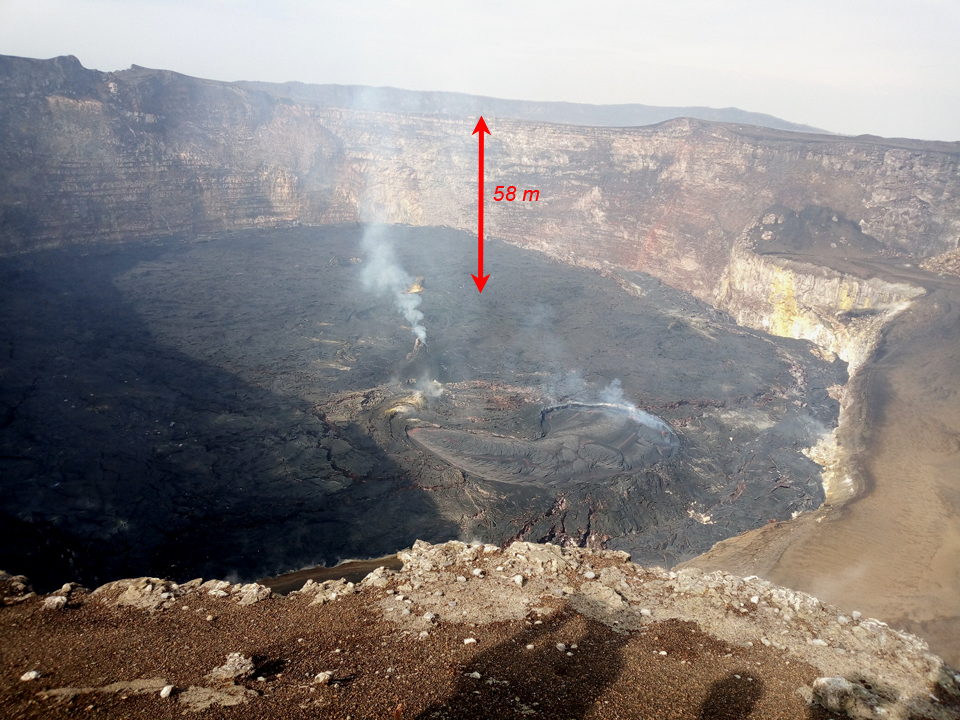
Nyamulagira (also known as Nyamuragira) is a shield volcano in the Democratic Republic of Congo with the summit truncated by a small 2 x 2.3 km caldera with walls up to about 100 m high. Documented eruptions have occurred within the summit caldera, as well as from numerous flank fissures and cinder cones. The current eruption period began in April 2018 and has more recently been characterized by summit crater lava flows and thermal activity (BGVN 48:05). This report describes lava flows and variable thermal activity during May through October 2023, based on information from the Observatoire Volcanologique de Goma (OVG) and various satellite data.
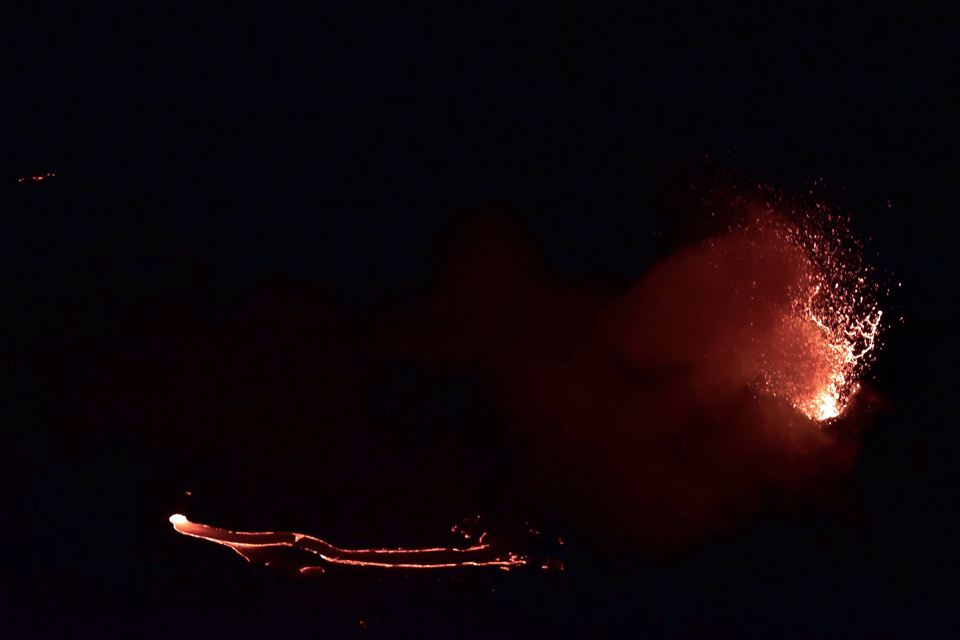
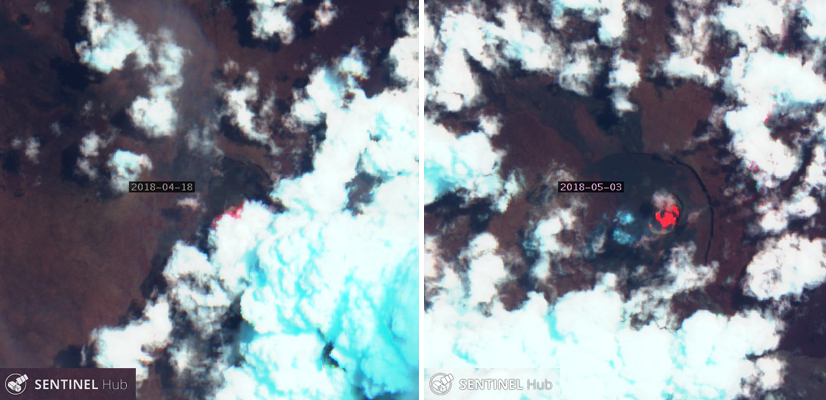
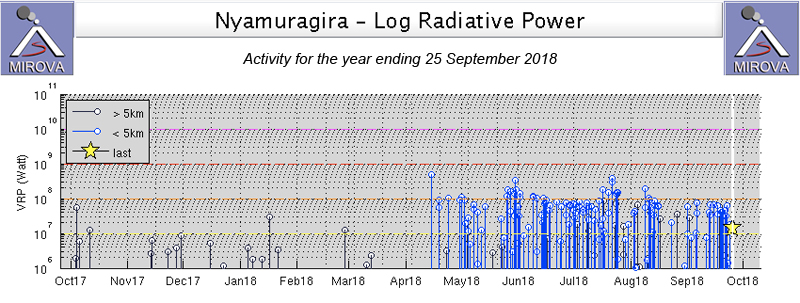
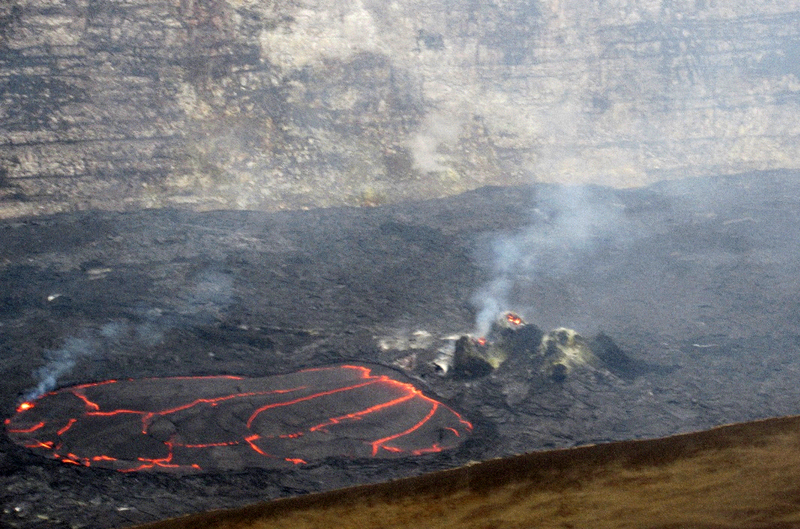
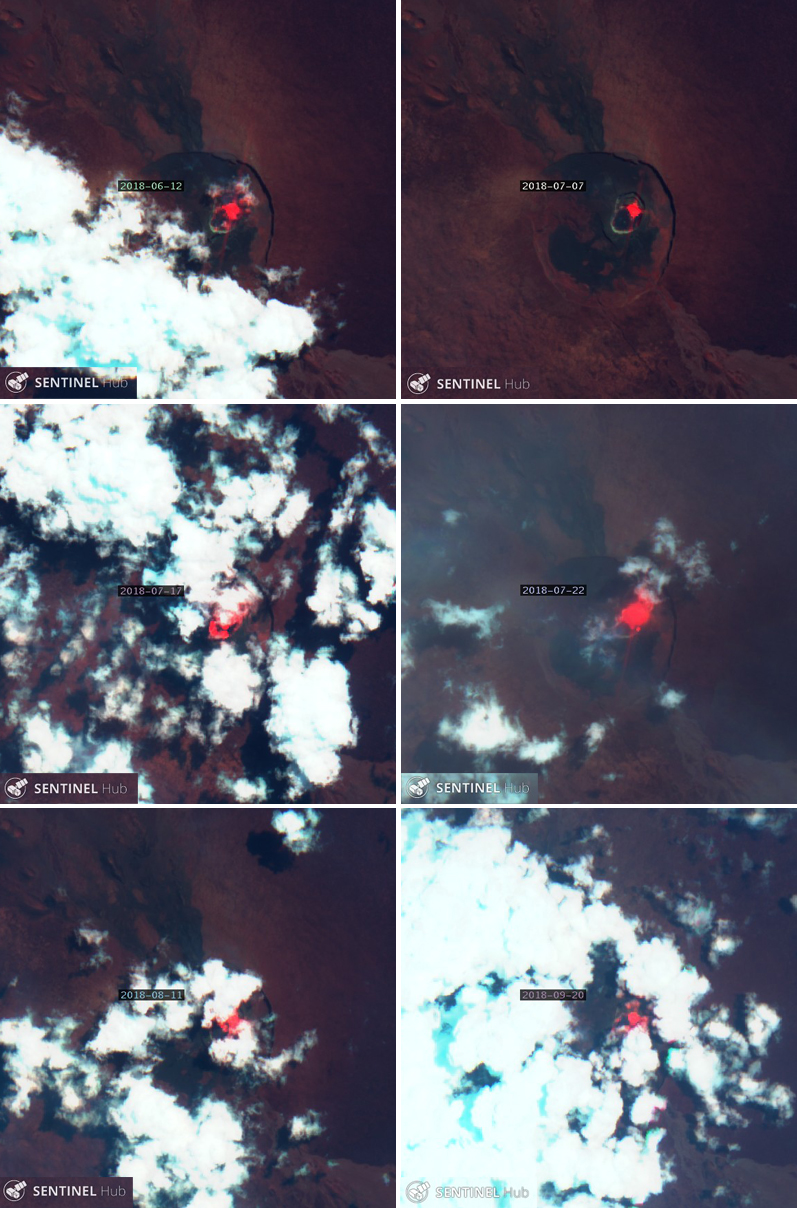
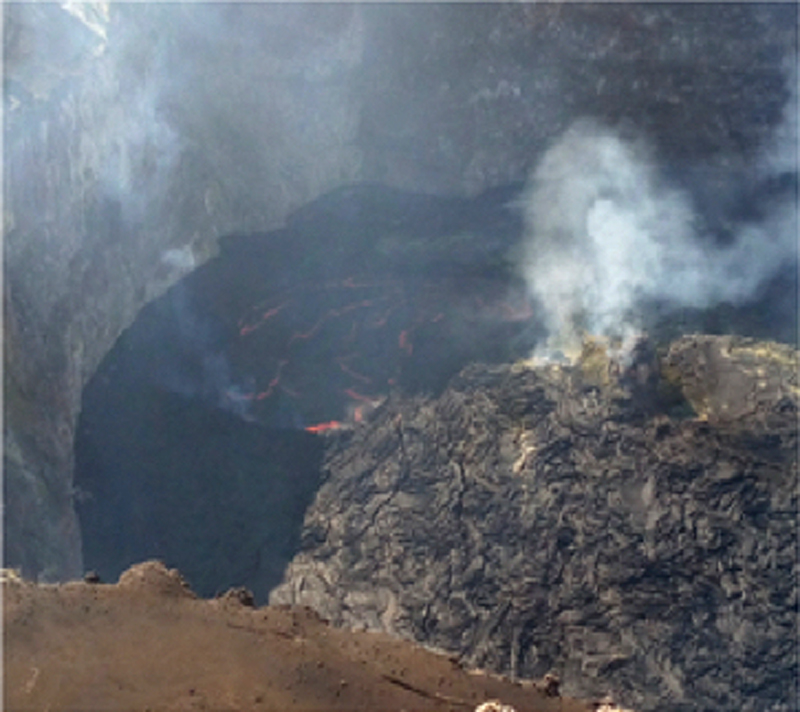
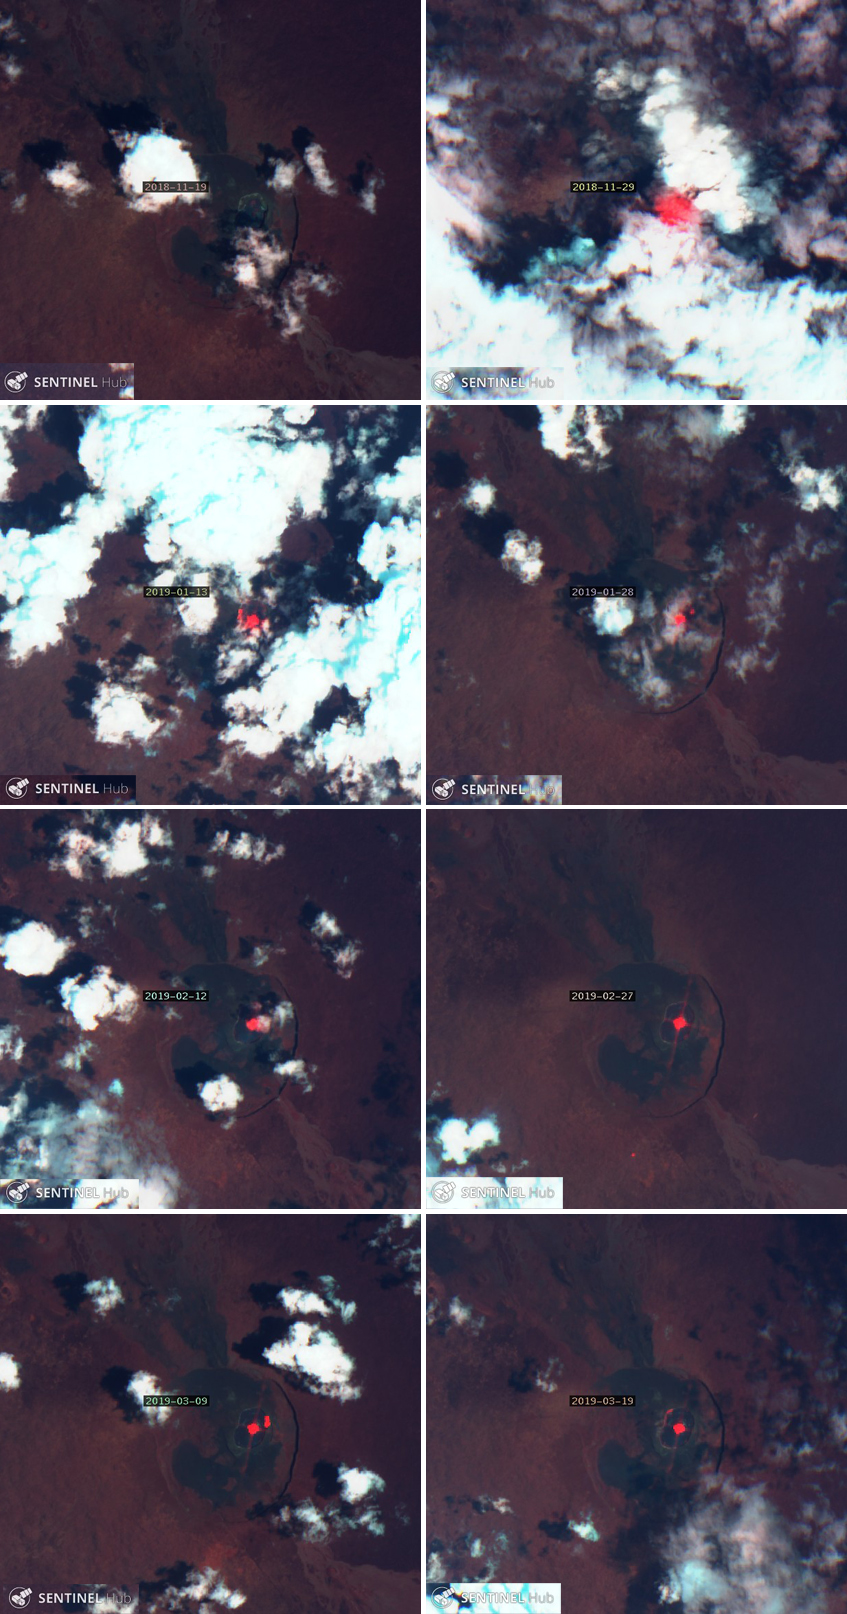
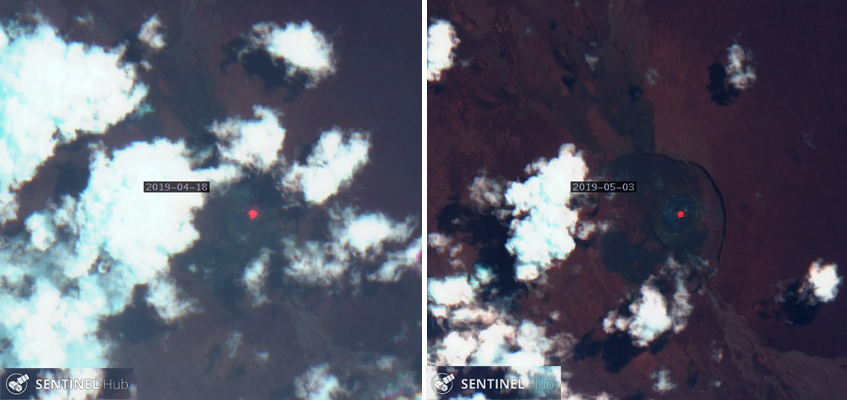
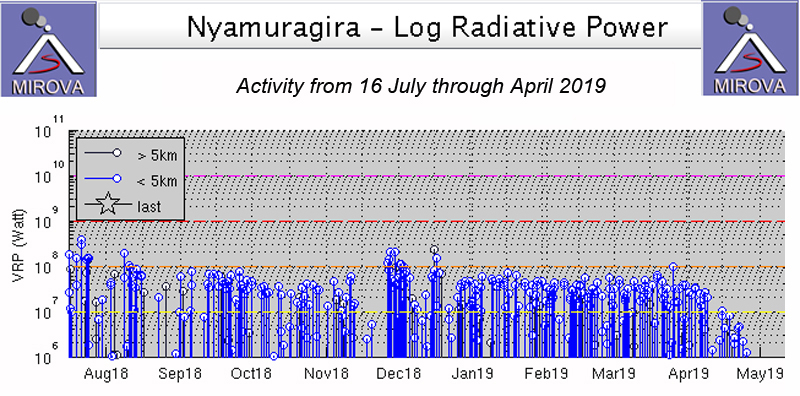
Lava lake activity continued during May. The MIROVA (Middle InfraRed Observation of Volcanic Activity) system recorded moderate-to-strong thermal activity throughout the reporting period; activity was more intense during May and October and relatively weaker from June through September (figure 95). The MODVOLC thermal algorithm, detected a total of 209 thermal alerts. There were 143 hotspots detected during May, eight during June, nine during September, and 49 during October. This activity was also reflected in infrared satellite images, where a lava flow was visible in the NW part of the crater on 7 May and strong activity was seen in the center of the crater on 4 October (figure 96). Another infrared satellite image taken on 12 May showed still active lava flows along the NW margin of the crater. According to OVG lava effusions were active during 7-29 May and moved to the N and NW parts of the crater beginning on 9 May. Strong summit crater incandescence was visible from Goma (27 km S) during the nights of 17, 19, and 20 May (figure 97). On 17 May there was an increase in eruptive activity, which peaked at 0100 on 20 May. Notable sulfur dioxide plumes drifted NW and W during 19-20 May (figure 98). Drone footage acquired in partnership with the USGS (United States Geological Survey) on 20 May captured images of narrow lava flows that traveled about 100 m down the W flank (figure 99). Data from the Rumangabo seismic station indicated a decreasing trend in activity during 17-21 May. Although weather clouds prevented clear views of the summit, a strong thermal signature on the NW flank was visible in an infrared satellite image on 22 May, based on an infrared satellite image. On 28 May the lava flows on the upper W flank began to cool and solidify. By 29 May seismicity returned to levels similar to those recorded before the 17 May increase. Lava effusion continued but was confined to the summit crater; periodic crater incandescence was observed.
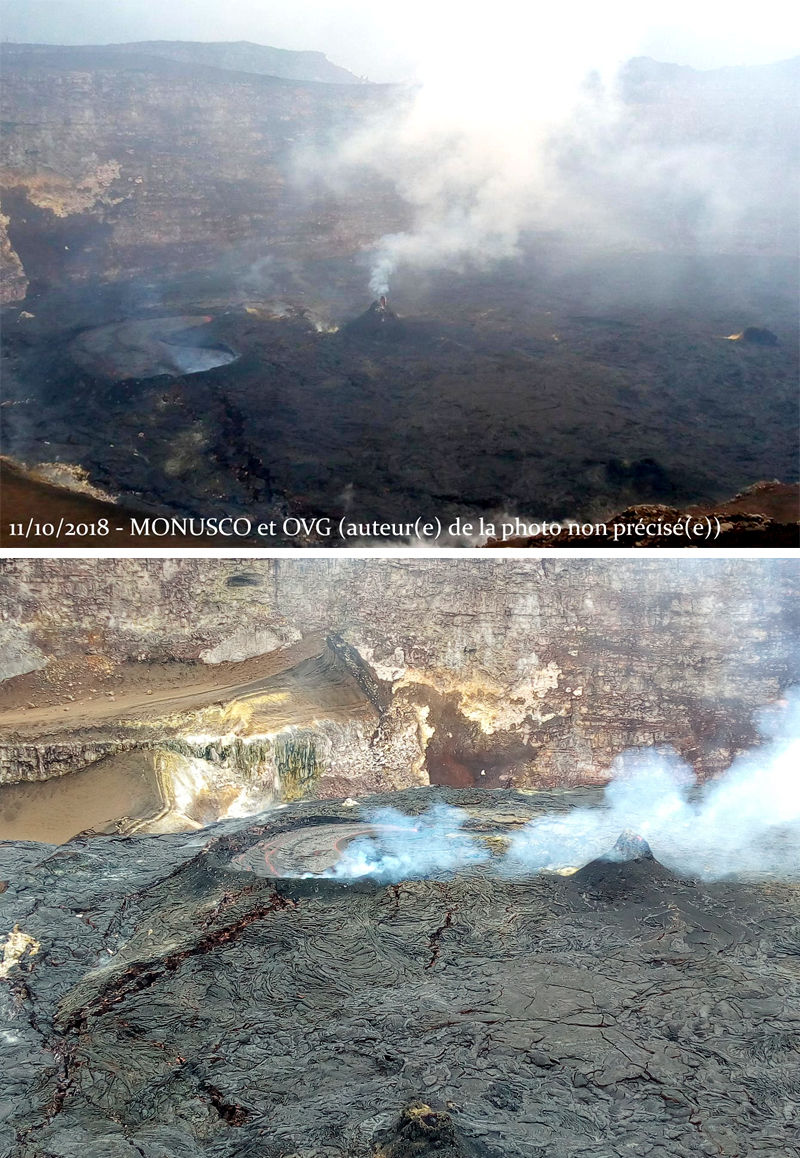
Low-level activity was noted during June through October. On 1 June OVG reported that seismicity remained at lower levels and that crater incandescence had been absent for three days, though infrared satellite imagery showed continued lava effusion in the summit crater. The lava flows on the flanks covered an estimated 0.6 km2. Satellite imagery continued to show thermal activity confined to the lava lake through October (figure 96), although no lava flows or significant sulfur dioxide emissions were reported.
Geologic Background. Africa's most active volcano, Nyamulagira (also known as Nyamuragira), is a massive high-potassium basaltic shield about 25 km N of Lake Kivu and 13 km NNW of the steep-sided Nyiragongo volcano. The summit is truncated by a small 2 x 2.3 km caldera that has walls up to about 100 m high. Documented eruptions have occurred within the summit caldera, as well as from the numerous flank fissures and cinder cones. A lava lake in the summit crater, active since at least 1921, drained in 1938, at the time of a major flank eruption. Recent lava flows extend down the flanks more than 30 km from the summit as far as Lake Kivu; extensive lava flows from this volcano have covered 1,500 km2 of the western branch of the East African Rift.
Information Contacts: Observatoire Volcanologique de Goma (OVG), Departement de Geophysique, Centre de Recherche en Sciences Naturelles, Lwiro, D.S. Bukavu, DR Congo; Hawai'i Institute of Geophysics and Planetology (HIGP) - MODVOLC Thermal Alerts System, School of Ocean and Earth Science and Technology (SOEST), Univ. of Hawai'i, 2525 Correa Road, Honolulu, HI 96822, USA (URL: http://modis.higp.hawaii.edu/); MIROVA (Middle InfraRed Observation of Volcanic Activity), a collaborative project between the Universities of Turin and Florence (Italy) supported by the Centre for Volcanic Risk of the Italian Civil Protection Department (URL: http://www.mirovaweb.it/); NASA Global Sulfur Dioxide Monitoring Page, Atmospheric Chemistry and Dynamics Laboratory, NASA Goddard Space Flight Center (NASA/GSFC), 8800 Greenbelt Road, Goddard, Maryland, USA (URL: https://so2.gsfc.nasa.gov/); Copernicus Browser, Copernicus Data Space Ecosystem, European Space Agency (URL: https://dataspace.copernicus.eu/browser/); Charles Balagizi, Goma Volcano Observatory, Departement de Geophysique, Centre de Recherche en Sciences Naturelles, Lwiro, D.S. Bukavu, DR Congo.
Bagana (Papua New Guinea) — October 2023 Cite this Report
Bagana
Papua New Guinea
6.137°S, 155.196°E; summit elev. 1855 m
All times are local (unless otherwise noted)
Explosions, ash plumes, ashfall, and lava flows during April-September 2023
The remote volcano of Bagana is located in central Bougainville Island, Papua New Guinea. Recorded eruptions date back to 1842 and activity has consisted of effusive activity that has built a small lava dome in the summit crater and occasional explosions that produced pyroclastic flows. The most recent eruption has been ongoing since February 2000 and has produced occasional explosions, ash plumes, and lava flows. More recently, activity has been characterized by ongoing effusive activity and ash emissions (BGVN 48:04). This report updates activity from April through September 2023 that has consisted of explosions, ash plumes, ashfall, and lava flows, using information from the Darwin Volcanic Ash Advisory Center (VAAC) and satellite data.
An explosive eruption was reported on 7 July that generated a large gas-and-ash plume to high altitudes and caused significant ashfall in local communities; the eruption plume had reached upper tropospheric (16-18 km altitude) altitudes by 2200, according to satellite images. Sulfur dioxide plumes were detected in satellite images on 8 July and indicated that the plume was likely a mixture of gas, ice, and ash. A report issued by the Autonomous Bougainville Government (ABG) (Torokina District, Education Section) on 10 July noted that significant ash began falling during 2000-2100 on 7 July and covered most areas in the Vuakovi, Gotana (9 km SW), Koromaketo, Laruma (25 km W) and Atsilima (27 km NW) villages. Pyroclastic flows also occurred, according to ground-based reports; small deposits confined to one drainage were inspected by RVO during an overflight on 17 July and were confirmed to be from the 7 July event. Ashfall continued until 10 July and covered vegetation, which destroyed bushes and gardens and contaminated rivers and streams.
RVO reported another eruption on 14 July. The Darwin VAAC stated that an explosive event started around 0830 on 15 July and produced an ash plume that rose to 16.5 km altitude by 1000 and drifted N, according to satellite images. The plume continued to drift N and remained visible through 1900, and by 2150 it had dissipated.
Ashfall likely from both the 7 and 15 July events impacted about 8,111 people in Torokina (20 km SW), including Tsito/Vuakovi, Gotana, Koromaketo, Kenaia, Longkogari, Kenbaki, Piva (13 km SW), and Atsinima, and in the Tsitovi district, according to ABG. Significant ashfall was also reported in Ruruvu (22 km N) in the Wakunai District of Central Bougainville, though the thickness of these deposits could not be confirmed. An evacuation was called for the villages in Wakunai, where heavy ashfall had contaminated water sources; the communities of Ruruvu, Togarau, Kakarapaia, Karauturi, Atao, and Kuritaturi were asked to evacuate to a disaster center at the Wakunai District Station, and communities in Torokina were asked to evacuate to the Piva District station. According to a news article, more than 7,000 people needed temporary accommodations, with about 1,000 people in evacuation shelters. Ashfall had deposited over a broad area, contaminating water supplies, affecting crops, and collapsing some roofs and houses in rural areas. Schools were temporarily shut down. Intermittent ash emissions continued through the end of July and drifted NNW, NW, and SW. Fine ashfall was reported on the coast of Torokina, and ash plumes also drifted toward Laruma and Atsilima.
A small explosive eruption occurred at 2130 on 28 July that ejected material from the crater vents, according to reports from Torokina, in addition to a lava flow that contained two lobes. A second explosion was detected at 2157. Incandescence from the lava flow was visible from Piva as it descended the W flank around 2000 on 29 July (figure 47). The Darwin VAAC reported that a strong thermal anomaly was visible in satellite images during 30-31 July and that ash emissions rose to 2.4 km altitude and drifted WSW on 30 July. A ground report from RVO described localized emissions at 0900 on 31 July.
The Darwin VAAC reported that ash plumes were identified in satellite imagery at 0800 and 1220 on 12 August and rose to 2.1 km and 3 km altitude and drifted NW and W, respectively. A news report stated that aid was sent to more than 6,300 people that were adversely affected by the eruption. Photos taken during 17-19 August showed ash emissions rising no higher than 1 km above the summit and drifting SE. A small explosion generated an ash plume during the morning of 19 August. Deposits from small pyroclastic flows were also captured in the photos. Satellite images captured lava flows and pyroclastic flow deposits. Two temporary seismic stations were installed near Bagana on 17 August at distances of 7 km WSW (Vakovi station) and 11 km SW (Kepox station). The Kepox station immediately started to record continuous, low-frequency background seismicity.
Satellite data. Little to no thermal activity was detected during April through mid-July 2023; only one anomaly was recorded during early April and one during early June, according to MIROVA (Middle InfraRed Observation of Volcanic Activity) data (figure 48). Thermal activity increased in both power and frequency during mid-July through September, although there were still some short gaps in detected activity. MODVOLC also detected increased thermal activity during August; thermal hotspots were detected a total of five times on 19, 20, and 27 August. Weak thermal anomalies were also captured in infrared satellite images on clear weather days throughout the reporting period on 7, 12, and 17 April, 27 May, 1, 6, 16, and 31 July, and 19 September (figure 48); a strong thermal anomaly was visible on 31 July. Distinct sulfur dioxide plumes that drifted generally NW were intermittently captured by the TROPOMI instrument on the Sentinel-5P satellite and sometimes exceeded two Dobson Units (DUs) (figure 49).
Geologic Background. Bagana volcano, in a remote portion of central Bougainville Island, is frequently active. This massive symmetrical cone was largely constructed by an accumulation of viscous andesitic lava flows. The entire edifice could have been constructed in about 300 years at its present rate of lava production. Eruptive activity is characterized by non-explosive effusion of viscous lava that maintains a small lava dome in the summit crater, although occasional explosive activity produces pyroclastic flows. Lava flows with tongue-shaped lobes up to 50 m thick and prominent levees descend the flanks on all sides.
Information Contacts: Rabaul Volcano Observatory (RVO), Geohazards Management Division, Department of Mineral Policy and Geohazards Management (DMPGM), PO Box 3386, Kokopo, East New Britain Province, Papua New Guinea; Darwin Volcanic Ash Advisory Centre (VAAC), Bureau of Meteorology, Northern Territory Regional Office, PO Box 40050, Casuarina, NT 0811, Australia (URL: http://www.bom.gov.au/info/vaac/); MIROVA (Middle InfraRed Observation of Volcanic Activity), a collaborative project between the Universities of Turin and Florence (Italy) supported by the Centre for Volcanic Risk of the Italian Civil Protection Department (URL: http://www.mirovaweb.it/); Hawai'i Institute of Geophysics and Planetology (HIGP) - MODVOLC Thermal Alerts System, School of Ocean and Earth Science and Technology (SOEST), Univ. of Hawai'i, 2525 Correa Road, Honolulu, HI 96822, USA (URL: http://modis.higp.hawaii.edu/); NASA Global Sulfur Dioxide Monitoring Page, Atmospheric Chemistry and Dynamics Laboratory, NASA Goddard Space Flight Center (NASA/GSFC), 8800 Greenbelt Road, Goddard, Maryland, USA (URL: https://so2.gsfc.nasa.gov/); Copernicus Browser, Copernicus Data Space Ecosystem, European Space Agency (URL: https://dataspace.copernicus.eu/browser/); Autonomous Bougainville Government, P.O Box 322, Buka, AROB, PNG (URL: https://abg.gov.pg/); Andrew Tupper (Twitter: @andrewcraigtupp); Simon Carn, Geological and Mining Engineering and Sciences, Michigan Technological University, 1400 Townsend Drive, Houghton, MI 49931, USA (URL: http://www.volcarno.com/, Twitter: @simoncarn); Radio NZ (URL: https://www.rnz.co.nz/news/pacific/494464/more-than-7-000-people-in-bougainville-need-temporary-accommodation-after-eruption); USAID, 1300 Pennsylvania Ave, NW, Washington DC 20004, USA (URL: https://www.usaid.gov/pacific-islands/press-releases/aug-08-2023-united-states-provides-immediate-emergency-assistance-support-communities-affected-mount-bagana-volcanic-eruptions).
Mayon (Philippines) — October 2023 Cite this Report
Mayon
Philippines
13.257°N, 123.685°E; summit elev. 2462 m
All times are local (unless otherwise noted)
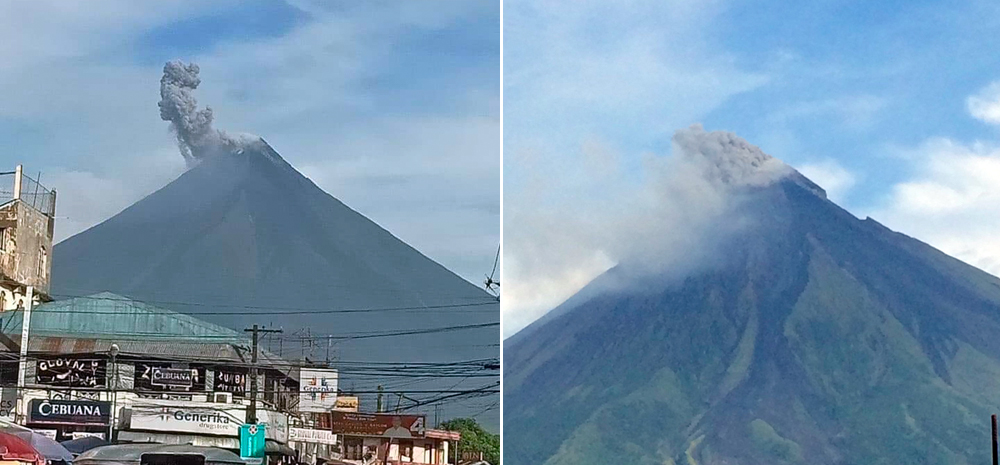
Lava flows, pyroclastic flows, ash emissions, and seismicity during April-September 2023
Mayon is located in the Philippines and has steep upper slopes capped by a small summit crater. Historical eruptions date back to 1616 CE that have been characterized by Strombolian eruptions, lava flows, pyroclastic flows, and mudflows. Eruptions mostly originated from a central conduit. Pyroclastic flows and mudflows have commonly descended many of the approximately 40 drainages that surround the volcano. The most recent eruption occurred during June through October 2022 and consisted of lava dome growth and gas-and-steam emissions (BGVN 47:12). A new eruption was reported during late April 2023 and has included lava flows, pyroclastic density currents, ash emissions, and seismicity. This report covers activity during April through September 2023 based on daily bulletins from the Philippine Institute of Volcanology and Seismology (PHIVOLCS).
During April through September 2023, PHIVOLCS reported near-daily rockfall events, frequent volcanic earthquakes, and sulfur dioxide measurements. Gas-and-steam emissions rose 100-900 m above the crater and drifted in different directions. Nighttime crater incandescence was often visible during clear weather and was accompanied by incandescent avalanches of material. Activity notably increased during June when lava flows were reported on the S, SE, and E flanks (figure 52). The MIROVA graph (Middle InfraRed Observation of Volcanic Activity) showed strong thermal activity coincident with these lava flows, which remained active through September (figure 53). According to the MODVOLC thermal algorithm, a total of 110 thermal alerts were detected during the reporting period: 17 during June, 40 during July, 27 during August, and 26 during September. During early June, pyroclastic density currents (PDCs) started to occur more frequently.
Low activity was reported during much of April and May; gas-and-steam emissions rose 100-900 m above the crater and generally drifted in different directions. A total of 52 rockfall events and 18 volcanic earthquakes were detected during April and 147 rockfall events and 13 volcanic events during May. Sulfur dioxide flux measurements ranged between 400-576 tons per day (t/d) during April, the latter of which was measured on 29 April and between 162-343 t/d during May, the latter of which was measured on 13 May.
Activity during June increased, characterized by lava flows, pyroclastic density currents (PDCs), crater incandescence and incandescent rockfall events, gas-and-steam emissions, and continued seismicity. Weather clouds often prevented clear views of the summit, but during clear days, moderate gas-and-steam emissions rose 100-2,500 m above the crater and drifted in multiple directions. A total of 6,237 rockfall events and 288 volcanic earthquakes were detected. The rockfall events often deposited material on the S and SE flanks within 700-1,500 m of the summit crater and ash from the events drifted SW, S, SE, NE, and E. Sulfur dioxide emissions ranged between 149-1,205 t/d, the latter of which was measured on 10 June. Short-term observations from EDM and electronic tiltmeter monitoring indicated that the upper slopes were inflating since February 2023. Longer-term ground deformation parameters based on EDM, precise leveling, continuous GPS, and electronic tilt monitoring indicated that the volcano remained inflated, especially on the NW and SE flanks. At 1000 on 5 June the Volcano Alert Level (VAL) was raised to 2 (on a 0-5 scale). PHIVOLCS noted that although low-level volcanic earthquakes, ground deformation, and volcanic gas emissions indicated unrest, the steep increase in rockfall frequency may indicate increased dome activity.
A total of 151 dome-collapse PDCs occurred during 8-9 and 11-30 June, traveled 500-2,000 m, and deposited material on the S flank within 2 km of the summit crater. During 8-9 June the VAL was raised to 3. At approximately 1947 on 11 June lava flow activity was reported; two lobes traveled within 500 m from the crater and deposited material on the S (Mi-isi), SE (Bonga), and E (Basud) flanks. Weak seismicity accompanied the lava flow and slight inflation on the upper flanks. This lava flow remained active through 30 June, moving down the S and SE flank as far as 2.5 km and 1.8 km, respectively and depositing material up to 3.3 km from the crater. During 15-16 June traces of ashfall from the PDCs were reported in Sitio Buga, Nabonton, City of Ligao and Purok, and San Francisco, Municipality of Guinobatan. During 28-29 June there were two PDCs generated by the collapse of the lava flow front, which generated a light-brown ash plume 1 km high. Satellite monitors detected significant concentrations of sulfur dioxide beginning on 29 June. On 30 June PDCs primarily affected the Basud Gully on the E flank, the largest of which occurred at 1301 and lasted eight minutes, based on the seismic record. Four PDCs generated between 1800 and 2000 that lasted approximately four minutes each traveled 3-4 km on the E flank and generated an ash plume that rose 1 km above the crater and drifted N and NW. Ashfall was recorded in Tabaco City.
Similar strong activity continued during July; slow lava effusion remained active on the S and SE flanks and traveled as far as 2.8 km and 2.8 km, respectively and material was deposited as far as 4 km from the crater. There was a total of 6,983 rockfall events and 189 PDCs that affected the S, SE, and E flanks. The volcano network detected a total of 2,124 volcanic earthquakes. Continuous gas-and-steam emissions rose 200-2,000 m above the crater and drifted in multiple directions. Sulfur dioxide emissions averaged 792-4,113 t/d, the latter of which was measured on 28 July. During 2-4 July three PDCs were generated from the collapse of the lava flow and resulting light brown plumes rose 200-300 m above the crater. Continuous tremor pulses were reported beginning at 1547 on 3 July through 7 July at 1200, at 2300 on 8 July and going through 0300 on 10 July, and at 2300 on 16 July, as recorded by the seismic network. During 6-9 July there were 10 lava flow-collapse-related PDCs that generated light brown plumes 300-500 m above the crater. During 10-11 July light ashfall was reported in some areas of Mabinit, Legazpi City, Budiao and Salvacion, Daraga, and Camalig, Albay. By 18 July the lava flow advanced 600 m on the E flank as well.
During 1733 on 18 July and 0434 on 19 July PHIVOLCS reported 30 “ashing” events, which are degassing events accompanied by audible thunder-like sounds and entrained ash at the crater, which produced short, dark plumes that drifted SW. These events each lasted 20-40 seconds, and plume heights ranged from 150-300 m above the crater, as recorded by seismic, infrasound, visual, and thermal monitors. Three more ashing events occurred during 19-20 July. Short-term observations from electronic tilt and GPS monitoring indicate deflation on the E lower flanks in early July and inflation on the NW middle flanks during the third week of July. Longer-term ground deformation parameters from EDM, precise leveling, continuous GPS, and electronic tilt monitoring indicated that the volcano was still generally inflated relative to baseline levels. A short-lived lava pulse lasted 28 seconds at 1956 on 21 July, which was accompanied by seismic and infrasound signals. By 22 July, the only lava flow that remained active was on the SE flank, and continued to extend 3.4 km, while those on the S and E flanks weakened markedly. One ashing event was detected during 30-31 July, whereas there were 57 detected during 31 July-1 August; according to PHIVOLCS beginning at approximately 1800 on 31 July eruptive activity was dominated by phases of intermittent ashing, as well as increased in the apparent rates of lava effusion from the summit crater. The ashing phases consisted of discrete events recorded as low-frequency volcanic earthquakes (LFVQ) typically 30 seconds in duration, based on seismic and infrasound signals. Gray ash plume rose 100 m above the crater and generally drifted NE. Shortly after these ashing events began, new lava began to effuse rapidly from the crater, feeding the established flowed on the SE, E, and E flanks and generating frequent rockfall events.
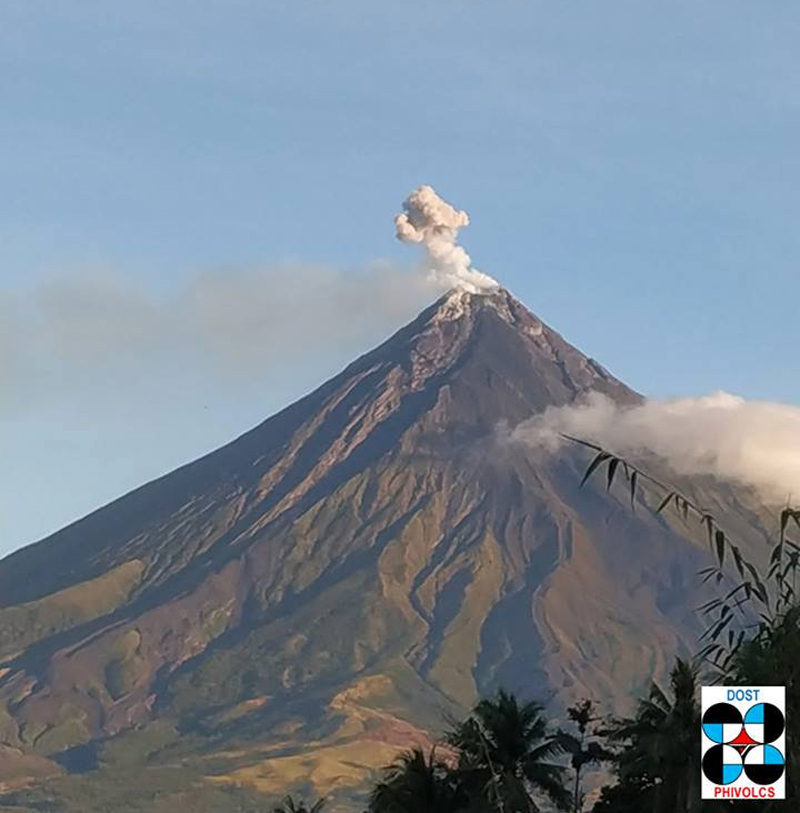
Intensified unrest persisted during August. There was a total of 4,141 rockfall events, 2,881 volcanic earthquakes, which included volcanic tremor events, 32 ashing events, and 101 PDCs detected throughout the month. On clear weather days, gas-and-steam emissions rose 300-1,500 m above the crater and drifted in different directions (figure 54). Sulfur dioxide emissions averaged 735-4,756 t/d, the higher value of which was measured on 16 August. During 1-2 August the rate of lava effusion decreased, but continued to feed the flows on the SE, S, and E flanks, maintaining their advances to 3.4 km, 2.8 km, and 1.1 km from the crater, respectively (figure 55). Rockfall and PDCs generated by collapses at the lava flow margins and from the summit dome deposited material within 4 km of the crater. During 3-4 August there were 10 tremor events detected that lasted 1-4 minutes. Short-lived lava pulse lasted 35 seconds and was accompanied by seismic and infrasound signals at 0442 on 6 August. Seven collapses were recorded at the front of the lava flow during 12-14 August.
During September, similar activity of slow lava effusion, PDCs, gas-and-steam emissions, and seismicity continued. There was a total of 4,452 rockfall events, 329 volcanic earthquakes, which included volcanic tremor events, two ashing events, and 85 PDCs recorded throughout the month. On clear weather days, gas-and-steam emissions rose 100-1,500 m above the crater and drifted in multiple directions. Sulfur dioxide emissions averaged 609-2,252 t/d, the higher average of which was measured on 6 September. Slow lava effusion continued advancing on the SE, S, and E flanks, maintaining lengths of 3.4 km, 2.8 km, and 1.1 km, respectively. Rockfall and PDC events generated by collapses along the lava flow margins and at the summit dome deposited material within 4 km of the crater.
Geologic Background. Symmetrical Mayon, which rises above the Albay Gulf NW of Legazpi City, is the most active volcano of the Philippines. The steep upper slopes are capped by a small summit crater. Recorded eruptions since 1616 CE range from Strombolian to basaltic Plinian, with cyclical activity beginning with basaltic eruptions, followed by longer periods of andesitic lava flows. Eruptions occur predominately from the central conduit and have also produced lava flows that travel far down the flanks. Pyroclastic density currents and mudflows have commonly swept down many of the approximately 40 ravines that radiate from the summit and have often damaged populated lowland areas. A violent eruption in 1814 killed more than 1,200 people and devastated several towns.
Information Contacts: Philippine Institute of Volcanology and Seismology (PHIVOLCS), Department of Science and Technology, University of the Philippines Campus, Diliman, Quezon City, Philippines (URL: http://www.phivolcs.dost.gov.ph/); MIROVA (Middle InfraRed Observation of Volcanic Activity), a collaborative project between the Universities of Turin and Florence (Italy) supported by the Centre for Volcanic Risk of the Italian Civil Protection Department (URL: http://www.mirovaweb.it/); Hawai'i Institute of Geophysics and Planetology (HIGP) - MODVOLC Thermal Alerts System, School of Ocean and Earth Science and Technology (SOEST), Univ. of Hawai'i, 2525 Correa Road, Honolulu, HI 96822, USA (URL: http://modis.higp.hawaii.edu/); Copernicus Browser, Copernicus Data Space Ecosystem, European Space Agency (URL: https://dataspace.copernicus.eu/browser/); William Rogers, Legazpi City, Albay Province, Philippines.
Nishinoshima (Japan) — October 2023 Cite this Report
Nishinoshima
Japan
27.247°N, 140.874°E; summit elev. 100 m
All times are local (unless otherwise noted)
Eruption plumes and gas-and-steam plumes during May-August 2023
Nishinoshima, located about 1,000 km S of Tokyo, is a small island in the Ogasawara Arc in Japan. The island is the summit of a massive submarine volcano that has prominent submarine peaks to the S, W, and NE. Eruptions date back to 1973 and the current eruption period began in October 2022. Recent activity has consisted of small ash plumes and fumarolic activity (BGVN 48:07). This report covers activity during May through August 2023, using information from monthly reports of the Japan Meteorological Agency (JMA) monthly reports and satellite data.
Activity during May through June was relatively low. The Japan Coast Guard (JCG) did overflights on 14 and 22 June and reported white gas-and-steam emissions rising 600 m and 1,200 m from the central crater of the pyroclastic cone, respectively (figure 125). In addition, multiple white gas-and-steam emissions rose from the inner rim of the W side of the crater and from the SE flank of the pyroclastic cone. Discolored brown-to-green water was observed around almost the entire perimeter of the island; on 22 June light green discolored water was observed off the S coast of the island.
Observations from the Himawari meteorological satellite confirmed an eruption on 9 and 10 July. An eruption plume rose 1.6 km above the crater and drifted N around 1300 on 9 July. Satellite images acquired at 1420 and 2020 on 9 July and at 0220 on 10 July showed continuing emissions that rose 1.3-1.6 km above the crater and drifted NE and N. The Tokyo VAAC reported that an ash plume seen by a pilot and identified in a satellite image at 0630 on 21 July rose to 3 km altitude and drifted S.
Aerial observations conducted by JCG on 8 August showed a white-and-gray plume rising from the central crater of the pyroclastic cone, and multiple white gas-and-steam emissions were rising from the inner edge of the western crater and along the NW-SE flanks of the island (figure 126). Brown-to-green discolored water was also noted around the perimeter of the island.
Intermittent low-to-moderate power thermal anomalies were recorded in the MIROVA graph (Middle InfraRed Observation of Volcanic Activity), showing an increase in both frequency and power beginning in July (figure 127). This increase in activity coincides with eruptive activity on 9 and 10 July, characterized by eruption plumes. According to the MODVOLC thermal alert algorithm, one thermal hotspot was recorded on 20 July. Weak thermal anomalies were also detected in infrared satellite imagery, accompanied by strong gas-and-steam plumes (figure 128).
Geologic Background. The small island of Nishinoshima was enlarged when several new islands coalesced during an eruption in 1973-74. Multiple eruptions that began in 2013 completely covered the previous exposed surface and continued to enlarge the island. The island is the summit of a massive submarine volcano that has prominent peaks to the S, W, and NE. The summit of the southern cone rises to within 214 m of the ocean surface 9 km SSE.
Information Contacts: Japan Meteorological Agency (JMA), 1-3-4 Otemachi, Chiyoda-ku, Tokyo 100-8122, Japan (URL: http://www.jma.go.jp/jma/indexe.html); Tokyo Volcanic Ash Advisory Center (VAAC), 1-3-4 Otemachi, Chiyoda-ku, Tokyo 100-8122, Japan (URL: http://ds.data.jma.go.jp/svd/vaac/data/); MIROVA (Middle InfraRed Observation of Volcanic Activity), a collaborative project between the Universities of Turin and Florence (Italy) supported by the Centre for Volcanic Risk of the Italian Civil Protection Department (URL: http://www.mirovaweb.it/); Copernicus Browser, Copernicus Data Space Ecosystem, European Space Agency (URL: https://dataspace.copernicus.eu/browser/).
Krakatau (Indonesia) — October 2023 Cite this Report
Krakatau
Indonesia
6.1009°S, 105.4233°E; summit elev. 285 m
All times are local (unless otherwise noted)
White gas-and-steam plumes and occasional ash plumes during May-August 2023
Krakatau is located in the Sunda Strait between Java and Sumatra, Indonesia. Caldera collapse during the catastrophic 1883 eruption destroyed Danan and Perbuwatan cones and left only a remnant of Rakata. The post-collapse cone of Anak Krakatau (Child of Krakatau) was constructed within the 1883 caldera at a point between the former Danan and Perbuwatan cones; it has been the site of frequent eruptions since 1927. The current eruption period began in May 2021 and has recently consisted of Strombolian eruptions and ash plumes (BGVN 48:07). This report describes lower levels of activity consisting of ash and white gas-and-steam plumes during May through August 2023, based on information provided by the Indonesian Center for Volcanology and Geological Hazard Mitigation, referred to as Pusat Vulkanologi dan Mitigasi Bencana Geologi (PVMBG), MAGMA Indonesia, and satellite data.
Activity was relatively low during May and June. Daily white gas-and-steam emissions rose 25-200 m above the crater and drifted in different directions. Five ash plumes were detected at 0519 on 10 May, 1241 on 11 May, 0920 on 12 May, 2320 on 12 May, and at 0710 on 13 May, and rose 1-2.5 km above the crater and drifted SW. A webcam image taken on 12 May showed ejection of incandescent material above the vent. A total of nine ash plumes were detected during 6-11 June: at 1434 and 00220 on 6 and 7 June the ash plumes rose 500 m above the crater and drifted NW, at 1537 on 8 June the ash plume rose 1 km above the crater and drifted SW, at 0746 and at 0846 on 9 June the ash plumes rose 800 m and 3 km above the crater and drifted SW, respectively, at 0423, 1431, and 1750 on 10 June the ash plumes rose 2 km, 1.5 km, and 3.5 km above the crater and drifted NW, respectively, and at 0030 on 11 June an ash plume rose 2 km above the crater and drifted NW. Webcam images taken on 10 and 11 June at 0455 and 0102, respectively, showed incandescent material ejected above the vent. On 19 June an ash plume at 0822 rose 1.5 km above the crater and drifted SE.
Similar low activity of white gas-and-steam emissions and few ash plumes were reported during July and August. Daily white gas-and-steam emissions rose 25-300 m above the crater and drifted in multiple directions. Three ash plumes were reported at 0843, 0851, and 0852 on 20 July that rose 500-2,000 m above the crater and drifted NW.
The MIROVA (Middle InfraRed Observation of Volcanic Activity) graph of MODIS thermal anomaly data showed intermittent low-to-moderate power thermal anomalies during May through August 2023 (figure 140). Although activity was often obscured by weather clouds, a thermal anomaly was visible in an infrared satellite image of the crater on 12 May, accompanied by an eruption plume that drifted SW (figure 141).
Geologic Background. The renowned Krakatau (frequently mis-named as Krakatoa) volcano lies in the Sunda Strait between Java and Sumatra. Collapse of an older edifice, perhaps in 416 or 535 CE, formed a 7-km-wide caldera. Remnants of that volcano are preserved in Verlaten and Lang Islands; subsequently the Rakata, Danan, and Perbuwatan cones were formed, coalescing to create the pre-1883 Krakatau Island. Caldera collapse during the catastrophic 1883 eruption destroyed Danan and Perbuwatan, and left only a remnant of Rakata. This eruption caused more than 36,000 fatalities, most as a result of tsunamis that swept the adjacent coastlines of Sumatra and Java. Pyroclastic surges traveled 40 km across the Sunda Strait and reached the Sumatra coast. After a quiescence of less than a half century, the post-collapse cone of Anak Krakatau (Child of Krakatau) was constructed within the 1883 caldera at a point between the former Danan and Perbuwatan cones. Anak Krakatau has been the site of frequent eruptions since 1927.
Information Contacts: Pusat Vulkanologi dan Mitigasi Bencana Geologi (PVMBG, also known as Indonesian Center for Volcanology and Geological Hazard Mitigation, CVGHM), Jalan Diponegoro 57, Bandung 40122, Indonesia (URL: http://www.vsi.esdm.go.id/); MAGMA Indonesia, Kementerian Energi dan Sumber Daya Mineral (URL: https://magma.esdm.go.id/v1); MIROVA (Middle InfraRed Observation of Volcanic Activity), a collaborative project between the Universities of Turin and Florence (Italy) supported by the Centre for Volcanic Risk of the Italian Civil Protection Department (URL: http://www.mirovaweb.it/); Copernicus Browser, Copernicus Data Space Ecosystem, European Space Agency (URL: https://dataspace.copernicus.eu/browser/).
Villarrica (Chile) — October 2023 Cite this Report
Villarrica
Chile
39.42°S, 71.93°W; summit elev. 2847 m
All times are local (unless otherwise noted)
Strombolian activity, gas-and-ash emissions, and crater incandescence during April-September 2023
Villarrica, in central Chile, consists of a 2-km-wide caldera that formed about 3,500 years ago and is located at the base of the presently active cone at the NW margin of a 6-km-wide caldera. Historical eruptions eruptions date back to 1558 and have been characterized by mild-to-moderate explosive activity with occasional lava effusions. The current eruption period began in December 2014 and has recently consisted of nighttime crater incandescence, ash emissions, and seismicity (BGVN 48:04). This report covers activity during April through September 2023 and describes occasional Strombolian activity, gas-and-ash emissions, and nighttime crater incandescence. Information for this report primarily comes from the Southern Andes Volcano Observatory (Observatorio Volcanológico de Los Andes del Sur, OVDAS), part of Chile's National Service of Geology and Mining (Servicio Nacional de Geología y Minería, SERNAGEOMIN) and satellite data.
Seismicity during April consisted of long period (LP) events and tremor (TRE); a total of 9,413 LP-type events and 759 TR-type events were detected throughout the month. Nighttime crater incandescence persisted and was visible in the degassing column. Sulfur dioxide data was obtained using Differential Absorption Optical Spectroscopy Equipment (DOAS) that showed an average value of 1,450 ± 198 tons per day (t/d) during 1-15 April and 1,129 ± 201 t/d during 16-30 April, with a maximum daily value of 2,784 t/d on 9 April. Gas-and-steam emissions of variable intensities rose above the active crater as high as 1.3 km above the crater on 13 April. Strombolian explosions were not observed and there was a slight decrease in the lava lake level.
There were 14,123 LP-type events and 727 TR-type events detected during May. According to sulfur dioxide measurements taken with DOAS equipment, the active crater emitted an average value of 1,826 ± 482 t/d during 1-15 May and 912 ± 41 t/d during 16-30 May, with a daily maximum value of 5,155 t/d on 13 May. Surveillance cameras showed continuous white gas-and-steam emissions that rose as high as 430 m above the crater on 27 May. Nighttime incandescence illuminated the gas column less than 300 m above the crater rim was and no pyroclastic emissions were reported. A landslide was identified on 13 May on the E flank of the volcano 50 m from the crater rim and extending 300 m away; SERNAGEOMIN noted that this event may have occurred on 12 May. During the morning of 27 and 28 May minor Strombolian explosions characterized by incandescent ejecta were recorded at the crater rim; the last reported Strombolian explosions had occurred at the end of March.
Seismic activity during June consisted of five volcano-tectonic (VT)-type events, 21,606 LP-type events, and 2,085 TR-type events. The average value of sulfur dioxide flux obtained by DOAS equipment was 1,420 ± 217 t/d during 1-15 June and 2,562 ± 804 t/d, with a maximum daily value of 4,810 t/d on 17 June. White gas-and-steam emissions rose less than 480 m above the crater; frequent nighttime crater incandescence was reflected in the degassing plume. On 12 June an emission rose 100 m above the crater and drifted NNW. On 15 June one or several emissions resulted in ashfall to the NE as far as 5.5 km from the crater, based on a Skysat satellite image. Several Strombolian explosions occurred within the crater; activity on 15 June was higher energy and ejected blocks 200-300 m on the NE slope. Surveillance cameras showed white gas-and-steam emissions rising 480 m above the crater on 16 June. On 19 and 24 June low-intensity Strombolian activity was observed, ejecting material as far as 200 m from the center of the crater to the E.
During July, seismicity included 29,319 LP-type events, 3,736 TR-type events, and two VT-type events. DOAS equipment recorded two days of sulfur dioxide emissions of 4,220 t/d and 1,009 t/d on 1 and 13 July, respectively. Constant nighttime incandescence was also recorded and was particularly noticeable when accompanied by eruptive columns on 12 and 16 July. Minor explosive events were detected in the crater. According to Skysat satellite images taken on 12, 13, and 16 July, ashfall deposits were identified 155 m S of the crater. According to POVI, incandescence was visible from two vents on the crater floor around 0336 on 12 July. Gas-and-ash emissions rose as high as 1.2 km above the crater on 13 July and drifted E and NW. A series of gas-and-steam pulses containing some ash deposited material on the upper E flank around 1551 on 13 July. During 16-31 July, average sulfur dioxide emissions of 1,679 ± 406 t/d were recorded, with a maximum daily value of 2,343 t/d on 28 July. Fine ash emissions were also reported on 16, 17, and 23 July.
Seismicity persisted during August, characterized by 27,011 LP-type events, 3,323 TR-type events, and three VT-type events. The average value of sulfur dioxide measurements taken during 1-15 August was 1,642 ± 270 t/d and 2,207 ± 4,549 t/d during 16-31 August, with a maximum daily value of 3,294 t/d on 27 August. Nighttime crater incandescence remained visible in degassing columns. White gas-and-steam emissions rose 480 m above the crater on 6 August. According to a Skysat satellite image from 6 August, ash accumulation was observed proximal to the crater and was mainly distributed toward the E slope. White gas-and-steam emissions rose 320 m above the crater on 26 August. Nighttime incandescence and Strombolian activity that generated ash emissions were reported on 27 August.
Seismicity during September was characterized by five VT-type events, 12,057 LP-type events, and 2,058 TR-type events. Nighttime incandescence persisted. On 2 September an ash emission rose 180 m above the crater and drifted SE at 1643 (figure 125) and a white gas-and-steam plume rose 320 m above the crater. According to the Buenos Aires VAAC, periods of continuous gas-and-ash emissions were visible in webcam images from 1830 on 2 September to 0110 on 3 September. Strombolian activity was observed on 2 September and during the early morning of 3 September, the latter event of which generated an ash emission that rose 60 m above the crater and drifted 100 m from the center of the crater to the NE and SW. Ashfall was reported to the SE and S as far as 750 m from the crater. The lava lake was active during 3-4 September and lava fountaining was visible for the first time since 26 March 2023, according to POVI. Fountains captured in webcam images at 2133 on 3 September and at 0054 on 4 September rose as high as 60 m above the crater rim and ejected material onto the upper W flank. Sulfur dioxide flux of 1,730 t/d and 1,281 t/d was measured on 3 and 4 September, respectively, according to data obtained by DOAS equipment.
Strong Strombolian activity and larger gas-and-ash plumes were reported during 18-20 September. On 18 September activity was also associated with energetic LP-type events and notable sulfur dioxide fluxes (as high as 4,277 t/d). On 19 September Strombolian activity and incandescence were observed. On 20 September at 0914 ash emissions rose 50 m above the crater and drifted SSE, accompanied by Strombolian activity that ejected material less than 100 m SSE, causing fall deposits on that respective flank. SERNAGEOMIN reported that a Planet Scope satellite image taken on 20 September showed the lava lake in the crater, measuring 32 m x 35 m and an area of 0.001 km2. Several ash emissions were recorded at 0841, 0910, 1251, 1306, 1312, 1315, and 1324 on 23 September and rose less than 150 m above the crater. The sulfur dioxide flux value was 698 t/d on 23 September and 1,097 t/d on 24 September. On 24 September the Volcanic Alert Level (VAL) was raised to Orange (the third level on a four-color scale). SENAPRED maintained the Alert Level at Yellow (the middle level on a three-color scale) for the communities of Villarrica, Pucón (16 km N), Curarrehue, and Panguipulli.
During 24-25 September there was an increase in seismic energy (observed at TR-events) and acoustic signals, characterized by 1 VT-type event, 213 LP-type events, and 124 TR-type events. Mainly white gas-and-steam emissions, in addition to occasional fine ash emissions were recorded. During the early morning of 25 September Strombolian explosions were reported and ejected material 250 m in all directions, though dominantly toward the NW. On 25 September the average value of sulfur dioxide flux was 760 t/d. Seismicity during 25-30 September consisted of five VT-type events, 1,937 LP-type events, and 456 TR-type events.
During 25-29 September moderate Strombolian activity was observed and ejected material as far as the crater rim. In addition, ash pulses lasting roughly 50 minutes were observed around 0700 and dispersed ENE. During 26-27 September a TR episode lasted 6.5 hours and was accompanied by discrete acoustic signals. Satellite images from 26 September showed a spatter cone on the crater floor with one vent that measured 10 x 14 m and a smaller vent about 35 m NE of the cone. SERNAGEOMIN reported an abundant number of bomb-sized blocks up to 150 m from the crater, as well as impact marks on the snow, which indicated explosive activity. A low-altitude ash emission was observed drifting NW around 1140 on 28 September, based on webcam images. Between 0620 and 0850 on 29 September an ash emission rose 60 m above the crater and drifted NW. During an overflight taken around 1000 on 29 September scientists observed molten material in the vent, a large accumulation of pyroclasts inside the crater, and energetic degassing, some of which contained a small amount of ash. Block-sized pyroclasts were deposited on the internal walls and near the crater, and a distal ash deposit was also visible. The average sulfur dioxide flux measured on 28 September was 344 t/d. Satellite images taken on 29 September ashfall was deposited roughly 3 km WNW from the crater and nighttime crater incandescence remained visible. The average sulfur dioxide flux value from 29 September was 199 t/d. On 30 September at 0740 a pulsating ash emission rose 1.1 km above the crater and drifted NNW (figure 126). Deposits on the S flank extended as far as 4.5 km from the crater rim, based on satellite images from 30 September.
Infrared MODIS satellite data processed by MIROVA (Middle InfraRed Observation of Volcanic Activity) showed intermittent thermal activity during April through September, with slightly stronger activity detected during late September (figure 127). Small clusters of thermal activity were detected during mid-June, early July, early August, and late September. According to the MODVOLC thermal alert system, a total of four thermal hotspots were detected on 7 July and 3 and 23 September. This activity was also intermittently captured in infrared satellite imagery on clear weather days (figure 128).
Geologic Background. The glacier-covered Villarrica stratovolcano, in the northern Lakes District of central Chile, is ~15 km south of the city of Pucon. A 2-km-wide caldera that formed about 3,500 years ago is located at the base of the presently active, dominantly basaltic to basaltic andesite cone at the NW margin of a 6-km-wide Pleistocene caldera. More than 30 scoria cones and fissure vents are present on the flanks. Plinian eruptions and pyroclastic flows that have extended up to 20 km from the volcano were produced during the Holocene. Lava flows up to 18 km long have issued from summit and flank vents. Eruptions documented since 1558 CE have consisted largely of mild-to-moderate explosive activity with occasional lava effusion. Glaciers cover 40 km2 of the volcano, and lahars have damaged towns on its flanks.
Information Contacts: Servicio Nacional de Geología y Minería (SERNAGEOMIN), Observatorio Volcanológico de Los Andes del Sur (OVDAS), Avda Sta María No. 0104, Santiago, Chile (URL: http://www.sernageomin.cl/); Proyecto Observación Villarrica Internet (POVI) (URL: http://www.povi.cl/); Sistema y Servicio Nacional de Prevención y Repuesta Ante Desastres (SENAPRED), Av. Beauchef 1671, Santiago, Chile (URL: https://web.senapred.cl/); Buenos Aires Volcanic Ash Advisory Center (VAAC), Servicio Meteorológico Nacional-Fuerza Aérea Argentina, 25 de mayo 658, Buenos Aires, Argentina (URL: http://www.smn.gov.ar/vaac/buenosaires/inicio.php); MIROVA (Middle InfraRed Observation of Volcanic Activity), a collaborative project between the Universities of Turin and Florence (Italy) supported by the Centre for Volcanic Risk of the Italian Civil Protection Department (URL: http://www.mirovaweb.it/); Hawai'i Institute of Geophysics and Planetology (HIGP) - MODVOLC Thermal Alerts System, School of Ocean and Earth Science and Technology (SOEST), Univ. of Hawai'i, 2525 Correa Road, Honolulu, HI 96822, USA (URL: http://modis.higp.hawaii.edu/); Copernicus Browser, Copernicus Data Space Ecosystem, European Space Agency (URL: https://dataspace.copernicus.eu/browser/).
Merapi (Indonesia) — October 2023 Cite this Report
Merapi
Indonesia
7.54°S, 110.446°E; summit elev. 2910 m
All times are local (unless otherwise noted)
Frequent incandescent avalanches during April-September 2023
Merapi, located just north of the major city of Yogyakarta in central Java, Indonesia, has had activity within the last 20 years characterized by pyroclastic flows and lahars accompanying growth and collapse of the steep-sided active summit lava dome. The current eruption period began in late December 2020 and has more recently consisted of ash plumes, intermittent incandescent avalanches of material, and pyroclastic flows (BGVN 48:04). This report covers activity during April through September 2023, based on information from Balai Penyelidikan dan Pengembangan Teknologi Kebencanaan Geologi (BPPTKG), the Center for Research and Development of Geological Disaster Technology, a branch of PVMBG which specifically monitors Merapi. Additional information comes from the Pusat Vulkanologi dan Mitigasi Bencana Geologi (PVMBG, also known as Indonesian Center for Volcanology and Geological Hazard Mitigation, CVGHM), MAGMA Indonesia, the Darwin Volcanic Ash Advisory Centre (VAAC), and various satellite data.
Activity during April through September 2023 primarily consisted of incandescent avalanches of material that mainly affected the SW and W flanks and traveled as far as 2.3 km from the summit (table 25) and white gas-and-steam emissions that rose 10-1,000 m above the crater.
Table 25. Monthly summary of avalanches and avalanche distances recorded at Merapi during April through September 2023. The number of reported avalanches does not include instances where possible avalanches were heard but could not be visually confirmed as a result of inclement weather. Data courtesy of BPPTKG (April-September 2023 daily reports).
| Month |
Average number of avalanches per day |
Distance avalanches traveled (m) |
| Apr 2023 |
19 |
1,200-2,000 |
| May 2023 |
22 |
500-2,000 |
| Jun 2023 |
18 |
1,200-2,000 |
| Jul 2023 |
30 |
300-2,000 |
| Aug 2023 |
25 |
400-2,300 |
| Sep 2023 |
23 |
600-2,000 |
BPPTKG reported that during April and May white gas-and-steam emissions rose 10-750 m above the crater, incandescent avalanches descended 500-2,000 m on the SW and W flanks (figure 135). Cloudy weather often prevented clear views of the summit, and sometimes avalanches could not be confirmed. According to a webcam image, a pyroclastic flow was visible on 17 April at 0531. During the week of 28 April and 4 May a pyroclastic flow was reported on the SW flank, traveling up to 2.5 km. According to a drone overflight taken on 17 May the SW lava dome volume was an estimated 2,372,800 cubic meters and the dome in the main crater was an estimated 2,337,300 cubic meters.
During June and July similar activity persisted with white gas-and-steam emissions rising 10-350 m above the crater and frequent incandescent avalanches that traveled 300-2,000 m down the SW, W, and S flanks (figure 136). Based on an analysis of aerial photos taken on 24 June the volume of the SW lava dome was approximately 2.5 million cubic meters. A pyroclastic flow was observed on 5 July that traveled 2.7 km on the SW flank. According to the Darwin VAAC multiple minor ash plumes were identified in satellite images on 19 July that rose to 3.7 km altitude and drifted S and SW. During 22, 25, and 26 July a total of 17 avalanches descended as far as 1.8 km on the S flank.
Frequent white gas-and-steam emissions continued during August and September, rising 10-450 m above the crater. Incandescent avalanches mainly affected the SW and W flanks and traveled 400-2,300 m from the vent (figure 137). An aerial survey conducted on 10 August was analyzed and reported that estimates of the SW dome volume was 2,764,300 cubic meters and the dome in the main crater was 2,369,800 cubic meters.
Frequent and moderate-power thermal activity continued throughout the reporting period, according to a MIROVA (Middle InfraRed Observation of Volcanic Activity) analysis of MODIS satellite data (figure 138). There was an increase in the number of detected anomalies during mid-May. The MODVOLC thermal algorithm recorded a total of 47 thermal hotspots: six during April, nine during May, eight during June, 15 during July, four during August, and five during September. Some of this activity was captured in infrared satellite imagery on clear weather days, sometimes accompanied by incandescent material on the SW flank (figure 139).
Geologic Background. Merapi, one of Indonesia's most active volcanoes, lies in one of the world's most densely populated areas and dominates the landscape immediately north of the major city of Yogyakarta. It is the youngest and southernmost of a volcanic chain extending NNW to Ungaran volcano. Growth of Old Merapi during the Pleistocene ended with major edifice collapse perhaps about 2,000 years ago, leaving a large arcuate scarp cutting the eroded older Batulawang volcano. Subsequent growth of the steep-sided Young Merapi edifice, its upper part unvegetated due to frequent activity, began SW of the earlier collapse scarp. Pyroclastic flows and lahars accompanying growth and collapse of the steep-sided active summit lava dome have devastated cultivated lands on the western-to-southern flanks and caused many fatalities.
Information Contacts: Balai Penyelidikan dan Pengembangan Teknologi Kebencanaan Geologi (BPPTKG), Center for Research and Development of Geological Disaster Technology (URL: http://merapi.bgl.esdm.go.id/, Twitter: @BPPTKG); MAGMA Indonesia, Kementerian Energi dan Sumber Daya Mineral (URL: https://magma.esdm.go.id/v1); Pusat Vulkanologi dan Mitigasi Bencana Geologi (PVMBG, also known as Indonesian Center for Volcanology and Geological Hazard Mitigation, CVGHM), Jalan Diponegoro 57, Bandung 40122, Indonesia (URL: http://www.vsi.esdm.go.id/); Darwin Volcanic Ash Advisory Centre (VAAC), Bureau of Meteorology, Northern Territory Regional Office, PO Box 40050, Casuarina, NT 0811, Australia (URL: http://www.bom.gov.au/info/vaac/); MIROVA (Middle InfraRed Observation of Volcanic Activity), a collaborative project between the Universities of Turin and Florence (Italy) supported by the Centre for Volcanic Risk of the Italian Civil Protection Department (URL: http://www.mirovaweb.it/); Hawai'i Institute of Geophysics and Planetology (HIGP) - MODVOLC Thermal Alerts System, School of Ocean and Earth Science and Technology (SOEST), Univ. of Hawai'i, 2525 Correa Road, Honolulu, HI 96822, USA (URL: http://modis.higp.hawaii.edu/); Copernicus Browser, Copernicus Data Space Ecosystem, European Space Agency (URL: https://dataspace.copernicus.eu/browser/); Øystein Lund Andersen (URL: https://www.oysteinlundandersen.com/, https://twitter.com/oysteinvolcano).
Ebeko
Russia
50.686°N, 156.014°E; summit elev. 1103 m
All times are local (unless otherwise noted)
Moderate explosive activity with ash plumes continued during June-November 2023
Ebeko, located on the N end of Paramushir Island in Russia’s Kuril Islands just S of the Kamchatka Peninsula, consists of three summit craters along a SSW-NNE line at the northern end of a complex of five volcanic cones. Observed eruptions date back to the late 18th century and have been characterized as small-to-moderate explosions from the summit crater, accompanied by intense fumarolic activity. The current eruptive period began in June 2022, consisting of frequent explosions, ash plumes, and thermal activity (BGVN 47:10, 48:06). This report covers similar activity during June-November 2023, based on information from the Kamchatka Volcanic Eruptions Response Team (KVERT) and satellite data.
Moderate explosive activity continued during June-November 2023 (figures 50 and 51). According to visual data from Severo-Kurilsk, explosions sent ash 2-3.5 km above the summit (3-4.5 km altitude) during most days during June through mid-September. Activity after mid-September was slightly weaker, with ash usually reaching less than 2 km above the summit. According to KVERT the volcano in October and November was, with a few exceptions, either quiet or obscured by clouds that prevented satellite observations. KVERT issued Volcano Observatory Notices for Aviation (VONA) on 8 and 12 June, 13 and 22 July, 3 and 21 August, and 31 October warning of potential aviation hazards from ash plumes drifting 3-15 km from the volcano. Based on satellite data, KVERT reported a persistent thermal anomaly whenever weather clouds permitted viewing.
Geologic Background. The flat-topped summit of the central cone of Ebeko volcano, one of the most active in the Kuril Islands, occupies the northern end of Paramushir Island. Three summit craters located along a SSW-NNE line form Ebeko volcano proper, at the northern end of a complex of five volcanic cones. Blocky lava flows extend west from Ebeko and SE from the neighboring Nezametnyi cone. The eastern part of the southern crater contains strong solfataras and a large boiling spring. The central crater is filled by a lake about 20 m deep whose shores are lined with steaming solfataras; the northern crater lies across a narrow, low barrier from the central crater and contains a small, cold crescentic lake. Historical activity, recorded since the late-18th century, has been restricted to small-to-moderate explosive eruptions from the summit craters. Intense fumarolic activity occurs in the summit craters, on the outer flanks of the cone, and in lateral explosion craters.
Information Contacts: Kamchatka Volcanic Eruptions Response Team (KVERT), Far Eastern Branch, Russian Academy of Sciences, 9 Piip Blvd., Petropavlovsk-Kamchatsky, 683006, Russia (URL: http://www.kscnet.ru/ivs/kvert/).
Search Bulletin Archive by Publication Date
Select a month and year from the drop-downs and click "Show Issue" to have that issue displayed in this tab.
The default month and year is the latest issue available.
Bulletin of the Global Volcanism Network - Volume 44, Number 05 (May 2019)
Managing Editor: Edward Venzke
Kadovar (Papua New Guinea)
Ash emissions and thermal anomalies during October 2018-April 2019; lava emissions at the E flank coast and summit area
Karangetang (Indonesia)
Activity at two craters with the N crater producing ash plumes, avalanches, pyroclastic flows, and lava flows that reached the ocean in February 2019
Karymsky (Russia)
Moderate explosive activity starting mid-February 2019
Mayon (Philippines)
Intermittent ash emissions; persistent summit incandescence, October 2018-April 2019
Nyamulagira (DR Congo)
Lava lake reappears in central crater in April 2018; activity tapers off during April 2019
Nyiragongo (DR Congo)
Lava lake remains active through May 2019; three new vents around the secondary cone
Poas (Costa Rica)
Weak ash emissions and disappearance of the crater lake
Sangeang Api (Indonesia)
Ongoing frequent explosions with ash plumes, Strombolian activity, and block avalanches, November 2018-April 2019
Sheveluch (Russia)
Renewed activity with lava dome growth and ash explosions starting in late December 2018
Tengger Caldera (Indonesia)
New explosions with ash plumes from Bromo Cone mid-February-April 2019
Kadovar (Papua New Guinea) — May 2019 Cite this Report
Kadovar
Papua New Guinea
3.608°S, 144.588°E; summit elev. 365 m
All times are local (unless otherwise noted)
Ash emissions and thermal anomalies during October 2018-April 2019; lava emissions at the E flank coast and summit area
Steeply-sloped Kadovar Island is located about 25 km NNE from the mouth of the Sepik River on the mainland of Papua New Guinea. The first confirmed historical eruption with ash plumes and lava extrusion began in early January 2018, resulting in the evacuation of around 600 residents from the N side of the approximately 1.4-km-diameter island (BGVN 43:03); continuing activity from October 2018 through April 2019 is covered in this report. Information was provided by the Rabaul Volcano Observatory (RVO), the Darwin Volcanic Ash Advisory Center (VAAC), satellite sources, and photos from visiting tourists.
Activity during March-September 2018. After the first recorded explosions with ash plumes in early January 2018, intermittent ash plumes continued through March 2018. A lava flow on the E flank extended outward from the island, extruding from a vent low on the E flank and forming a dome just offshore. The dome collapsed and regrew twice during February 2018; the growth rate slowed somewhat during March. A satellite image from 21 March 2018 was one of the first showing the new dome growing off the E flank with a thermal anomaly and sediment plumes in the water drifting N and E from the area. Thermal anomalies were visible at both the summit vent and the E-flank coastal dome in April and May 2018, along with steam and gas rising from both locations (figure 19).
A trip to Kadovar by tourists in mid-May 2018 provided close-up views of the dense steam plumes at the summit and the growing E-flank coastal dome (figures 20 and 21). The thermal anomaly was still strong at the E-flank coastal dome in a mid-June satellite image, but appeared diminished in late July. Intermittent puffs of steam rose from both the summit and the coastal dome in mid-June; the summit plume was much denser on 29 July (figure 22). Ash emissions were reported by the Darwin VAAC and photographed by tourists during June (figure 23) and September 2018 (BGVN 43:10), but thermal activity appeared to decline during that period (figure 24).
Multiple satellite images during August and early September 2018 showed little or no sign of thermal activity at the E-flank coastal dome, with only intermittent steam plumes from the summit. A new steam plume on the eastern slope appeared in a 22 September 2018 image (figure 25). The Rabaul Volcano Observatory (RVO) reported explosive activity on the afternoon of 21 September. Noises of explosions were accompanied by dark gray and brown ash clouds that rose several hundred meters above the summit crater and drifted NW. Local reports indicated that the activity continued through 26 September and ashfall was reported on Blupblup island during the period. Ground observers noted incandescence visible from both the summit and the E-flank coastal dome.
Activity during October-December 2018. Evidence of both thermal and explosive activity reappeared in October 2018 (figure 24). The Darwin VAAC reported intermittent ash plumes rising to 2.7 km altitude and drifting W on 1 October 2018. Low-level continuous ash emissions rising less than a kilometer and drifting W were reported early on 3 October. A higher plume drifted WNW at 2.4 km altitude on 7 October. Intermittent discrete emissions of ash continued daily at that altitude through 16 October, drifting NW or W. Ash emissions drifting NW and thermal anomalies at the summit were visible in satellite imagery on 2 and 12 October (figure 26). A brief ash emission was reported on 21 October 2018 at 2.4 km altitude drifting NE for a few hours. Intermittent ash emissions also appeared on 29 October moving SE at 1.8 km altitude. For the following three days ash drifted SW, W, then NW at 2.1 km altitude, finally dissipating on 1 November; the thermal anomaly at the summit was large and intense in satellite images on 27 October and 1 November compared with previous images (figure 27).
An ash explosion was photographed by tourists on a cruise ship on the afternoon of 6 November 2018 (figure 28). After the explosion, a dense steam plume rose from a large dome of lava near the summit at the top of the E flank (figure 29). Continuous ash emissions rising to 1.8 km altitude were reported by the Darwin VAAC beginning on 9 November 2018 moving WNW and lasting about 24 hours. A new ash plume clearly identifiable on satellite imagery appeared on 13 November at 2.4 km altitude moving E, again visible for about 24 hours. Another shipboard tourist photographed an ash plume on 18 November rising a few hundred meters above the summit (figure 30).
Low-level ash emissions were reported briefly on 28 November at about 1 km altitude moving SE. Intermittent puffs of ash were seen drifting WSW on 2 and 3 December at about 1.2 km altitude. They were the last VAAC reports for 2018. Two thermal anomalies were visible at the summit in satellite imagery on 26 November, they grew larger and more intense through 16 December when multiple anomalies appeared at the summit and on the E flank (figure 31).
Activity during January-April 2019. Multiple thermal anomalies were still visible at the summit in satellite imagery on 5 January 2019 as regular puffs of steam drifted SE from the summit, leaving a long trail in the atmosphere (figure 32). Additional imagery on 10 and 30 January showed a single anomaly at the summit, even through dense meteorologic clouds. A short-lived ash emission rose to 2.4 km altitude on 11 January 2019 and drifted E; it dissipated the next day. Multiple minor intermittent discrete ash plumes extended WNW at 3.0 km altitude on 18 January; they dissipated within six hours.
The Royal New Zealand Air Force released images of eruptive activity on 10 February 2019 (figure 33). Satellite imagery in February was largely obscured by weather; two thermal anomalies were barely visible through clouds at the summit on 14 February. The Darwin VAAC reported an ash emission at 1.8 km altitude drifting ESE on 16 February; a similar plume appeared on 21 February that also dissipated in just a few hours.
Satellite imagery on 1 March 2019 confirmed a strong thermal anomaly from the summit and down the E flank almost to the coast. A month later on 5 April the anomaly was nearly as strong and a dense ash and steam plume drifted N from the summit (figure 34). A tourist witnessed a dense steam plume rising from the summit on 4 April (figure 35). Multiple discrete eruptions were observed in satellite imagery by the Darwin VAAC on 9 April at 1.2-1.5 km altitude drifting SE. The thermal anomaly at the summit persisted in satellite imagery taken on 15 April 2019.
Geologic Background. The 2-km-wide island of Kadovar is the emergent summit of a Bismarck Sea stratovolcano of Holocene age. It is part of the Schouten Islands, and lies off the coast of New Guinea, about 25 km N of the mouth of the Sepik River. Prior to an eruption that began in 2018, a lava dome formed the high point of the andesitic volcano, filling an arcuate landslide scarp open to the south; submarine debris-avalanche deposits occur in that direction. Thick lava flows with columnar jointing forms low cliffs along the coast. The youthful island lacks fringing or offshore reefs. A period of heightened thermal phenomena took place in 1976. An eruption began in January 2018 that included lava effusion from vents at the summit and at the E coast.
Information Contacts: Rabaul Volcano Observatory (RVO), Geohazards Management Division, Department of Mineral Policy and Geohazards Management (DMPGM), PO Box 3386, Kokopo, East New Britain Province, Papua New Guinea; Sentinel Hub Playground (URL: https://www.sentinel-hub.com/explore/sentinel-playground); MIROVA (Middle InfraRed Observation of Volcanic Activity), a collaborative project between the Universities of Turin and Florence (Italy) supported by the Centre for Volcanic Risk of the Italian Civil Protection Department (URL: http://www.mirovaweb.it/); Tico Liu, Hong Kong (Facebook: https://www.facebook.com/tico.liu. https://www.facebook.com/photo.php?fbid=10155389178192793&set=pcb.10155389178372793&type=3&theater); Shari Kalt (Instagram user LuxuryTravelAdvisor: https://www.instagram.com/luxurytraveladviser/, https://www.instagram.com/p/BkhalnuHu2j/); Coral Expeditions, Australia (URL: https://www.coralexpeditions.com/, Facebook: https://www.facebook.com/coralexpeditions); Philip Stern (Facebook: https://www.facebook.com/sternph, https://www.facebook.com/sternph/posts/2167501866616908); Brad Scott, GNS Science Volcanologist at GNS Science, New Zealand (Twitter: https://twitter.com/Eruptn); Chaiyasit Saengsirirak, Bangkok, Thailand (Facebook: https://www.facebook.com/chaiyasit.saengsirirak, https://www.facebook.com/photo.php?fbid=2197513186969355).
Karangetang (Indonesia) — May 2019 Cite this Report
Karangetang
Indonesia
2.781°N, 125.407°E; summit elev. 1797 m
All times are local (unless otherwise noted)
Activity at two craters with the N crater producing ash plumes, avalanches, pyroclastic flows, and lava flows that reached the ocean in February 2019
Karangetang (also referred to as Api Siau) is an active volcano on the island of Siau in the Sitaro Regency, North Sulawesi, Indonesia. It produces frequent small eruptions that include gas-and-steam plumes, ash plumes, avalanches, lava flows, incandescent ballistic ejecta, and pyroclastic flows. This report covers May 2018-April 2019 and summarizes reports by Indonesia's Pusat Vulkanologi dan Mitigasi Bencana Geologi (PVMBG, also known as CVGHM, or the Center of Volcanology and Geological Hazard Mitigation), and the Darwin VAAC (Volcanic Ash Advisory Center), and satellite data. During this time, increased activity resulted in a lava flow that reached the ocean and cut road access to communities.
No activity was reported during May through October 2018. During this time, Sentinel-2 thermal images showed elevated temperatures in the main active crater and gas-and-steam plumes dispersing in different directions (figure 17). On 4 July, the Darwin VAAC reported a "weak" ash plume to an altitude of 3 km that drifted NE, only based on satellite imagery. There were few thermal signatures detected by the MIROVA algorithm from May through November (figure 18).
Steam plumes were observed from two craters during November 2018 (figures 19 and 20). There was a significant increase in seismicity on 22 to 23 November, followed by a sharp decline on the 24th. The first MODVOLC thermal alert was issued on 25 November. At 1314 on 25 November an ash plume rose to at least 500 m above the N crater and the Aviation Color Code was raised to Orange. A Sentinel-2 thermal image acquired on this day showed elevated temperatures at both south and north craters, with accompanying gas-and-steam plumes. After the increase in seismicity and detected thermal energy, activity progressed to lava flow extrusion, avalanches, and pyroclastic flows triggered from the lava flow. The lava flow originated from the north crater (Kawah Dua) and moved towards the NNW. Avalanches accompanied the flow from the crater and down the lava flow surface. The Volcano Alert level was increased from II to III on 20 December at 1800 (on a scale of I to IV).
Throughout January 2019 activity consisted of small ash plumes up to 600 m above the N crater (figure 21) and continued lava flow activity. On 17 January Kompas TV reported that heavy ashfall impacted several villages. Lava and avalanches traveled as far as 0.7-1 km W towards the Sumpihi River and 1-2 km NE down the Kali Batuare throughout the month.
Video taken on 3 February 2019 shows the lava flow covering the road and continuing down the steep slope with multi-meter-scale incandescent blocky lava fragments on the surface dislodging and triggering small avalanches. By 5 February the lava flow reached over 3.5 km down the Malebuhe River drainage on the NW flank and into the ocean where a lava delta was growing with dense steam plume rising above by the 11th (figures 22-26). Drone footage from 9 February shows the lava flow across the section of road had a width of about 160 m and a width of about 140 m at the coast. Gas-and-steam and ash plumes were noted most days, reaching up to 600 m above the crater and dominantly dispersing to the E (figure 27). By 11 February there had been 190 people evacuated.
On 13 February 2019 avalanches continued from the northern crater to 700-1000 m W towards the Sumpihi River and 1-2 km NE towards Kali Batuare. KOMPAS TV reported a statement by PVMBG describing a decrease in activity, including lava avalanches, but with elevated seismicity on the 12 February. Throughout this period of elevated activity both seismicity (figure 28), along with plume heights and directions (figure 29), were variable. On 22 February the Darwin VAAC reported an ash plume, due to a pyroclastic flow, rising to an altitude of 3.7 km.
Throughout March 2019 PVMBG reported the continuation of a low rate of lava effusion at the north crater, avalanches, and gas-and-steam plumes rising up to 500 m above the crater. The Darwin VAAC reported an ash plume on 7 March that rose to an altitude of 2.7 km that dispersed to the SW. Minor ash emissions were reported by the Darwin VAAC on 6 April that rose to 2.1 km altitude and drifted SE. In mid-April, activity increased in the southern crater and on 15 April a pyroclastic flow traveled 2 km towards the Kahetang and Batuawang rivers. Another ash advisory was issued for an ash plume up to 2.4 km altitude on 16 April. Small gas-and-steam plumes continued through the month.
Geologic Background. Karangetang (Api Siau) volcano lies at the northern end of the island of Siau, about 125 km NNE of the NE-most point of Sulawesi. The stratovolcano contains five summit craters along a N-S line. It is one of Indonesia's most active volcanoes, with more than 40 eruptions recorded since 1675 and many additional small eruptions that were not documented (Neumann van Padang, 1951). Twentieth-century eruptions have included frequent explosive activity sometimes accompanied by pyroclastic flows and lahars. Lava dome growth has occurred in the summit craters; collapse of lava flow fronts have produced pyroclastic flows.
Information Contacts: Pusat Vulkanologi dan Mitigasi Bencana Geologi (PVMBG, also known as Indonesian Center for Volcanology and Geological Hazard Mitigation, CVGHM), Jalan Diponegoro 57, Bandung 40122, Indonesia (URL: http://www.vsi.esdm.go.id/); MAGMA Indonesia, Kementerian Energi dan Sumber Daya Mineral (URL: https://magma.vsi.esdm.go.id/); Badan Nasional Penanggulangan Bencana (BNPB), National Disaster Management Agency, Graha BNPB - Jl. Scout Kav.38, East Jakarta 13120, Indonesia (URL: http://www.bnpb.go.id/); Darwin Volcanic Ash Advisory Centre (VAAC), Bureau of Meteorology, Northern Territory Regional Office, PO Box 40050, Casuarina, NT 0811, Australia (URL: http://www.bom.gov.au/info/vaac/); Sentinel Hub Playground (URL: https://www.sentinel-hub.com/explore/sentinel-playground); MIROVA (Middle InfraRed Observation of Volcanic Activity), a collaborative project between the Universities of Turin and Florence (Italy) supported by the Centre for Volcanic Risk of the Italian Civil Protection Department (URL: http://www.mirovaweb.it/); Hawai'i Institute of Geophysics and Planetology (HIGP) - MODVOLC Thermal Alerts System, School of Ocean and Earth Science and Technology (SOEST), Univ. of Hawai'i, 2525 Correa Road, Honolulu, HI 96822, USA (URL: http://modis.higp.hawaii.edu/); Agence France-Presse (URL: http://www.afp.com/); Kompas TV, Menara Kompas Lt. 6, Jl. Palmerah Selatan No.21, Jakarta Pusat 10270 Indonesia (URL: https://www.kompas.tv/article/39190/abu-gunung-karangetang-tutup-permukiman-warga); The New Indian Express (URL: http://www.newindianexpress.com/world/2019/feb/08/emergency-declared-on-indonesian-island-after-volcanic-eruption-1936173.html); Øystein Lund Andersen (Twitter: @OysteinLAnderse, https://twitter.com/OysteinLAnderse, URL: https://www.oysteinlundandersen.com).
Karymsky
Russia
54.049°N, 159.443°E; summit elev. 1513 m
All times are local (unless otherwise noted)
Moderate explosive activity starting mid-February 2019
Karymsky exhibited decreased volcanism from late October 2018 through mid-February 2019. Previously reported activity consisted of thermal anomalies, gas-and-steam emissions, and ash plumes. Moderate eruptive activity last occurred in September to early October 2018, which featured thermal anomalies and some ash plumes. Activity then decreased, involving primarily moderate gas-and-steam activity. This reporting period of February-April 2019 describes renewed volcanism involving moderate explosive-eruptive activity, thermal anomalies, and moderate gas-and-steam emissions, according to the Kamchatka Volcanic Eruptions Response Team (KVERT).
Volcanism increased on 16 February 2019 when moderate eruptive activity produced an ash plume that extended for about 55 km SE; KVERT reported that satellite data showed the appearance of a thermal anomaly. Moderate explosive activity and moderate gas-and-steam emissions continued through April 2019. On 22 and 24-26 February 2019, ash plumes rose to an altitude of 3.5 km; satellite data showed ash clouds drifting up to a maximum 216 km, generally E (figure 43). Ash plumes tended to drift 17-190 km during this reporting period. During 8-12 March an ash plume rose to a maximum altitude of 4 km, drifting 100 km E from the volcano.
Thermal anomalies were registered by KVERT satellite data on ten days in February, six days in March, and 11 days in April. Low-power thermal anomalies identified by MIROVA continued to appear intermittently throughout the reporting period. Thermal alerts based on MODIS satellite instruments analyzed using the MODVOLC algorithm were rare; the only hotspot pixel recorded during this report period was on 10 March 2019, located proximal to the crater summit.
Geologic Background. Karymsky, the most active volcano of Kamchatka's eastern volcanic zone, is a symmetrical stratovolcano constructed within a 5-km-wide caldera that formed during the early Holocene. The caldera cuts the south side of the Pleistocene Dvor volcano and is located outside the north margin of the large mid-Pleistocene Polovinka caldera, which contains the smaller Akademia Nauk and Odnoboky calderas. Most seismicity preceding Karymsky eruptions originated beneath Akademia Nauk caldera, located immediately south. The caldera enclosing Karymsky formed about 7600-7700 radiocarbon years ago; construction of the stratovolcano began about 2000 years later. The latest eruptive period began about 500 years ago, following a 2300-year quiescence. Much of the cone is mantled by lava flows less than 200 years old. Historical eruptions have been vulcanian or vulcanian-strombolian with moderate explosive activity and occasional lava flows from the summit crater.
Information Contacts: Kamchatka Volcanic Eruptions Response Team (KVERT), Far Eastern Branch, Russian Academy of Sciences, 9 Piip Blvd., Petropavlovsk-Kamchatsky, 683006, Russia (URL: http://www.kscnet.ru/ivs/kvert/); Institute of Volcanology and Seismology, Far Eastern Branch, Russian Academy of Sciences (IVS FEB RAS), 9 Piip Blvd., Petropavlovsk-Kamchatsky 683006, Russia (URL: http://www.kscnet.ru/ivs/eng/); Hawai'i Institute of Geophysics and Planetology (HIGP) - MODVOLC Thermal Alerts System, School of Ocean and Earth Science and Technology (SOEST), Univ. of Hawai'i, 2525 Correa Road, Honolulu, HI 96822, USA (URL: http://modis.higp.hawaii.edu/); MIROVA (Middle InfraRed Observation of Volcanic Activity), a collaborative project between the Universities of Turin and Florence (Italy) supported by the Centre for Volcanic Risk of the Italian Civil Protection Department (URL: http://www.mirovaweb.it/).
Mayon
Philippines
13.257°N, 123.685°E; summit elev. 2462 m
All times are local (unless otherwise noted)
Intermittent ash emissions; persistent summit incandescence, October 2018-April 2019
Steep-sloped and symmetrical Mayon has recorded historical eruptions back to 1616 that range from Strombolian fountaining to basaltic and andesitic flows, as well as large ash plumes, and devastating pyroclastic flows and lahars. A phreatic explosion with an ash plume in mid-January 2018 began the latest eruptive episode which included the growth of a lava dome with pyroclastic flows down the flanks and lava fountaining (BGVN 43:04). Activity tapered off during March; occasional ash emissions continued through August 2018. Minor ash emissions and summit incandescence were intermittent from October 2018-April 2019, the period covered in this report. Information is provided primarily by the Philippine Institute of Volcanology and Seismology (PHIVOLCS).
Pyroclastic density currents were reported in early November 2018; ash plumes were produced from phreatic events a few times during both November and December 2018. Emissions produced SO2 anomalies during January-March 2019; a series of events in early March generated several small ash plumes. Satellite images showing a thermal anomaly at the summit were recorded multiple times each month from October 2018-April 2019 (figure 44).
Very little activity was reported at Mayon during October 2018. Steam plumes rose daily from 250-750 m above the summit before drifting with the prevailing winds and dissipating. Incandescence was observed at the summit most nights during the month, and seismicity remained low with only a few earthquakes reported. Leveling data obtained during 30 August-3 September indicated significant short-term deflation of the volcano relative to 17-24 July 2018. New leveling data obtained on 22-31 October indicated inflation of the SE quadrant and short-term deflation on the N flank relative to the 30 August-3 September data. The volcano remained inflated compared with 2010 baseline data. Electronic tilt data showed pronounced inflation of the mid-slopes beginning 25 June 2018.
Activity increased during November 2018. In addition to steam plumes rising to 750 m and an incandescent glow at the summit most nights, pyroclastic density currents and ash plumes were reported. The seismic monitoring network recorded pyroclastic density currents on 5 and 6 November. On 8 November around noontime, a small, short-lived brownish ash plume, associated with degassing, drifted WSW from the summit. A seismic event on the morning of 11 November was associated with a short-lived fountaining event that produced a brownish-gray ash plume that drifted SW. Another similar plume was reported on the morning of 12 November, also drifting SW before dissipating. Two phreatic events were observed on the morning of 26 November. They produced grayish to grayish-white ash plumes that rose 300-500 m above the summit before drifting SW. The following morning, another event produced a grayish ash plume 500 m above the summit that drifted SW. On 30 November a 1-minute-long ash emission event produced a grayish white plume that also drifted SW.
Steam plume emissions and incandescence at night continued at Mayon during December 2018. The seismic network recorded a four-minute-long event shortly after noon on 9 December that produced a grayish-brown ash plume which drifted W. Precise leveling data obtained on 8-13 December 2018 indicated a slight inflation of the volcano relative to 22-31 October 2018. A 30-second-long ash emission event in the afternoon on 18 December produced a brownish ash plume. Two phreatic events were observed on the morning of 27 December. They produced grayish to grayish-white ash plumes that rose 600 and 200 m above the summit, before drifting SW (figure 45).
Very little surface activity except for white steam-laden plumes that crept downslope and drifted NW or SW was noted during January 2019. Incandescence at the summit, visible with the naked eye, became more frequent during February 2019, along with continued steam plumes. Precise leveling data obtained on 25 January-3 February 2019 indicated a slight deflation relative to 8-13 December 2018. However, continuous GPS and electronic tilt data showed inflation of the mid-slopes since June 2018. Small SO2 plumes were detected by the TROPOMI satellite instrument a few times during January-March 2019 (figure 46).
Steam plumes rose 250-500 m above the summit and drifted generally W in early March 2019; incandescence continued daily at the summit. Phreatic events occurred on 7 and 8 March, producing ash plumes that rose 500 and 300 m from the summit before drifting SW (figure 47). Three more phreatic events occurred on the afternoon of 12 March; they produced light brown to grayish ash plumes that rose 500, 1,000, and 500 m, respectively, and drifted SW. Six phreatic events occurred throughout the day on 13 March, producing ash plumes that rose 200-700 m above the summit and drifted W. A single explosion the next day produced a 500-m-tall ash plume. The Tokyo VAAC reported an ash plume visible for several hours in satellite imagery drifting W at 3.7 km altitude on 13 March (UTC). An increase in the daily number of rockfall events from 1-2 per day to 5-10 per day was noted during the second half of March. Precise leveling data obtained on 20-26 March 2019 indicated a slight inflation relative to 25 January-3 February 2019.
Steam plumes drifted SW or NW throughout April, rising 200-400 m from the summit. Incandescence could be observed at night for the first half of the month. Leveling data obtained during 9-17 April 2019 indicated a slight inflation relative to 20-26 March 2019. Seismicity remained low during the month with only occasional volcanic earthquakes and rockfall events. Lenticular clouds around the summit were observed (figure 48), but these are an unusual meteorological occurrence caused by weather conditions not related to volcanic activity.
Geologic Background. Symmetrical Mayon, which rises above the Albay Gulf NW of Legazpi City, is the most active volcano of the Philippines. The steep upper slopes are capped by a small summit crater. Recorded eruptions since 1616 CE range from Strombolian to basaltic Plinian, with cyclical activity beginning with basaltic eruptions, followed by longer periods of andesitic lava flows. Eruptions occur predominately from the central conduit and have also produced lava flows that travel far down the flanks. Pyroclastic density currents and mudflows have commonly swept down many of the approximately 40 ravines that radiate from the summit and have often damaged populated lowland areas. A violent eruption in 1814 killed more than 1,200 people and devastated several towns.
Information Contacts: Philippine Institute of Volcanology and Seismology (PHIVOLCS), Department of Science and Technology, University of the Philippines Campus, Diliman, Quezon City, Philippines (URL: http://www.phivolcs.dost.gov.ph/); Global Sulfur Dioxide Monitoring Page, Atmospheric Chemistry and Dynamics Laboratory, NASA Goddard Space Flight Center (NASA/GSFC), 8800 Greenbelt Road, Goddard, Maryland, USA (URL: https://so2.gsfc.nasa.gov/); Tokyo Volcanic Ash Advisory Center (VAAC), 1-3-4 Otemachi, Chiyoda-ku, Tokyo, Japan (URL: http://ds.data.jma.go.jp/svd/vaac/data/); Sentinel Hub Playground (URL: https://www.sentinel-hub.com/explore/sentinel-playground); Twitter user "Ivan", Naga City, Philippines (URL: https://twitter.com/ivanxlcsn); Twitter user "k i t", Legazpi City, Philippines (URL: https://twitter.com/jddmgc); Twitter user "georgianne", Costa Leona, Philippines (URL: https://twitter.com/xolovesgia_).
Nyamulagira (DR Congo) — May 2019 Cite this Report
Nyamulagira
DR Congo
1.408°S, 29.2°E; summit elev. 3058 m
All times are local (unless otherwise noted)
Lava lake reappears in central crater in April 2018; activity tapers off during April 2019
The Virunga Volcanic Province (VVP) in the Democratic Republic of the Congo is part of the western branch of the East African Rift System. Nyamuragira (or Nyamulagira), a high-potassium basaltic shield volcano on the W edge of VVP, includes a lava field that covers over 1,100 km2 and contains more than 100 flank cones in addition to a large central crater (see figure 56, BGVN 42:06). A lava lake that had been active for many years emptied from the central crater in 1938. Numerous flank eruptions were observed after that time, the most recent during November 2011-March 2012 on the NE flank. This was followed by a period of degassing with unusually SO2-rich plumes from April 2012 through April 2014 (BGVN 42:06). The lava lake reappeared during July 2014-April 2016 and November 2016-May 2017, producing a strong thermal signature. After a year of quiet, a new lava lake appeared in April 2018, reported below (through May 2019) with information provided by the Observatoire Volcanologique de Goma (OVG), MONUSCO (the United Nations Organization working in the area), and satellite data and imagery from multiple sources.
Fresh lava reappeared inside the summit crater in mid-April 2018 from a lava lake and adjacent spatter cone. Satellite imagery and very limited ground-based observations suggested that intermittent pulses of activity from both sources produced significant lava flows within the summit crater through April 2019 when the strength of the thermal signal declined significantly. Images from May 2019 showed a smaller but persistent thermal anomaly within the crater.
Activity from October 2017-May 2019. Indications of thermal activity tapered off in May 2017 (BGVN 42:11). On 20 October 2017 OVG released a communication stating that a brief episode of unspecified activity occurred on 17 and 18 October, but the volcano returned to lower activity levels on 20 October. There was no evidence of thermal activity during the month. The volcano remained quiet with no reports of thermal activity until April 2018 (figure 66).
OVG reported the new lava emissions beginning on 14 April 2018 as appearing from both the lava lake and a small adjacent spatter cone (figure 67). The first satellite image showing thermal activity at the summit appeared on 18 April 2018 (figure 68) and coincided with the abrupt beginning of strong MIROVA thermal signals (figure 69). MODVOLC thermal alerts also first appeared on 18 April 2018. An image of the active crater taken on 9 May 2018 showed the lake filled with fresh lava and two adjacent incandescent spatter cones (figure 70).
Satellite images confirmed that ongoing activity from the lava lake remained strong during June -September 2018 (figure 71). A mission to Nyamuragira was carried out by helicopter provided by MONUSCO on 20 July 2018; lava lake activity was observed along with gas emissions from the small spatter cone (figure 72). OVG reported increased volcanic seismicity during 1-3 and 10-17 September 2018, and also during October, located in the crater area, mostly at depths of 0-5 km.
Personnel from OVG and MONUSCO (United Nations Organization Stabilization Mission in DR Congo) made site visits on 11 October and 2 November 2018 and concluded that the level of the active lava lake had increased during that time (figure 73). On 2 November OVG measured the height from the base of the active cone to the W rim of the crater as 58 m (figure 74).
Seismicity remained high during November 2018 but decreased significantly during December. Instrument and access issues in January 2019 prevented accurate assessment of seismicity for the month. The lava lake remained active with periodic surges of thermal activity during November 2018-March 2019 (figure 75). Multiple images show incandescence in multiple places within the crater, suggesting significant fresh overflowing lava.
On 12 April 2019 a Ukrainian Aviation Unit supported by MONUSCO provided support for scientists visiting the crater for observations and seismic analysis. Satellite data confirmed ongoing thermal activity into May, although the strength of the signal appeared to decrease (figure 76). MODVOLC thermal alerts ceased after 8 April, and the MIROVA thermal data also confirmed a decrease in the strength of the thermal signal during April 2019 (figure 77).
Geologic Background. Africa's most active volcano, Nyamulagira (also known as Nyamuragira), is a massive high-potassium basaltic shield about 25 km N of Lake Kivu and 13 km NNW of the steep-sided Nyiragongo volcano. The summit is truncated by a small 2 x 2.3 km caldera that has walls up to about 100 m high. Documented eruptions have occurred within the summit caldera, as well as from the numerous flank fissures and cinder cones. A lava lake in the summit crater, active since at least 1921, drained in 1938, at the time of a major flank eruption. Recent lava flows extend down the flanks more than 30 km from the summit as far as Lake Kivu; extensive lava flows from this volcano have covered 1,500 km2 of the western branch of the East African Rift.
Information Contacts: Observatoire Volcanologique de Goma (OVG), Departement de Geophysique, Centre de Recherche en Sciences Naturelles, Lwiro, D.S. Bukavu, DR Congo; Katcho Karume, Director; Sentinel Hub Playground (URL: https://www.sentinel-hub.com/explore/sentinel-playground); MIROVA (Middle InfraRed Observation of Volcanic Activity), a collaborative project between the Universities of Turin and Florence (Italy) supported by the Centre for Volcanic Risk of the Italian Civil Protection Department (URL: http://www.mirovaweb.it/); Hawai'i Institute of Geophysics and Planetology (HIGP) - MODVOLC Thermal Alerts System, School of Ocean and Earth Science and Technology (SOEST), Univ. of Hawai'i, 2525 Correa Road, Honolulu, HI 96822, USA (URL: http://modis.higp.hawaii.edu/); MONUSCO, United Nations Organization Stabilization Mission in the DR Congo (URL: https://monusco.unmissions.org/en/, Twitter: @MONUSCO); Cultur Volcan, Journal d'un volcanophile (URL: https://laculturevolcan.blogspot.com), Twitter: @CultureVolcan).
Nyiragongo (DR Congo) — May 2019 Cite this Report
Nyiragongo
DR Congo
1.52°S, 29.25°E; summit elev. 3470 m
All times are local (unless otherwise noted)
Lava lake remains active through May 2019; three new vents around the secondary cone
Since at least 1971 scientists and tourists have observed a lava lake within the Nyiragongo summit crater. Lava flows have been a hazard in the past for the nearby city of Goma (15 km S). The previous report (BGVN 43:06) of activity between November 2017 and May 2018 described nearly daily record of thermal anomalies due to the active lava lake and lava fountaining, gas-and-steam plumes, and the opening of a new vent within the crater in February 2016. Monthly reports from the Observatoire Volcanologique de Goma (OVG) disseminate information regarding the volcano's activity. This report updates the activity during June 2018-May 2019.
OVG noted that the level of the lava lake changes frequently, and was lower when observed on October 2018, 12 April 2019, and 12 May 2019. According to data from the OVG, on 15 April 2019 the secondary cone that formed in February 2016 produced lava flows and ejecta. In addition, at least three other vents formed surrounding this secondary cone. During most of April 2019 the lava lake was still active; however, beginning on 12 April 2019, seismic and lava lake activity both declined.
MIROVA (Middle InfraRed Observation of Volcanic Activity) analysis of MODIS satellite data continues to show almost daily, strong thermal anomalies every month from June 2018 through 24 May 2019 (figure 66). Similarly, the MODVOLC algorithm reports a majority of the hotspot pixels (2,406) occurring within the lava lake at the summit crater (figure 67).
Geologic Background. The Nyiragongo stratovolcano contained a lava lake in its deep summit crater that was active for half a century before draining catastrophically through its outer flanks in 1977. The steep slopes contrast to the low profile of its neighboring shield volcano, Nyamuragira. Benches in the steep-walled, 1.2-km-wide summit crater mark levels of former lava lakes, which have been observed since the late-19th century. Two older stratovolcanoes, Baruta and Shaheru, are partially overlapped by Nyiragongo on the north and south. About 100 cones are located primarily along radial fissures south of Shaheru, east of the summit, and along a NE-SW zone extending as far as Lake Kivu. Many cones are buried by voluminous lava flows that extend long distances down the flanks, which is characterized by the eruption of foiditic rocks. The extremely fluid 1977 lava flows caused many fatalities, as did lava flows that inundated portions of the major city of Goma in January 2002.
Information Contacts: Observatoire Volcanologique de Goma (OVG), Goma, North Kivu, DR Congo (URL: https://www.facebook.com/Observatoire-Volcanologique-de-Goma-OVG-180016145663568/); Hawai'i Institute of Geophysics and Planetology (HIGP) - MODVOLC Thermal Alerts System, School of Ocean and Earth Science and Technology (SOEST), Univ. of Hawai'i, 2525 Correa Road, Honolulu, HI 96822, USA (URL: http://modis.higp.hawaii.edu/); MIROVA (Middle InfraRed Observation of Volcanic Activity), a collaborative project between the Universities of Turin and Florence (Italy) supported by the Centre for Volcanic Risk of the Italian Civil Protection Department (URL: http://www.mirovaweb.it/).
Poas
Costa Rica
10.2°N, 84.233°W; summit elev. 2697 m
All times are local (unless otherwise noted)
Weak ash emissions and disappearance of the crater lake
Weak activity at Poás during 2018 was dominated by hydrothermal degassing and a hot acid crater lake that had dried several times (BGVN 44:01). The current report characterizes activity between 1 January and 30 April 2019 and is based upon weekly reports by the Observatorio Vulcanologico Sismologica de Costa Rica-Universidad Nacional (OVSICORI-UNA).
According to OVSICORI-UNA, phreatic explosions that began on 19 December 2018 continued through at least mid-January, reaching a peak on 15 January, and then decreasing. Seismicity decreased to background levels, although long-period (LP) earthquakes and, until 16 January, continuous tremor were detected. No deformation was recorded. The SO2/CO2 gas ratio increased until at least 8 January, but decreased after 13 January. The SO2 flow was variable, and measured less than 50 t/d between two explosions and more than 500 t/d during an explosion. Gas emission was vigorous in the absence of water. By the end of January 2019 the lake had disappeared and explosions had stopped. Although tremor had ceased, daily low-amplitude LPs (up to 300/day) continued. SO2 levels were variable, increasing through 13 January and decreasing thereafter; on 25 January it was about 1,000 t/d.
On 7 February 2019 frequent infrasound pulses were associated with the ejection of ballistics and ash emissions that rose no higher than 200 m. Heightened activity stopped on 9 February. During this period the H2S/SO2 ratio increased to a peak on 9 February before decreasing. On 10 February there were SO2 odors reported in areas downwind including San Jose de Naranjo, Grecia (16 km SW), Poás, Sarchá, Naranjo, and Atenas (32 km SW). Incandescence was visible on 11 February. In the morning, a passive and continuous emission of ash occurred without an associated seismic signal. Throughout this period no deformation was observed, no juvenile material was found, and there was no sign of deep magmatic intrusion.
OVSICORI-UNA reported that since 8 February an almost continuous gas emission rose as high as 1 km and drifted mainly SW. During 13-14 February the emissions contained ash; gas-and-ash plumes drifted SW, affecting areas downwind including Naranjo, Zarcero, and Grecia (16 km SW). Gas-and-ash emissions rose from the crater on 15 February, and gas emissions were recorded on 18 February. By mid-February, explosive activity had decreased, although ash emissions continued, unaccompanied by any seismic signal, until ceasing at the end of February.
During 23-26 February seismicity was dominated by low-frequency events. Robust gas emissions rose from four fumarolic vents in the area previously covered by a lake, though the most vigorous emissions originated from vent A (Boca Roja). Minor incandescence from vent A was sometimes visible at night. A sulfur odor was reported in areas downwind including Naranjo, Zarcero, and Grecia (16 km SW). Particles of sulfur were included in ash deposits collected in Naranjo. Ashfall was reported in Canoas de Alajuela on 26 February.
Non-explosive ash emissions resumed during 7-9 March. Although weather conditions often prevented visual observations during 7-8 and 10 March, gas plumes sometimes containing ash rose as high as 500 m above the crater rim and drifting SW. A sulfur odor and ashfall were reported in Naranjo and Grecia. Additional ash emissions were observed on 13 and 18 March, associated with weak tremor but no explosions. The emission on 18 March produced a plume with minor ash content that rose 200 m above the crater rim; after 18 March yellow pulses were observed. Incandescence was observed beginning 21 March (figure 129).
By the beginning of April, the geodesy network had measured a slight tendency towards inflation and extension, but his decreased by the end of April. Toward the end of April very diffuse ash emissions from the crater's bottom were observed, along with a weak incandescence visible on several days; the emissions had ceased by 30 April. Seismicity was stable, with about 150 LP earthquakes/day, infrequent volcano-tectonic earthquakes, and normal background tremor. The SO2/CO2 and H2S/SO2 ratios fell after the ash emission of 30 April. At the end of April, the crater remained without a lake and with slight incandescence.
Geologic Background. The broad vegetated edifice of Poás, one of the most active volcanoes of Costa Rica, contains three craters along a N-S line. The frequently visited multi-hued summit crater lakes of the basaltic-to-dacitic volcano are easily accessible by vehicle from the nearby capital city of San José. A N-S-trending fissure cutting the complex stratovolcano extends to the lower N flank, where it has produced the Congo stratovolcano and several lake-filled maars. The southernmost of the two summit crater lakes, Botos, last erupted about 7,500 years ago. The more prominent geothermally heated northern lake, Laguna Caliente, is one of the world's most acidic natural lakes, with a pH of near zero. It has been the site of frequent phreatic and phreatomagmatic eruptions since an eruption was reported in 1828. Eruptions often include geyser-like ejections of crater-lake water.
Information Contacts: Observatorio Vulcanologico Sismologica de Costa Rica-Universidad Nacional (OVSICORI-UNA), Apartado 86-3000, Heredia, Costa Rica (URL: http://www.ovsicori.una.ac.cr/); Sentinel Hub Playground (URL: https://www.sentinel-hub.com/explore/sentinel-playground).
Sangeang Api (Indonesia) — May 2019 Cite this Report
Sangeang Api
Indonesia
8.2°S, 119.07°E; summit elev. 1912 m
All times are local (unless otherwise noted)
Ongoing frequent explosions with ash plumes, Strombolian activity, and block avalanches, November 2018-April 2019
Sangeang Api is a small 13-km-wide island volcano off the NE coast of Sumbawa Island, part of Indonesia's Lesser Sunda Islands. Intermittent historical eruptions have been recorded since 1512, most of them during in the 20th century. Ash plumes, Strombolian activity and pyroclastic and lava flows during 1985-1987 from the Doro Api summit crater were the first activity in 20 years and led to the evacuation of over 1,200 residents on the island. Explosive activity resumed for about two years during 1997-1999; no further activity was reported until increased seismicity and white emissions were noted in mid-2009. This activity was intermittent from 2009 through early 2014.
On 30 and 31 May 2014, Pusat Vulkanologi dan Mitigasi Bencana Geologi (PVMBG, or CVGHM) reported large explosions with ash plumes that rose to around 15 km altitude and pyroclastic flows down the flanks (BGVN 39:03, 41:10). The massive ash plume drifted SE, closing airports as far away as Darwin, Australia. The ashfall caused airline disruption and evacuation of thousands in villages on nearby Sumbawa Island. Strong thermal anomalies appeared after the explosions and lasted for the rest of 2014, indicative of flow activity down the E flank; mostly steam plumes, with occasional ash emissions were reported during 2015. Renewed thermal activity appeared in satellite data in mid-January 2017. The thermal signature increased through July 2017 when Strombolian activity and ash emissions were reported (BGVN 42:09). A high level of thermal activity continued through October 2018, with satellite imagery confirming incandescent activity on the E flank, and PVMBG reporting ash emissions that rose a few kilometers above the summit (BGVN 43:11).
During October 2018-April 2019, covered in this report, elevated thermal activity was recorded with satellite data and imagery, and visitors to the island recorded ash plumes, Strombolian activity, lava bombs, and a blocky avalanche flow down the E flank from the pyroclastic cone inside Doro Api cone. Information comes from satellite thermal data and imagery, and reports from visitors to the island. Indonesia's Pusat Vulkanologi dan Mitigasi Bencana Geologi (PVMBG) listed Sangeang Api at Alert Level II for the period. There were no reports from the Darwin VAAC.
Thermal activity became more intermittent during December 2018-March 2019 compared with the previous six months, and then increased again in April according to the MIROVA project thermal data (figure 20). The MODVOLC thermal alerts showed a similar pattern, with a decrease in the number of monthly alerts during December through March. In spite of this, a strong thermal signal was still apparent near the summit throughout the period (figure 21). Sentinel-2 satellite images confirmed the presence of hot material at the summit and down the E-flank ravine throughout the period (figure 22).
A Google Earth image dated 7 October 2018 shows dark lava in the drainage on the SE flank extending to within 1 km of the shoreline (figure 23). A visit to Sangeang Api by photographer Martin Rietze during 25 September-3 October 2018 provided excellent ground and drone-based photographic and video documentation of the eruptive activity at that time (see information contacts for link to video footage). Regular small ash emissions were recorded multiple times per day from a pyroclastic cone inside the Doro Api cone (figure 24); the explosions produced volcanic bombs that traveled hundreds of meters down the flanks of Doro Api (figure 25) as well as sending lava fragments down all sides of the pyroclastic cone (figures 26 and 27). Steam and ash rose a few hundred meters above the summit of the pyroclastic cone and was incandescent after dark (figures 28 and 29).
Incandescent bombs and blocks from Strombolian activity cascaded down the flanks of the pyroclastic cone and also reached outside of the Doro Api crater, landing on the W flank (figures 30 and 31). Steaming tephra on the flanks of the pyroclastic cone was visible during daylight hours (figure 32); the active Doro Api cone is near the center of the island, the inactive Doro Mantai is on the SE flank. In a nighttime view of Doro Api as seen from the summit of Doro Mantai, the incandescent ejecta is clearly visible hundreds of meters from the erupting pyroclastic cone (figure 33). Video footage showed incandescent lava emerging from a fissure near the base of the pyroclastic cone, and a blocky avalanche on the E flank of the cone; as blocks rolled down the slope, incandescence was visible just below the surface.
Blocks of lava formed an avalanche down the ravine on the E flank of Doro Api; the avalanche formed channels tens of meters wide on the steep slope (figure 34) when photographed by drone in early October 2018. The PVMBG webcam located on nearby Sumbawa island about 10 km SW captured an image of a small ash emission rising from the Doro Api summit in late October (figure 35). Visitors to the island in November recorded continued activity in the form of ash plumes and incandescent lava emerging from a fissure on the flank of the pyroclastic cone (figure 36).
Geologic Background. Sangeang Api volcano, one of the most active in the Lesser Sunda Islands, forms a small 13-km-wide island off the NE coast of Sumbawa Island. Two large trachybasaltic-to-tranchyandesitic volcanic cones, Doro Api and Doro Mantoi, were constructed in the center and on the eastern rim, respectively, of an older, largely obscured caldera. Flank vents occur on the south side of Doro Mantoi and near the northern coast. Intermittent eruptions have been recorded since 1512, most of them during in the 20th century.
Information Contacts: Pusat Vulkanologi dan Mitigasi Bencana Geologi (PVMBG, also known as Indonesian Center for Volcanology and Geological Hazard Mitigation, CVGHM), Jalan Diponegoro 57, Bandung 40122, Indonesia (URL: http://www.vsi.esdm.go.id/); MAGMA Indonesia, Kementerian Energi dan Sumber Daya Mineral (URL: https://magma.vsi.esdm.go.id/); MIROVA (Middle InfraRed Observation of Volcanic Activity), a collaborative project between the Universities of Turin and Florence (Italy) supported by the Centre for Volcanic Risk of the Italian Civil Protection Department (URL: http://www.mirovaweb.it/); Hawai'i Institute of Geophysics and Planetology (HIGP) - MODVOLC Thermal Alerts System, School of Ocean and Earth Science and Technology (SOEST), Univ. of Hawai'i, 2525 Correa Road, Honolulu, HI 96822, USA (URL: http://modis.higp.hawaii.edu/); Google Earth (URL: https://www.google.com/earth/); Sentinel Hub Playground (URL: https://www.sentinel-hub.com/explore/sentinel-playground); Martin Rietze, Taubenstr. 1, D-82223 Eichenau, Germany (URL: https://mrietze.com/, Videos at https://www.youtube.com/channel/UC5LzAA_nyNWEUfpcUFOCpJw/videos); Øystein Lund Andersen (Twitter: @OysteinLAnderse, https://twitter.com/OysteinLAnderse, URL: http://www.oysteinlundandersen.com); 80 Jours Voyages, Lyon, France (Twitter: https://twitter.com/jours_80, URL: https://80joursvoyages.com/); Doro Adventures (Twitter: https://twitter.com/DoroAdventures, URL: http://doroadventures.com/).
Sheveluch
Russia
56.653°N, 161.36°E; summit elev. 3283 m
All times are local (unless otherwise noted)
Renewed activity with lava dome growth and ash explosions starting in late December 2018
Volcanism at Sheveluch has been ongoing for the past 20 years. Previous activity consisted of pyroclastic flows, explosions, moderate gas-and-steam emissions, and lava dome growth, according to the Kamchatka Volcanic Eruptions Response Team (KVERT). Between May 2018 and mid-December 2018 activity levels were low, with intermittent low-power thermal anomalies and gas-and-steam emissions. Activity increased in the second half of December 2018, remaining high through at least April 2019.
Activity intensified beginning in late December through April 2019, which included increased and more frequent thermal anomalies, according to KVERT and the MIROVA system (figure 50). On 30 December 2018, video data from KVERT showed explosions producing an ash cloud that rose up to 11 km altitude and drifted 244 km WSW and 35 km NE. Eruptive activity included incandescent lava flows and hot avalanches. The ash cloud that drifted WSW resulted in ashfall over Klyuchi Village (50 km SW) and Kozyrevsk (100 km SW).
Beginning in early January and going through April 2019, the lava dome at the northern part of the volcano continued to grow, extruding incandescent, viscous lava blocks (figure 51). Throughout these months, KVERT reported that satellite imagery and video data showed strong fumarolic activity, as well as strong gas-and-steam plumes containing some amount of ash; gas-and-steam plumes rose as high as 7 km. According to the KVERT Daily Reports on 3 and 4 January 2019, a gas-and-steam plume containing ash drifted NE up to about 600 and 400 km, respectively. Gas-and-steam plumes noted in the KVERT Daily Report, Weekly Releases, and Volcano Observatory Notice for Aviation (VONA), drifted 50-263 km in different directions. On 9 November 2018, the KVERT Daily Report recorded an ash plume drifting 461 km E from the volcano and on 26 December 2018, the KVERT Weekly Information Release recorded an ash cloud drifting 300 km NW. The KVERT Weekly Information Release reported that on 10 April 2019 an ash cloud drifted up to 1,300 km SE.
Thermal anomalies based on MODIS satellite instruments analyzed using the MODVOLC algorithm were frequent beginning on 28 December 2018. In just three days in late December (28-31 December 2018) there were 34 thermal alerts. Hotspots were detected 21-27 days each month between January-April 2019. A majority of these hotspot pixels occurred within the summit crater.
Geologic Background. The high, isolated massif of Sheveluch volcano (also spelled Shiveluch) rises above the lowlands NNE of the Kliuchevskaya volcano group. The 1,300 km3 andesitic volcano is one of Kamchatka's largest and most active volcanic structures, with at least 60 large eruptions during the Holocene. The summit of roughly 65,000-year-old Stary Shiveluch is truncated by a broad 9-km-wide late-Pleistocene caldera breached to the south. Many lava domes occur on its outer flanks. The Molodoy Shiveluch lava dome complex was constructed during the Holocene within the large open caldera; Holocene lava dome extrusion also took place on the flanks of Stary Shiveluch. Widespread tephra layers from these eruptions have provided valuable time markers for dating volcanic events in Kamchatka. Frequent collapses of dome complexes, most recently in 1964, have produced debris avalanches whose deposits cover much of the floor of the breached caldera.
Information Contacts: Kamchatka Volcanic Eruptions Response Team (KVERT), Far Eastern Branch, Russian Academy of Sciences, 9 Piip Blvd., Petropavlovsk-Kamchatsky, 683006, Russia (URL: http://www.kscnet.ru/ivs/kvert/); Institute of Volcanology and Seismology, Far Eastern Branch, Russian Academy of Sciences (IVS FEB RAS), 9 Piip Blvd., Petropavlovsk-Kamchatsky 683006, Russia (URL: http://www.kscnet.ru/ivs/eng/); Hawai'i Institute of Geophysics and Planetology (HIGP) - MODVOLC Thermal Alerts System, School of Ocean and Earth Science and Technology (SOEST), Univ. of Hawai'i, 2525 Correa Road, Honolulu, HI 96822, USA (URL: http://modis.higp.hawaii.edu/); MIROVA (Middle InfraRed Observation of Volcanic Activity), a collaborative project between the Universities of Turin and Florence (Italy) supported by the Centre for Volcanic Risk of the Italian Civil Protection Department (URL: http://www.mirovaweb.it/).
Tengger Caldera (Indonesia) — May 2019 Cite this Report
Tengger Caldera
Indonesia
7.942°S, 112.95°E; summit elev. 2329 m
All times are local (unless otherwise noted)
New explosions with ash plumes from Bromo Cone mid-February-April 2019
The 16-km-wide Tengger Caldera in East Java, Indonesia is a massive volcanic complex with numerous overlapping stratovolcanos (figure 11). Mount Bromo is a pyroclastic cone that lies within the large Sandsea Caldera at the northern end of the complex (figure 12) and has erupted more than 20 times during each of the last two centuries. It is part of the Bromo Tengger Semeru National Park (also a UNESCO Biosphere Reserve) and is frequently visited by tourists. The last eruption from November 2015 to November 2016 produced hundreds of ash plumes that rose as high as 4 km altitude; some of them drifted for hundreds of kilometers before dissipating and briefly disrupted air traffic. Only steam and gas plumes were observed at Mount Bromo from December 2016 to February 2018 when a new series of explosions with ash plumes began; they are covered in this report with information provided by the Pusat Vulkanologi dan Mitigasi Bencana Geologi (PVMBG, also known as CVGHM) and the Darwin Volcanic Ash Advisory Centre (VAAC). Copyrighted ground and drone-based images from Øystein Lund Andersen have been used with permission of the photographer.
PVMBG lowered the Alert Level at Bromo on 21 October 2016 from III to II near the end of an eruptive episode lasting nearly a year. The last VAAC report was issued on 12 November 2016 (BGVN 41:12) noting that the last ash emission had been observed the previous day drifting NW at 3 km altitude. Throughout 2017 and 2018 Bromo remained at Alert Level II, with no unusual activity described by PVMBG. During 1-2 September 2018, a wildfire in the Bromo Tengger Semeru National Park burned 65 hectares of savannah (figure 13); the fire produced 12 MODVOLC thermal alerts around the Tengger Caldera rim. No reports of increased volcanic activity were issued by PVMBG during the period.
After slightly more than two years of little activity other than gas and steam plumes, ash emissions resumed from the Bromo Cone on 18 February 2019. After a brief pause, a new explosion on 10 March marked the beginning of a series of near-daily ash emissions that lasted for the rest of March, producing ash plumes that rose to altitudes ranging from 3.0 to 5.2 km and drifted in many different directions. A new series of ash emissions began on 6 April, rising to 3 km and also drifting in multiple directions. Ash emission density decreased during the month; plumes were only rising a few hundred meters above the summit by the end of April and consisted of mostly steam and moderate amounts of ash.
Activity during February-April 2019. PVMBG reported that at 0600 on 18 February 2019 an eruption at Tengger Caldera's Bromo Cone generated a dense white-and-brown ash plume that rose 600 m and drifted WSW. The plume was not visible in satellite imagery, according to the Darwin VAAC. The Alert Level remained at 2 (on a scale of 1-4). After a few weeks of quiet a new explosion on 10 March (local time) produced a white, brown, and gray ash plume that rose 600 m above the summit; the plume was visible in satellite imagery extending SW. Increased tremor amplitude was also reported on 10 March. A new emission the next morning produced similar ash plumes that drifted S, SW, and W at 3 km altitude. On the morning of 12 March (local time) a continuous ash plume was observed in satellite imagery at 3.4 km altitude drifting SW. The plume drifted counterclockwise towards the S, E, and NE throughout the day and continued to drift NE and SE on 13 March. The altitude of the plume was reported at 4.3 km later that day based on a pilot report.
Continuous brown, gray, and black ash emissions were reported by PVMBG during 14-19 March at altitudes ranging from 3 to 3.9 km; they drifted generally NE to NW. Ashfall was noted around the crater and downwind a short distance. The Darwin VAAC reported continuous ash emissions to 5.2 km altitude drifting SE on 20 March. It was initially reported by a pilot and partially discernable in satellite imagery before dissipating. Ongoing ash emissions of variable densities and colors ranging from white to black were intermittently visible in satellite imagery and confirmed in webcam and ground reports at around 3.0 km altitude during 21-25 March (figures 14-17). Ashfall impacted the closest villages to Bromo, including Cemara Lawang (30 km NW), which was covered by a thin layer of ash. A few trees in the area were toppled over by the weight of the ash. The plume altitude increased slightly on 26 March to 3.7-3.9 km, drifting N and NE. The higher altitude plume dissipated early on 28 March, but ash emissions continued at 3.0 km for the rest of the day.
After just a few days of quiet, new ash emissions rising to 3.0 km altitude and drifting SE were reported by both PVMBG (from the webcam) and the Darwin VAAC on 6 April 2019. By the next day the continuous ash emissions were drifting N, then E during 8-10 April, and S during 11 and 12 April. A new emission seen in the webcam was reported by the Darwin VAAC on 15 April (UTC) that rose to 3.0 km and drifted W. Ash plumes were intermittently visible in either webcam or satellite imagery until 17 April rising 500-1,000 m above the crater; from 19-25 April only steam plumes were reported rising 300-500 m above the summit. A minor ash emission was reported from the webcam on 26 April that rose to 3.0 km altitude and drifted NE for a few hours before dissipating. PVMBG reported medium density white to gray ash plumes that rose 400-600 m above the crater for the remainder of the month.
Geologic Background. The 16-km-wide Tengger caldera is located at the northern end of a volcanic massif extending from Semeru volcano. The massive volcanic complex dates back to about 820,000 years ago and consists of five overlapping stratovolcanoes, each truncated by a caldera. Lava domes, pyroclastic cones, and a maar occupy the flanks of the massif. The Ngadisari caldera at the NE end of the complex formed about 150,000 years ago and is now drained through the Sapikerep valley. The most recent of the calderas is the 9 x 10 km wide Sandsea caldera at the SW end of the complex, which formed incrementally during the late Pleistocene and early Holocene. An overlapping cluster of post-caldera cones was constructed on the floor of the Sandsea caldera within the past several thousand years. The youngest of these is Bromo, one of Java's most active and most frequently visited volcanoes.
Information Contacts: Pusat Vulkanologi dan Mitigasi Bencana Geologi (PVMBG, also known as Indonesian Center for Volcanology and Geological Hazard Mitigation, CVGHM), Jalan Diponegoro 57, Bandung 40122, Indonesia (URL: http://www.vsi.esdm.go.id/); Darwin Volcanic Ash Advisory Centre (VAAC), Bureau of Meteorology, Northern Territory Regional Office, PO Box 40050, Casuarina, NT 0811, Australia (URL: http://www.bom.gov.au/info/vaac/); Hawai'i Institute of Geophysics and Planetology (HIGP) - MODVOLC Thermal Alerts System, School of Ocean and Earth Science and Technology (SOEST), Univ. of Hawai'i, 2525 Correa Road, Honolulu, HI 96822, USA (URL: http://modis.higp.hawaii.edu/); Øystein Lund Andersen (Twitter: @OysteinLAnderse, https://twitter.com/OysteinLAnderse, URL: http://www.oysteinlundandersen.com); Mongabay, URL: https://news.mongabay.com/2018/09/fires-tear-through-east-java-park-threatening-leopard-habitat/.