Aira (Japan) | 9 July-15 July 2014 | Continuing Activity Cite this Report Cite this Report |
 Aira Aira
Ryukyu Volcanic Arc
|
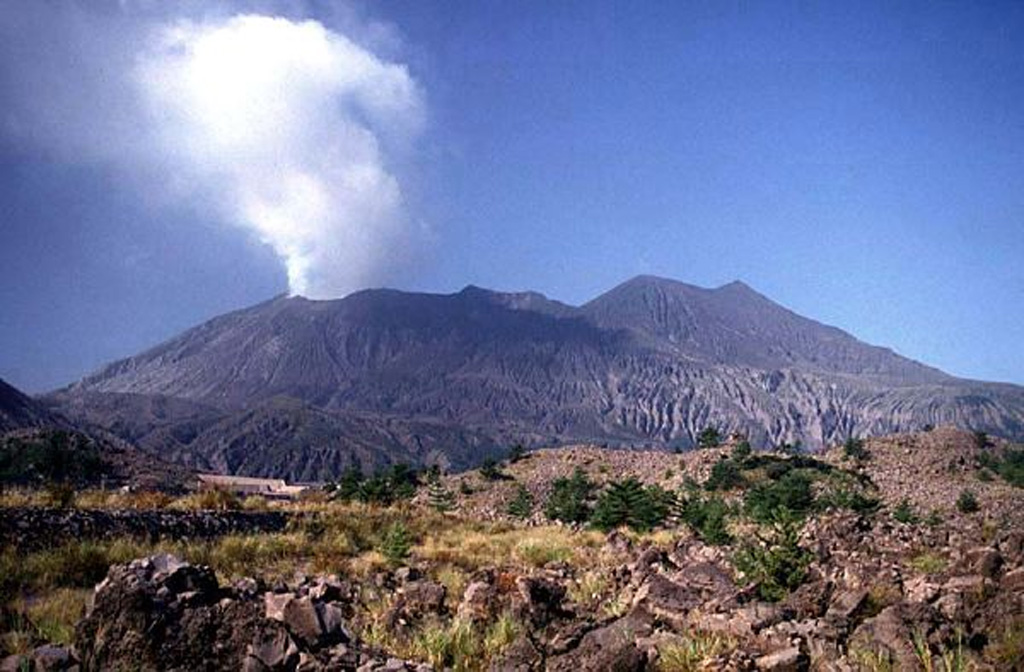
During 11-14 July, JMA reported four large explosions that ejected deposits 800-1,300 m from Showa crater. Volcanic earthquakes decreased and tremor continued. The Tokyo VAAC reported that during 3-14 July plumes rose to altitudes of 2-3 km (7,000-10,000 ft) a.s.l. and drifted NE, SE, and E. The Alert Level remained at 3 (on a scale of 1-5).
Sources: Japan Meteorological Agency (JMA), Tokyo Volcanic Ash Advisory Center (VAAC)
|
Bezymianny (Russia) | 9 July-15 July 2014 | Continuing ActivityCite this Report |
 Bezymianny Bezymianny
Eastern Kamchatka Volcanic Arc
|
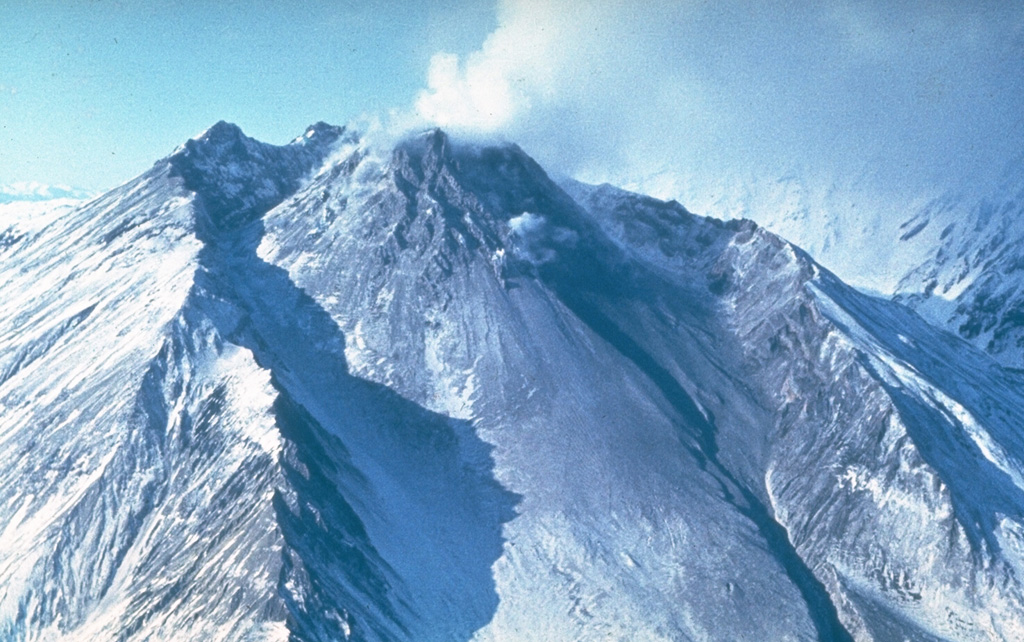
KVERT reported that Bezymianny’s activity continued during 2-10 July; shallow earthquakes were registered. Satellite data showed the volcano frequently obscured by clouds. The Aviation Color Code remained at Orange.
Source: Kamchatkan Volcanic Eruption Response Team (KVERT)
|
Dukono (Indonesia) | 9 July-15 July 2014 | Continuing ActivityCite this Report |
 Dukono Dukono
Halmahera Volcanic Arc
|
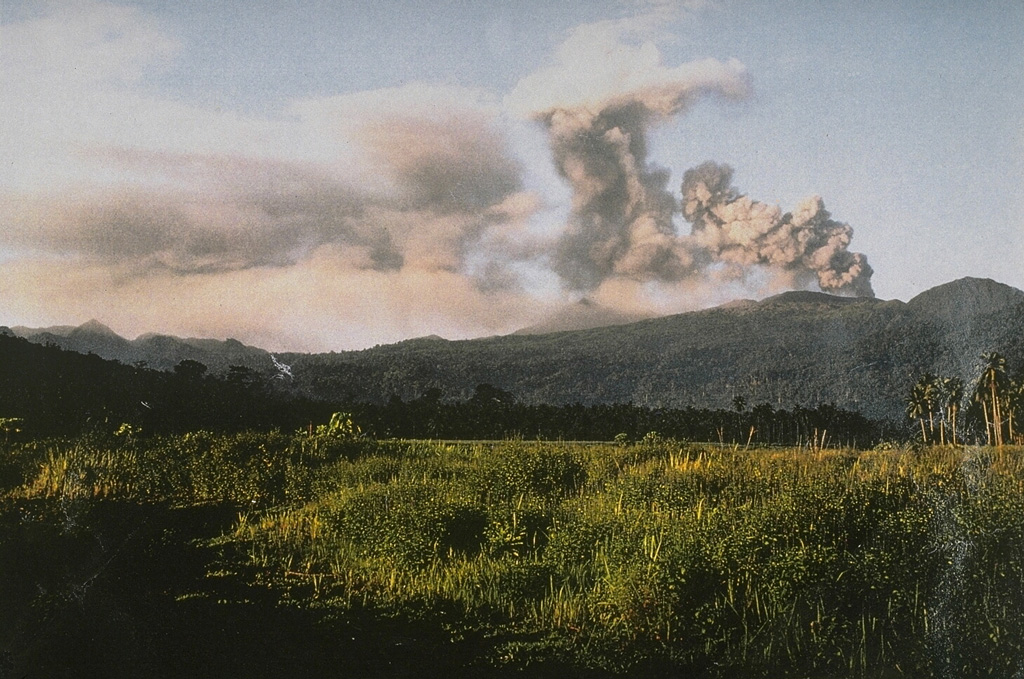
Based on analyses of satellite imagery and wind data, the Darwin VAAC reported that on 12-15 July ash plumes from Dukono rose to an altitude of 2-3 km (7,000-10,000 ft) a.s.l. and drifted NE.
Source: Darwin Volcanic Ash Advisory Centre (VAAC)
|
Etna (Italy) | 9 July-15 July 2014 | Continuing ActivityCite this Report |
 Etna Etna
Sicily Volcanic Province
|
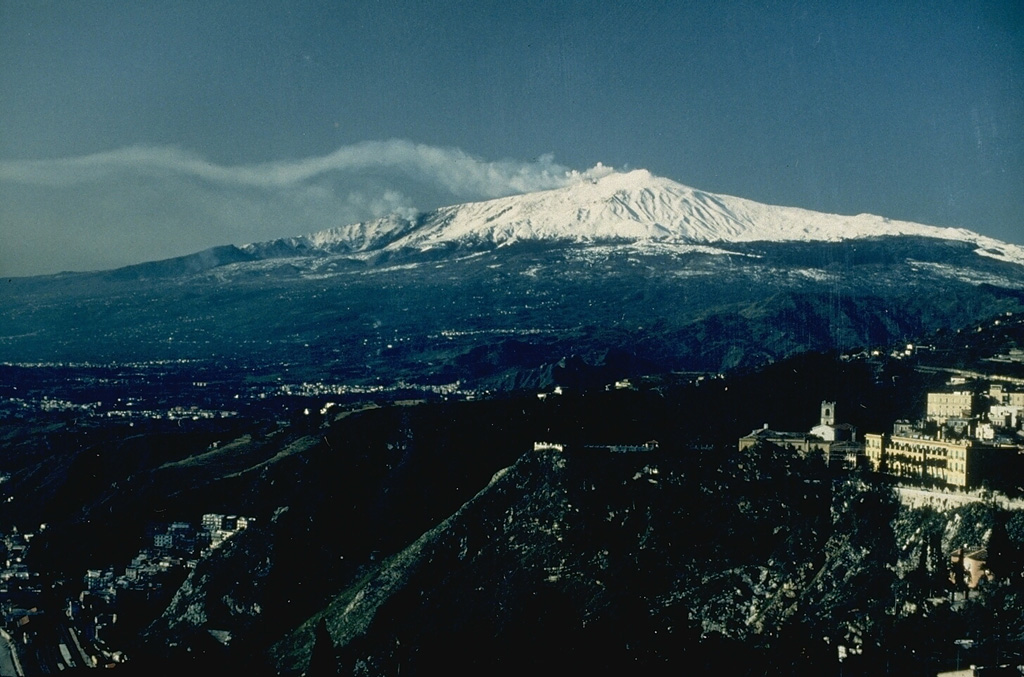
INGV reported that a new, small fissure (tens of meters long) developed on the E flank of Etna during 5-6 July. The vent was located around 3,015-3,025 m elevation. Weak spattering from this vent fed a lava flow that extended ~100 m within the saddle of the NE and SE craters and cones. Weak and sporadic strombolian explosions and small ash emissions were observed during 6-7 July from New SE Crater, but by 11 July this activity had ceased.
Activity from the new fissure continued through 11 July with frequent strombolian explosions that were audible in nearby towns. The lava flow diverged, and the longest of the two branches extended ~1.5 km, reaching the bottom of Valle del Leone.
Source: Sezione di Catania - Osservatorio Etneo (INGV)
|
Fuego (Guatemala) | 9 July-15 July 2014 | Continuing ActivityCite this Report |
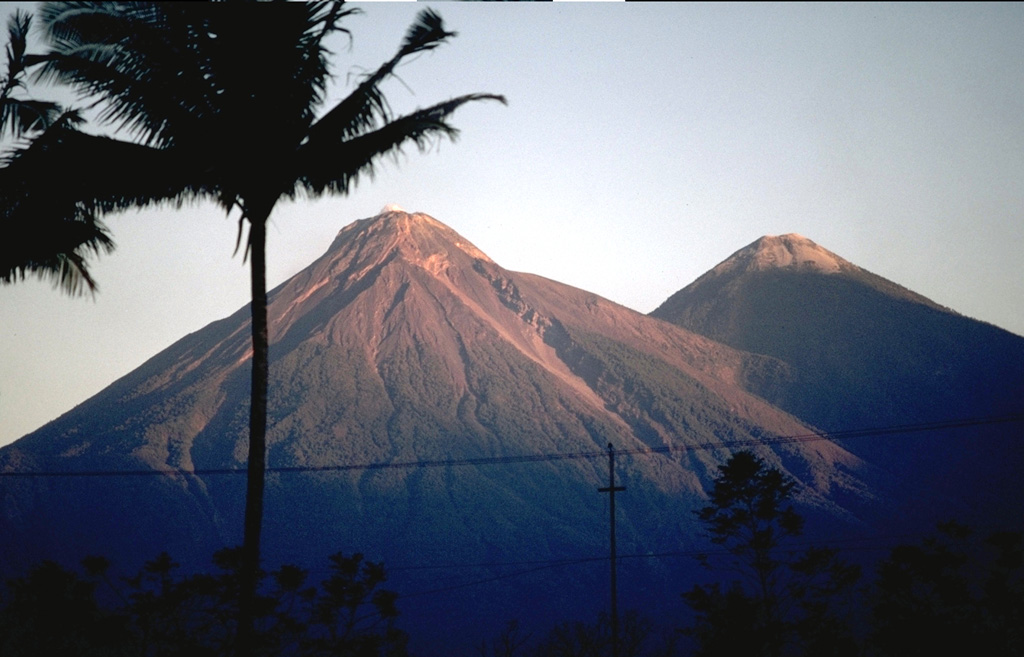 Fuego Fuego
Central America Volcanic Arc
|
During 30 June-14 July, INSIVUMEH frequently reported a white fumarolic plume rising from Fuego’s summit extending up to 4,000 m (13,123 ft) a.s.l.. Weak-to-moderate explosions generated ash plumes to similar heights during 30 June and 1, 4, 6, 7, and 9-13 July. Rumbling and jetting sounds often accompanied these explosions, often with durations of 1-5 minutes. Pulses of incandescence reached 50-100 m above the rim on 30 June, and 6, 7, and 12 July. Remobilized ash reduced visibility on 4, 9, and 10 July. Surges of lava and incandescent avalanches traveled from the summit down the flanks on 1 July (~150 m into the Trinidad drainage), 6 July (100 m into Taniluya and 200 m into the Ceniza), 11 July (~100 m into Taniluya), 12 July (Santa Teresa, Taniluya, Ceniza, Trinidad, Las Lajas, and Honda), and 13 July (~400 m into the Ceniza).
Source: Instituto Nacional de Sismologia, Vulcanologia, Meteorologia, e Hidrologia (INSIVUMEH)
|
Karymsky (Russia) | 9 July-15 July 2014 | Continuing ActivityCite this Report |
 Karymsky Karymsky
Eastern Kamchatka Volcanic Arc
|
KVERT reported that Strombolian activity continued at Karymsky during 3-10 July. Satellite views were obscured by clouds or the imagery showed no activity. The Aviation Color Code remained at Orange.
Source: Kamchatkan Volcanic Eruption Response Team (KVERT)
|
Kilauea (United States) | 9 July-15 July 2014 | Continuing ActivityCite this Report |
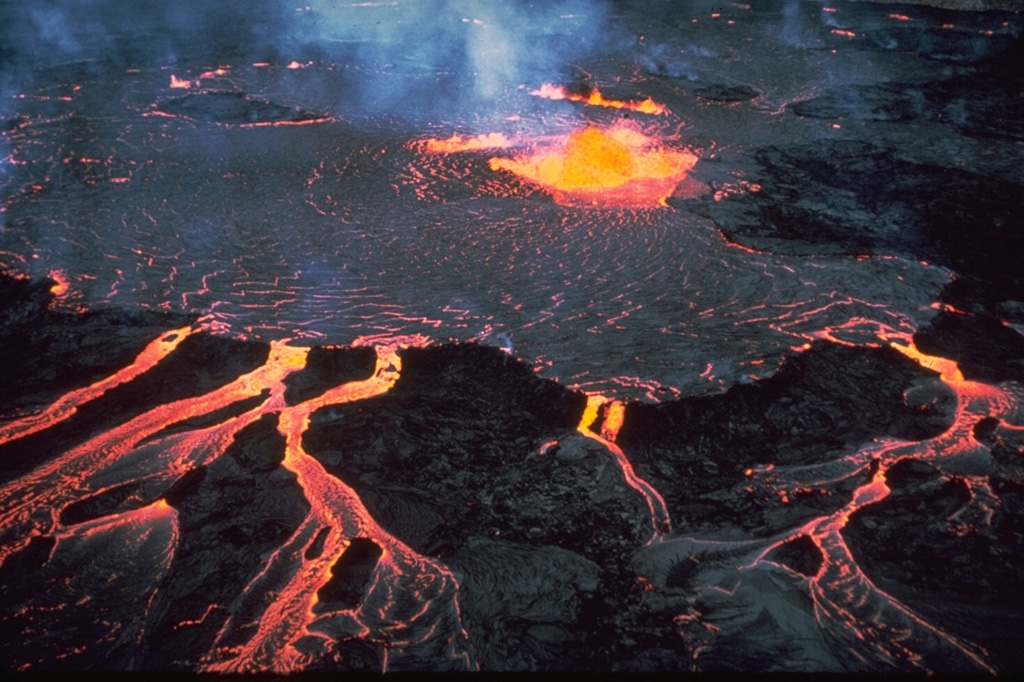 Kilauea Kilauea
Hawaiian-Emperor Hotspot Volcano Group
|
During 2-14 July HVO reported that the circulating lava lake occasionally rose and fell in the deep pit within Kilauea's Halema`uma`u Crater. The lava-lake level fluctuated between 30 and 45 m below the Overlook crater rim; on 13 July, the level dropped 45-50 m during periods of spattering. Weak inflation was measured at the summit during 2-8 July, deflation during 9-10 July, no significant deformation during 11-13 July, and slight inflation on 14 July. Gas emissions remained elevated; during the weeks ending on 1 and 8 July, the summit SO2 emission rates were 3,800-8,400 tonnes/day and 5,800-6,900 tonnes/day, respectively. Earthquakes during 2-7 July (11-21/day) and 8-14 July (5-27/day) were strong enough to be located beneath Kilauea. The plume from the vent continued to deposit variable amounts of ash, spatter, and Pele's hair onto nearby areas; smaller particles may have been dropped several kilometers away.
On 3 July, the total SO2 emission rate from all East Rift Zone sources was 500 tonnes per day. During 2-14 July, four lava ponds within cones occupied the crater floor of Pu`u`O`o. The vent which opened on the NE flank of Pu`u`O`o on 27 June remained active and supplied a flow extending NE, constructing a lava shield that continued to expand until 10 July. This new flow cut off lava supply to the Kahauale`a 2 flow, which by 3 July was no longer active. The new shield developed a perched lava pond which crusted over and became quiescent when the pond spilled over on 11 July. Lava continued to erupt from the base of the structure, supplying flows that accumulated around the flat-lying terrain at the base of Pu`u`O`o until 14 July. Continuous deflation was measured at Pu`u`O`o.
Source: US Geological Survey Hawaiian Volcano Observatory (HVO)
|
Merapi (Indonesia) | 9 July-15 July 2014 | Continuing ActivityCite this Report |
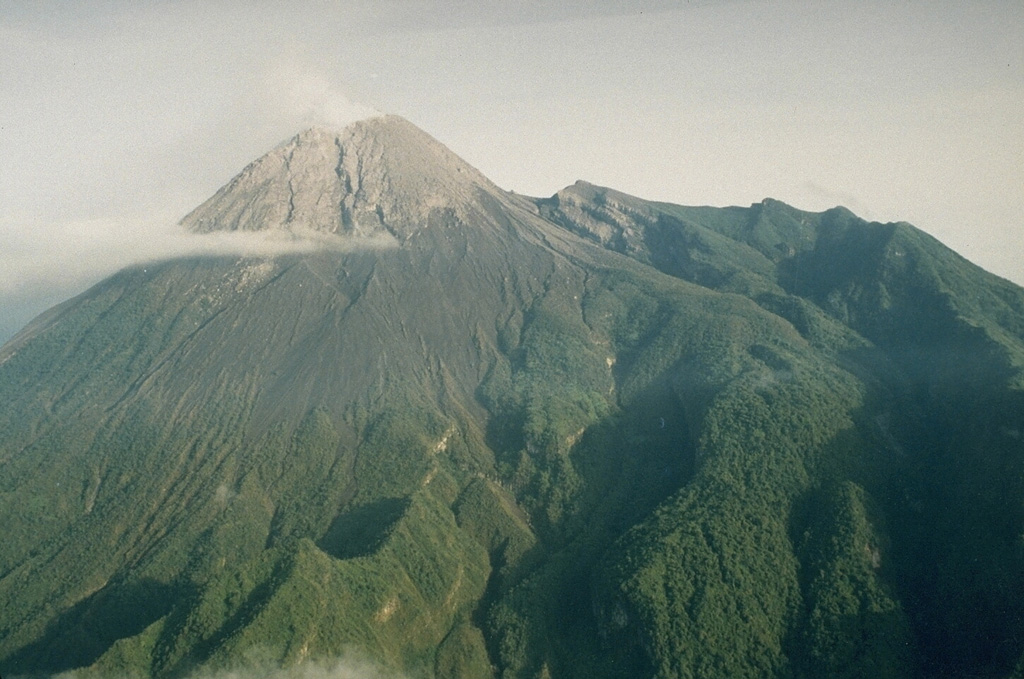 Merapi Merapi
Sunda Volcanic Arc
|
PVMBG reported that during 4-10 July seismicity at Merapi fluctuated at normal levels. Deformation measurements showed general inflation. Solfatara plumes rose 450 m above the summit on 4 July. The Alert Level remained at 1 (on a scale of 1-4).
Source: Pusat Vulkanologi dan Mitigasi Bencana Geologi (PVMBG, also known as CVGHM)
|
Nishinoshima (Japan) | 9 July-15 July 2014 | Continuing ActivityCite this Report |
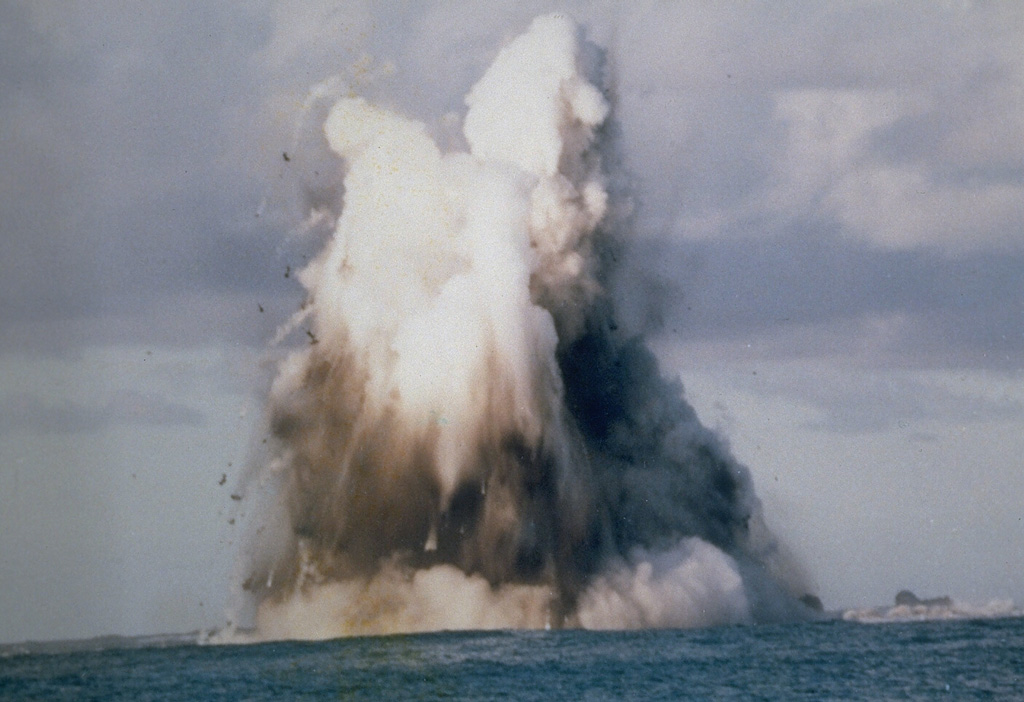 Nishinoshima Nishinoshima
Ogasawara Volcanic Arc
|
Tokyo VAAC reported volcanic ash from Nishinoshima at 3 km (10,000 ft) a.s.l. at 2203 on 30 June; the plume extended NE. However, ash was not visible in satellite images. The University of Hawaii reported that Moderate Resolution Imaging Spectroradiometer (MODIS) satellite data detected thermal anomalies and issued MODVOLC alerts during 25 June-13 July with the exceptions of 8, 11, and 12 July.
Sources: Hawai'i Institute of Geophysics and Planetology (HIGP) Thermal Alerts Team, Tokyo Volcanic Ash Advisory Center (VAAC)
|
Pacaya (Guatemala) | 9 July-15 July 2014 | Continuing ActivityCite this Report |
 Pacaya Pacaya
Central America Volcanic Arc
|
INSIVUMEH reported that on most days during 30 June-13 July, fumarolic plumes rose above Pacaya and drifted up to 1 km W, SW, and S. Associated seismicity was notable on 4, 6, 9-11, and 13 July. Elevated seismicity on 10 July corresponded to minor explosions from Mackenney Crater.
Source: Instituto Nacional de Sismologia, Vulcanologia, Meteorologia, e Hidrologia (INSIVUMEH)
|
Popocatepetl (Mexico) | 9 July-15 July 2014 | Continuing ActivityCite this Report |
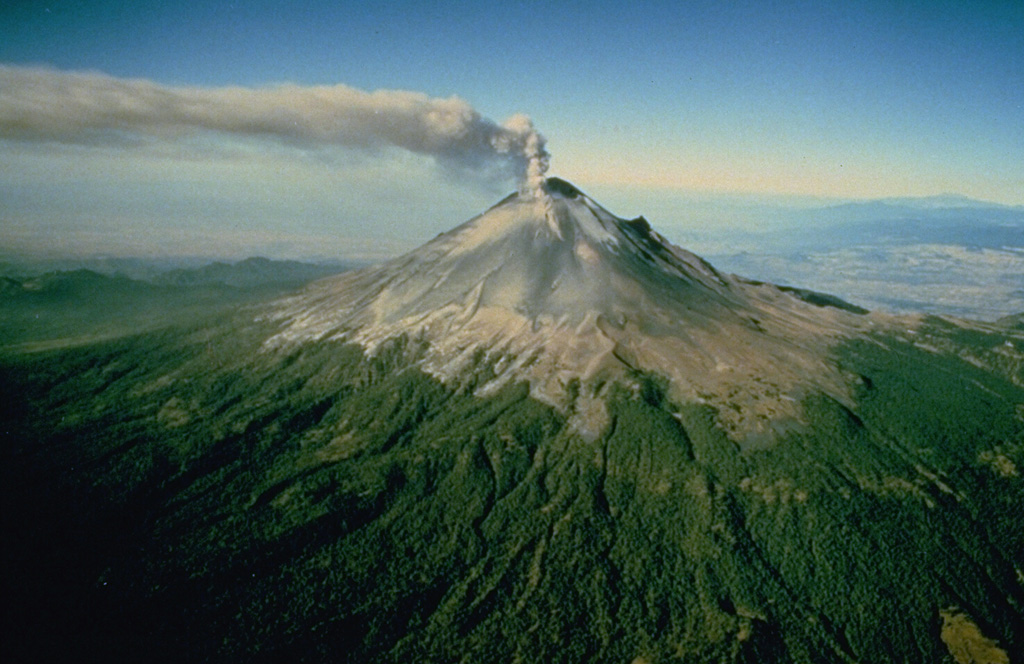 Popocatepetl Popocatepetl
Trans-Mexican Volcanic Arc
|
CENAPRED reported that during 24 June-15 July, seismicity at Popocatépetl indicated continuing emissions of water vapor, gas, and occasional small amounts of ash. Cloud cover sometimes prevented visual observations. Slight nighttime incandescence was observed during 25 and 26 June and also during 1-3, 6-8, and 10-15 July. Explosions from the summit were detected an average of 10 times each day, producing plumes with minor ash content that rose 500-2,500 m above the crater and drifted NE and NW. Activity increased in early July; up to 216 explosions (low and moderate intensity) were detected over 24 hours on 9 July. CENAPRED reported harmonic tremor on 2 July (maximum of 80 minutes in 24 hours) and 12 July (minimum of 8 minutes). The Alert Level remained at to Yellow, Phase Two.
Source: Centro Nacional de Prevencion de Desastres (CENAPRED)
|
Reventador (Ecuador) | 9 July-15 July 2014 | Continuing ActivityCite this Report |
 Reventador Reventador
Northern Andean Volcanic Arc
|
IG reported that although cloud cover often prevented observations of Reventador, during 30 June and 2, 4, and 9-12 July ash emissions were seen. In the afternoon of 30 June, a diffuse ash plume was visible rising from the summit. Activity increased on 2 July when 41 explosions were recorded, as well as 27 long-period earthquakes and 15 episodes of tremor associated with emissions. A 2-km-high gas-and-ash plume was observed rising from the summit on the morning of 2 July that drifted SE and later that night an explosion was heard. The IG reported that SOTE (Sistema de Oleoducto Transecuatoriano) personnel heard explosions during the morning of 8 July. The next morning, SOTE personnel noted that the summit was clear and a gas-and-ash plume was rising from the summit up to 2 km above the crater rim. Diffuse ash plumes were also noted on 10 and 11 July that reached 1.5 km above the crater and drifted NW.
The seismic network detected the highest number of explosion signatures during 2-5 July when 34-45 events per day were detected. Up to 12 episodes of harmonic tremor per day occurred during 4 and 5 July. The highest number of long-period earthquakes occurred during 10-11 July: 90 events per day. Tremor signatures associated with emissions had a wide range during this reporting period (0-28 per day), but typically numbered less than 15 per day.
Source: Instituto Geofísico-Escuela Politécnica Nacional (IG-EPN)
|
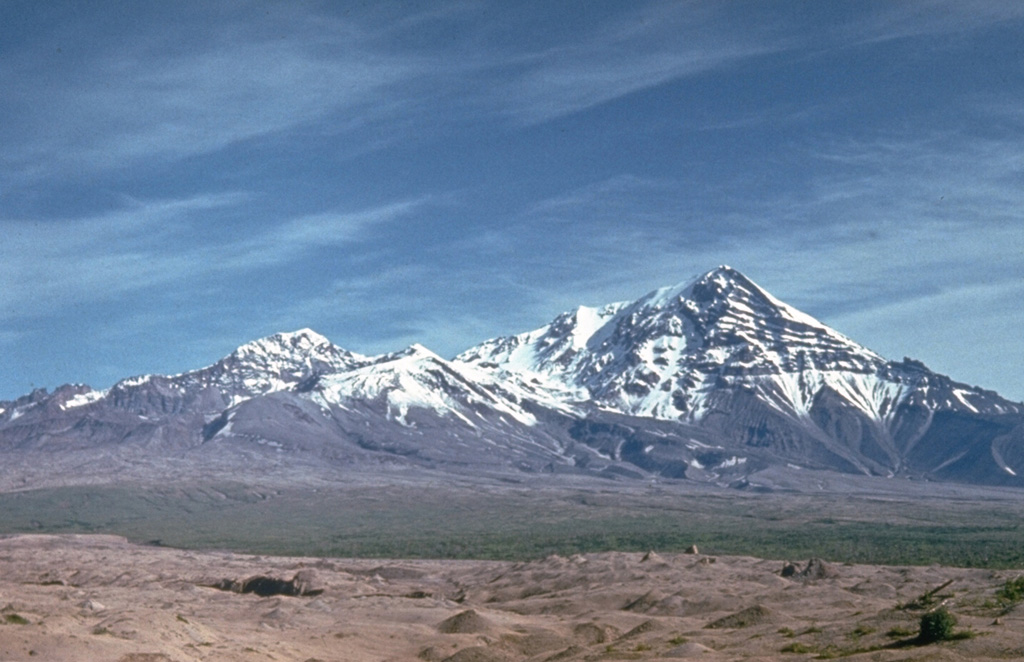
Sabancaya (Peru) | 9 July-15 July 2014 | Continuing ActivityCite this Report |
 Sabancaya Sabancaya
Central Andean Volcanic Arc
|
IGP reported that during 12-27 June there were renewed signs of activity from Sabancaya. Fumarolic activity increased and gases were notably more blue and gray. Seismicity also increased, particularly long-period (LP) earthquakes (~100 LP events per day during 18, 19, and 21 June). Since 6 June, hybrid earthquakes were detected; IGP noted that this seismicity can be attributed to rising magma. During 6-10 July, a daily average of 11 hybrid earthquakes was recorded. In the past few weeks, volcano-tectonic (VT) earthquakes migrated closer to the volcano, especially when the locations were compared with those from 2013. Within a week, the concentration of VT earthquakes had moved ~10 km closer to the crater, reaching a distance ~6 km N of the crater. This activity prompted IGP to install a new seismometer to augment their monitoring capabilities, now comprising six seismometers.
From mid-June through 10 July, fumarolic activity continued and white plumes were visible, although with less intensity within the last two weeks. Seismicity increased during this time period, particularly on 30 June and 1 July when a daily average of 87 LP earthquakes was recorded. From 27 June through 6 July, there was a daily average of 44 VT earthquakes. VT earthquakes were also occurring close to the crater. There were three persistent clusters of VT earthquakes near the crater: 6 km N, 16 km NE, and 10 km E.
Source: Instituto Geofísico del Perú (IGP)
|
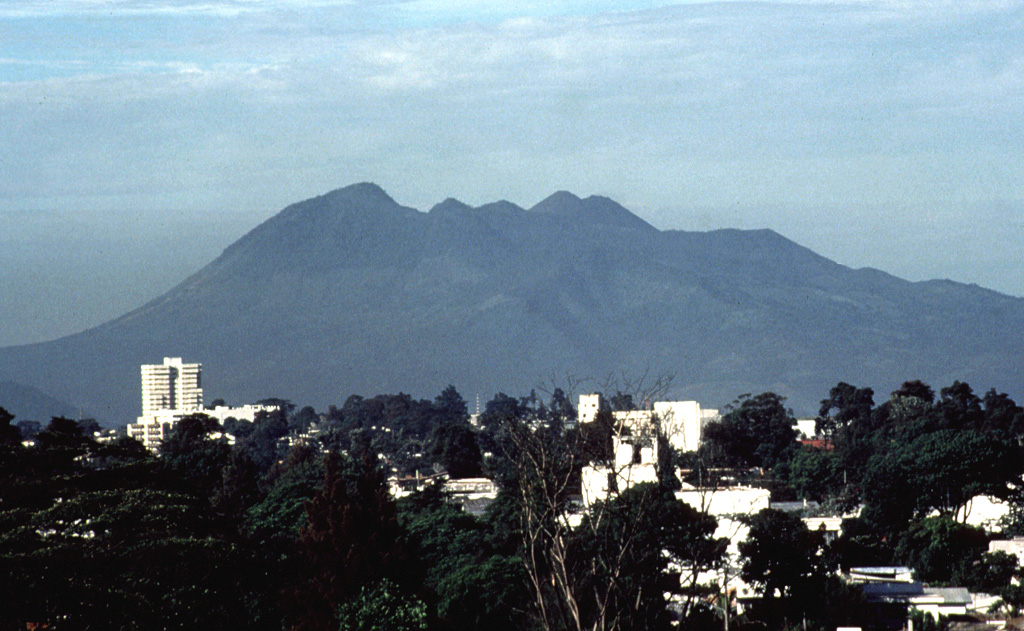
San Miguel (El Salvador) | 9 July-15 July 2014 | Continuing ActivityCite this Report |
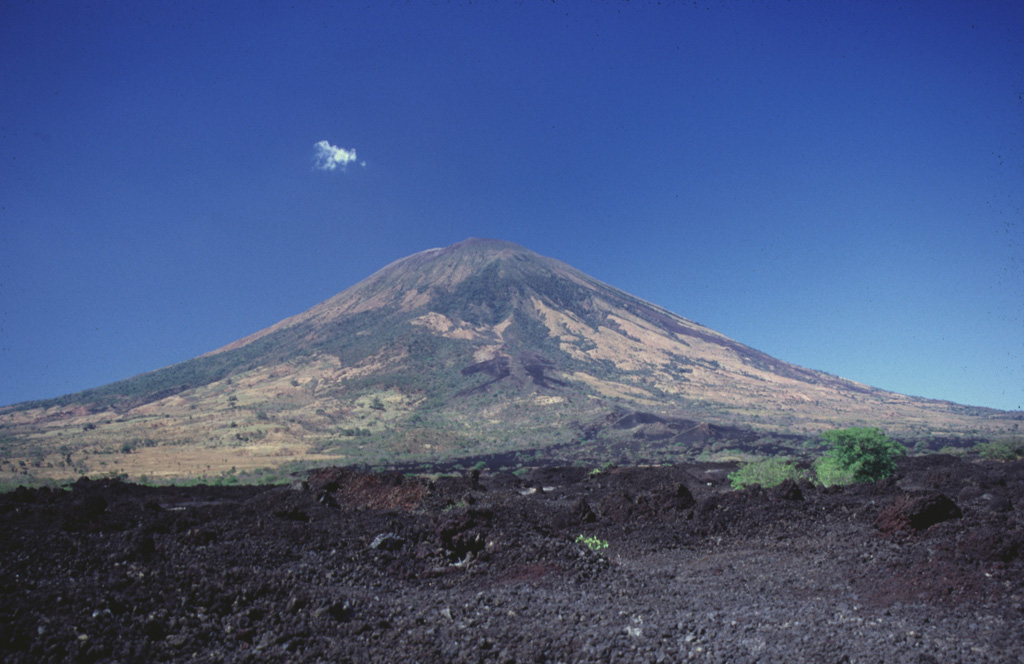 San Miguel San Miguel
Central America Volcanic Arc
|
According to the Ministry of Environment and Natural Resources (MARN), elevated activity was detected on 10 July from San Miguel. RSAM had increased significantly and was also high on 14 July, but decreased the next day. On 15 July MARN reported that seismicity was continuing from the N flank. SO2 flux measurements indicated a significant decrease of gas.
Sources: Servicio Nacional de Estudios Territoriales (SNET), Servicio Nacional de Estudios Territoriales (SNET)
|
Santa Maria (Guatemala) | 9 July-15 July 2014 | Continuing ActivityCite this Report |
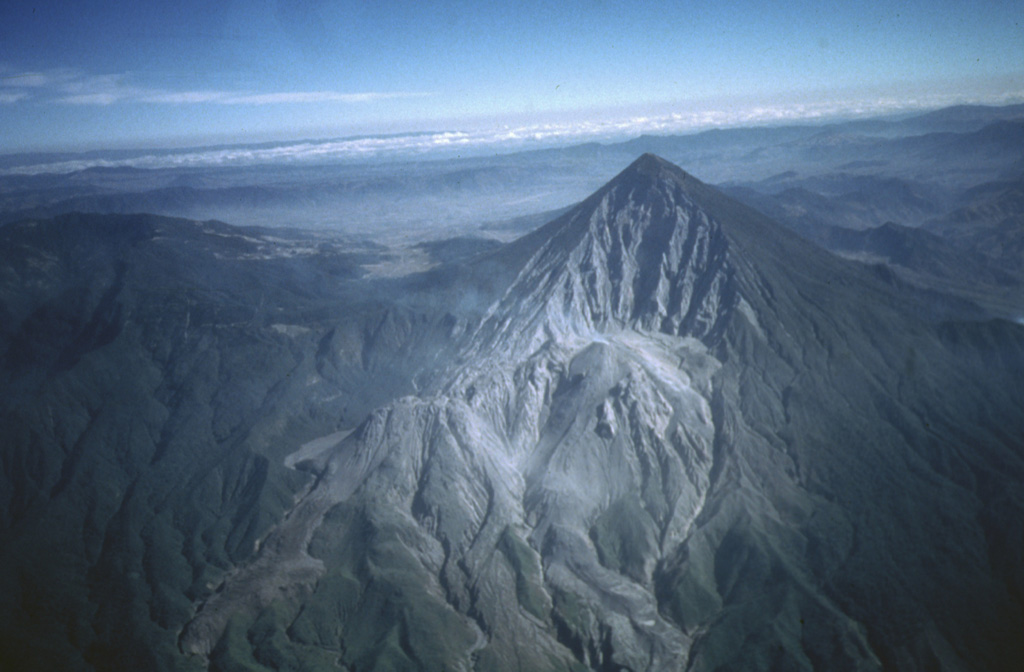 Santa Maria Santa Maria
Central America Volcanic Arc
|
INSIVUMEH reported that on most days during 30 June-14 July the active lava dome of Santiaguito was visibly degassing and generating plumes rising up to ~3,000 m (10,000 ft) a.s.l. that tended to drift SW. Weak explosions with some rumbling sounds occurred during this time period and ashfall was reported in the high terrain of Parcelamiento Monte Claro (S) on 2 and 14 July. Explosions were observed on 5, 7, and 10 July that ejected incandescent tephra up to 50 m above the crater rim. The active lava flow front on the E flank was also a frequent source of incandescence that generated hot avalanches into the drainages of Nimá 1 (E) and San Isidro (SW). On 2 and 10 July slope failures were reported from the scarp remaining from the 9 May 2014 eruption.
On 15 July at 1430 lahars were triggered by heavy rainfall. INSIVUMEH reported that lahars were channelized within Nimá 1, San Isidro, and the tributaries of Samala. Seismic stations detected the flow; hot volcanic material dominated the lahars as well as tree trunks and branches and blocks 1-2 m in diameter. Vapor was rising from the lahars and there was a strong sulfur odor. INSIVUMEH extended the warning for the region, including the high bridge of Castillo Armas (on the international highway NE of San Sebastián) due to the convergence of several flows upstream from that site.
Source: Instituto Nacional de Sismologia, Vulcanologia, Meteorologia, e Hidrologia (INSIVUMEH)
|
Sheveluch (Russia) | 9 July-15 July 2014 | Continuing ActivityCite this Report |
 Sheveluch Sheveluch
Eastern Kamchatka Volcanic Arc
|
KVERT reported that during 3-10 July lava-dome extrusion onto Shiveluch’s SE flank was accompanied by ash explosions, incandescence, hot avalanches, and fumarolic activity. Ash plumes rose to 7 km (23,000 ft) a.s.l. on 30 June and 11 km (36,000 ft) a.s.l. during 5-8 July. During 7-8 July, satellite images detected ash plumes extending 280 km SE of the volcano. The Aviation Color Code remained at Orange.
Source: Kamchatkan Volcanic Eruption Response Team (KVERT)
|
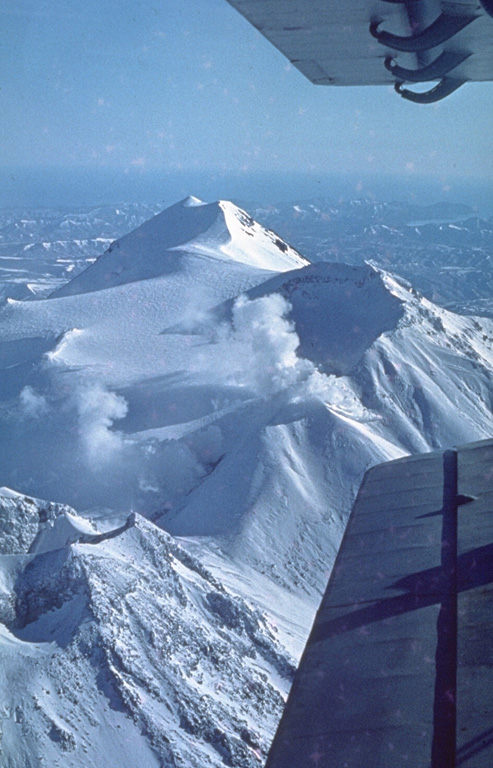
Shishaldin (United States) | 9 July-15 July 2014 | Continuing ActivityCite this Report |
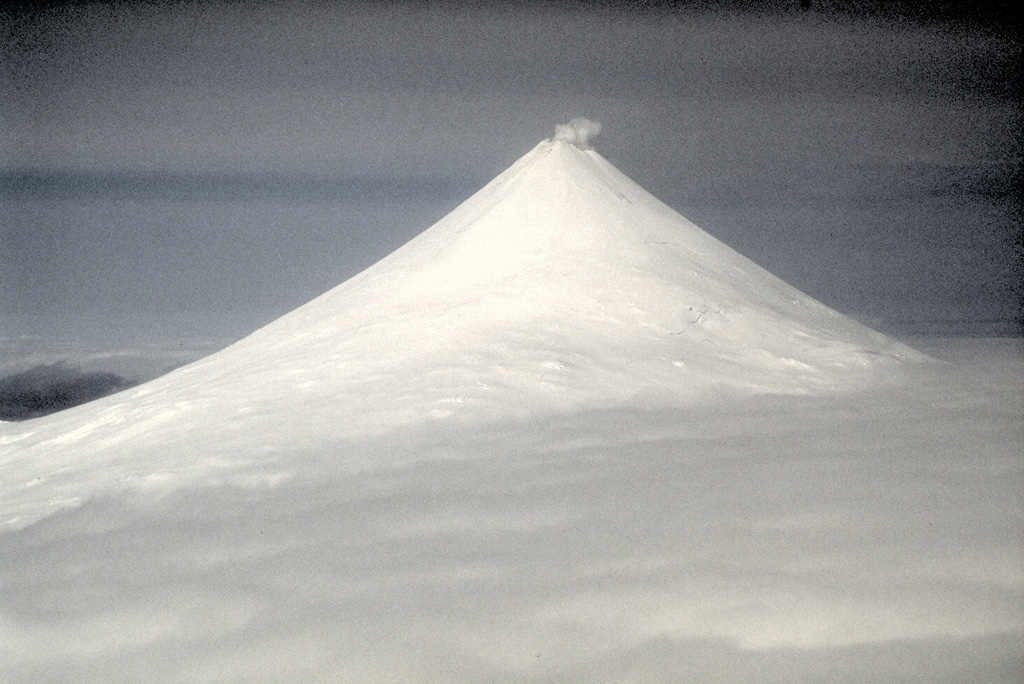 Shishaldin Shishaldin
Aleutian Ridge Volcanic Arc
|
AVO reported that during 2-15 July low-level seismicity continued at Shishaldin volcano. Elevated surface temperatures at the summit were detected. A steam and gas plume was intermittently visible rising from the summit and drifting downwind, although satellite and web-camera images were mostly obscured due to clouds. On 9 July small explosions, probably within the summit cone, were detected on seismic and infrasound networks. The Aviation Color Code remained at Orange and the Volcano Alert Level remained at Watch.
Source: US Geological Survey Alaska Volcano Observatory (AVO)
|
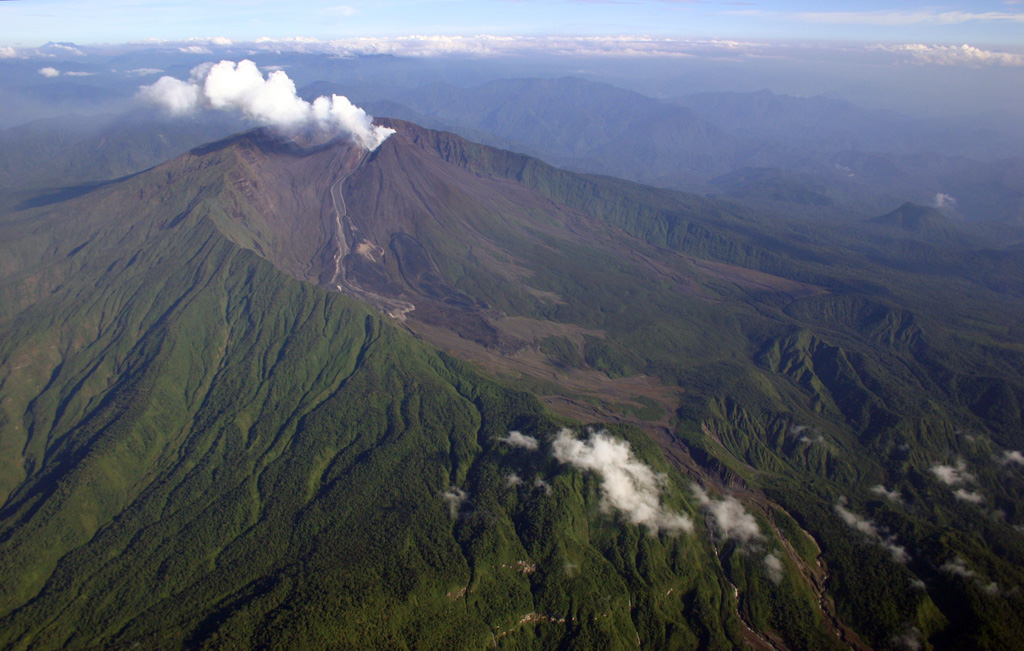
Sinabung (Indonesia) | 9 July-15 July 2014 | Continuing ActivityCite this Report |
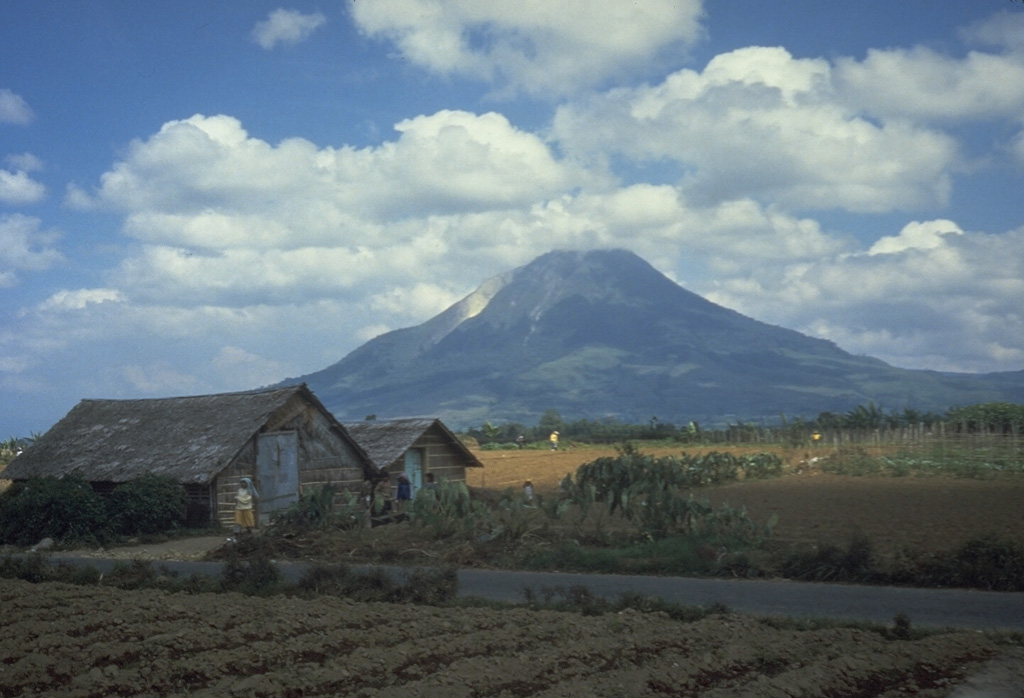 Sinabung Sinabung
Sunda Volcanic Arc
|
CVGHM reported a white plume that was occasionally brown and blue reaching 100-2,000 m above Sinabung’s crater during 8-14 July. Pyroclastic flows were observed on 10 and 12 July from the W side of the crater. On 10 July, the hot flows reached a maximum of 3 km S while the flows on 12 July extended 3-4 km S. A spokesman from the national disaster management agency noted that hot ashfall occurred in several places around the Karo district, but did not merit further evacuations. CVGHM reported that SO2 emissions were measured once during 8-14 July and yielded 1,252 tonnes/day; during the elevated activity of 11-18 January 2014 values were as high as 3,796 tonnes/day. The Alert Level remained at 3 (on a scale of 1-4).
Sources: Pusat Vulkanologi dan Mitigasi Bencana Geologi (PVMBG, also known as CVGHM), GlobalPost.com
|
Slamet (Indonesia) | 9 July-15 July 2014 | Continuing ActivityCite this Report |
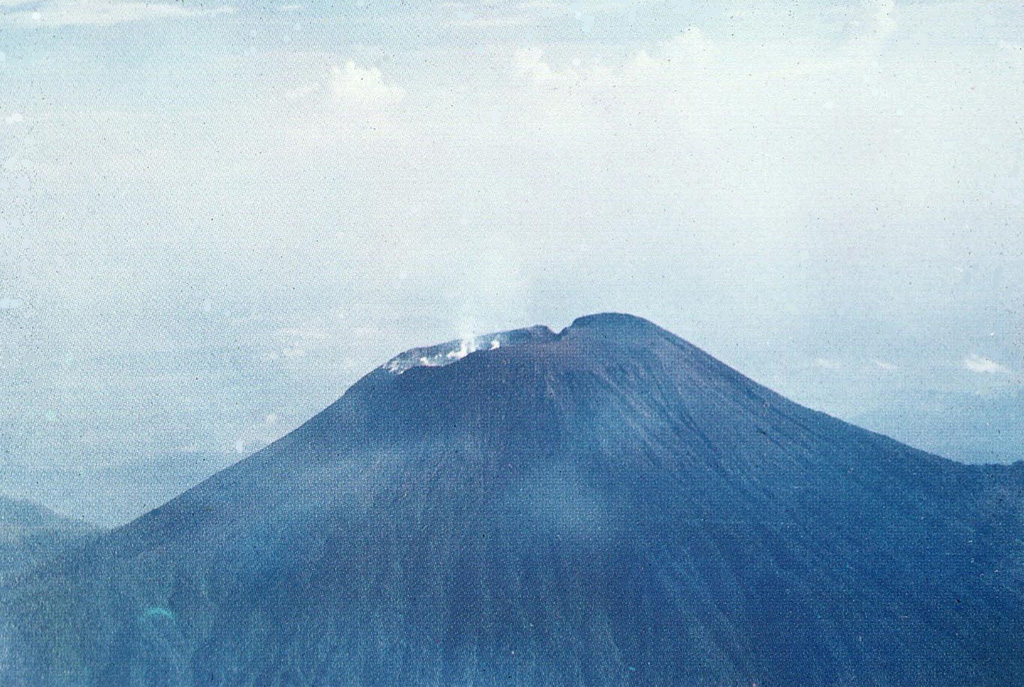 Slamet Slamet
Sunda Volcanic Arc
|
CVGHM reported that incandescence had been visible 14 times in May and there were ash eruptions reaching 150-1,500 m above Slamet’s summit that drifted NW and W. White plumes were typically visible 50-800 m above the summit in May and June. There were 14 moderate ash eruptions during 15-30 June that generated plumes 500-1,400 m above the summit and drifted N and W. Incandescence was visible three times in June. During 1-2 July, there were 17 moderate ash plumes that generated plumes 300-1,200 m above the summit that drifted N and W. Alert Level 2 was maintained and visitors and tourists were prohibited from approaching the crater within a radius of 2 km.
Source: Pusat Vulkanologi dan Mitigasi Bencana Geologi (PVMBG, also known as CVGHM)
|
Stromboli (Italy) | 9 July-15 July 2014 | Continuing ActivityCite this Report |
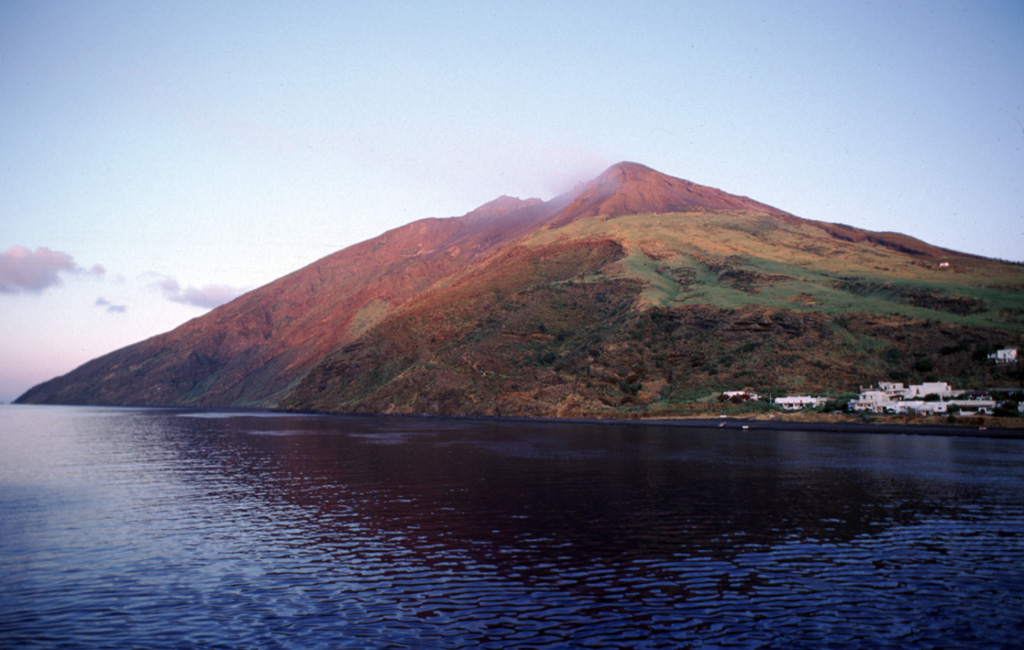 Stromboli Stromboli
Aeolian Volcanic Arc
|
INGV reported that during 30 June-1 July, small landslides occurred on Stromboli's Sciara del Fuoco. A new lava flow that began on 7 July flowed from the high part of Sciara del Fuoco (N2) and followed the path of the previous flows. A hot avalanche occurred at 0733 that reached the coastline and was followed by a lava flow. Two other lava flows began from the same location (N2); one during the afternoon of 9 July that was accompanied by small landslides and another on 10 July.
Source: Sezione di Catania - Osservatorio Etneo (INGV)
|
Tungurahua (Ecuador) | 9 July-15 July 2014 | Continuing ActivityCite this Report |
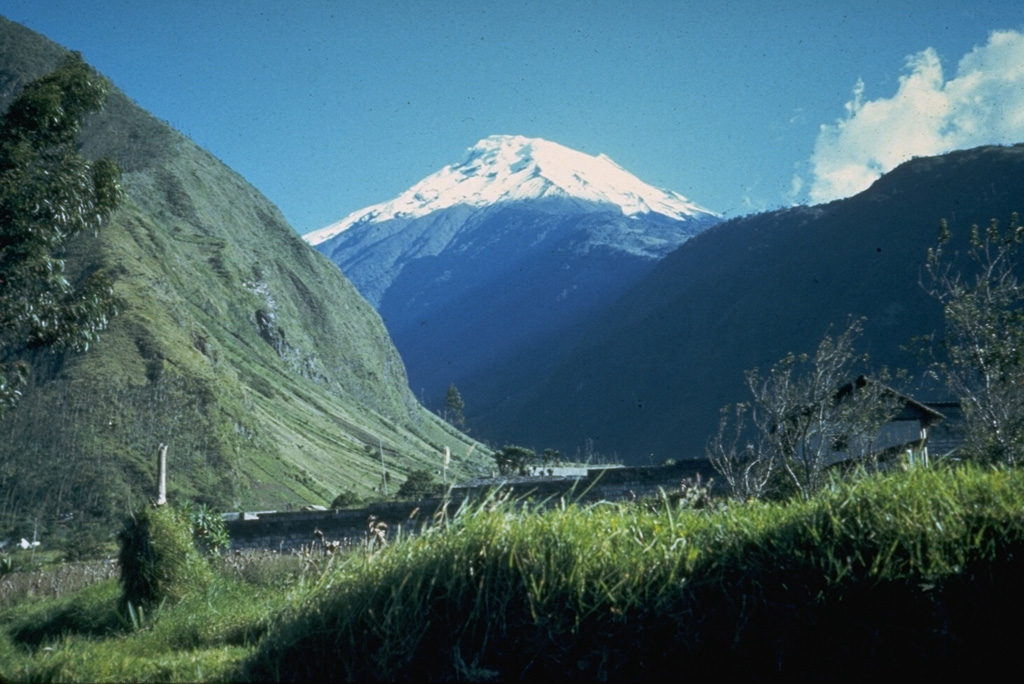 Tungurahua Tungurahua
Northern Andean Volcanic Arc
|
IG reported that Tungurahua had low levels of seismicity and poor viewing conditions during 24-27 June and in July during 1-9 and 14. Heavy rain during the night of 24 June and morning of 25 June generated small lahars that caused damage to the Baños- Penipe highway. During the afternoon of 28 June clear viewing conditions allowed observations of a 100-m-high white plume rising from the summit crater. Otherwise, clear conditions revealed quiescence at the summit. Heavy rain during the night of 7 July and the following morning generated lahars in the drainages of Mandur to the NW: Pondoa, Cusúa, and Pingullo. A major road was destroyed in the area of Asupashal and the flow through Juive (NW) carried blocks up to 50 cm. A small lahar on 14 July was detected in the Juive drainage after heavy rainfall during the prior evening.
Source: Instituto Geofísico-Escuela Politécnica Nacional (IG-EPN)
|
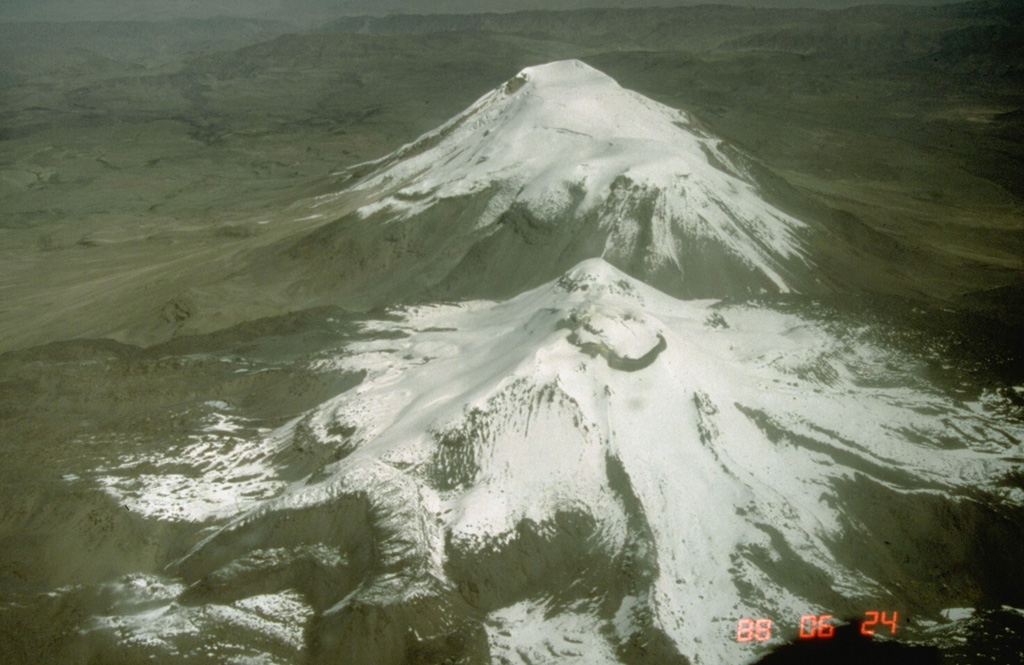
Ubinas (Peru) | 9 July-15 July 2014 | Continuing ActivityCite this Report |
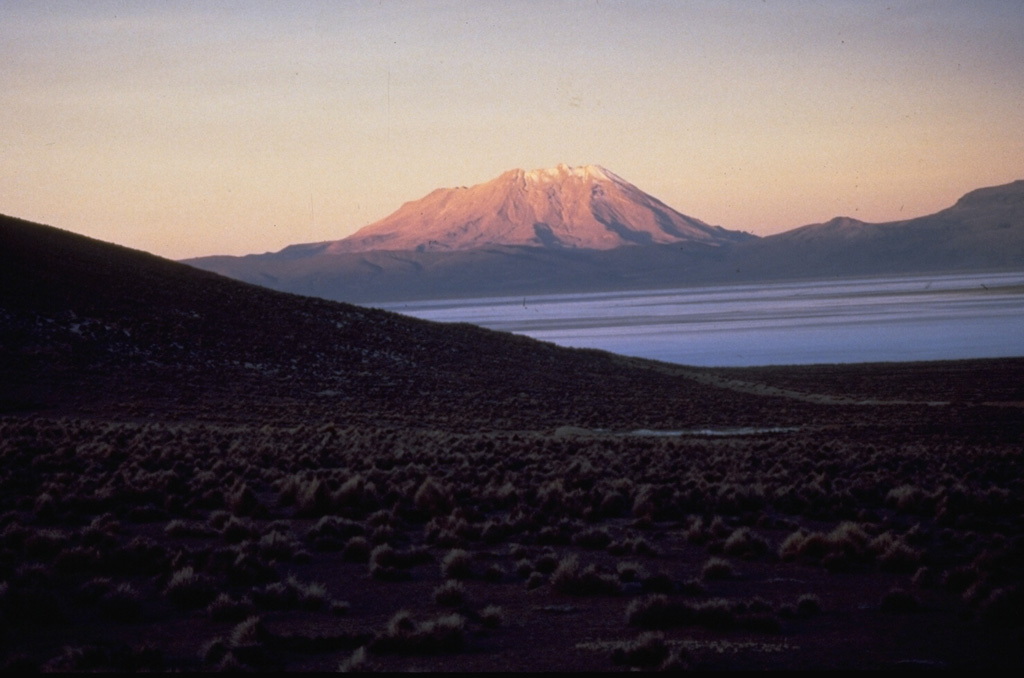 Ubinas Ubinas
Central Andean Volcanic Arc
|
IGP reported that the eruption of Ubinas was continuing during 12 June-10 July. During 12-30 June six explosions generated plumes 1,400-3,600 m above the crater. Volcanic tremor was associated with ash emissions during 12-21, 25, and 26 June. During 28-29 June more than 1,000 hybrid earthquakes were recorded, but volcano-tectonic earthquakes were scarce. A moderate explosion on 30 June generated an incandescent plume. After more than 50 hours of tremor, a moderate explosion occurred at 0858 on 30 June; the plume reached 1,800 m above the crater and ejected tephra 1,500 m down the NW flank.
During 30 June-10 July IGP detected five, small-sized explosions that generated plumes 400-1,500 m above the crater. Seismicity was also reduced during this period; the greatest number of hybrid earthquakes was registered on 6 July when a swarm of 115 earthquakes occurred.
Source: Instituto Geofísico del Perú (IGP)
|
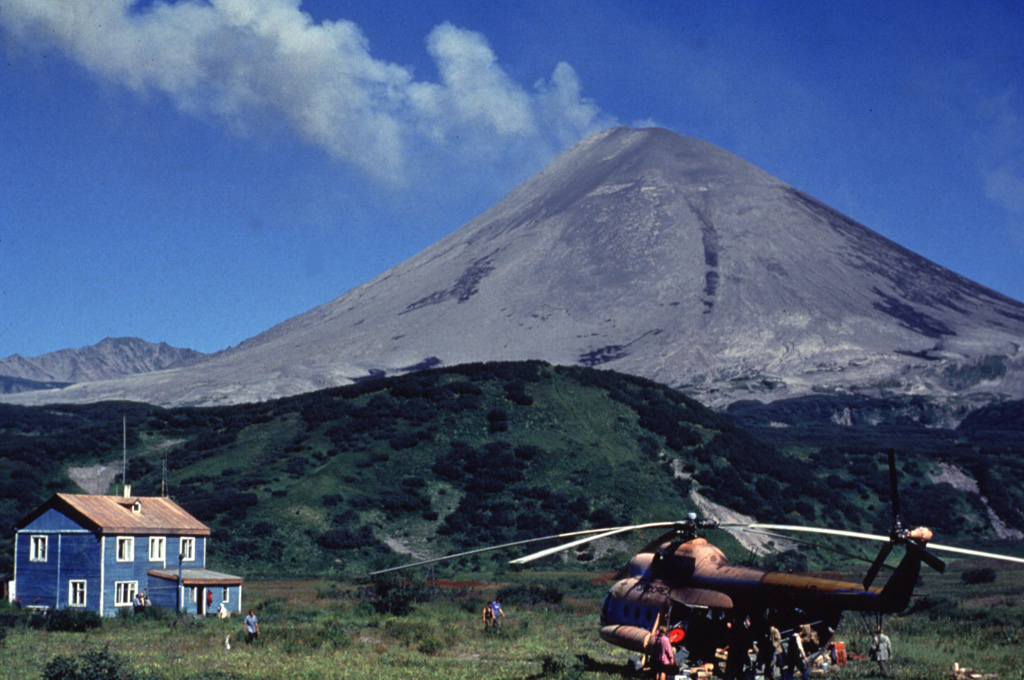
Zhupanovsky (Russia) | 9 July-15 July 2014 | Continuing ActivityCite this Report |
 Zhupanovsky Zhupanovsky
Eastern Kamchatka Volcanic Arc
|
KVERT reported that during 2, 5, and 9 July, moderate gas-and-steam activity was observed at Zhupanovsky. An ash plume up to 6 km (19,700 ft) a.s.l. was observed on 9 July. Satellite data showed an ash plume extending up to 450 km E and SE of the volcano during 9-10 July. The Aviation Color Code was maintained at Orange.
Source: Kamchatkan Volcanic Eruption Response Team (KVERT)
|
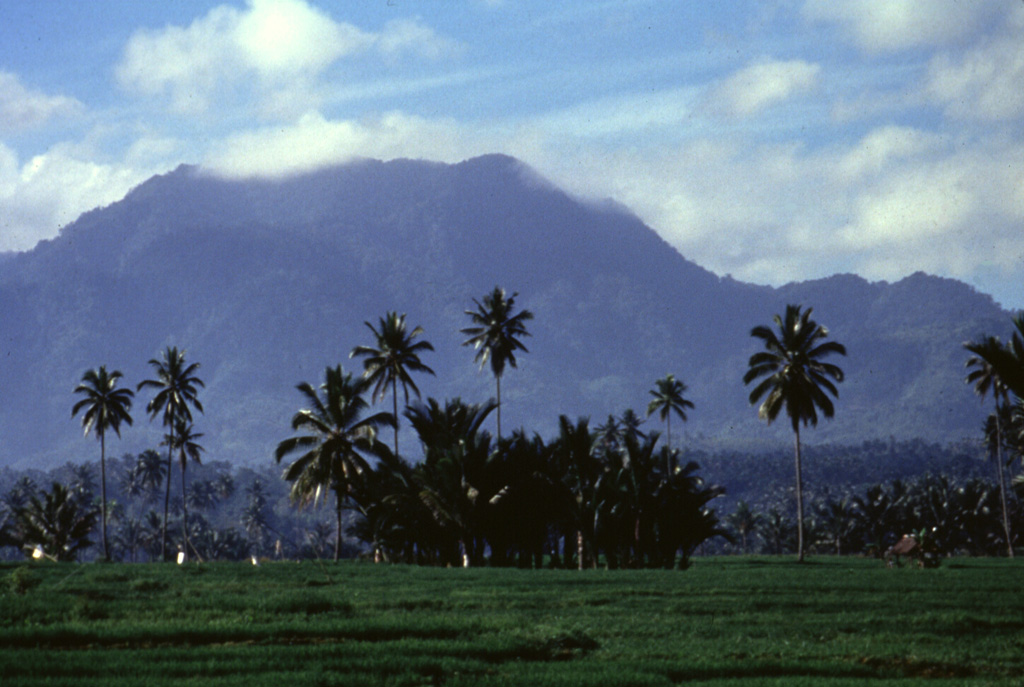 Ambang
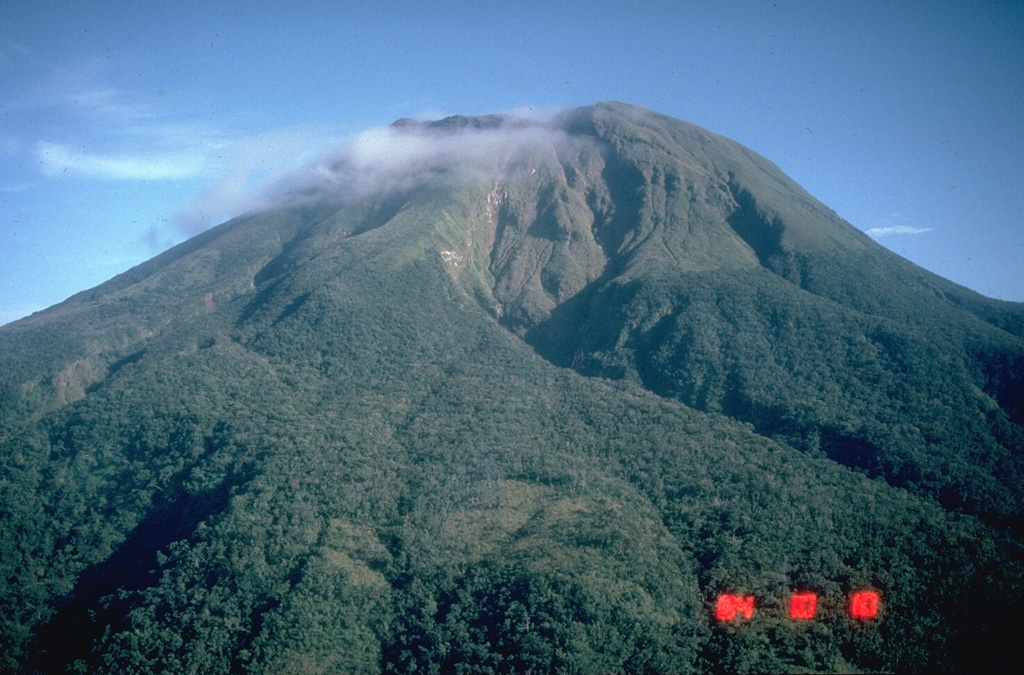 Bulusan
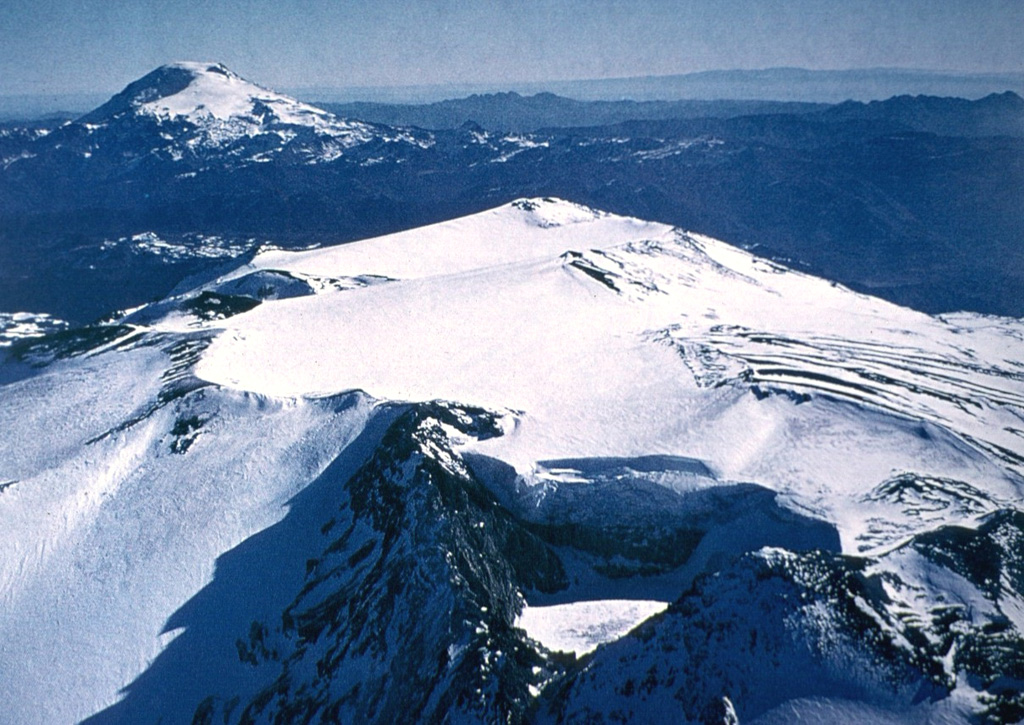 Copahue