Report on Piton de la Fournaise (France) — May 2001
Bulletin of the Global Volcanism Network, vol. 26, no. 5 (May 2001)
Managing Editor: Richard Wunderman.
Piton de la Fournaise (France) Eruptions during late March 2001 and on 11 June 2001
Please cite this report as:
Global Volcanism Program, 2001. Report on Piton de la Fournaise (France) (Wunderman, R., ed.). Bulletin of the Global Volcanism Network, 26:5. Smithsonian Institution. https://doi.org/10.5479/si.GVP.BGVN200105-233020
Piton de la Fournaise
France
21.244°S, 55.708°E; summit elev. 2632 m
All times are local (unless otherwise noted)
In 1998, after 5.5 years of calm, Piton de la Fournaise erupted twice. Two eruptions occurred in 1999, while in 2000, three eruptions took place (BGVN 25:12). Only 4.5 months after the last eruption in October 2000, Piton de la Fournaise erupted once more on 27 March 2001 at 1320. As described below, precursor extensometer and tiltmeter measurements, in conjunction with historical data, provided an accurate forecast of an eruption sometime near the end of March. The March eruption was followed by another at 1350 on 11 June.
Geodetic measurements. After 1 January 2001, the Château Fort extensometer showed a significant, regular increase (figure 61), and, beginning 21 January, the Magne extensometer showed the same tendency. Plots of the measurements from these two stations show remarkably constant slopes of 0.0038 mm/day at Château Fort and 0.005 mm/day at Magne. In 1999 and 2000, such variations were observed 2-3 months before the eruptions of 19 July 1999, 23 June 2000, and 23 October 2000 on the E and SE flanks of the volcano. Using these historical data and the fact that the maximal variation of spread for all these eruptions was 0.25 to 0.35 mm for the Château Fort station and 0.3 to 0.5 mm for the Magne station, extrapolations of the deformation were used to forecast a late March eruption.
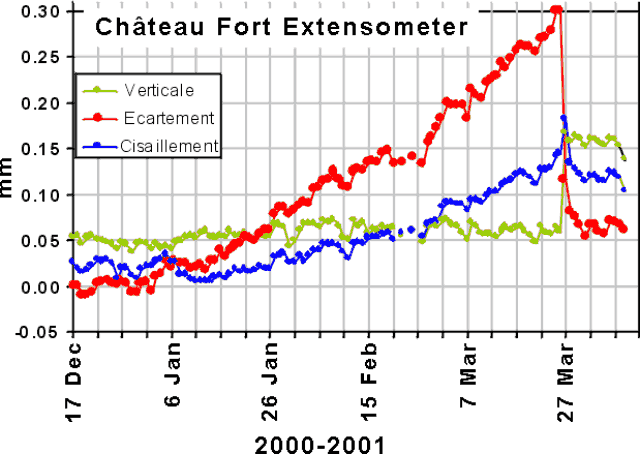 |
Figure 61. Extensometer measurements from the Château Fort station at Piton de la Fournaise during mid-December 2000-early April 2001. Courtesy of T. Staudacher, OVPF. |
Almost simultaneous with the extensometer-measured tilt increases, important variations were registered by the Dolomieu Sud and La Soufrière tiltmeters. The Dolomieu Sud radial tiltmeter measurements increased considerably after 6 January 2001 compared to those for the previous two years; similar variations were observed before the 12 October 2000 and 28 September 1999 eruptions (figure 62). The measured increase of ~110 µrad of radial tilt as observed at Dolomieu Sud between January and March 2001 could not be explained by temperature changes. Rather, it indicated a significant inflation of the summit prior to the eruption.
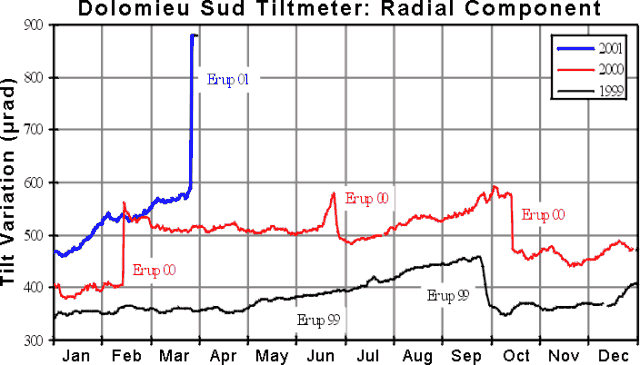 |
Figure 62. Tilt variation from the Dolomieu Sud station at Piton de la Fournaise compared between 1999, 2000, and 2001. Courtesy of T. Staudacher, OVPF. |
Seismicity. Intense seismicity on Piton de la Fournaise increased early in 2001. During 20 January-10 February, 133 tremors were registered (generally M < 0.5). Then, after 13 days of calm, a new series of tremors began on 25 February that included 315 events. These events were weak (M < 1.5), but increased in intensity with respect to the events earlier in the year. On 3 March, 40 summit tremors occurred within one hour, and a total of 126 tremors were observed that day. All of these tremors took place beneath the Dolomieu crater at ~0.5 km below sea level.
The number of tremors increased again starting on 12 March and continuing until the eruption on 27 March. Tremor hypocenters measured on 23 March occurred 1.5 km below sea level, but rose the next day to 0.5 km below sea level. Seismometers recorded 145 tremors on 25 March. Tremor intensity increased gradually during the period with numerous events of M 1.0-1.9. In addition, precursory seismicity and deformation measurements were correlated as shown in figure 63. Figure 63 indicates that, in January, summit inflation preceded the first period of seismicity by about 10 days, while the second increase in inflation, which began on 24 January, occurred simultaneously with the second period of strong seismicity. The latter continued essentially until the eruption. On 27 March, 120 tremors were detected, including one at 1255 of M 2.0. At 1320, an eruption began on the SE flank. Tremor that began with the eruption on 27 March diminished regularly until 2 April; after eight days of activity, the eruption ended on 4 April at about 0700.
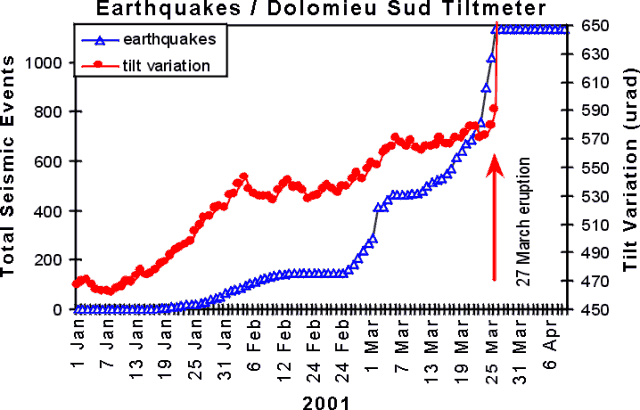 |
Figure 63. Total number of earthquakes at Piton de la Fournaise compared with tilt variation during 1 January - mid-April 2001. Note that the total number of earthquakes exceeds the scale of the figure during and after the 27 March eruption. Courtesy of T. Staudacher, OVPF. |
Ground observations. Ground observations were undertaken several hours after the eruption began. Five major fissures were active; their exact positions were determined later using GPS measurements. The first fissure, ~250 m long, began 100 m below the edge of Dolomieu Sud while the last ended between Piton Morgabim and the Signal de L'Enclos. The general trend of the fissures was ESE.
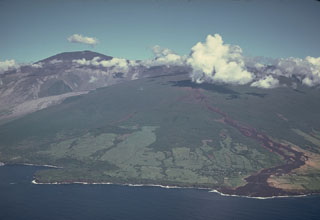
Three significant aa flows were observed. The first was fed by the highest fissure and descended along the S flank ending at about 1,800 m elevation. A second flow, which began at a lower altitude, wound around the Piton Morgabim toward the S and along the path of the previous flows from the June and October 2000 eruptions. The most significant flow was fed by the lowest fissure, which went N along the path of the June and October 2000 flows and came down the Grandes Pentes. By 27 March at 1700, this flow reached an elevation of 700 m, descending to 500 m on 28 March and continuing down to 350 m elevation on 29 March. These fissures were active for only several hours, and on 28 March the eruption became concentrated on the last fissure where the cone Piton Tourkal formed during the next few days. The cone was located midway between the Signal de l'Enclos and the Piton Morgabim (figure 64).
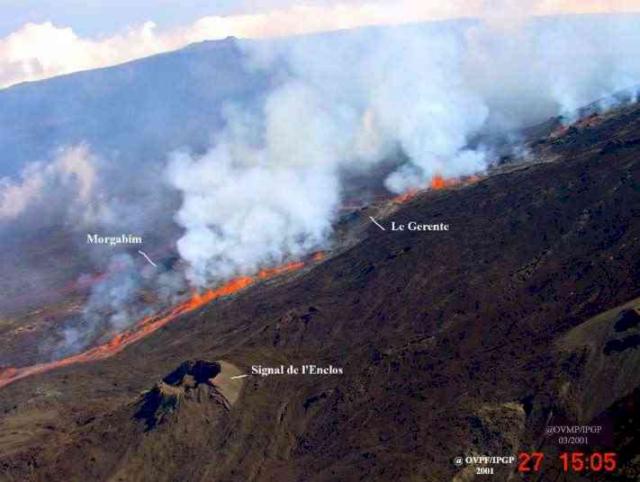 |
Figure 64. Photograph showing lava flows and the future location of the soon-to-be-formed Piton Tourkal cone, between the Signal de l'Enclos (bottom left) and the Piton Morgabim (middle left). Courtesy of T. Staudacher, OVPF. |
Between 27 March and 3 April, a total of nine samples were gathered for chemical analysis. On 3 April, the lava temperature was measured to be 1,150°C. No significant variation in the rates of radon emission was measured during 27 March - 3 April.
Continuous extensometer and tiltmeter variations occurred, and increased seismic activity was recorded beginning in late May. A short seismic crisis with 126 recorded events started on 11 June at 1327 and, at 1350, extensometer variations indicated that a new eruption had started on the SE flank in the same area as the 27 March eruption. En echelon fissures formed on the S flank at ~2,500 m elevation, 200 m below the Dolomieu summit crater. More fissures were located between 2,000 and 1,800 m elevation on the E flank at the southern base of crater Signal de l'Enclos and N of the Ducrot crater. Several lava flows descended the Grand Brûlé but progressed very slowly; at 1700 the front of the lava flow reached an elevation of 1,450 m. On the morning of 12 June, only the lower fissure at 1,800 m elevation was still active. It measured ~200 m long, with several lava fountains that sent material 20-30 m high. The lava flow followed the N border of the 27 March lava flow and reached about 400 m elevation on the Grand Brûlé.
Geological Summary. Piton de la Fournaise is a massive basaltic shield volcano on the French island of Réunion in the western Indian Ocean. Much of its more than 530,000-year history overlapped with eruptions of the deeply dissected Piton des Neiges shield volcano to the NW. Three scarps formed at about 250,000, 65,000, and less than 5,000 years ago by progressive eastward slumping, leaving caldera-sized embayments open to the E and SE. Numerous pyroclastic cones are present on the floor of the scarps and their outer flanks. Most recorded eruptions have originated from the summit and flanks of Dolomieu, a 400-m-high lava shield that has grown within the youngest scarp, which is about 9 km wide and about 13 km from the western wall to the ocean on the E side. More than 150 eruptions, most of which have produced fluid basaltic lava flows, have occurred since the 17th century. Only six eruptions, in 1708, 1774, 1776, 1800, 1977, and 1986, have originated from fissures outside the scarps.
Information Contacts: Thomas Staudacher and Jean Louis Cheminée, Observatoire Volcanologique du Piton de la Fournaise, Institut de Physique du Globe de Paris, Institut National des Sciences de l'Univers, 14 RN3 - Km 27, 97418 La Plaine des Cafres, Réunion, France (URL: http://www.ipgp.fr/fr/ovpf/observatoire-volcanologique-piton-de-fournaise).