Report on Merapi (Indonesia) — June 2006
Bulletin of the Global Volcanism Network, vol. 31, no. 6 (June 2006)
Managing Editor: Richard Wunderman.
Merapi (Indonesia) Fewer pyroclastic flows during July; ASTER thermal data
Please cite this report as:
Global Volcanism Program, 2006. Report on Merapi (Indonesia) (Wunderman, R., ed.). Bulletin of the Global Volcanism Network, 31:6. Smithsonian Institution. https://doi.org/10.5479/si.GVP.BGVN200606-263250
Merapi
Indonesia
7.54°S, 110.446°E; summit elev. 2910 m
All times are local (unless otherwise noted)
During mid-March through July 2006, scientists at Merapi noted variations in seismicity, the number and size of explosions, and the abundance of pyroclastic flows and incandescent rockfalls. This led to changes in Alert Levels and, during April and May, thousands of evacuations. The source of in-situ information for this report was Merapi Volcano Observatory and the Center of Volcanology and Geological Hazard Mitigation (CVGHM; formerly VSI, the Volcanological Survey of Indonesia, and still informally referred to in that way). Satellite images collected by the Advanced Spaceborne Thermal Infrared and Reflection Radiometer (ASTER) complemented the ground observations.
Although events of 28 April to 22 June 2006 were previously discussed in more detail (BGVN 31:05), they are presented here in the context of ASTER and summaries of CVGHM field reports. CVGHM observations from 28 June to 25 July revealed an interval of limited significant rockfalls, sparse pyroclastic flows (only one was reported, to 3 km runout distance), and modest gas plumes.
Activity during 28 April to 22 June 2006. About eight images from 28 April to 22 June were collected over Merapi by the ASTER satellite and processed by Michael Ramsey. Temperatures over the lava dome and flanks were extracted from daytime and nighttime images; in some cases the contents of plumes were assessed. The temperature and distribution of thermal anomalies were consistently in agreement with ground observations from CVGHM.
ASTER consists of three instrument sub-systems covering fourteen bands over three wavelength regions with various spatial (pixel) resolutions. Three visible and near-infrared (VNIR) bands cover 0.52-0.86 ?m at 15 m spatial resolution. Six short-wavelength infrared (SWIR) bands cover 1.60-2.45 ?m at 30 m resolution. Five thermal infrared (TIR) bands cover 8.125-11.65 ?m at 90 m resolution.
A temperature data point from a pixel is the average temperature for that 30 x 30 m (SWIR) or 90 x 90 m (TIR) pixel area. Temperature data are extracted from the TIR region, unless the pixels are saturated (temperatures greater than 100°C over the 90 m pixel). In those cases, temperatures are extracted from SWIR images. Cross-track pointing of the sensors ? 116 km from nadir allows for repeat times of less than sixteen days. For a target near the equator at a 24° pointing angle, repeat times can average four days. During the Merapi crisis, investigators tasked the satellite to collect more frequent images.
A nighttime TIR image from 28 April showed a weak thermal anomaly over the summit. Approximately 8 pixels were thermally elevated above background, to a maximum temperature of ~ 25.9°C. Further processing of the emissivity spectra from the hottest pixels demonstrated that over 5% of the sub-pixel temperatures may be on the order of 100's of degrees C. SWIR data from the same time showed temperature of no more than ~ 200°C. One small anomaly was visible ~ 650 m SW from the summit. CVGHM reported that volcanic material traveled ~ 1.5 km SW towards the Lamat River on 28 April.
On 12 May, a daytime SWIR image demonstrated increased activity with a larger thermal anomaly than the 28 April image and a pixel average maximum temperature of 213°C. Emissivity spectra collected in the TIR region corroborated the temperature data in the SWIR region. On 11 May, CVGHM reported a sharp increase in eruptive activity and on 13 May, raised the Alert Level from 3 to 4 (the highest level). As noted in BGVN (31:05), about 4,500 people living near the volcano were evacuated.
A significant thermal anomaly was present in the 14 May TIR and SWIR nighttime images. Three pixels in the SWIR region had a maximum average pixel temperature of 442°C. An area of elevated temperature to the SW was interpreted as a pyroclastic flow. On 15 May, CVGHM reported that pyroclastic flows had traveled as far as 4 km W.
A clear nighttime SWIR image acquired on 30 May showed a maximum derived temperature of 447°C and 11 pixels with temperatures greater than 400°C. Two zones of thermally elevated pixels were evident about 600 m SE of the dome and 2 km SW of the summit. Consistent with the imagery, CVGHM reported that during 28-30 May, multiple pyroclastic flows reached a maximum of 3 km SE toward the Gendol River and 4 km SW toward the Krasak and Boyong Rivers.
On 6 June, daytime VNIR, nighttime SWIR, and TIR images were collected. The daytime image shows a large ash-rich plume extending SW over 40 km from the summit (figure 26). Preliminary analysis of the plume by Vince Realmuto (using a decorrelation stretch of the daytime TIR data) indicated a mixture of ash and steam, and low SO2 content. Thermal anomalies over the summit and on the flanks (outlined in white), interpreted as possible pyroclastic flows, extended~ 3 km SE and SW, and ~ 1 km NW. SWIR temperature data showed a maximum average pixel temperature of 420°C and two summit pixels over 400°C. According to CVGHM, on 6 June lava avalanches and two pyroclastic flows reached ~ 2 km SE and lava avalanches traveled 2 km SW.
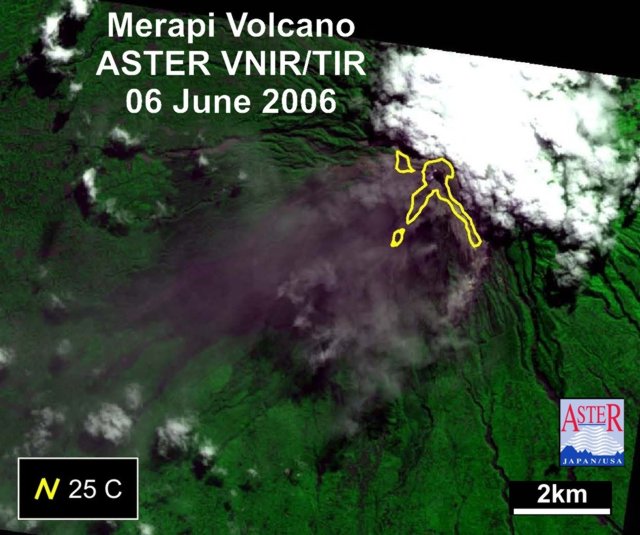 |
Figure 26. Composite ASTER image of Merapi acquired on 6 June 2006. A large ash-rich plume drifting over 40 km SW of the summit is evident in this visible near-infrared ASTER image (15 m pixel size) taken during daylight hours. Temperature data from a nighttime thermal infra-red image acquired 12 hours later is superimposed on the image as contour lines. Those on and around the summit represent the minimum extent of elevated temperatures (~ 25°C) from hot material such as pyroclastic flows. Courtesy Michael Ramsey, University of Pittsburgh. |
A thermal anomaly, interpreted as cooling pyroclastic flows, that extended ~ 6.4 km S of the summit region was evident on a TIR and SWIR image set acquired on 22 June. The SWIR data showed two pixels greater than 425°C over the summit similar to the 6 June data. Based on interpretation of seismic data, CVGHM reported almost daily occurrences of rockfalls and pyroclastic flows during 21-25 June. Visual observations were mostly inhibited by cloud cover.
Activity during 28 June-25 July 2006. Pyroclastic flows and rockfalls decreased in frequency and intensity during 28 June-4 July. Pyroclastic flows were observed during 28-30 June and reached a maximum distance of 3 km SE along the Gendol River. Gas plumes were observed during 28 June-1 July and reached a maximum height of 1 km above the summit (~ 4 km altitude) on 28 June.
During 5-11 July, gas plumes reached a maximum height of 1.2 km above the summit on 6 July. Due to a decrease in activity, on 10 July the Alert Level was lowered one level to 3 in all areas except the S slope.
Incandescent material reached a maximum distance of 2 km SE along the Gendol River from 12 to 18 July. Gas plumes were also observed daily and reached heights of 1 km above the crater (~ 4 km altitude) On 17 July, CVGHM lowered the Alert Level to 3 for the S slope. During 19-25 July, gas plumes reached maximum heights of 400 m above the summit (~ 3.3 km altitude). Flows of incandescent material were observed daily, advancing at a maximum distance of 1.5 km SE toward the Gendol River. Pyroclastic flows were not observed during 12-25 July.
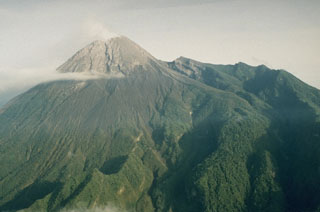
Geological Summary. Merapi, one of Indonesia's most active volcanoes, lies in one of the world's most densely populated areas and dominates the landscape immediately north of the major city of Yogyakarta. It is the youngest and southernmost of a volcanic chain extending NNW to Ungaran volcano. Growth of Old Merapi during the Pleistocene ended with major edifice collapse perhaps about 2,000 years ago, leaving a large arcuate scarp cutting the eroded older Batulawang volcano. Subsequent growth of the steep-sided Young Merapi edifice, its upper part unvegetated due to frequent activity, began SW of the earlier collapse scarp. Pyroclastic flows and lahars accompanying growth and collapse of the steep-sided active summit lava dome have devastated cultivated lands on the western-to-southern flanks and caused many fatalities.
Information Contacts: Center of Volcanology and Geological Hazard Mitigation (CVGHM), Jalan Diponegoro 57, Bandung 40122, Indonesia (URL: http://www.vsi.esdm.go.id/); Michael Ramsey and the Image Visualization and Infrared Spectroscopy (IVIS) laboratory, University of Pittsburgh, 200 SRCC Building, Pittsburgh, PA 15260, USA (URL: http://ivis.eps.pitt.edu/); Vince Realmuto, Jet Propulsion Laboratory, Mail Stop 168-514, 4800 Oak Grove Drive, Pasadena, CA 91109, USA; Advanced Spaceborne Thermal Infrared and Reflection Radiometer satellite (URL: http://asterweb.jpl.nasa.gov/).