Report on Nyamulagira (DR Congo) — March 2007
Bulletin of the Global Volcanism Network, vol. 32, no. 3 (March 2007)
Managing Editor: Richard Wunderman.
Nyamulagira (DR Congo) November 2006 eruption produces extensive lava flows
Please cite this report as:
Global Volcanism Program, 2007. Report on Nyamulagira (DR Congo) (Wunderman, R., ed.). Bulletin of the Global Volcanism Network, 32:3. Smithsonian Institution. https://doi.org/10.5479/si.GVP.BGVN200703-223020
Nyamulagira
DR Congo
1.408°S, 29.2°E; summit elev. 3058 m
All times are local (unless otherwise noted)
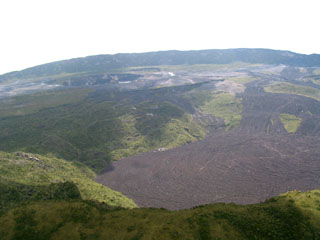
Nyamuragira last began erupting on 27 November 2006 (BGVN 32:01). Figure 28 shows lava flows from the November eruption based on available observations as of 2 December 2006. The flows were on the outer SE flank and covered extensive areas.
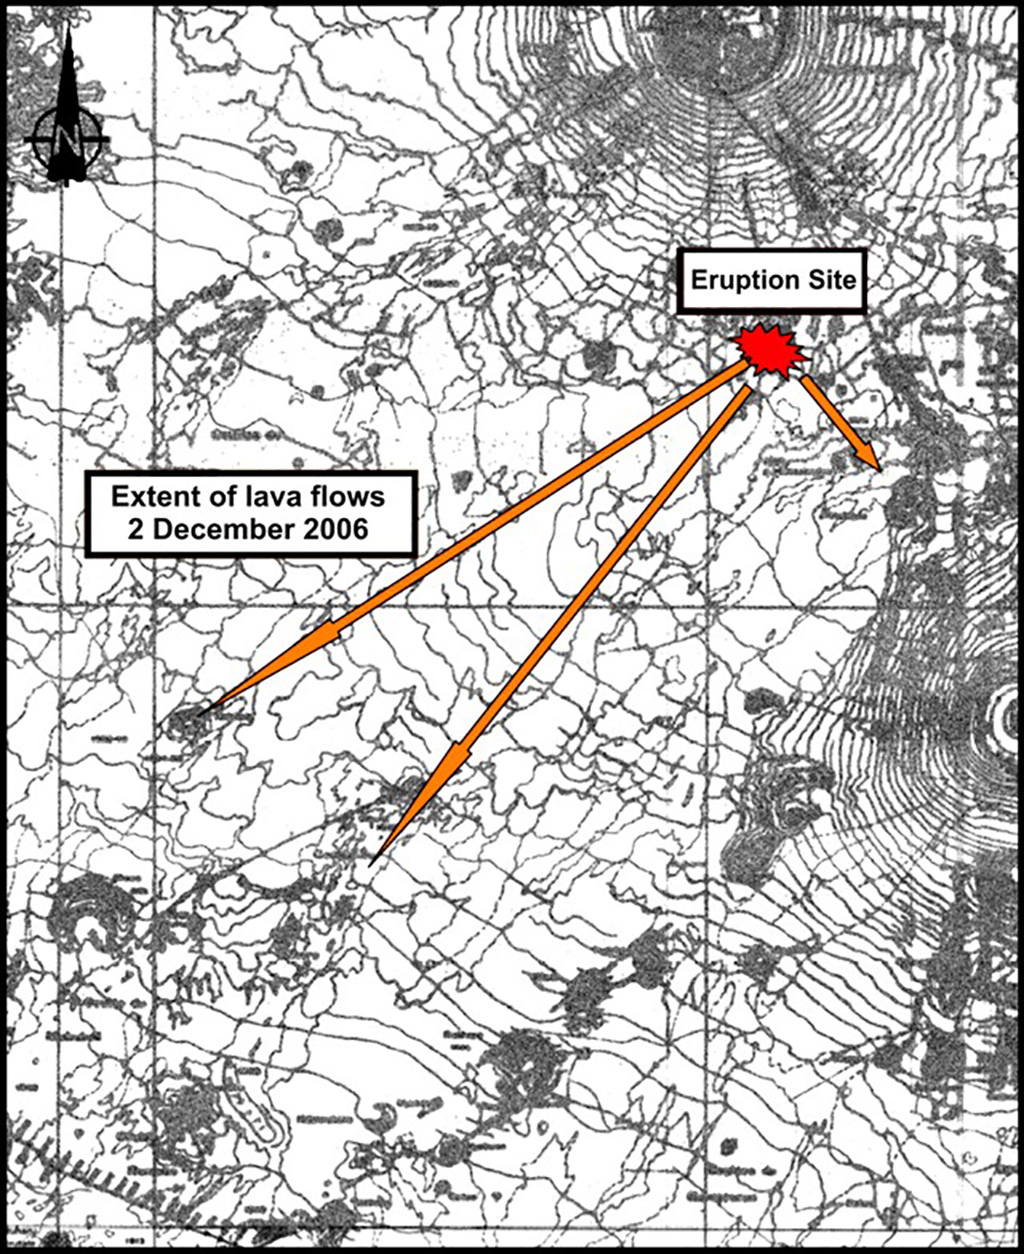 |
Figure 28. A preliminary sketch map made by the Goma Volcanological Observatory on 2 December 2006 showing lava flows from the eruption site of Nyamuragira during its November 2006 eruption. Nymuragira (top) is about 10 km from Nyiragongo (right). Courtesy of Jacques Durieux. |
This map gives only the broad context of the flows' locations and movements; more detailed mapping was curtailed by armed conflict and a lack of security in the region. The flows were also the source of thermal infrared emissions. A recent article by Tedesco and others (2007) included a geologic map of the region (see Nyiragongo report below).
MODVOLC Thermal Alerts. The description of the 2006 eruption in BGVN 32:01 did not report MODIS satellite thermal anomalies for this eruption as the measured anomalies all fell S of the Nyamuragira crater, covering much of the area between Nyamuragira and Nyiragongo. Further analysis of the University of Hawai'i Institute of Geophysics and Planetology (HIGP) MODIS Hotspot Alert website data revealed that most of a year's anomalies (mid-April 2006 to mid-April 2007) between the two volcanos were measured during the period mid-November to mid-December 2006, probably related to the eruption of Nyamuragira that began on 27 November 2006.
A compilation of MODIS thermal anomalies for 1 year, 19 April 2006-16 April 2007 (figure 29), shows both a typical concentration of nearly daily anomalies over Nyiragongo resulting from the lava lake within the volcano's main crater, and also a considerable number of anomalies between Nyiragongo and nearby Nyamuragira (albeit, none over the Nyamuragira crater). Figure 30 shows thermal anomalies measured by MODIS for three 1- month periods: 22 October-18 November 2006; 20 November-18 December 2006; and 20 December 2006-17 January 2007, and 4 December 2006. Most of the anomalies seen between Nyiragongo and Nyamuragira during the year occurred in the mid-November to mid-December 2006 time frame. An analysis of the chronological tabulation of anomaly pixels during this 30-day period showed a concentration from 27 November to 16 December. Typical monthly patterns of thermal anomalies show a concentration over the Nyiragongo crater lava lake.
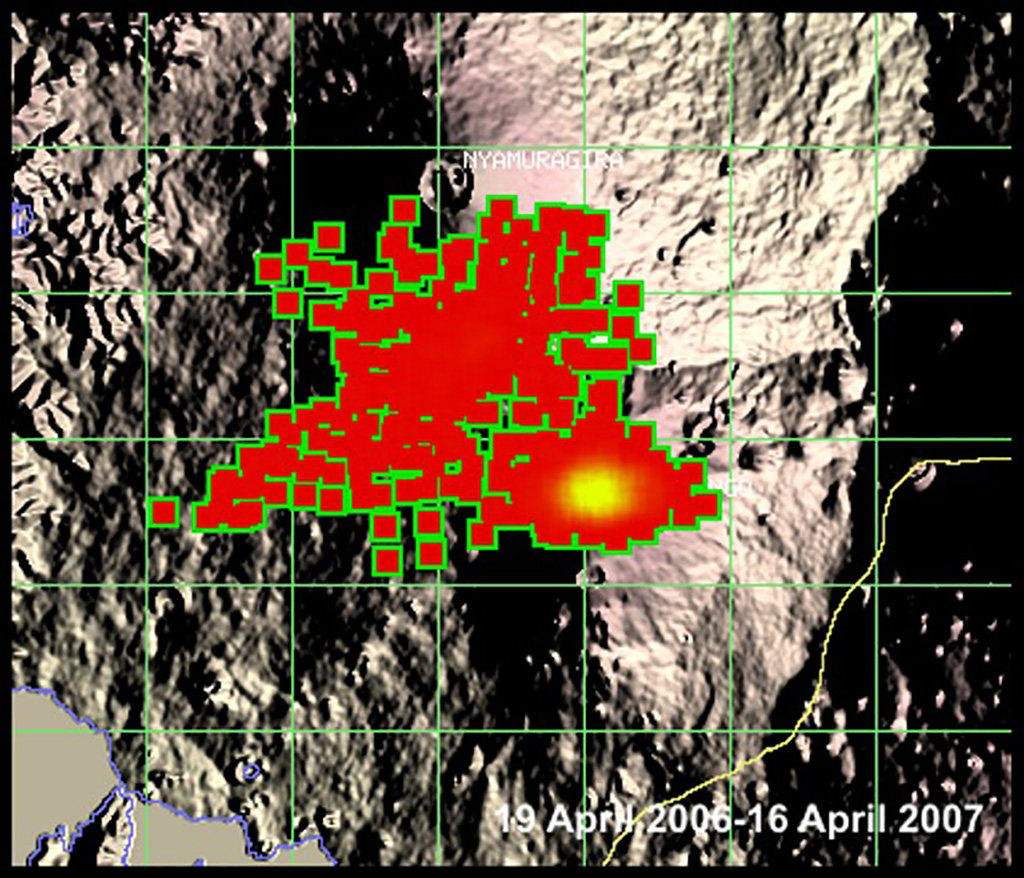 |
Figure 29. Map showing MODIS/MODVOLC thermal anomalies in the region of Nyiragongo and Nyamuragira measured during 1 year, from 19 April 2006 to 16 April 2007. Courtesy of HIGP MODIS Hotspot Alert System. |
Anomalies measured on 4 December 2006 (figure 30) appeared along a line nearly perpendicular to a line between the volcanos and about equidistant to the two volcanoes. Rob Wright reported that this linear anomaly corresponded to an extensive lava flow. It was seen for several days prior to and after 4 December in the same region between Nyiragongo and Nyamuragira.
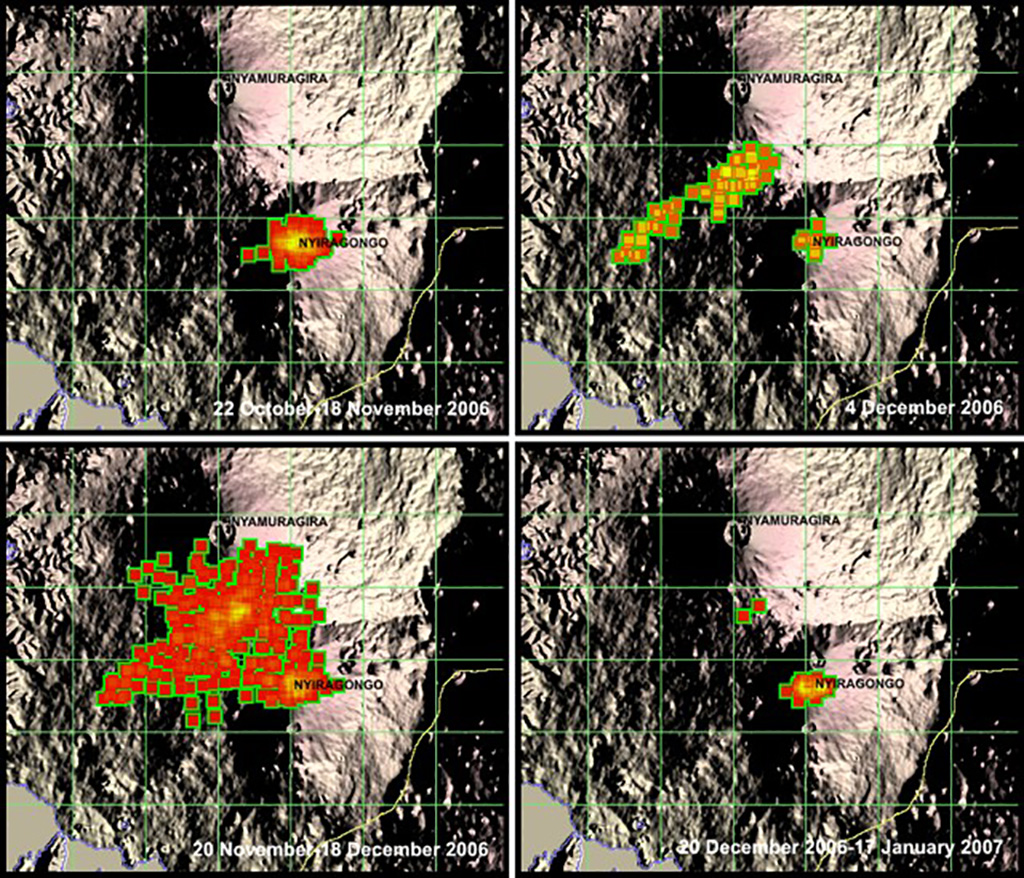 |
Figure 30. Map showing MODIS/MODVOLC thermal anomalies in the region of Nyiragongo and Nyamuragira measured during selected intervals between 22 October 2006 and 17 January 2007. Courtesy of HIGP MODIS Hotspot Alert System. |
Wright noted that if one looks at the position and orientation of the pattern of thermal anomaly pixels, it seems to vary over the period. This variation could result from a combination of factors, including: (1) clouds?an apparent shape/ orientation of the anomaly can be induced by the fact that some portions of the flow-field may have been obscured at the moment of image acquisition; (2) sensor zenith angle?the data for 4 December 2006 were acquired when the satellite was within 1 to 16° of being directly overhead, whereas on other days (i.e. 1 December 2006) the lava flow field was at the edge of the image swath (i.e. at an angle of about 60°); at these extreme scan angles the pixel geolocation becomes less accurate (and the pixels increase in size, to about 2 by 4 km).
References. Tedesco, D., Badiali, L., Boschi, E., Papale, P., Tassi, F., Vaselli, O., Kasereka, C., Durieux, J., Denatale, G., Amato, A., Cattaneo, M., Ciraba, H., Chirico, G., Delladio, A., Demartin, M., Favalli, G., Franceschi, D., Lauciani, V., Mavonga, G., onachesi, G., Pagliuca, N.M., Sorrentino, D., and Yalire, M., 2007, Cooperation on Congo Volcanic and Environmental Risks, EOS, Transactions, American Geophysical Union, v. 88, no. 16, p. 177, 181.
Geological Summary. Africa's most active volcano, Nyamulagira (also known as Nyamuragira), is a massive high-potassium basaltic shield about 25 km N of Lake Kivu and 13 km NNW of the steep-sided Nyiragongo volcano. The summit is truncated by a small 2 x 2.3 km caldera that has walls up to about 100 m high. Documented eruptions have occurred within the summit caldera, as well as from the numerous flank fissures and cinder cones. A lava lake in the summit crater, active since at least 1921, drained in 1938, at the time of a major flank eruption. Recent lava flows extend down the flanks more than 30 km from the summit as far as Lake Kivu; extensive lava flows from this volcano have covered 1,500 km2 of the western branch of the East African Rift.
Information Contacts: Jacques Durieux, United Nations Office for Project Services, Unite de Gestion des Risques Volcaniques, Observatoire Volcanologique de Goma; Hawai'i Institute of Geophysics and Planetology, MODIS Thermal Alert System, School of Ocean and Earth Sciences and Technology (SOEST), University of Hawai'i, 2525 Correa Road, Honolulu, HI, USA (URL: http://modis.higp.hawaii.edu/); Rob Wright, Hawaii Institute of Geophysics and Planetology, University of Hawaii, 1680 East-West Road, Honolulu, HI 96822, USA (URL: http://modis.higp.hawaii.edu/).