Report on Nyamulagira (DR Congo) — August 2010
Bulletin of the Global Volcanism Network, vol. 35, no. 8 (August 2010)
Managing Editor: Richard Wunderman.
Edited by Jen Fela.
Nyamulagira (DR Congo) January 2010 flank eruption produces a new cone and 12-km-long lava flows
Please cite this report as:
Global Volcanism Program, 2010. Report on Nyamulagira (DR Congo) (Fela, J., and Wunderman, R., eds.). Bulletin of the Global Volcanism Network, 35:8. Smithsonian Institution. https://doi.org/10.5479/si.GVP.BGVN201008-223020
Nyamulagira
DR Congo
1.408°S, 29.2°E; summit elev. 3058 m
All times are local (unless otherwise noted)
A strong eruption at Nyamuragira (the volcano's name in the Kinyarwanda language, but "Nyamulagira" in other DR Congo languages) (figure 31) began on 2 January 2010, the first reported eruption since November 2006 (BGVN 32:03). It produced extensive lava flows on the outer SSE flank. According to seismic data from the Goma Volcano Observatory (GVO) monitoring network (figure 32), the eruption began on 2 January at 0217.
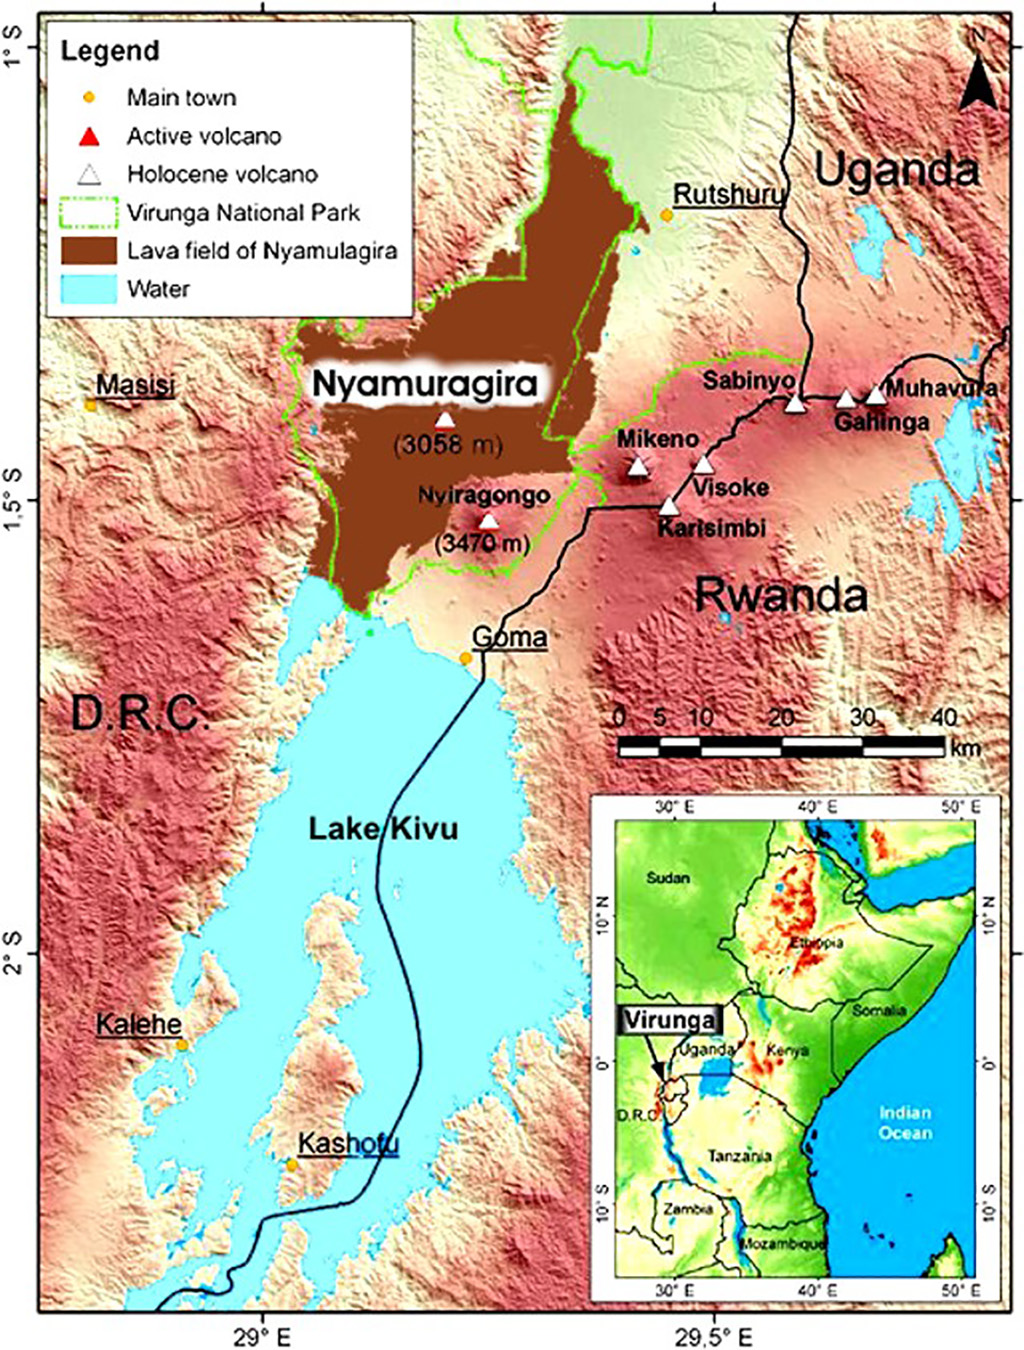 |
Figure 31. Shaded relief maps showing Nyamuragira in the context of the W limb of the East African rift. Labeled volcanoes here are part of the Virunga volcanic region. Courtesy of B. Smets, RMCA-NMNH. |
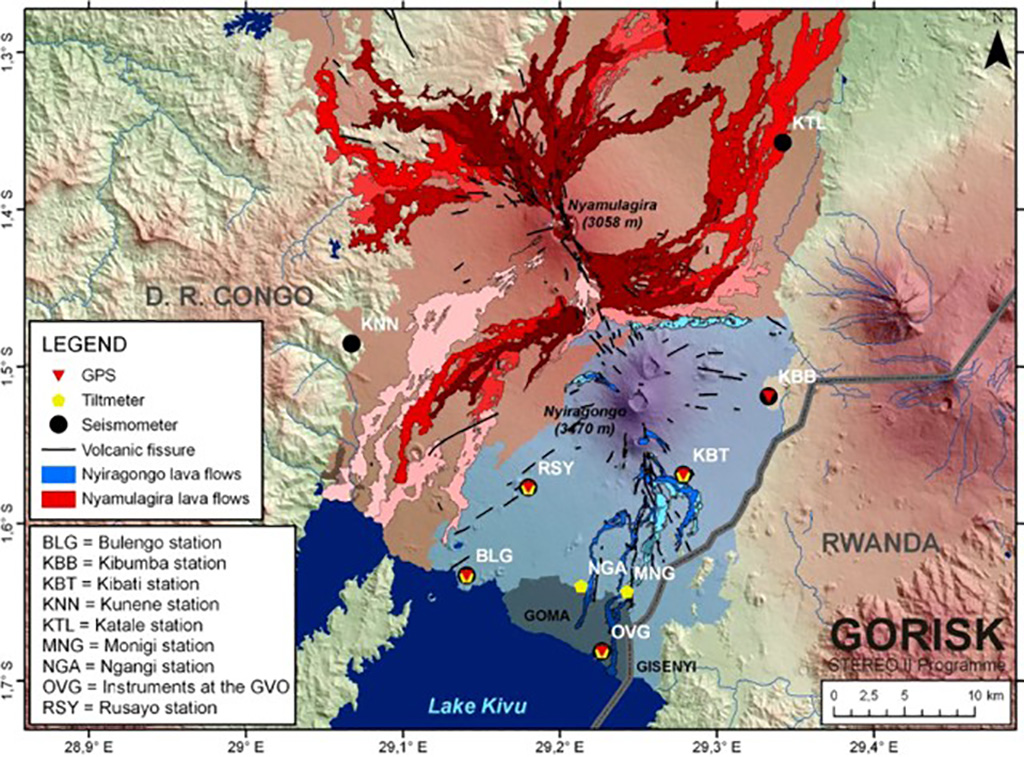 |
Figure 32. Map showing some of the seismic stations surrounding Nyamuragira and Nyiragongo. Courtesy B. Smets, GORISK. |
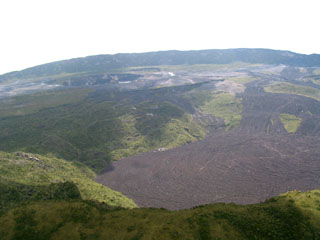
Benoît Smets, of the Royal Museum for Central Africa (RMCA-NMNH, Tervuren, Belgium), summarized the eruption as follows: "Lava erupted inside the main caldera from the pit crater (located in the NE part of the caldera) and along an ENE-WSW-trending fracture in the S part of the caldera. A 600-m-long fissure opened on the SSE flank of the main edifice, ~1.5 km from the caldera rim. The lava fountains from the flank fissure built a ~150-m-high spatter cone."
Lava flows emanated from the region of the cone and ultimately branched and extended over a large area with the most distal flow front over 10 km from the vent. Additional details, including photographs, are available on the GORISK website (see Information Contacts, below). According to Karume and others (2010) and Smets and others (2010c), the eruption lasted until 27 January 2010.
Thermal data. Data collected early in the eruption, on 4 January, led UNOSAT analysts to suggest that MODIS Aqua thermal anomalies were "likely to represent active fires and lava on the eastern edge of the main crater," which "extended approximately 12 km along the southern slope toward Lake Kivu."
According to MODVOLC data processing, thermal alerts were absent during the entire year 2009 and then were observed in the vicinity of Nyamuragira beginning on 2 January 2010. Large numbers of hotspots covered portions of the summit and areas mostly S on 4, 6-9, 18, 20, and 22 January, and occurred SE of the summit on 11, 13, 15-17, 19, 21, 23-27, 29, and 31 January. Few hotpots were visible SE of the summit on 1 and 2 February, though visual observations by helicopter confirmed that no more lava was emitted. Hotspots were not seen after that through at least 31 August. Clouds may have obscured the view at times.
Seismicity. Several long-period seismic swarms were recorded between the 2006 and 2010 eruptions. A period of particularly high seismic activity occurred during 6 months following a 5.9-magnitude earthquake in Bukavu (128 km SSW) on 3 February 2008. However, there was no noticeable increase in seismic activity in the months preceding the January 2010 eruption. According to Tedesco (2010), both tectonic earthquake (fracturing) and volcanic tremors (magma degassing) occurred simultaneously with the appearance of lava at the surface (figure 33). This observation suggested to Tedesco (2010) that magma was already close to the surface before the eruption.
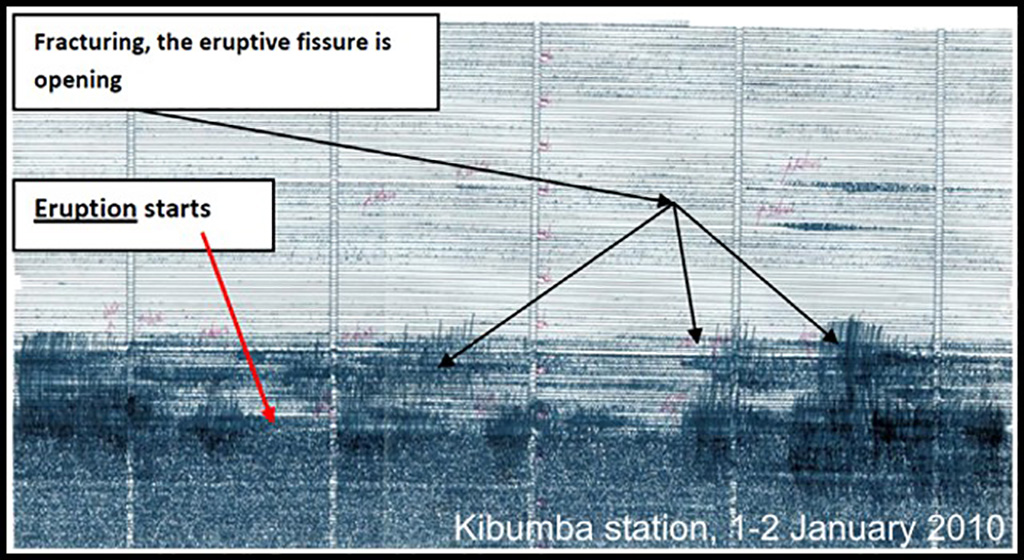 |
Figure 33. Seismogram recorded at Kibumba seismic station (~18 km SE) on 1-2 January 2010 (exact times undisclosed; regular tic marks are 1 minute apart). Seismic records at this and other GVO stations showed fracturing and inferred opening of eruptive fissures 30-60 minutes before the eruption started. Notice the comparatively quiet record before the swarm of pre-eruptive earthquakes. From Tedesco (2010). |
Initial reports of January 2010 eruption. Agence France-Presse and CNN reported that park rangers heard a loud explosion in the early morning of 2 January before seeing lava flowing from a fissure on the SE flank. By 3 January, the lava flow had traveled 4.6 km, was 15 m wide, and had burned ~11 ha (hectares; 11 x 104 m2) of forest in the Virunga National Park. Agence France-Presse reported that ash fell in Goma (30 km S) on 7 January, and that by 8 January a 200-m-wide lava flow had advanced ~7 km. The BBC reported concerns that the lava flow could destroy habitat occupied by an endangered population of about 40 chimpanzees and other wildlife on the volcano's lower slopes. Congo's 200 critically endangered mountain gorillas were not in danger, as they live ~25 km E on the flanks of the Mikeno volcano (figure 31).
Ground observations. Daily observations were performed by the United Nations Organization Mission in the Democratic Republic of Congo (MONUC) helicopter, and continuous geodetic data were available from nearby GPS and tilt stations located around the city of Goma and Nyiragongo and Nyamuragira (figure 32). Observations were performed by members of the GVO, the United Nations Office for Project Services (UNOPS), the Royal Museum for Central Africa (Belgium), and the National Museum of Natural History of Luxembourg.
Ashfall occurred during the first week of the eruption and affected Goma and villages to the W and SW. During the following days, only a small amount of ash was in the plume. Observers noted damage to crops, including green beans, sweet potatoes, cassava and banana groves.
Lava fountains reached higher than 300 m during the first days of the eruption. Beginning on 11 January, this height began to decrease irregularly to 50-150 m high. The main flows were 10.5-11 km long, and covered portions of the flow from the 2006 eruption (Ushindi) (figure 34).
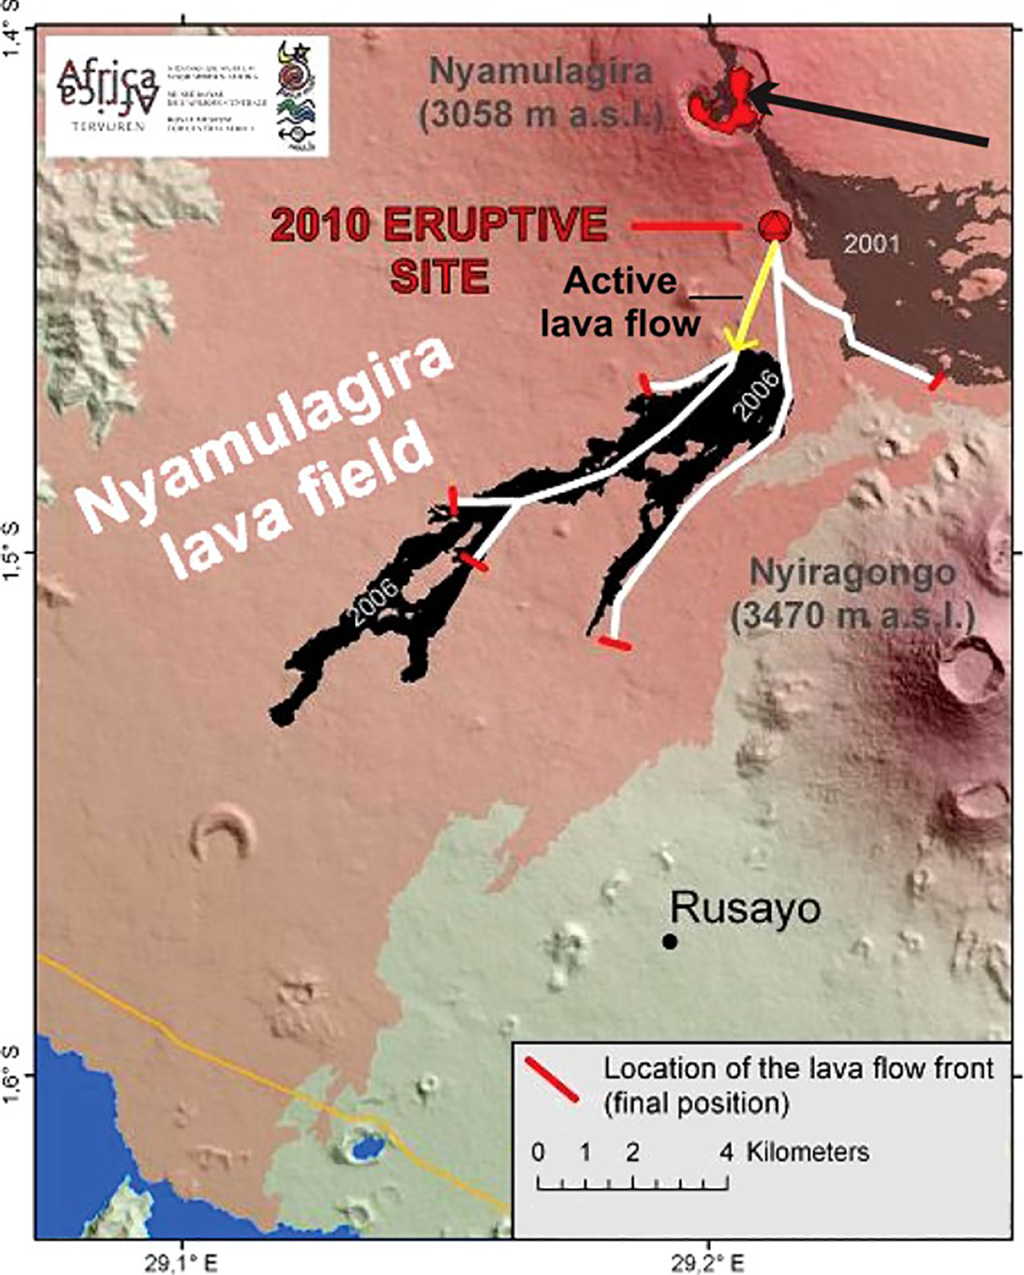 |
Figure 34. Path of lava flows at Nyamuragira as of 23 January 2010 (in white). Black arrow in the upper right corner points to lava and pyroclastic deposits from the beginning of the 2010 eruption that surround the caldera. The light arrowed line shows the active lava channel on 23 January; by this date, all the main flows (shown in white) had stopped and the active flow overlapped the others. Copyrighted image courtesy of RMCA-NMNH. |
Smets and others (2010b) estimated the area covered by erupted products using an ASTER thermal image and found it to be 17.65 ? 5.98 x 10⁶ m2 based on the spatial resolution of the image. They also estimated the lava volume at ~53 x 106 m3.At the lower end of this fissure eruption, a volcanic cone grew that was reported by GVO to have been named "Kahinga Kabarinzi" by local people, meaning "customary keeper's cone." GVO reported that the cone emerged 3.2 km SSE of the summit, just to the W of one that erupted in 2000 and practically at the same elevation (figure 35).
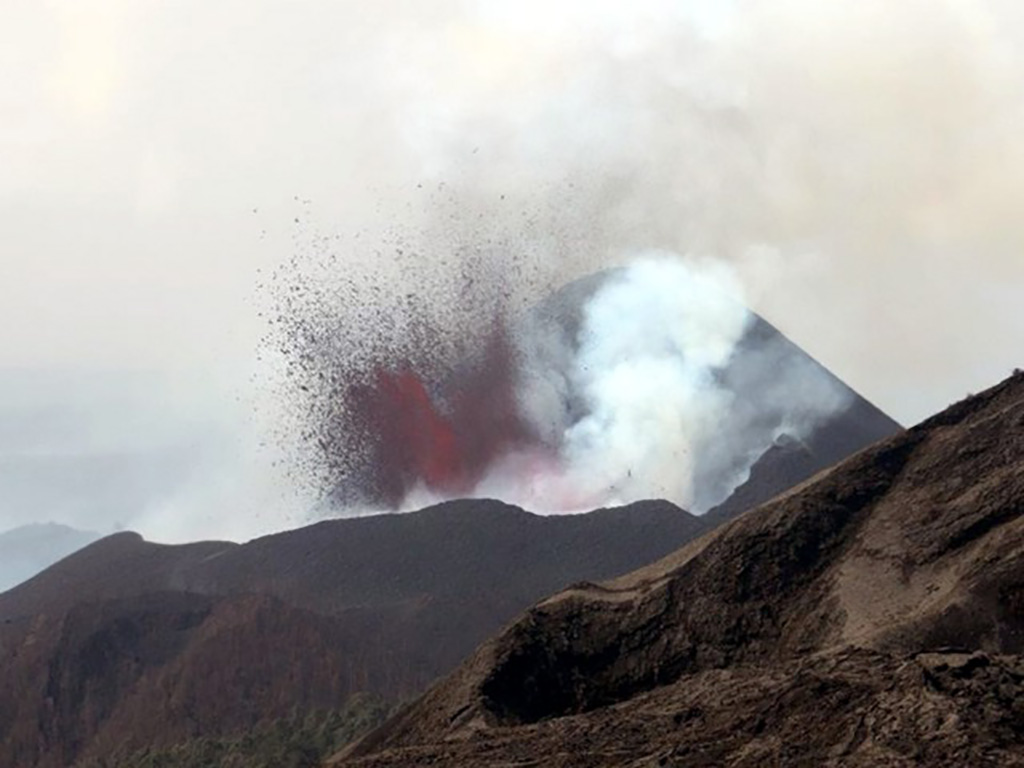 |
Figure 35. Lava fountain at Nyamuragira, observed from a helicopter looking towards the S or SSW on 15 January 2010. The new 2010 cone, estimated based on helicopter flights, GPS, and photographs to be ~150 m high, is visible behind the lava fountains. Copyrighted photo courtesy of B. Smets, RMCA-GORISK. |
Additional satellite imagery. SO2 aerosol data showing significant activity were first captured by the OMI and GOME-2 instruments on 2 and 3 January (figure 36). The Washington VAAC also reported a large sulfur dioxide plume in the vicinity during 10-11 January. The Toulouse VAAC reported that, on 18 January, sulfur dioxide-and-steam plumes from Nyamuragira possibly contained ash. An ash cloud was visible in satellite imagery the next day.
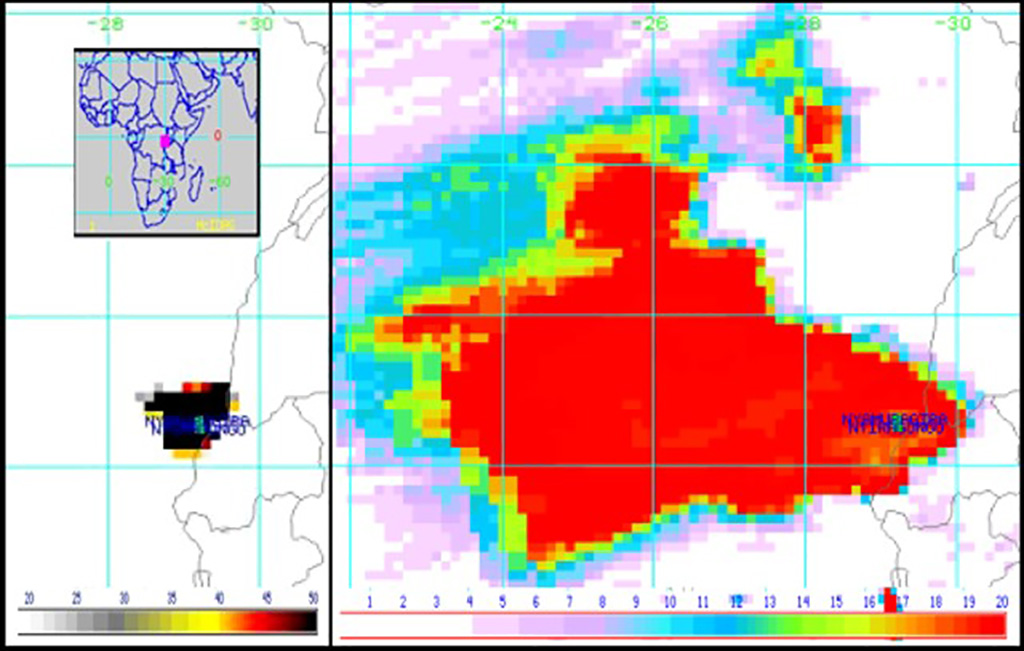 |
Figure 36. SO2 aerosol images captured by the OMI and GOME-2 instruments on 2 and 11 January (left and right, respectively). Image on left shows a small area of an extremely high path length of SO2 on the first day of the eruption; image on right shows broad area of SO2 at a reduced concentration nine days after the start of the eruption. Courtesy Gilberto A. Vicente, NOAA/NESDIS/OSDPD/SSD and Charles Holliday, U.S. Air Force Weather Agency. |
An ASTER image on 18 January showed that the eruption occurred on the SE rift zone and gave rise to two significant lava flows (figure 37), the longest of which extended 12 km. The active hot flows overlapped cooled flows emplaced at the beginning of the eruption. Multispectral capabilities of ASTER also allowed measurement of a massive emission of SO2 from the cone (figure 38). The eruption, although in a declining stage, was still releasing about 16,000 metric tons/day of SO2 that was transported W by the wind. Emissions during the first days of activity were probably an order of magnitude higher.
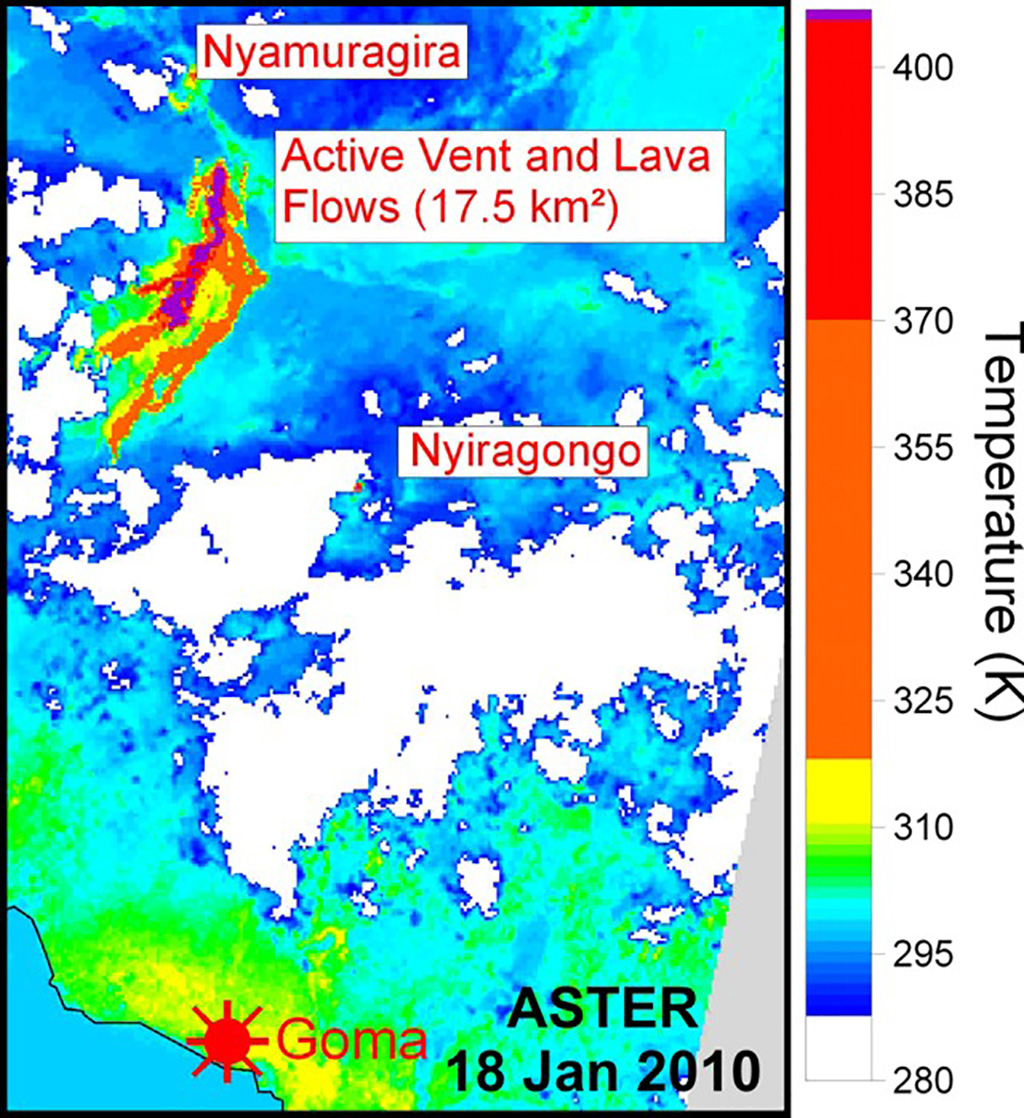 |
Figure 37. ASTER image from 18 January 2010 showing active vent and lava flows at Nyamuragira. Courtesy Robin Campion, Université Libre de Bruxelles (ULB), Belgium. |
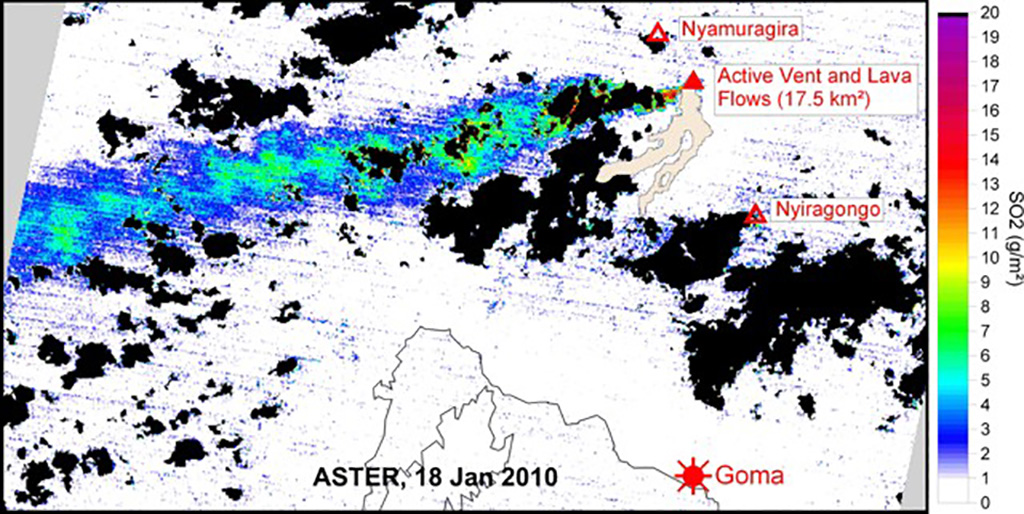 |
Figure 38. ASTER image from 18 January 2010 showing gas plume emitted from Nyamuragira. Courtesy Robin Campion, ULB. |
SAR interferometry. By comparing advanced synthetic aperture radar (ASAR) images acquired over the area before and after the eruption, analysts recognized lava flows in the summit caldera. The National Museum of Natural History of Luxembourg also used this technique, called SAR interferometry, or InSAR, to study the ground deformation during the eruption. These data helped to demonstrate that only Nyamuragira was erupting and dispelled rumors about possible activity at neighboring Nyiragongo.
Real-time monitoring. According to Karume and others (2010), the monitoring and fast response with spaceborne tools allowed the GVO to provide Goma regional authorities and the humanitarian community with daily hazard assessments for the first time.
Smets and others (2010a) reported that lava from the 1938-2010 eruptions cover ~40% (more than 430 km?) of the entire surface of the Nyamuragira lava-flow field (figures 31 and 39). The extent of the last century's lava flows also illustrates the hazard for the densely inhabited area along the NW shoreline of Lake Kivu; three lava flows have reached the lake within the last 100 years, and acid rains and pyroclastic falls have regularly affected crops and urban zones in this area.
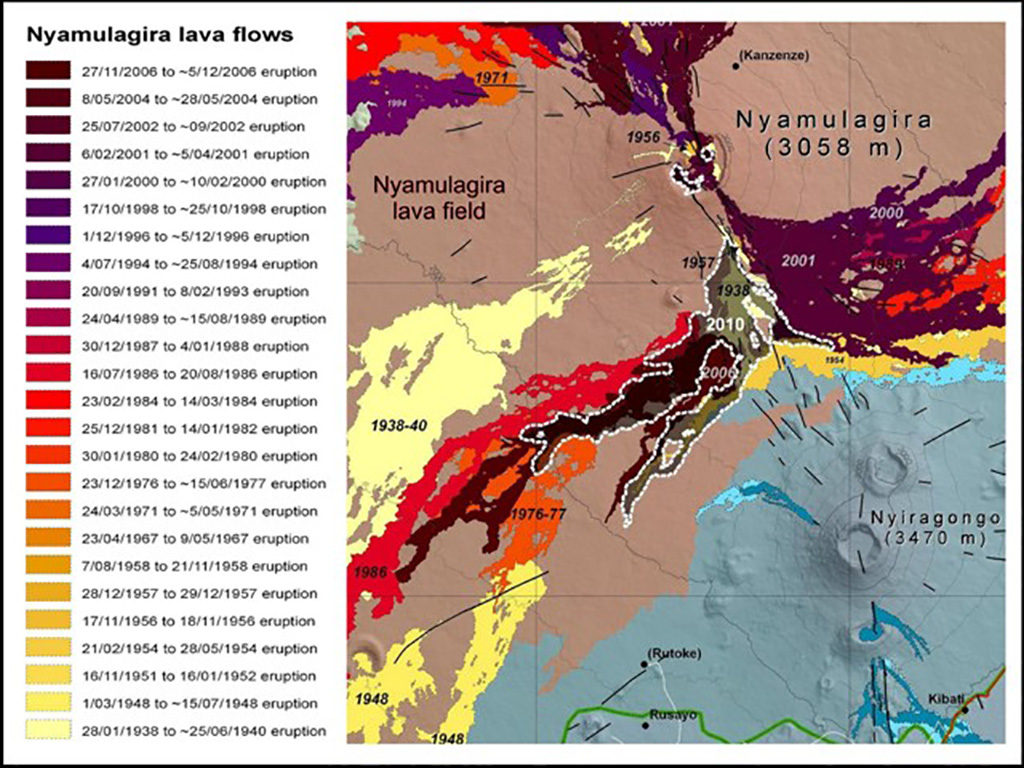 |
Figure 39. Map showing Nyamuragira lava flows from 1938-2010. Flows from the January 2010 eruption are visible in the caldera and on the SSE flank, outlined in a dotted white line. From Smets and others (2010d, in press). |
In a Nature News Feature, Nayar (2009) discusses Lake Kivu's dissolved gases, some of which are toxic, and others, such as methane, which are potentially valuable economically. As noted in previous reports about the East African Rift (eg. Lake Nyos, SEAN 10:08, 11:08, and 11:09, and BGVN 15:11), a significant disturbance such as a large lava flow entering the lake could destabilize the stratified waters, triggering release of toxic gases from greater depths.
References. Karume, K., Kavotha, D., Kervyn, F., Lukaya, F., D'Oreye, N., Rukeza, B., Smets, B., Tedesco, D., Wauthier, C., and GVO Team, 2010, Description of the January 2010 eruption of Nyamulagira (North Kivu, D.R. Congo): Presented at Cities on Volcanoes 6, Puerto de la Cruz, Tenerife, Canary Islands, Spain, May 31-June 4.
Nayar, A., 2009, A lakeful of trouble: Nature (News Feature), v. 460, p. 321-323 (16 July 2009), Macmillan Publishers Ltd.
Smets, B., Kervyn, M., and Kervyn, F., 2010a, Analysis of historical eruptive activity at Nyamulagira (North Kivu, D.R.C.): Implications for hazards: Presented at Cities on Volcanoes 6, Puerto de la Cruz, Tenerife, Canary Islands, Spain, May 31-June 4.
Smets, B., Wauthier, C., D'Oreye, N., 2010b (in press), A new map of the lava flow field of Nyamulagira (D.R. Congo) from satellite imagery: J. African Earth Sci.
Smets, B., Wauthier, C., D'Oreye, N., 2010c, The combined use of multispectral and radar satellite images to map the lava flow field of Nyamulagira (North Kivu, D.R.C.): Presented at Cities on Volcanoes 6, Puerto de la Cruz, Tenerife, Canary Islands, Spain, May 31-June 4.
Smets, B., Wauthier, C., D'Oreye, N., and van Overbeke, A.-C., 2010d (in press) Volcanological map of Nyamulagira?Virunga Volcanic Province, North Kivu, D.R.C. 1/100.000, Royal Museum for Central Africa: Tervuren, Belgium.
Tedesco, D., 2010, The January 2, 2010 eruption of Mt. Nyamulagira: Field observations, evolution and possible human and infrastructures impact: UNOPS report ? Prevention and Analysis of Volcanic Hazards in North Kivu, DRC, 8 p.
Geological Summary. Africa's most active volcano, Nyamulagira (also known as Nyamuragira), is a massive high-potassium basaltic shield about 25 km N of Lake Kivu and 13 km NNW of the steep-sided Nyiragongo volcano. The summit is truncated by a small 2 x 2.3 km caldera that has walls up to about 100 m high. Documented eruptions have occurred within the summit caldera, as well as from the numerous flank fissures and cinder cones. A lava lake in the summit crater, active since at least 1921, drained in 1938, at the time of a major flank eruption. Recent lava flows extend down the flanks more than 30 km from the summit as far as Lake Kivu; extensive lava flows from this volcano have covered 1,500 km2 of the western branch of the East African Rift.
Information Contacts: Katcho Karume and Kavotha Kalendi, Observatoire Volcanologique de Goma, Departement de Geophysique, Centre de Recherche en Sciences Naturelles, Lwiro, D.S. Bukavu, DR Congo; Benoît Smets, Royal Museum for Central Africa, Leuvensesteenweg 13, 3080 Tervuren, Belgium; Nicolas D'Oreye, National Museum for Natural History, 19 rue J. Welter, 7256 Walferdange, GD Luxembourg; Dario Tedesco, University of Napoli 2, Dipartimento di Scienze Ambientali, via Vivaldi 43, 81100 Caserta, Italy; GORISK Scientific Team, International scientific team for the study and monitoring of active volcanoes and their corresponding hazards in the Virunga Volcanic Province (URL: http://terra.ecgs.lu/rnvt/).
Hawai'i Institute of Geophysics and Planetology (HIGP) Thermal Alerts System, School of Ocean and Earth Science and Technology (SOEST), Univ. of Hawai'i, 2525 Correa Road, Honolulu, HI 96822, USA (URL: http://modis.higp.hawaii.edu/); UNOSAT/UNITAR, Palais des Nations CH-1211 Geneva 10, Switzerland (URL: https://unitar.org/unosat/); Toulouse Volcanic Ash Advisory Center, Météo-France, 42 Avenue Gaspard Coriolis, F-31057 Toulouse cedex, France (URL: http://www.meteo.fr/vaac/); Washington Volcanic Ash Advisory Center, Satellite Analysis Branch (SAB), NOAA/NESDIS E/SP23, NOAA Science Center Room 401, 5200 Auth Rd, Camp Springs, MD 20746, USA (URL: http://www.ospo.noaa.gov/Products/atmosphere/vaac/); Gilberto A. Vicente, NOAA/NESDIS/OSDPD/SSD - Product Implementation Branch, E/SP2, NOAA Science Center, Room 510, 5200 Auth Road, Camp Springs, MD 20746; NOAA Satellite and Information Service, National Environmental Satellite, Data, and Information Service, 1335 East-West Highway, SSMC1, 8th Floor Silver Spring, MD 20910, USA (URL: http://www.nesdis.noaa.gov/); NASA Goddard Space Flight Center, Code 974, Greenbelt, MD 20771, USA; NASA Jet Propulsion Laboratory, California Institute of Technology, 1200 East California Boulevard, Pasadena, California 91125, USA.
Robin Campion, Université Libre de Bruxelles, Belgium, Avenue Franklin Roosevelt 50; CP 160/02; 1050 Bruxelles, Belgium; Simon Carn, Michigan Technological Institute (MTU), 1400 Townsend Drive, Houghton, MI 49931, USA (URL: https://so2.gsfc.nasa.gov/); Charles Holliday, U.S. Air Force Weather Agency (AFWA)/XOGM, Offutt Air Force Base, NE 68113, USA; European Space Agency, 8/10 Rue Mario Nikis, 75015 Paris, France (URL: http://www.esa.int/esaCP/SEM6UYKOP4G_index_0.html); Belgian Federal Science Policy Office, Avenue Louise 231 Louizalaan, B-1050 Brussels, Belgium (URL: http://www.belspo.be/); National Research Fund of Luxembourg, 6, rue Antoine de Saint-Exupéry, B.P. 1777, 1017 Luxembourg, Luxembourg (URL: http://www.fnr.lu); Agence France-Presse (URL: http://www.afp.com); CNN (URL: http://www.cnn.com); BBC (URL: http://www.bbc.co.uk).